/
DEFLATING DEFLATIONARY FEARS Charles I DEFLATING DEFLATIONARY FEARS Charles I

DEFLATING DEFLATIONARY FEARS Charles I - PDF document

trish-goza
trish-goza . @trish-goza
Follow
393 views
Uploaded On 2015-05-26

DEFLATING DEFLATIONARY FEARS Charles I - PPT Presentation

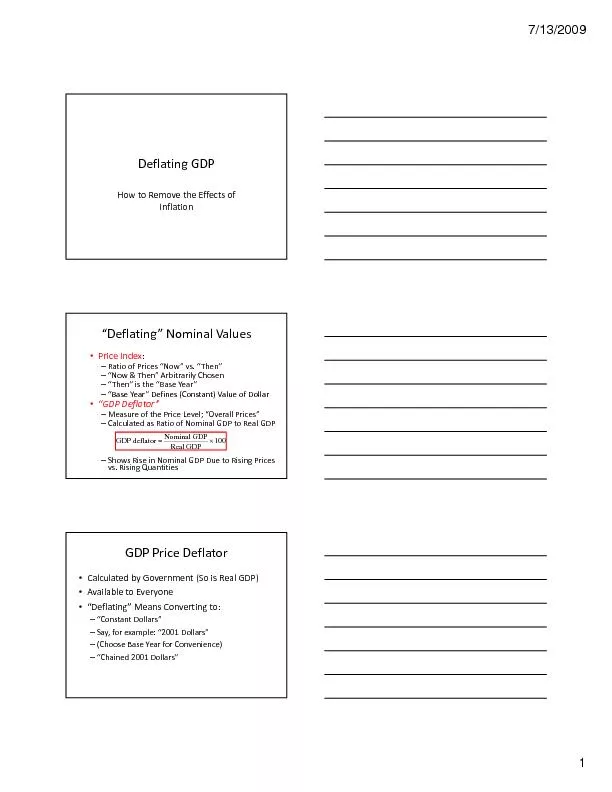
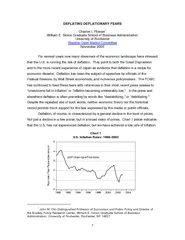
Plosser William E Simon Graduate School of Business Administration University of Rochester Shadow Open Market Committee November 2003 For several years now many obs ervers of the economic landscape have stress ed that the US is running the risk of d ID: 74762

Plosser William Simon

Share:

Link:

Embed:

Download Presentation from below link

Download Pdf The PPT/PDF document "DEFLATING DEFLATIONARY FEARS Charles I" is the property of its rightful owner. Permission is granted to download and print the materials on this web site for personal, non-commercial use only, and to display it on your personal computer provided you do not modify the materials and that you retain all copyright notices contained in the materials. By downloading content from our website, you accept the terms of this agreement.


Presentation Transcript

1 DEFLATING DEFLATIONARY FEARS Charles I. Plosser* William E. Simon Graduate School of Business Administration University of Rochester Shadow Open Market Committee November 2003 For several years now many observers of the economic landscape have stressed that the U.S. is running the risk of deflation. They point to both the Great Depression and to the more recent experience of Japan as evidence that deflation is a recipe for economic disaster. Deflation has been the subject of speeches by officials of the Federal Reserve, by Wall Street economists, and numerous policymakers. The FOMC has continued to feed these fears with references in their most recent press release to “unwelcome fall in inflation” or “inflation becoming undesirably low.” In the press and elsewhere deflation is often preceding by words like “destabilizing,” or “debilitating.” Despite the repeated use of such words, neither economic theory nor the historical record provide much support for the fear expressed by the media or public officials. Deflation, of course, is characterized by a general decline in the level of prices. Not just a decline in a few prices, but in a broad index of prices. Chart 1 below indicates that the U.S. has not experienced deflation, but we have achieved a low rate of inflation. 0 1 2 3 4 5 1992 1994 1996 1998 2000 2002 2004 1 In Rs 1990003 a - - a P n p e a n n u Cae P Ide * John M. Olin Distinguished Professor of Economics and Public Policy and Director of the Bradley Policy Research Center, William E. Simon Graduate School of Business Administration, University of Rochester, Rochester, NY 14627 2 Indeed, the chart shows that the year-year inflation rate is about the same as it was in early 1998—about 1.5% per year. The U.S. has not experienced any significant deflation the last decade and it is unlikely it will in the next. The public discussion of deflation has been full of irrational fears, bad analysis, and rampant confusion as to its causes and effects. In past SOMC meetings, Schwartz (2003), Stockman (2002) and Plosser (1998) have discussed some of the issues regarding deflation. In this paper, I would like to look at some of the evidence surrounding deflationary experiences and highlight what economic theory suggests about costs and benefits of deflation. Deflationary Episodes Most of the fears surrounding deflation stem from the experience in the U.S. and elsewhere during the Great Depression. However, the early 1930s were not the only period of deflation experienced the U.S. The U.S. experienced a prolonged deflationary episode from about 1869 to 1896 (see Chart 2). 6 7 8 9 10 11 0 100 200 300 400 500 1860 1870 Da G 2 Ra G ad G D 1869915 d e 1 9 8 2 0 0 1 9 8 2 D l 1869896 deied 37 o - pe annua G g 292 o 4 pe annu During this 27 year period, the price level declined nearly 38%, which was an average annual rate of about -1.8%. This prolonged period of deflation, however, coincided, not with economic decline, or even stagnation, but with strong economic growth. Real GDP nearly tripled—growing at an average annual rate of 4.0%!1 There 1 The data are from Romer (1989). 3 was little evidence of economic weakness during this era or of the cataclysmic spiraling downward we hear so much about today. During the 1920s the U.S. also experienced a period of stable-declining prices. The price level declined almost 20% over the decade. Most of the price declines were concentrated in 1920-22, 1924 and 1927, but real GDP grew at an average rate of nearly 4.0% per annum from 1920 to 1929. Interestingly, the 1920s also saw rapid economic growth with stable-declining prices in other countries as well including, Argentina, Denmark, Japan, the Netherlands, Norway, Sweden and the U.K. among others These experiences are summarized in Table 1. Since the most dramatic price declines occurred in the first 3-4 years the episode, that period is shown separately except for Japan where the data don’t start until 1922. Table 1 Deflation and Economic Growth in the 1920s Period Inflation Rate Real GDP Growth 1920 - 5.7% Argentina 1920 - 6.9% 1920 - 4.1% Denmark 1920 - 6.7% 1922 - 2.3% Japan - - - 1920 - 4.1% Netherlands 1920 - 4.4% 1920 - 3. Norway 1920 - 1.0% 1920 - 4.7% Sweden 1920 - 4.3% U.K. 1920 - 1.8% 1920 - 0.6% 1920 - 3.9% U.S. 1920 - 5.2% Source: Mitchell (1998a, b, c). Inflation rates and growth rates are compounded annual rates of change. In general, over the last 150 years, there have been numerous deflationary episodes that have been sustained for five years or more in a wide variety of countries. With the exception of the period 1930-1935 (highlighted below), virtually all these periods have coincided with positive economic growth. 4 The other extreme, which is more familiar to the public, is the Great Depression. As shown in Chart 3, from 1929 to 1933 the price level fell by about 25% while real GDP declined by almost 27%. This represented a rapid decline in prices at an average annual rate of -6.4% and a similar rate of decline in real GDP. 10 11 12 13 14 15 16 550 600 650 700 750 800 1936 Da G 3 Ra G ad G D 1929939 d e 1 9 8 2 0 0 1 9 8 2 D l 1929933 deied 25 o - pe annua G deied 26 o - pe annu More recently, it has been fashionable to single out Japan’s recent bout with deflation as evidence of the serious consequences of deflation. Here again the evidence is not compelling. Japan has been in a mild deflation since 1994. While many people think Japan as in a depression, that is not accurate. Real growth in Japan has been slow but positive—far different from the U.S. experience during the 1930s. Using data from the IMF’s World Economic Outlook, Chart 4 shows that prices have declined an average of about 1.0% per year since 1994 while real GDP has grown about 1.3% per annum over the period. While far from a stellar economic record, it is not a depression, nor is it remotely comparable to the Great Depression. 5 90 100 110 120 1994 2004 Da G 4Jase Ra G ad G D 1994002 d e 1 9 9 4 0 0 pan 1994002 deied 7 o - pe annua G g 10 o 1 pe annu Japan has a number of problems that must be addressed if stronger economic growth is to resume. The biggest problem facing Japan is a banking system that is inefficient and nearly bankrupt. Banking practices in Japan have been inefficient and distorted by heavy investments in real estate and poor lending practices. The slowing of economic growth in Japan is mostly a story of declining productivity growth. As shown in Table 2 below, Japan grew at an annual rate of about 4.0% during the 1980-89 period. This rapid growth was largely driven by productivity growth, which averaged about 3.1% during the decade. The 1990s have been a different story. Real GDP growth only averaged about 1.9%—a decline of 2% from the preceding decade. This decline is almost entirely accounted for by a decline in productivity growth of 1.9%. Chart 5 highlights Japan’s productivity driven performance over the last decade. Table 2 Real GDP and Productivity Growth in the U.S. and Japan 1980 1990 1994 Japan Japan Japan Productivity Growth 3.1% 1. 1. 2.4% Real GDP Growth 4.0% 2.9% 1.9% 3.0% 3.2 6 1 2 3 4 5 6 1994 2004 5h Jase De o Pdua G gdu g n There are other recent examples of countries experiencing both deflation and robust economic growth. China, for example, during the last five years has experienc mild deflation and strong economic growth. Deflation has averaged about 0.5% per year in China since 1998 while real economic growth has averaged 7.6%. Hong Kong also deserves mention in this category. Since 1999 Hong Kong has seen its real GDP grow at an average rate of 4.0%. At the same time, prices have declined at an average annual rate of nearly 3.4% per annum. Thus, the claims that deflation is a recipe for economic catastrophe are not well supported by the historical record or recent experience. In fact, much of the case for such doom and gloom rests on one episode, the Great Depression, when prices declined at a rate of more than 6.0% per year. Other episodes of modest deflation, less than 2.0%, seem consistent with continued economic growth.2 Deflation and Interest Rates Deflation lowers nominal interest rates just as inflation raises them. Nominal interest rates tend to rise with anticipated inflation so that lenders are compensated for the decline in the purchasing power of money. Similarly, nominal interest rates fall with anticipated deflation, which is just negative inflation. When nominal rates fall because of 2 It is noteworthy that most of the post-World War II period has been a period of inflation with few episodes of deflation outside of the recent experience of Japan. One explanation is that the fiat money standard adopted by most countries over this period has place few restrictions on central bank behavior. 7 , debtors are repaying loans with dollars that have greater purchasing power and so the nominal interest rate is less. The simple relation between real interest rates, inflation (or deflation), and nominal interest rates is described by the Fisher equation, in honor of Irving Fisher; R = r + p*, where p* is the anticipated rate of inflation, R is the nominal interest rate, and r is the real rate of interest. The real rate of interest is determined by the economy’s marginal product of capital and is typically higher in faster growing economies. As long as the inflation or deflation is anticipated, there is little reason to expect any influence on the real rate of interest, which is important for saving and investment decisions. Thus neither anticipated inflation, nor anticipated deflation affect the competitive position of individual firms or the structure of the markets in which they operate. Unanticipated inflation or deflation can have redistributional effects since the interest rate does not capture (or anticipate) the change in the purchasing power of money. Unanticipated inflation causes redistribution from lenders to borrowers. Unanticipated deflation causes redistribution from borrowers to lenders. However, in general, this has a zero net effect on society. The only potential concern in the case of anticipated deflation is that nominal interest rates can not go below zero. No one would be willing to lend money at negative nominal interest rates because the return to holding cash would be greater. Nominal interest rates become zero (R = 0) when the rate of deflation is just equal to the real rate of interest. The lower limit of zero on nominal interest rates raises concerns among many that monetary policy becomes ineffective because the Federal Reserve or the Bank of Japan cannot continue to reduce interest rates. he SOMC (see McCallum (2001a, b), Schwartz (2003) and Stockman (2002)) has argued repeatedly that this is not the case. The monetary authority has a number of different mechanisms at its disposal to inflate the price level even when nominal interest rates are at or near zero. For example, the central bank can continue to expand monetary aggregates by purchases of foreign exchange as suggested by McCallum (2001a, b), or it could conduct open-market operations with longterm government bonds. Other strategies have also been 3 Irving Fisher was one of the greatest American economists. His views on interest rates are found in Fisher (1896, 1930). 8 proposed. In all cases, however, a credible plan requires that the central bank clearly communicate its intent to raise the price level. The Desirability of Deflation and Near Zero Nominal Interest Rates There are a number of reasons to be more optimistic about prospects of deflation. Strong economic growth can be a contributor to declining prices. In an economy that is experiencing rapid productivity growth, the resulting growth in real output will put downward pressure on the price level. The U.S. experience from 1869-1896 was an example of this type of episode. The result holds in a wide variety of economic models but follows easily from a simple quantity theory perspective. For example, starting with the simplest quantity theory specification, MV = PY where M is the quantity of money, V is velocity, P is the price level and Y is real output, the price level is determined by, P = MV/Y. In growth rates, the inflation rate is given by p = m + v – y, where lower case letters represent rates of growth. Thus, for given growth rates of money and velocity, faster real output growth reduces the rate of inflation and can even lead to deflation. Many of the worries expressed about deflations are misguided. In an earlier SOMC position paper, Stockman (2002) discusses a number of fallacies. For example, it is often claimed that deflation reduces aggregate demand because consumers will postpone purchases, anticipating that prices will be lower in the future. This argument fails to take into account that with anticipated deflation, nominal interest rates will be lower as well and this reduced reward for saving just offsets the gains from delaying purchases. The net effect on real aggregate demand is zero. Despite the irrational fears of deflation, a strong case can be made that the central bank should seek to achieve, not avoid, modest deflation. Milton Friedman (1969) was the first to articulate this case. He argued that money provided valuable services, yet is was costly to hold. In other words, money earns less interest than other securities and some forms of money, such as currency, earn no interest at all. This means that consumers incur a cost to holding money and will therefore have an incentive to economize on its use. 9 Friedman pointed out that economizing on holding money is wasteful from society’s point of view because it is almost costless for central banks to produce. Friedman showed that the central bank could make everyone better off, at little cost, by increasing the quantity of real balances (i.e. the nominal quantity of money divided by the price level) held by consumers. Higher real balances would make it easier for consumers to carry-out transactions and it would cost the central bank almost nothing to provide this service.4 Friedman showed that the optimal policy is to eliminate the incentive to economize on money. The central bank does this by making the interest rate on money (which is zero) equivalent to the interest rate of securities that are close substitutes. This implies that the central bank should drive the nominal interest rate to zero. That is the rate of deflation should just equal the real rate of interest. Assuming that the real rate of interest is about 2% or 3%, then the central bank should seek deflation of 2% to 3%. The proposition that the optimal inflation rate is negative turns out to be a reasonably robust proposition. It has been show to be applicable in a wide variety of models. Khan, King and Wolman (2002) show that deflation remains an element of optimal monetary policy even in models various sorts of frictions and price stickiness. In some circumstances, it turns out that it is not desirable to drive the nominal interest rate to all the way to zero, yet modest rates of deflation in the range of 1% or less are still preferred Thus, it would seem that deflation is not something necessarily to be feared, but something to achieve. A caveat that should be acknowledged is that the optimal inflation rate refers to an appropriate or true measure of inflation. To the extent that our measures of inflation are systematically biased upward, the target rate for those measures should be adjusted accordingly. The size of this bias is commonly thought to be in the neighborhood of 1%. Based on this estimate, a reasonable target for measured inflation is zero, ± 1%. Conclusions Despite the incredible amount of attention given to the purveyors of fear regarding deflation, neither the historical record nor economic theory provide much reason to justify all the trepidation. Except for the Great Depression, the historical 4 Lucas (1987) noted that this idea is “one of the few legitimate ‘free lunches’ economics has discovered in 200 years of trying.” 10record and recent experience show that most periods of mild deflation are associated with economic growth, not stagnation or decline. The Great Depression is the exception rather than the rule. Even the recent experience of Japan provides little support for the idea that deflation itself is a source of declining output. Japan has continued to grow slowly, in large part, because of slow growth in productivity. The other fear that should be dismissed is the ineffectiveness of monetary policy when nominal interest rates at or near zero. Central banks have sufficient tools to re-inflate if they so desire. Economic theory, however, suggests that optimal monetary polic is one that leads to mild deflation. As a practical matter, and recognizing the difficulty of measuring inflation, a target range of -1% to +1% for common measures of inflation seems justified and desirable. References Fisher, Irving (1896), “Appreciation and Interest,” in Publications of the America Economic Association, Vol. XI. New York: Macmillan. Fisher, Irving (1930), The Theory of Interest, New York: Macmillan. Friedman, Milton (1969), “The Optimum Quantity of Money,” in The Optimum Quantity of Money and Other Essays, Chicago: Aldine Publishing. International Monetary Fund, World Economic Outlook, Washington: IMF, 2003 Khan, Aubhik, Robert G. King, and Alexander Wolman (2002), “Optimal Monetary Policy,” NBER Working Paper No. 9402. Lucas, Robert E., Jr. (1987), Models of Business Cycles,” Oxford: Basil Blackwell. McCallum, Bennett (2001a), “Japanese Monetary Policy,” SOMC Position Paper, April 2001 McCallum, Bennett (2001b), “Japanese Monetary Policy Again,” SOMC Position Paper, October 2001. Mitchell, B. R. (1998a), International Historical Statistics: Asia, Africa and Oceania, 17501993, London: Macmillan. Mitchell, B. R. (1998b), International Historical Statistics: Europe, 1750-1993, London: Macmillan. Mitchell, B. R. (1998c), International Historical Statistics: The Americas, 1750-1993, London: Macmillan. 11Plosser, Charles (1998), “Exaggerated Risks of Deflation,” SOMC Position Paper, March 1998 Romer, Christina D. (1989), “The Prewar Business Cycle Reconsidered: New Estimates of Gross National Product, 1869-1908,” Journal of Political Economy, Vol. 97. pp. 1 Schwartz, Anna (2003), “Fiat Money and Deflation,” SOMC Position Paper, May 2003 . Stockman, Alan (2002), “Will the U.S. Catch the Japanese Disease?” SOMC Position Paper, November 2002.