/
Imbalances in the Euro Area Imbalances in the Euro Area

Imbalances in the Euro Area - PDF document

trish-goza
trish-goza . @trish-goza
Follow
408 views
Uploaded On 2017-01-10

Imbalances in the Euro Area - PPT Presentation

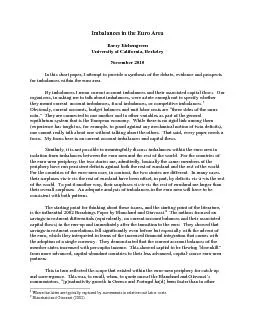
Barry Eichengreen University of California Berkeley November 2010 In this short paper I attempt to provide a synthesis of the debate evidence and prospects for imbalances within the euro area B ID: 508066

Barry Eichengreen University California Berkeley November

Share:

Link:

Embed:

Download Presentation from below link

Download Pdf The PPT/PDF document "Imbalances in the Euro Area" is the property of its rightful owner. Permission is granted to download and print the materials on this web site for personal, non-commercial use only, and to display it on your personal computer provided you do not modify the materials and that you retain all copyright notices contained in the materials. By downloading content from our website, you accept the terms of this agreement.


Presentation Transcript

Imbalances in the Euro Area Barry Eichengreen University of California, Berkeley November 2010 In this short paper, I attempt to provide a synthesis of the debate, evidence and prospects for imbalances within the euro area. By imbalances I mean current account imbalance s and th eir associated capital flows. Our organizers, in asking me to talk about imbalances, were astute enough not to specify whether they meant current account imbalances, fiscal imbalances, or competitive imbalances. 1 Obvious ly, current accounts, budget balances and unit labor costs are “three sides of the same coin.” They are connected to one another and to other variables as part of the general equilibrium system that is the European economy. While there is no rigid link a mong them (experience has taught us, for example, to guard against any mechanical notion of twin deficits), o ne cannot really talk about one withou t talking about the others. That said, every paper needs a focus. My focus here is on current account imbal ances and capital flows. Similarly, it is not possible to meaningfully discuss imbalances within the euro area in isolation from imbalances between the euro area and the rest of the world. For the countries of the euro - area periphery, the two stories are , admittedly, basically the same: members of the periphery have run persistent deficits against both the rest of euroland and the rest of the world. For the countries of the euro - area core, in contrast, the two stories are different. In many cases their surpluses vis - à - vis the rest of euroland have been offset, in part, by deficits vis - à - vis the rest of the world. To put it another way, their surpluses vis - à - vis the rest of euroland are larger than their overall surpluses. An adequate analysis of imbala nces in the euro area will have to be consistent with both patterns. The starting point for thinking about these issues, and the starting point of the literature, is the influential 2002 Brookings Paper by Blanchard and Giavazzi. 2 The authors focused on savings - investment differentials (equivalently, on current account balances and their associated capital flows) in the run - up and immediately after the transition to the euro. They showed that savings - investment correlations fell significantly even bef ore but especially with the advent of the euro, which they interpreted in terms of the increased financial integration that comes with the adoption of a single currency. They demonstrated that the current account balances of the member states increased wi th per capita income. This showed capital to be flowing “downhill” from more advanced, capital - abundant countries to their less advanced, capital - scarce euro - area partners. This in turn reflected the scope that existed within the euro - area periphery fo r catch - up and convergence. This was, to recall, when, to quote one of the Blanchard and Giavazzi’s commentators, “[p]roductivity growth in Greece and Portugal ha[d] been faster than in other 1 Where the latter are typically captured by movements in relative unit labor costs. 2 Blanchard and Giavazzi (2002). European countries.” 3 This, then, was an example of a “good” i mbalance: of countries with attractive investment opportunities and outstanding growth prospects capitalizing on the advent of the euro and the deeper financial integration it entailed to undertake additional investment, tapping foreign saving by running c urrent account deficits while at the same time boosting their consumption (reducing their own saving) to reflect the positive permanent income effect of faster growth and the positive wealth effect of lower interest rates. 4 Ahearne, Schmitz and von Hagen (2009) use data through 2006 and affirm this tendency for intra - euro - area capital to flow from high - to low - per - capita - income countries. Lane (2010) uses data through 2007 and finds evidence of the same. The opposite effects were to be expected in the more advanced euro - area core: less investment insofar as the opportunities afforded by rapid productivity growth made investing abroad more attractive, more savings insofar as interest rates were higher, and larger current account surpluses on both counts. But insofar as the more advanced economies of the euro - area core, with their more sophisticated financial markets and institutions, were already deeply integrated into much larger global capital markets, on e would expect these effects to be less. Incipient upward pressure on interest rates in the euro - area core would encourage capital to flow there from the rest of the world, moderating the increase in the cost of capital and the impact on saving and invest ment rates. To put it another way, Germany and the Netherlands, with their highly - developed, financially - sophisticated banks, could borrow from and run current account deficits vis - à - vis the rest of the world and, free now of currency risk and transaction s costs courtesy of the euro, on - lend to Portugal, Spain and Greece. Given the slower development of financial systems at the periphery, this was the euro - area core acting as financial intermediary between the periphery and the rest of the world. 5 This i s similar to what we see in my country: New York as financial center borrowing abroad and on - lending to lower - income “convergence states.” The main differences are that New York, unlike Germany and the Netherlands, tends to be in overall deficit rather th an surplus, or so it would appear, and that the U.S. as a whole regularly runs large deficits, whereas euroland as a unit has been close to current account balance. 6 But, aside from this, why should Europe be different? You know where I’m going. With b enefit of hindsight, all this seems more than bit naïve. Catch - up and convergence at the periphery were not baked in; rapid productivity growth turned out to be a mirage. 7 Convergence is conditional not just on the gap in per capita incomes but also on t he quality of policies and institutions. 8 The “good imbalances” driven by productivity differentials turned out to be “bad imbalances” driven by domestic distortions: bubble - driven asset booms, excessive budget deficits, and unrealistic expectations of fu ture growth. Zemanek, Belke and Schabl (2009) and Berger and Nitsch (2010) document the 3 Gourinchas (2002), p.197. 4 The “good” and “bad” imbalance terminology is of course from the literature on global imbalances, specifically Blanchard and Milesi - Ferretti (2009) . 5 As observed by Ahearne, Schmitz and von Hagen (2009). 6 Not exactly the only difference, in fact; see below. 7 In cont rast to convergence across U.S. states, which is a long - established fact , although even there it has proceeded considerably faster in som e periods than others (Mitchener and McLean 2003). Givazzi and Spaventa (2010) describe some potential explanations for the contrast, including the moral hazard for governments associated with participation in the monetary union. 8 Some thing that seems to have been adequately provided in the U.S. through the operation of federal fiscal and judicial systems. tendency for intra - euro - area capital to flow toward the countries where domestic distortions are most severe and structural reforms are least. 9 Similarly, the suppose dly efficient German and Dutch banks at the center of the financial intermediation process, which funded themselves globally in order to load up on Greek, Spanish and Portuguese bonds, turned out to be dangerously over - leveraged institutions stretching for yield and taking on excessive risk, owing to a combination of skewed managerial incentives, the intensification of competition, and the expectation of being too big to fail. Already a decade ago there were disturbing anomalies that, with benefit of hinds ight, should have attracted more attention. 10 First, there was little evidence of a rise in investment rates at the euro - area periphery and little evidence that the investment rate had become a more strongly increasing function of the per capita income gap . Second, when that rise in investment eventually came, much of it took the form of residential construction (in Spain and Ireland in particular), which did little for productivity growth. Third, there was growing evidence as the period progressed that e conomic growth at the periphery had come to depend less on productivity growth and investment and more on employment growth. 11 Fourth, already in 2002 there was evidence of real exchange rate appreciation and real overvaluation in the euro - area periphery – evidence, in other words, that differential inflation rates exceeded what could be explained by Balassa - Samuelson effects. And fifth, saving seemed to decline in the countries of the euro - area periphery more rapidly than the positive wealth effect of low er interest rates and the positive income effects of faster growth due to the availability of foreign finance could plausibly explain. With benefit of hindsight, we are led to ask why more attention was not paid to these warning signs. Part of the answe r is the intrinsic difficulty of distinguishing good and bad imbalances. 12 The same debate prevailed in the United States about whether the current account deficit in the decade leading up to 2006 was a good imbalance driven by attractive investment opport unities associated with information and the productivity miracle or a bad imbalance reflecting chronic budget deficits and asset - market distortions. 13 We now appreciate that there was some validity to both views: although the IT revolution in the United St ates was real, so was the real - estate bubble. But even now, long after the fact, there is disagreement about how to apportion those deficits into their “good” and “bad” components. Will the history books revise downward earlier estimates of the productivity acceleration in the United States, given th at much of it was concentrated in finance (along with, it should be acknowledged, retail and wholesale trade), where much of the growth in “output” was unsustainable and many of the gains proved illusory? 9 Berger and Nitsch also find a tendency for countries with larger fiscal deficits to run larger intra - euro - area trade deficits, but I ha ve been unable to replicate their findings using either bilateral intra - euro - area trade balances or imbalances vis - à - vis the euro area as a whole. Note that unlike these previous authors, I limit the sample to euro - area members. What seems to matter in t his sample, rather government saving is national saving as a whole. See Table 2 in the appendix below. 10 These come from the Blanchard and Giavazzi study, which draws inferences about the effects of financial integration and adoption of the euro not just from the first couple of years of the euro itself but from the experience of the preceding decade. 11 Again, see Giavazzi and Spaventa (2010). 12 A point that I try to reinforce, econometrically, in the appendix. 13 Cooper (2004) was representative of the fir st perspective, Roubini and Setser (2005) the second. Don’t retrospective analyses that emphasize global imbalances as a factor in the financial crisis, or at least see imbalances and the crisis as products of common causes (making imbalances the canary in the coalmine), suggest that policy makers should have reacted to them earlier and more forcefully? 14 Si mply because a task is analytically difficult, policy makers do not have dispensation to ignore it. Officials have reluctantly come around to this point of view when it comes to asset market bubbles: bubbles may be hard to identify, but that doesn’t mean that they can be treated with benign neglect. The same logic applies to imbalances, whether we mean global imbalances or intra - European imbalances. The other thing that the debate over good and bad imbalances reminds us is that mechanical rules for intra - EU imbalances would be wrong - headed: calls for a “Stability Pact” for intra - EU current account imbalances, under which countries running current account deficits in excess of 3 per cent of GDP would be subject to automatic sanctions and fines, are misplace d. 15 There is such a thing as a good imbalance, and one would not wish to penalize a country for running one. Unavoidably, policy makers will have to make a judgment. They will have to trace intra - euro - area imbalances to their source, whether that source is differential productivity growth leading to differential investment opportunities or domestic distortions. And where domestic distortions are their root, this warrants intervention by regulators (if the distortions in question originate in the financi al sector and manifest themselves as asset and property bubbles) or by the fiscal authorities (if the distortion is political and manifests itself in the form of budgetary excesses). In such cases, national regulators should raise capital, liquidity and c ollateral requirements more aggressively during the upswing, when the external deficit widens . 16 Fiscal policy should be adjusted more aggressively in response to a diagnosis of a (potentially) bad imbalance. The national authorities should be encouraged to act by pressure from institutions of the European Union. Here the European Commission, the ECB and the von Rompuy taskforce have taken the right approach by seeking to extend complement the EU’s existing focus on fiscal surveillance with a macroeconomic surveillance mechanism focusing on additional the external position and international competitiveness above and beyond budget deficits. 17 They have done the right thing by agreeing that sensitive matters such as the national political arrangements and pro cedures through which budgets are decided, the structure of regulation, and wage - bargaining systems are fair game for surveillance. But now the Commission, with its expanded jurisdiction and strengthened mandate, needs to put in place procedures that work . Similarly, Europe has now taken a step in the right direction by establishing three pan - European supervisors for banking, insurance and securities firms. But so long as the three new pan - European entities have only the power to mediate between nationa l supervisors and not to override their actions or – more likely – lack of action, some euro - area member states fall prey to externally - financed credit booms in boom times that will turn out to have serious adverse consequences when boom turns to bust. Ev en if the domestic financial system has been regulated well, this along may not be enough if finance can still flow into domestic markets 14 See Obstfeld and Rogoff (2010). 15 See Dullien and Schwartzer (2009). In fairness to the authors, they would exempt deficits financed by foreign direct investment inflows, but otherw ise their rule is pretty mechanical. 16 This is what macroprudential supervision, which is now supposedly so de rigueur, is all about. 17 See European Commission (2010). through nonbank channels from other less well regulated financial systems. Europe now has a single currency and incre asingly, a n integrated financial market ; that, after all, was Blanchard and Giavazzi’s point . It needs integrated – that is to say, centralized – financial supervision at the level of the EU or at least the euro area . It needs a single supervisor to comp lement the single market and the single currency, or else the kind of free - rider problems that contributed to the recent growth of intra - area imbalances will recur. A final thought, since this question will undoubtedly asked of an author coming from the U nited States. We worry about lots of problems in the U.S. – or at least we should worry about lots of problems – but one rarely hears talk of trade - and current - account imbalances among the 50 U.S. states. 18 One explanation is that we don’t gather data on them – I am not being entirely facetious. But there is more to it than that. For many years California, Arizona, New Mexico and Florida ran substantial current account deficits vis - à - vis the rest of the United States. This reflected job and economic g rowth that consistently exceeded the national average and more - than - typically attractive investment opportunities. 19 These were “good” imbalances of the sort described above. More recently, however, these same states saw some of the most extreme housing - m arket bubbles and building booms; nearly half of all privately - securitized “affordability mortgages” (adjustable - rate mortgages, option and hybrid ARMs, interest only loans, negative amortization loans, and balloon payment loans) made in 2006 were in the s o - called “sand states.” Now many counties are left with unsold and unusable McMansions stretching as far as the eye can see that, we can say with benefit of hindsight, were financed by “bad imbalances.” But in the absence of statistics on capital flows a nd trade balances, the focus of the resulting policy discussion is on the domestic distortions that resulted in “bad” imbalances: inadequate regulation of the mortgage - broking industry and banking sector, the incentive to take on excessive leverage created by no - recourse mortgages, and the like – and not on the current account deficits per se. And it is on those distortions and simply on the symptoms they create that the focus belongs in a well - functioning monetary union. Finally, it is worth askin g what the evidence of “bad imbalances” within the euro area tells us about the sustainability of the single currency. The answer, in my view, is nothing: “bad imbalances” are not obviously more prevalent inside the euro area than elsewhere. In the last ten years, we have had a mammoth flow of capital uphill from emerging markets to the United States that dwarfs anything witnessed in Europe. Maybe this is telling us that the current international monetary non - system is even less sustainable than the euro . 18 This was pointed out long ago by Hartland (1949). 19 See FDIC (2009). Appendix: Good and Bad Imbalances This appendix reports regressions in the spirit of Ahearne et al. (2009) of the proximate determinants of intra - euro - area imbalances. The dependent variable is the trade balance of a country vis - à - vis the rest of the euro area as a proxy for the net capital outflow. The sample and specification differ from Ahearne et al. and other previo us work in that the unbalanced panel is made up exclusively of euro - area countries and in the sele ction of independent variables. The focus is on per capita GDP and its rate of growth (in order to test whether capital has tended to flow from relatively high - to low - income and relatively slow - to fast - growing economies) and on Transparency Internationa l’s measure of corruption (in order to test whether capital has tended to flow from less to more distorted economies). Figures 1 - 3 show scatter plots of GDP per capita, the rate of growth of GDP per capita, and corruption, respectively, against the intra - euro - area trade balance. All variables are period averages, averaging over only years when a country was in the euro area. 20 Figure 1 is consistent with the notion that capital has tended to flow from high to low per capita income countries over the peri od. (It also points to the importance of treating Luxembourg as an outlier in what follows.) Figure 2 suggests a positive relationship between the growth of income per head with capital out flows (not inflows, as would be predicted by the “good imbalances ” story ) , although the relationship is weaker. Figure 3 finally suggests the existence of a positive relationship between corruption and capital inflows (note that a higher value of the index indicates less corruption). Evidently there is evidence consis tent with both “good” and “bad” imbalances. The question is whether it is robust. In practice, that evidence turns out to be quite fragile -- which may explain why policy makers have been reluctant to either approve of or condemn intra - euro - area imbalanc es). Table 1 is consistent with the hypothesis of good imbalances: while there is a significant positive coefficient on per capita GDP, the coefficient on the corruption index, while of the “expected” sign (as if more corrupt countries imported more capit al from their euro - area partners) is insignificantly different from zero. (Two versions of each regression are reported, with and without Luxembourg, respectively.) Table 2 shows that this pattern is robust to the inclusion of additional explanatory variables. This additional analysis suggests further that the national savings rate affects intra - euro - area capital flows in the expected manner. In addition, there is e vidence that domestic credit as a share of GDP, as a measure of financial depth, similarly has the expected effect: countries with deeper financial markets tend to be capital exporters, consistent with the results and interpretation of Ahearne et al. Ther e is mixed evidence of the importance of the fiscal balance. Tables 3 - 4 , which substitute the rate of growth of GDP per capita for its level, point exactly in the opposite direction . While both the growth rate and the level of corruption enter with their expected signs, h ere it is the level of corruption and not the GDP per capita (growth) differential that is the significant determinant of intra - euro - area imbalances. The contrast between Tables 1 and 3 reflects the high correlation between income levels and corruption; it is a reminder that generalizations about these relationships should be taken with a grain of salt. 20 This explains, for example, why Greek growth appears to be so fast relative to the euro area average; the Greek data exclude the 2000 - 1 recession. This is why annual data rather than period averages are used in the regression analysis below. Table 4 further suggests that these results are sensitive to the inclusion of additional controls. This final table at least confirms t he importance of financial depth and the national savings rate in intra - euro - area flows – and not the fiscal ba lance . . References Ahearne , Schmitz and von Hagen (2009), “Current Account Imbalances and Financial Integration in the Euro Area,” unpublished manuscript, Bruegel and University of Bonn. Berger, Helge and Volker Nitsch (2010), “The Euro’s Effect on Trade Imbalances,” IMF Working Pa per no. 10/226 (October). Blanchard, Olivier and Francesco Giavazzi (2002), “Current Account Deficits in the Euro Area: The End of the Feldstein - Horioka Puzzle,” Brookings Papers on Economic Activity 2, pp.148 - 186. Blanchard, Olivier and Gian Maria Milesi - Ferretti (2009), “Global Imbalances: In Midstream?” www.imf.org (December). Cooper, Richard (2004), “U.S. Deficit: It is Not Only Sustainable, It is Logical,” Financial Times (31 October). Dullien, Sebastian and Daniela Schwartzer (2009), “The EMU Needs a Stability Pact for Intra - Regional Current Account Imbalances,” SWP Comments . European Commission (2010), “A New EU Economic Governance: A Comprehensive Commission Package of Proposals,” Brussels: European Commission (29 September). Federal Deposit Insurance Corporation (2009), “The Sand States: Anatomy of a Perfect Housing - Market Storm,” in 2009 Economic Landscape , Washington, D.C.: FDIC. Giavazzi, Francesco and Luigi Spaventa (2010), “Why the Current Account Matters in a Monetary Union: Lessons from the Financial Crisis in the Euro Area,” CEPR Discussion Paper no.8008 (September). Gourinchas, Pierre - Olivier (2002), “Comment on Current Account Deficits in the Euro Area: The End of the Feldstein - Horioka Puzzle,” Brookings Papers on Economic Activity 2, pp.196 - 206. Hartland, Penelope (1949), “Interregional Payments Compared with International Payments,” Quarterly Journal of Economics 63, pp.392 - 407. Lane, Philip (2010), “A European Perspective on External Imbalances,” Report Number 5, Stockholm: Swedish Institute for Economic Policy Studies (October). Mitchener, Kris and Ian McLean (2003), “The Productivity of US States Since 1880,” Journal of Economic Growth 8, pp.73 - 114. Obstfeld, Maurice and Kenneth Rogoff (2010), “Global Imbalances and the Financial Crisis: Products of Common Causes,” in Reuven Glick and Mark Spiegel (eds), Asia and the Global Financial Crisis , San Francsico: Federal Reserve Bank of San Francisco, pp.131 - 172. Roubini, Nouriel and Brad Setser (2005), “Will the Bretton Woods 2 Regime Unravel Soon? The Risk of a Hard Landing in 2005 - 6,” unpublished manuscript, Stern School of Business (June). Zemanek, Holger, Ansgar Belke and Gunther Schnabl (2009), “Current Account Imbalances and Structural Adjustment in the Euro Area: How to Rebalance Competitiveness,” Policy Paper no.7, IZA Bonn (April). Figure 1. Intra - Euro - Area Imbalances and GDP Per Capita, 1999 - 2009 Average Source: AMECO for GDP per capita, IMF Direction of Trade for trade balances. Figure 2 . Intra - Euro - Area Imbalances and Growth in GDP per Capita , 1999 - 2009 Averages Source: AMECO for GDP per capita, IMF Direction of Trade for trade balances Figure 3 . Intra - Euro - Area Imbalances and Corruption, 1999 - 2009 Averages Source: Transparency International for corruption index, IMF Direction of Trade for trade balances. Table 1. Intra - Euro - Area Imbalances, Development and Corruption, Annual Data 1999 - 2009 Dependent variable: FULL SAMPLE FULL SAMPLE EX LUXEMBOURG Intra - Euro Trade balance/GDP b/t b/t b/t b/t b/t b/t GDP per capita_i 0.002* 0.003** 0.003** 0.004*** 0.005*** 0.005*** (2.38) (2.72) (2.86) (4.62) (3.91) (4.17) Corruption index_i 0.002 0.003 0.003 0.000 0.000 0.000 (0.96) (1.03) (0.99) (0.10) (0.09) (0.02) Government savings rate_i - 0.003 - 0.009 ( - 0.03) ( - 0.10) Constant - 0.082*** - 0.106*** - 0.109*** - 0.115*** - 0.131*** - 0.136*** ( - 3.83) ( - 4.52) ( - 4.60) ( - 5.27) ( - 4.61) ( - 4.87) N 1 37 1 37 1 37 1 26 1 26 1 26 Year Fixed Effects No Yes Yes No Yes Yes 1. GLS regressions with heteroscedastic errors and autocorrelation (AR1) correction. 2. Only those country - years included when a country is in the e uro area. 3. * p.05, ** p.01, *** p.001 4. Data Sources: see note to Table 2. Table 2. Determinants of Intra - Euro - Area Imbalances, Extended Regressions Dependent variable: FULL SAMPLE FULL SAMPLE EX LUXEMBOURG Intra - Euro Trade balance/GDP b/t b/t b/t b/t b/t b/t GDP per capita_i - 0.000 - 0.000 - 0.000 0.003** 0.004*** 0.004*** ( - 0.52) ( - 0.37) ( - 0.32) (3.02) (3.95) (3.62) Savings rate_i 0.174* 0.166* 0.175* 0.213** 0.295*** 0.314*** (2.41) (2.27) (2.10) (2.81) (3.78) (3.53) TOT growth_i 0.013 0.011 0.001 - 0.028 - 0.044 - 0.002 (0.36) (0.31) (0.01) ( - 0.52) ( - 0.75) ( - 0.02) Private credit (% of GDP)_i 0.064*** 0.063*** 0.063*** 0.042** 0.046*** 0.046*** (5.09) (4.52) (4.13) (2.93) (3.71) (3.52) Short - term interest rate_i - 0.002 - 0.002 - 0.002 ( - 1.39) ( - 1.86) ( - 0.93) Elderly dependency ratio_i 0.043 0.026 0.013 - 0.125 - 0.177 - 0.202 (0.41) (0.23) (0.08) ( - 1.03) ( - 1.72) ( - 1.45) Government savings rate_i - 0.071 - 0.071 0.034 - 0.177* - 0.196* - 0.129 ( - 0.97) ( - 0.98) (0.33) ( - 2.44) ( - 2.51) ( - 1.08) Corruption index - 0.000 0.000 - 0.005 - 0.006* ( - 0.02) (0.04) ( - 1.91) ( - 1.98) Constant - 0.066* - 0.062 - 0.057 - 0.107** - 0.088** - 0.075 ( - 2.09) ( - 1.73) ( - 1.01) ( - 3.23) ( - 2.93) ( - 1.69) N 1 17 1 17 1 17 108 108 108 Year Fixed Effects No No Yes No No Yes 1. GLS regressions with heteroscedastic errors and autocorrelation (AR1) correction. 2. Only those country - years included when a country is in the e uro area. 3. * p.05, ** p.01, *** p.001 4. Sources of Data: Trade data from Direction of Trade statistics, IMF; GDP per capita, Savings rate, TOT growth, ST Interest rate, Government savings from AMECO; Private Credit from IFS, IMF, Elderly Dependency data from AMECO and UN; Corruption index - Transparency International. Table 3. Basic regressions substituting growth rates of GDP per capita for levels 1. GLS regressions assuming heteroscedastic errors and with autocorrelation (AR1) correction. 2. Only those country - years included when a country is in the e uro area. 3. * p.05, ** p.01, *** p.001 4. Sources of data: see Table 2. Dependent variable: FULL SAMPLE FULL SAMPLE EX LUXEMBOURG Intra - Euro Trade balance/GDP b/t b/t b/t b/t b/t b/t Growth in Gdp per capita_i - 0.059 - 0.147 - 0.161 - 0.057 - 0.089 - 0.103 ( - 1.48) ( - 1.39) ( - 1.45) ( - 1.18) ( - 0.78) ( - 0.92) Corruption index_i 0.005* 0.007* 0.007* 0.007** 0.008* 0.006 (1.99) (2.54) (2.35) (2.64) (2.41) (1.90) Government savings rate_i 0.045 0.110 (0.38) (0.94) Constant - 0.055** - 0.071** - 0.072** - 0.067*** - 0.069** - 0.061* ( - 3.05) ( - 3.18) ( - 3.12) ( - 3.48) ( - 2.91) ( - 2.55) N 1 37 1 37 1 37 1 26 1 26 1 26 Year Fixed Effects No Yes Yes No Yes Yes Table 4. Extended Regressions substituting Growth of GDP per Capital for Levels Dependent variable: FULL SAMPLE FULL SAMPLE EX LUXEMBOURG Intra - Euro Trade balance/GDP b/t b/t b/t b/t b/t b/t GDP per capita growth rate - 0.127 - 0.136* - 0.165 - 0.117 - 0.132 - 0.189 ( - 1.87) ( - 1.98) ( - 1.68) ( - 1.69) ( - 1.91) ( - 1.64) Savings rate_i 0.279*** 0.299*** 0.265** 0.361*** 0.399*** 0.399*** (3.82) (3.75) (3.02) (4.61) (4.70) (4.16) TOT growth_i - 0.041 - 0.042 - 0.022 - 0.065 - 0.084 - 0.039 ( - 0.86) ( - 0.89) ( - 0.24) ( - 1.27) ( - 1.62) ( - 0.35) Private Credit (% of Gdp)_i 0.064*** 0.067*** 0.065*** 0.065*** 0.070*** 0.068*** (6.59) (6.43) (5.28) (6.99) (6.89) (5.81) Short - term interest rate_i - 0.002 - 0.002 - 0.001 ( - 1.38) ( - 1.71) ( - 0.32) Elderly dependency ratio_i 0.035 - 0.007 0.013 - 0.098 - 0.118 - 0.122 (0.35) ( - 0.07) (0.09) ( - 1.04) ( - 1.25) ( - 0.87) Government savings rate_i - 0.082 - 0.080 0.033 - 0.101 - 0.097 - 0.013 ( - 1.01) ( - 1.01) (0.31) ( - 1.15) ( - 1.13) ( - 0.10) Corruption index - 0.002 - 0.001 - 0.003 - 0.004 ( - 0.73) ( - 0.46) ( - 1.42) ( - 1.40) Constant - 0.096*** - 0.078** - 0.079 - 0.075** - 0.055* - 0.047 ( - 3.58) ( - 2.61) ( - 1.72) ( - 3.13) ( - 2.00) ( - 1.04) N 1 17 1 17 1 17 108 108 108 Year Fixed Effects No No Yes No No Yes 1. GLS regressions assuming heteroscedastic errors and with autocorrelation (AR1) correction 2. Only those country - years included when a country is in the euro area. 3. * p.05, ** p.01, *** p.001 4. Trade balance is defined as net exports (exports - imports) of country i with rest of e uro area countries 5. Sources of data: see Table 2.