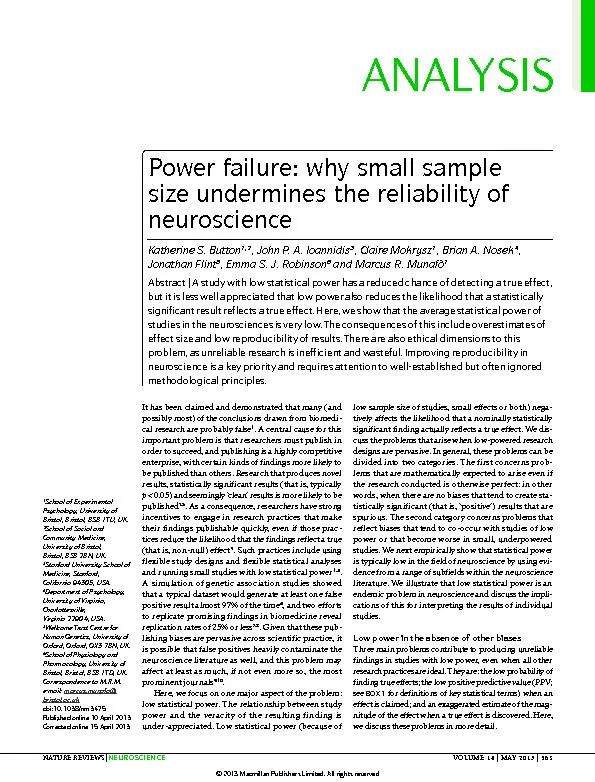
/
It has been claimed and demonstrated that many (and It has been claimed and demonstrated that many (and

It has been claimed and demonstrated that many (and - PDF document

trish-goza
trish-goza . @trish-goza
Follow
408 views
Uploaded On 2016-08-18

It has been claimed and demonstrated that many (and - PPT Presentation

possibly most of the conclusions drawn from biomedi cal research are probably false 1 A central cause for this important problem is that researchers must publish in order to succeed and publis ID: 451034

possibly most) the conclusions

Share:

Link:

Embed:

Download Presentation from below link

Download Pdf The PPT/PDF document "It has been claimed and demonstrated tha..." is the property of its rightful owner. Permission is granted to download and print the materials on this web site for personal, non-commercial use only, and to display it on your personal computer provided you do not modify the materials and that you retain all copyright notices contained in the materials. By downloading content from our website, you accept the terms of this agreement.


Presentation Transcript

It has been claimed and demonstrated that many (and possibly most) of the conclusions drawn from biomedi - cal research are probably false 1 . A central cause for this important problem is that researchers must publish in order to succeed, and publishing is a highly competitive enterprise, with certain kinds of findings more likely to be published than others. Research that produces novel results, statistically significant results (that is, typically p 0.05) and seemingly ‘clean’ results is more likely to be published 2 , 3 incentives to engage in research practices that make their findings publishable quickly, even if those prac - tices reduce the likelihood that the findings reflect a true (that is, non-null) effect 4 . Such practices include using flexible study designs and flexible statistical analyses and running small studies with low statistical power 1 , 5 . A simulation of genetic association studies showed that a typical dataset would generate at least one false positive result almost 97% of the time 6 , and two efforts to replicate promising findings in biomedicine reveal 7 , 8 . Given that these pub - lishing biases are pervasive across scientific practice, it is possible that false positives heavily contaminate the neuroscience literature as well, and this problem may affect at least as much, if not even more so, the most prominent journals 9 , 10 . Here, we focus on one major aspect of the problem: low statistical power. The relationship between study power and the veracity of the resulting finding is under-appreciated. Low statistical power (because of low sample size of studies, small effects or both) nega - significant finding actually reflects a true effect. We dis - cuss the problems that arise when low-powered research designs are pervasive. In general, these problems can be divided into two categories. The first concerns prob - lems that are mathematically expected to arise even if the research conducted is otherwise perfect: in other words, when there are no biases that tend to create sta - tistically significant (that is, ‘positive’) results that are spurious. The second category concerns problems that reflect biases that tend to co - occur with studies of low power or that become worse in small, underpowered is typically low in the field of neuroscience by using evi - dence from a range of subfields within the neuroscience literature. We illustrate that low statistical power is an endemic problem in neuroscience and discuss the impli - cations of this for interpreting the results of individual studies. Low power in the absence of other biases Three main problems contribute to producing unreliable findings in studies with low power, even when all other research practices are ideal. They are: the low probability of finding true effects; the low positive predictive value (PPV; see BOX1 for definitions of key statistical terms) when an effect is claimed; and an exaggerated estimate of the mag - nitude of the effect when a true effect is discovered. Here, we discuss these problems in moredetail. 1 School of Experimental Psychology, University of Bristol, Bristol, BS8 1TU, UK. 2 School of Social and Community Medicine, University of Bristol, Bristol, BS8 2BN, UK. 3 Stanford University School of Medicine, Stanford, California 94305, USA. 4 Department of Psychology, University of Virginia, Charlottesville, Virginia 22904, USA. 5 Wellcome Trust Centre for Human Genetics, University of Oxford, Oxford, OX3 7BN, UK. 6 Pharmacology, University of Bristol, Bristol, BS8 1TD, UK. Correspondence to M.R.M. e-mail: marcus.munafo@ bristol.ac.uk doi:10.1038/nrn3475 Published online 10 April 2013 Corrected online 15 April 2013 Power failure: why small sample size undermines the reliability of neuroscience Katherine S.Button 1,2 , John P.A.Ioannidis 3 , Claire Mokrysz 1 , Brian A.Nosek 4 , Jonathan Flint 5 , Emma S.J.Robinson 6 and Marcus R.Munafò 1 Abstract | A study with low statistical power has a reduced chance of detecting a true effect, but it is less well appreciated that low power also reduces the likelihood that a statistically significant result reflects a true effect. Here, we show that the average statistical power of studies in the neurosciences is very low. The consequences of this include overestimates of effect size and low reproducibility of results. There are also ethical dimensions to this problem, as unreliable research is inefficient and wasteful. Improving reproducibility in neuroscience is a key priority and requires attention to well-established but often ignored methodological principles. ANALYSIS NATURE REVIEWS | NEUROSCIENCE VOLUME 14 | MAY 2013 | 365 © 2013 Macmillan Publishers Limited. All rights reserved First, low power, by definition, means that the chance of discovering effects that are genuinely true is low. That is, low-powered studies produce more false negatives than high-powered studies. When studies in a given field are designed with a power of 20%, it means that if there are 100 genuine non-null effects to be discovered in that field, these studies are expected to discover only 20 ofthem 11 . Second, the lower the power of a study, the lower the probability that an observed effect that passes the required threshold of claiming its discovery (that is, reaching nominal statistical significance, such as p 0.05) actually reflects a true effect 1 , 12 . This probability is called the PPV of a claimed discovery. The formula linking the PPV to power is: where (1  ) is the power,  is the typeII error,  is the typeI error and R is the pre-study odds (that is, the odds that a probed effect is indeed non-null among the effects being probed). The formula is derived from a simple two-by-two table that tabulates the presence and non- presence of a non-null effect against significant and non-significant research findings 1 . The formula shows that, for studies with a given pre-study odds R, the lower the power and the higher the typeI error, the lower the PPV. And for studies with a given pre-study odds R and a given typeI error (for example, the tra - ditional p = 0.05 threshold), the lower the power, the lower thePPV. For example, suppose that we work in a scientific field in which one in five of the effects we test are expected to be truly non-null (that is, R = 1 / (5 – 1) = 0.25) and that we claim to have discovered an effect when we reach p 0.05; if our studies have 20% power, then PPV = 0.20 × 0.25 / (0.20 × 0.25 + 0.05) = 0.05 / 0.10 = 0.50; that is, only half of our claims for discoveries will be correct. If our studies have 80% power, then PPV = 0.80 × 0.25 / (0.80 × 0.25 + 0.05) = 0.20 / 0.25 = 0.80; that is, 80% of our claims for discoveries will be correct. Third, even when an underpowered study discovers a true effect, it is likely that the estimate of the magnitude of that effect provided by that study will be exaggerated. This effect inflation is often referred to as the ‘winner’s curse’ 13 and is likely to occur whenever claims of discov - ery are based on thresholds of statistical significance (for example, p 0.05) or other selection filters (for example, a Bayes factor better than a given value or a false-discov - ery rate below a given value). Effect inflation is worst for small, low-powered studies, which can only detect effects that happen to be large. If, for example, the true effect is medium-sized, only those small studies that, by chance, overestimate the magnitude of the effect will pass the threshold for discovery. To illustrate the winner’s curse, suppose that an association truly exists with an effect size that is equivalent to an odds ratio of 1.20, and we are try - ing to discover it by performing a small (that is, under - powered) study. Suppose also that our study only has the power to detect an odds ratio of 1.20 on average 20% of the time. The results of any study are subject to sampling variation and random error in the measurements of the variables and outcomes of interest. Therefore, on aver - age, our small study will find an odds ratio of 1.20 but, because of random errors, our study may in fact find an odds ratio smaller than 1.20 (for example, 1.00) or an odds ratio larger than 1.20 (for example, 1.60). Odds ratios of 1.00 or 1.20 will not reach statistical significance because of the small sample size. We can only claim the association as nominally significant in the third case, where random Box 1 | Key statistical terms CAMARADES The Collaborative Approach to Meta-Analysis and Review of Animal Data from Experimental Studies ( CAMARADES ) is a collaboration that aims to reduce bias and improve the quality of methods and reporting in animal research. To this end, CAMARADES provides a resource for data sharing, aims to provide a web-based stratified meta-analysis bioinformatics engine and acts as a repository for completed reviews. Effect size An effect size is a standardized measure that quantifies the size of the difference between two groups or the strength of an association between two variables. As standardized measures, effect sizes allow estimates from different studies to be compared directly and also to be combined in meta-analyses. Excess significance Excess significance is the phenomenon whereby the published literature has an excess of statistically significant results that are due to biases in reporting. Several mechanisms contribute to reporting bias, including study publication bias, where the results of statistically non-significant (‘negative’) studies are left unpublished; selective outcome reporting bias, where null results are omitted; and selective analysis bias, where data are analysed with different methods that favour ‘positive’ results. Fixed and random effects A fixed-effect meta-analysis assumes that the underlying effect is the same (that is, fixed) in all studies and that any variation is due to sampling errors. By contrast, a random-effect meta-analysis does not require this assumption and allows for heterogeneity between studies. A test of heterogeneity in between-study effects is often used to test the fixed-effect assumption. Meta-analysis Meta-analysis refers to statistical methods for contrasting and combining results from different studies to provide more powerful estimates of the true effect size as opposed to a less precise effect size derived from a single study. Positive predictive value The positive predictive value (PPV) is the probability that a ‘positive’ research finding reflects a true effect (that is, the finding is a true positive). This probability of a research finding reflecting a true effect depends on the prior probability of it being true (before doing the study), the statistical power of the study and the level of statistical significance. Proteus phenomenon The Proteus phenomenon refers to the situation in which the first published study is often the most biased towards an extreme result (the winner’s curse). Subsequent replication studies tend to be less biased towards the extreme, often finding evidence of smaller effects or even contradicting the findings from the initial study. Statistical power The statistical power of a test is the probability that it will correctly reject the null hypothesis when the null hypothesis is false (that is, the probability of not committing a �V�[�R�G�|�+�+��G�T�T�Q�T��Q�T��O�C�M�K�P�I��C��H�C�N�U�G��P�G�I�C�V�K�X�G��F�G�E�K�U�K�Q�P� ���6�J�G��R�T�Q�D�C�D�K�N�K�V�[��Q�H��E�Q�O�O�K�V�V�K�P�I��C��V�[�R�G�|�+�+� error is referred to as the false negative rate (  ), and power is equal to 1 –  . Winner’s curse �6�J�G��Y�K�P�P�G�T�o�U��E�W�T�U�G��T�G�H�G�T�U��V�Q��V�J�G��R�J�G�P�Q�O�G�P�Q�P��Y�J�G�T�G�D�[��V�J�G��n�N�W�E�M�[�o��U�E�K�G�P�V�K�U�V��Y�J�Q��O�C�M�G�U��C� discovery is cursed by finding an inflated estimate of that effect. The winner’s curse occurs when thresholds, such as statistical significance, are used to determine the presence of an effect and is most severe when thresholds are stringent and studies are too small and thus have low power. Nature Reviews | Neuroscience PPV = ([1 – ] × R)  ([1 ] × R + ) ANALYSIS 366 | MAY 2013 | VOLUME 14 www.nature.com/reviews/neuro © 2013 Macmillan Publishers Limited. All rights reserved Nature Reviews | Neuroscience Rejecting the null hypothesis a 1.96 x sem Null �1�D�U�G�T�X�G�F��G-�G�E�V� �R�| = 0.05 1.96 x sem The sampling distribution b Increasing statistical power c 1.96 x sem error creates an odds ratio of 1.60. The winner’s curse means, therefore, that the ‘lucky’ scientist who makes the discovery in a small study is cursed by finding an inflatedeffect. The winner’s curse can also affect the design and con - clusions of replication studies. If the original estimate of the effect is inflated (for example, an odds ratio of 1.60), then replication studies will tend to show smaller effect sizes (for example, 1.20), as findings converge on the true effect. By performing more replication studies, we should eventually arrive at the more accurate odds ratio of 1.20, but this may take time or may never happen if we only perform small studies. A common misconception is that a replication study will have sufficient power to replicate an initial finding if the sample size is similar to that in the original study 14 . However, a study that tries to replicate a significant effect that only barely achieved nominal statistical significance (that is, p ~ 0.05) and that uses the same sample size as the original study, will only achieve ~50% power, even if the original study accurately estimated the true effect size. This is illustrated in FIG.1 . Many published studies only barely achieve nominal sta - tistical significance 15 . This means that if researchers in a particular field determine their sample sizes by historical precedent rather than through formal power calculation, this will place an upper limit on average power within that field. As the true effect size is likely to be smaller than that indicated by the initial study — for example, because of the winner’s curse — the actual power is likely to be much lower. Furthermore, even if power calcula - tion is used to estimate the sample size that is necessary in a replication study, these calculations will be overly optimistic if they are based on estimates of the true effect size that are inflated owing to the winner’s curse phenomenon. This will further hamper the replication process. Low power in the presence of other biases Low power is associated with several additional biases. First, low-powered studies are more likely to pro - vide a wide range of estimates of the magnitude of an effect (which is known as ‘vibration of effects’ and is described below). Second, publication bias, selective data analysis and selective reporting of outcomes are more likely to affect low-powered studies. Third, small studies may be of lower quality in other aspects of their design as well. These factors can further exacerbate the low reliability of evidence obtained in studies with low statisticalpower. Vibration of effects 13 refers to the situation in which a study obtains different estimates of the magnitude of the effect depending on the analytical options it imple - ments. These options could include the statistical model, the definition of the variables of interest, the use (or not) of adjustments for certain potential confounders but not others, the use of filters to include or exclude specific observations and so on. For example, a recent analysis of 241 functional MRI (fMRI) studies showed that 223 unique analysis strategies were observed so that almost no strategy occurred more than once 16 . Results can vary markedly depending on the analysis strategy 1 . This is more often the case for small studies — here, results can change easily as a result of even minor analytical manipu - lations. In small studies, the range of results that can be obtained owing to vibration of effects is wider than in larger studies, because the results are more uncertain and therefore fluctuate more in response to analytical changes. Imagine, for example, dropping three observations from the analysis of a study of 12 samples because post-hoc they are considered unsatisfactory; this manipulation may not even be mentioned in the published paper, which Figure 1 | Statistical power of a replication study. a | If a study finds evidence for an effect at p = 0.05, then the difference between the mean of the null distribution (indicated by the solid blue curve) and the mean of the observed distribution (dashed blue curve) is 1.96 × sem. b | Studies attempting to replicate an effect using the same sample size as that of the original study would have roughly the same sampling variation (that is, sem) as in the original study. Assuming, as one might in a power calculation, that the initially observed effect we are trying to replicate reflects the true effect, the potential distribution of these replication effect estimates would be similar to the distribution of the original study (dashed green curve). A study attempting to replicate a nominally significant effect ( p ~ 0.05), which uses the same sample size as the original study, would therefore have (on average) a 50% chance of rejecting the null hypothesis (indicated by the coloured area under the green curve) and thus only 50% statistical power. c | We can increase the power of the replication study (coloured area under the orange curve) by increasing the sample size so as to reduce the sem. Powering a replication study adequately (that is, �C�E�J�K�G�X�K�P�I��C��R�Q�Y�G�T�q � ���� ��V�J�G�T�G�H�Q�T�G��Q�H�V�G�P��T�G�S�W�K�T�G�U��C��N�C�T�I�G�T� sample size than the original study, and a power calculation will help to decide the required size of the replication sample. ANALYSIS NATURE REVIEWS | NEUROSCIENCE VOLUME 14 | MAY 2013 | 367 © 2013 Macmillan Publishers Limited. All rights reserved Nature Reviews | Neuroscience �4�G�E�Q�T�F�U��K�F�G�P�V�K.�G�F��V�J�T�Q�W�I�J� �F�C�V�C�D�C�U�G��U�G�C�T�E�J� ( n = 246) �#�F�F�K�V�K�Q�P�C�N��T�G�E�Q�T�F�U��K�F�G�P�V�K.�G�F� �V�J�T�Q�W�I�J��Q�V�J�G�T��U�Q�W�T�E�G�U� ( n = 0) �4�G�E�Q�T�F�U��C�G�T� �F�W�R�N�K�E�C�V�G�U��T�G�O�Q�X�G�F ( n = 246) Abstracts screened ( n = 246) �'�Z�E�N�W�F�G�F ( n = 73) �(�W�N�N��V�G�Z�V��C�T�V�K�E�N�G�U��U�E�T�G�G�P�G�F� ( n = 173) �'�Z�E�N�W�F�G�F ( n = 82) �'�Z�E�N�W�F�G�F ( n = 43) �(�W�N�N��V�G�Z�V��C�T�V�K�E�N�G�U��C�U�U�G�U�U�G�F� �H�Q�T��G�N�K�I�K�D�K�N�K�V�[� ( n = 91) �#�T�V�K�E�N�G�U��K�P�E�N�W�F�G�F��K�P��C�P�C�N�[�U�K�U� ( n = 48) may simply report that only nine patients were studied. A manipulation affecting only three observations could change the odds ratio from 1.00 to 1.50 in a small study but might only change it from 1.00 to 1.01 in a very large study. When investigators select the most favourable, interesting, significant or promising results among a wide spectrum of estimates of effect magnitudes, this is inevi - tably a biasedchoice. Publication bias and selective reporting of outcomes and analyses are also more likely to affect smaller, under - powered studies 17 . Indeed, investigations into publication bias often examine whether small studies yield different results than larger ones 18 . Smaller studies more readily disappear into a file drawer than very large studies that are widely known and visible, and the results of which are eagerly anticipated (although this correlation is far from perfect). A ‘negative’ result in a high-powered study can - not be explained away as being due to low power 19 , 20 , and thus reviewers and editors may be more willing to pub - lish it, whereas they more easily reject a small ‘negative’ study as being inconclusive or uninformative 21 . The pro - tocols of large studies are also more likely to have been registered or otherwise made publicly available, so that deviations in the analysis plans and choice of outcomes may become obvious more easily. Small studies, con - versely, are often subject to a higher level of exploration of their results and selective reporting thereof. Third, smaller studies may have a worse design quality than larger studies. Several small studies may be oppor - tunistic experiments, or the data collection and analysis may have been conducted with little planning. Conversely, large studies often require more funding and personnel resources. As a consequence, designs are examined more carefully before data collection, and analysis and reporting may be more structured. This relationship is not absolute — small studies are not always of low quality. Indeed, a bias in favour of small studies may occur if the small stud - ies are meticulously designed and collect high-quality data (and therefore are forced to be small) and if large studies ignore or drop quality checks in an effort to include as large a sample as possible. Empirical evidence from neuroscience Any attempt to establish the average statistical power in neuroscience is hampered by the problem that the true effect sizes are not known. One solution to this problem is to use data from meta-analyses. Meta-analysis pro - vides the best estimate of the true effect size, albeit with limitations, including the limitation that the individual studies that contribute to a meta-analysis are themselves subject to the problems described above. If anything, summary effects from meta-analyses, including power estimates calculated from meta-analysis results, may also be modestly inflated 22 . Acknowledging this caveat, in order to estimate sta - tistical power in neuroscience, we examined neurosci - ence meta-analyses published in 2011 that were retrieved using ‘neuroscience’ and ‘meta-analysis’ as search terms. Using the reported summary effects of the meta-analy - ses as the estimate of the true effects, we calculated the power of each individual study to detect the effect indi - cated by the corresponding meta-analysis. Methods. Included in our analysis were articles published in 2011 that described at least one meta-analysis of previ - ously published studies in neuroscience with a summary effect estimate (mean difference or odds/risk ratio) as well as study level data on group sample size and, for odds/risk ratios, the number of events in the controlgroup. We searched computerized databases on 2February 2012 via Web of Science for articles published in 2011, using the key words ‘neuroscience’ and ‘meta-analysis’. All of the articles that were identified via this electronic search were screened independently for suitability by two authors (K.S.B. and M.R.M.). Articles were excluded if no abstract was electronically available (for example, confer - ence proceedings and commentaries) or if both authors agreed, on the basis of the abstract, that a meta-analysis had not been conducted. Full texts were obtained for the remaining articles and again independently assessed for eligibility by two authors (K.S.B. and M.R.M.) ( FIG.2 ) . Figure 2 | Flow diagram of articles selected for inclusion. Computerized �F�C�V�C�D�C�U�G�U��Y�G�T�G��U�G�C�T�E�J�G�F��Q�P���|�(�G�D�T�W�C�T�[�������X�K�C��9�G�D��Q�H��5�E�K�G�P�E�G��H�Q�T��R�C�R�G�T�U��R�W�D�N�K�U�J�G�F��K�P� 2011, using the key words ‘neuroscience’ and ‘meta-analysis’. Two authors (K.S.B. and M.R.M.) independently screened all of the papers that were identified for suitability ( n = 246). Articles were excluded if no abstract was electronically available (for example, conference proceedings and commentaries) or if both authors agreed, on the basis of the abstract, that a meta-analysis had not been conducted. Full texts were obtained for the remaining articles ( n = 173) and again independently assessed for eligibility by K. S.B. and M.R.M. Articles were excluded ( n � � � ��� ��K�H��D�Q�V�J��C�W�V�J�Q�T�U��C�I�T�G�G�F���Q�P��V�J�G��D�C�U�K�U��Q�H��V�J�G��H�W�N�N� text, that a meta-analysis had not been conducted. The remaining articles ( n = 91) were assessed in detail by K.S.B. and M.R.M. or C.M. Articles were excluded at this stage if they could not provide the following data for extraction for at least one meta-analysis: first author and summary effect size estimate of the meta-analysis; and first author, publication year, sample size (by groups) and number of events in the control group (for odds/risk ratios) of the contributing studies. Data extraction was performed independently by K.S.B. and M.R.M. or C.M. and verified collaboratively. In total, n � � � ��� articles were included in the analysis. ANALYSIS 368 | MAY 2013 | VOLUME 14 www.nature.com/reviews/neuro © 2013 Macmillan Publishers Limited. All rights reserved Data were extracted from forest plots, tables and text. Some articles reported several meta-analyses. In those cases, we included multiple meta-analyses only if they contained distinct study samples. If several meta-analyses had overlapping study samples, we selected the most com - prehensive (that is, the one containing the most studies) or, if the number of studies was equal, the first analysis presented in the article. Data extraction was indepen - dently performed by K.S.B. and either M.R.M. or C.M. and verified collaboratively. The following data were extracted for each meta- analysis: first author and summary effect size estimate of the meta-analysis; and first author, publication year, sample size (by groups), number of events in the control group (for odds/risk ratios) and nominal significance ( p 0.05, ‘yes/no’) of the contributing studies. For five articles, nominal study significance was unavailable and was therefore obtained from the original studies if they were electronically available. Studies with missing data (for example, due to unclear reporting) were excluded from the analysis. The main outcome measure of our analysis was the achieved power of each individual study to detect the estimated summary effect reported in the corresponding meta-analysis to which it contributed, assuming an  level of 5%. Power was calculated using G*Power software 23 . We then calculated the mean and median statistical power across all studies. Results. Our search strategy identified 246 articles pub - lished in 2011, out of which 155 were excluded after an initial screening of either the abstract or the full text. Of the remaining 91 articles, 48 were eligible for inclusion in our analysis 24–71 , comprising data from 49 meta-analyses and 730 individual primary studies. A flow chart of the article selection process is shown in FIG.2 , and the characteristics of included meta-analyses are described in TABLE1 . Our results indicate that the median statistical power in neuroscience is 21%. We also applied a test for an excess of statistical significance 72 . This test has recently been used to show that there is an excess significance bias in the literature of various fields, including in studies of brain volume abnormalities 73 , Alzheimer’s disease genet - ics 70 , 74 and cancer biomarkers 75 . The test revealed that the actual number (349) of nominally significant studies in our analysis was significantly higher than the number expected (254; p 0.0001). Importantly, these calcula - tions assume that the summary effect size reported in each study is close to the true effect size, but it is likely that they are inflated owing to publication and other biases describedabove. Interestingly, across the 49 meta-analyses included in our analysis, the average power demonstrated a clear bimodal distribution ( FIG.3 ) . Most meta-analyses com - prised studies with very low average power — almost 50% of studies had an average power lower than 20%. However, seven meta-analyses comprised studies with hig�h (90%) average power 24 , 26 , 31 , 5 7 , 63 , 68 , 71 . These seven meta-analyses were all broadly neurological in focus and were based on relatively small contributing studies — four out of the seven meta-analyses did not include any study with over 80 participants. If we exclude these ‘outlying’ meta-analyses, the median statistical power falls to 18%. Small sample sizes are appropriate if the true effects being estimated are genuinely large enough to be reliably observed in such samples. However, as small studies are particularly susceptible to inflated effect size estimates and publication bias, it is difficult to be confident in the evi - dence for a large effect if small studies are the sole source of that evidence. Moreover, many meta-analyses show small-study effects on asymmetry tests (that is, smaller studies have larger effect sizes than larger ones) but never - theless use random-effect calculations, and this is known to inflate the estimate of summary effects (and thus also the power estimates). Therefore, our power calculations are likely to be extremely optimistic 76 . Empirical evidence from specific fields One limitation of our analysis is the under-representation of meta-analyses in particular subfields of neuroscience, such as research using neuroimaging and animal mod - els. We therefore sought additional representative meta- analyses from these fields outside our 2011 sampling frame to determine whether a similar pattern of low statistical power would be observed. Neuroimaging studies. Most structural and volumetric MRI studies are very small and have minimal power to detect differences between compared groups (for example, healthy people versus those with mental health diseases). A cl ear excess significance bias has been dem - onstrated in studies of brain volume abnormalities 73 , and similar problems appear to exist in fMRI studies of the blood-oxygen-level-dependent response 77 . In order to establish the average statistical power of stud - ies of brain volume abnormalities, we applied the same analysis as described above to data that had been pre - viously extracted to assess the presence of an excess of significance bias 73 . Our results indicated that the median statistical power of these studies was 8% across 461 indi - vidual studies contributing to 41 separate meta-analyses, which were drawn from eight articles that were published between 2006 and 2009. Full methodological details describing how studies were identified and selected are available elsewhere 73 . Animal model studies. Previous analyses of studies using animal models have shown that small studies consist - ently give more favourable (that is, ‘positive’) results than larger studies 78 and that study quality is inversely related to effect size 79–82 . In order to examine the average power in neuroscience studies using animal models, we chose a representative meta-analysis that combined data from studies investigating sex differences in water maze per - formance (number of studies ( k ) = 19, summary effect size Cohen’s d = 0.49) and radial maze performance ( k = 21, summary effect size d = 0.69) 80 . The summary effect sizes in the two meta-analyses provide evidence for medium to large effects, with the male and female per - formance differing by 0.49 to 0.69 standard deviations ANALYSIS NATURE REVIEWS | NEUROSCIENCE VOLUME 14 | MAY 2013 | 369 © 2013 Macmillan Publishers Limited. All rights reserved Table 1 | Characteristics of included meta-analyses First author of study k N Summary effect size Power Refs Median (range) Cohen’s d OR Random or fixed effects Median (range) Babbage 13 ���� ���s��� �s���� Random ������ �����s������ 24 Bai �� ����� ���s����� 1.47 Random ������ �����s����� 25 Bjorkhem-Bergman 6 ���� ���s��� �s���� Random ������ �����s����� 26 Bucossi 21 ���� ���s���� 0.41 Random ������ �����s����� 27 Chamberlain 11 ���� ���s���� �s����� NA ������ �����s����� �� Chang 56 ���� ���s���� �s���� Random ������ �����s����� 29 Chang 6 ������� ����s����� ���� Fixed ������ �����s����� 30 Chen 12 ������ ����s������ 0.60 Random ������ �����s����� 31 Chung 11 ����� ����s���� 0.67 Fixed ������ �����s����� 32 Domellof 14 ������� ���s����� 2.12 Random ������ �����s����� 33 Etminan 14 ����� ���s���� ���� Random ������ �����s����� 34 Feng 4 ����� ����s����� 1.20 Fixed ������ �����s����� 35 Green 17 ���� ���s���� �s���� Random ������ �����s����� 36 Han 14 ����� ���s����� 1.35 Random ������ ������s����� 37 Hannestad 13 ���� ���s���� �s���� Random ������ �����s����� �� Hua 27 ����� ����s����� 1.13 Random ������ �����s����� 39 Lindson � ����� ���s����� 1.05 Fixed ������ �����s����� 40 Liu 12 ����� ����s����� 1.04 Fixed ������ �����s����� 41 Lui 6 ������ �����s����� ���� Fixed ������ �����s����� 42 MacKillop 57 ���� ���s���� ���� Fixed ������ �����s����� 43 Maneeton 5 ���� ���s���� 1.67* Random ������ �����s����� 44 Ohi 6 ����� ����s����� 1.12 Fixed ������� �����s����� 45 Olabi 14 ������ ���s���� �s���� Random ������ �����s����� 46 Oldershaw 10 ������ ���s���� �s���� Random ������ �����s����� 47 Oliver 7 ����� ���s���� ���� Fixed ������ �����s����� �� Peerbooms 36 ����� ���s����� 1.26 Random ������ �����s����� 49 Pizzagalli 22 ���� ��s��� 0.92 Random ������ �����s����� 50 Rist 5 ����� ���s���� 2.06 Random ������ �����s����� 51 Sexton � ���� ���s���� 0.43 Fixed ������ �����s����� 52 Shum 11 ���� ���s���� ���� Fixed ������ �����s����� 53 Sim 2 ���� ���s��� 1.23* Random ������ �����s����� 54 Song 12 ���� ���s���� 0.15 NA ������ �����s����� 55 Sun 6 ������� ����s���� 1.93 Fixed ������ �����s����� 56 Tian 4 ���� ���s��� 1.26 NA ������ �����s����� 57 Trzesniak 11 ������ ���s���� ���� Random ������ �����s����� �� Veehof � ������ ���s���� 0.37 Fixed ������ �����s����� 59 Vergouwen 24 ����� ���s����� ���� Random ������ �����s����� 60 Vieta 10 ����� ����s���� ����� Random ������ �����s����� 61 Wisdom 53 ����� ���s����� �s���� NA ������ �����s����� 62 Witteman 26 ���� ���s��� �s���� Random ������ �����s����� 63 Woon 24 ���� ��s��� �s���� Random ������ �����s����� 64 Xuan 20 ������� ����s����� 1.00 Random ������ �����s����� 65 Yang (cohort) 14 ����� ����s����� ����� Random ������ �����s����� 66 Yang (case control) 7 ����� ���s���� ���� Random ������ �����s����� 66 ANALYSIS 370 | MAY 2013 | VOLUME 14 www.nature.com/reviews/neuro © 2013 Macmillan Publishers Limited. All rights reserved Nature Reviews | Neuroscience N 16 14 12 10 8 6 4 2 0 31–40 11–20 Power (%) 0–10 21–30 41–50 51–60 61–70 71–80 81–90 91–100 % 30 25 20 15 10 5 0 for water maze and radial maze, respectively. Our results indicate that the median statistical power for the water maze studies and the radial maze studies to detect these medium to large effects was 18% and 31%, respectively ( TABLE2 ) . The average sample size in these studies was 22 animals for the water maze and 24 for the radial maze experiments. Studies of this size can only detect very large effects ( d = 1.20 for n = 22, and d = 1.26 for n = 24) with 80% power — far larger than those indicated by the meta-analyses. These animal model studies were therefore severely underpowered to detect the summary effects indicated by the meta-analyses. Furthermore, the summary effects are likely to be inflated estimates of the true effects, given the problems associated with small studies describedabove. The results described in this section are based on only two meta-analyses, and we should be appropriately cautious in extrapolating from this limited evidence. Nevertheless, it is notable that the results are so con - sistent with those observed in other fields, such as the neuroimaging and neuroscience studies that we have describedabove. Implications Implications for the likelihood that a research finding reflects a true effect. Our results indicate that the aver - age statistical power of studies in the field of neurosci - ence is probably no more than between ~8% and ~31%, on the basis of evidence from diverse subfields within neuro-science. If the low average power we observed across these studies is typical of the neuroscience lit - erature as a whole, this has profound implications for the field. A major implication is that the likelihood that any nominally significant finding actually reflects a true effect is small. As explained above, the probability that a research finding reflects a true effect (PPV) decreases as statistical power decreases for any given pre-study odds (R) and a fixed typeI error level. It is easy to show the impact that this is likely to have on the reliability of findings. FIGURE4 shows how the PPV changes for a range of values for R and for a range of v alues for the average power in a field. For effects that are genuinely non-null, FIG.5 shows the degree to which an effect size estimate is likely to be inflated in initial studies — owing to the winner’s curse phenomenon — for a range of values for statisticalpower. The estimates shown in FIGS4,5 are likely to be opti - mistic, however, because they assume that statistical power and R are the only considerations in determin - ing the probability that a research finding reflects a true effect. As we have already discussed, several other biases are also likely to reduce the probability that a research finding reflects a true effect. Moreover, the summary effect size estimates that we used to determine the statis - tical power of individual studies are themselves likely to be inflated owing to bias — our excess of significance test provided clear evidence for this. Therefore, the average statistical power of studies in our analysis may in fact be even lower than the 8–31% range we observed. Ethical implications. Low average power in neuro - science studies also has ethical implications. In our analysis of animal model studies, the average sample size of 22 animals for the water maze experiments was only sufficient to detect an effect size of d = 1.26 with Table 1 (cont.) | Characteristics of included meta-analyses Study k N Summary effect size Power Refs Median (range) Cohen’s d OR Random or fixed effects Median (range) Yang 3 ���� ���s���� 0.67 NA ������ �����s����� 67 Yuan 14 ������� ���s����� ���� Fixed ������ �����s����� �� Zafar � ������ ���s���� 1.07* Random ������ �����s����� 69 Zhang 12 ������� ���s���� 1.27 Random ������� �����s����� 70 Zhu � ����� ���s���� ���� Random ������ �����s����� 71 The choice of fixed or random effects model was made by the original authors of the meta-analysis. k , number of studies; NA, not �C�X�C�K�N�C�D�N�G���1�4���Q�F�F�U��T�C�V�K�Q��� � �K�P�F�K�E�C�V�G�U��V�J�G��T�G�N�C�V�K�X�G��T�K�U�M� Figure 3 | Median power of studies included in neuroscience meta-analyses. The figure shows a histogram of median study power calculated for each of the n = 49 meta-analyses included in our analysis, with the number of meta-analyses ( N ) on the left axis and percent of meta-analyses (%) on the right axis. There is a clear bimodal distribution; n = 15 (31%) of the meta-analyses comprised studies with median power of less than 11%, whereas n = 7 (14%) comprised studies with high average power in excess of 90%. Despite this bimodality, most meta-analyses comprised studies with low statistical power: n � � � ���� ���� ��J�C�F��O�G�F�K�C�P��U�V�W�F�[��R�Q�Y�G�T��Q�H��N�G�U�U��V�J�C�P� 31%. The meta-analyses ( n = 7) that comprised studies with high average power in excess of 90% had their broadly neurological subject matter in common. ANALYSIS NATURE REVIEWS | NEUROSCIENCE VOLUME 14 | MAY 2013 | 371 © 2013 Macmillan Publishers Limited. All rights reserved Nature Reviews | Neuroscience Post-study probability (%) 100 80 60 40 20 0 0.4 1.0 0.2 0.6 Pre-study odds R 0 0.8 80% power 30% power 10% power 80% power, and the average sample size of 24 animals for the radial maze experiments was only sufficient to detect an effect size of d = 1.20. In order to achieve 80% power to detect, in a single study, the most probable true effects as indicated by the meta-analysis, a sample size of 134 animals would be required for the water maze experiment (assuming an effect size of d = 0.49) and 68 animals for the radial maze experiment (assuming an effect size of d = 0.69); to achieve 95% power, these sample sizes would need to increase to 220 and 112, respectively. What is particularly striking, however, is the inefficiency of a continued reliance on small sample sizes. Despite the apparently large numbers of animals required to achieve acceptable statistical power in these experiments, the total numbers of animals actually used in the studies contributing to the meta-analyses were even larger: 420 for the water maze experiments and 514 for the radial maze experiments. There is ongoing debate regarding the appropriate balance to strike between using as few animals as possi - ble in experiments and the need to obtain robust, reliable findings. We argue that it is important to appreciate the waste associated with an underpowered study — even a study that achieves only 80% power still presents a 20% possibility that the animals have been sacrificed with - out the study detecting the underlying true effect. If the average power in neuroscience animal model studies is between 20–30%, as we observed in our analysis above, the ethical implications areclear. Low power therefore has an ethical dimension — unreliable research is inefficient and wasteful. This applies to both human and animal research. The principles of the ‘three Rs’ in animal research (reduce, refine and replace) 83 require appropriate experimental design and statistics — both too many and too few animals present an issue as they reduce the value of research outputs. A require - ment for sample size and power calculation is included in the Animal Research: Reporting InVivo Experiments (ARRIVE) guidelines 84 , but such calculations require a clear appreciation of the expected magnitude of effects beingsought. Of course, it is also wasteful to continue data col - lection once it is clear that the effect being sought does not exist or is too small to be of interest. That is, studies are not just wasteful when they stop too early, they are also wasteful when they stop too late. Planned, sequen - tial analyses are sometimes used in large clinical trials when there is considerable expense or potential harm associated with testing participants. Clinical trials may be stopped prematurely in the case of serious adverse effects, clear beneficial effects (in which case it would be unethical to continue to allocate participants to a placebo condition) or if the interim effects are so unimpressive that any prospect of a positive result with the planned sample size is extremely unlikely 85 . Within a significance testing framework, such interim analyses — and the pro - tocol for stopping — must be planned for the assump - tions of significance testing to hold. Concerns have been raised as to whether stopping trials early is ever justified given the tendency for such a practice to produce inflated effect size estimates 86 . Furthermore, the decision process around stopping is not often fully disclosed, increasing the scope for researcher degrees of freedom 86 . Alternative approaches exist. For example, within a Bayesian frame - work, one can monitor the Bayes factor and simply stop testing when the evidence is conclusive or when resources Figure 4 | Positive predictive value as a function of the pre-study odds of association for different levels of statistical power. The probability that a research finding reflects a true effect — also known as the positive predictive value (PPV) — depends on both the pre-study odds of the effect being true (the ratio R of ‘true effects’ over ‘null effects’ in the scientific field) and the study’s statistical power. The PPV can be calculated for given �X�C�N�W�G�U��Q�H��U�V�C�V�K�U�V�K�E�C�N��R�Q�Y�G�T�� ���s�  ) , pre-study odds ratio (R) �C�P�F��V�[�R�G�|�+��G�T�T�Q�T��T�C�V�G��  � ���W�U�K�P�I��V�J�G��H�Q�T�O�W�N�C��2�2�8 � � � � �=���s�  ] × R) `�� �=�h  ] × R +  ). The median statistical power of studies in the neuroscience field is optimistically estimated to be �D�G�V�Y�G�G�P��`����C�P�F��`������6�J�G��H�K�I�W�T�G��K�N�N�W�U�V�T�C�V�G�U��J�Q�Y��N�Q�Y� statistical power consistent with this estimated range (that is, between 10% and 30%) detrimentally affects the association between the probability that a finding reflects a true effect (PPV) and pre-study odds, assuming  = 0.05. Compared with conditions of appropriate statistical �R�Q�Y�G�T�� �V�J�C�V��K�U������ ���V�J�G��R�T�Q�D�C�D�K�N�K�V�[��V�J�C�V��C��T�G�U�G�C�T�E�J��H�K�P�F�K�P�I� reflects a true effect is greatly reduced for 10% and 30% power, especially if pre-study odds are low. Notably, in an exploratory research field such as much of neuroscience, the pre-study odds are often low. Table 2 | Sample size required to detect sex differences in water maze and radial maze performance Total animals used Required N per study Typical N per study Detectable effect for typical N 80% power 95% power Mean Median 80% power 95% power Water maze 420 134 220 22 20 d = 1.26 d = 1.62 Radial maze 514 �� 112 24 20 d = 1.20 d = 1.54 Meta-analysis indicated an effect size of Cohen’s d = 0.49 for water maze studies and d = 0.69 for radial maze studies. ANALYSIS 372 | MAY 2013 | VOLUME 14 www.nature.com/reviews/neuro © 2013 Macmillan Publishers Limited. All rights reserved Nature Reviews | Neuroscience �4�G�N�C�V�K�X�G��D�K�C�U��Q�H��T�G�U�G�C�T�E�J�.�P�F�K�P�I�� �� 100 80 60 40 20 0 40 100 20 60 0 80 �5�V�C�V�K�U�V�K�E�C�N��R�Q�Y�G�T��Q�H��U�V�W�F�[�� �� are expended 87 . Similarly, adopting conservative priors can substantially reduce the likelihood of claiming that an effect exists when in fact it does not 85 . At present, significance testing remains the dominant framework within neuroscience, but the flexibility of alternative (for example, Bayesian) approaches means that they should be taken seriously by thefield. Conclusions and future directions A consequence of the remarkable growth in neurosci - ence over the past 50years has been that the effects we now seek in our experiments are often smaller and more subtle than before as opposed to when mostly easily dis - cernible ‘low-hanging fruit’ were targeted. At the same time, computational analysis of very large datasets is now relatively straightforward, so that an enormous number of tests can be run in a short time on the same dataset. These dramatic advances in the flexibility of research design and analysis have occurred without accompanying changes to other aspects of research design, particularly power. For example, the average sample size has not changed sub - stantially over time 88 despite the fact that neuroscientists are likely to be pursuing smaller effects. The increase in research flexibility and the complexity of study designs 89 combined with the stability of sample size and search for increasingly subtle effects has a disquieting consequence: a dramatic increase in the likelihood that statistically sig - nificant findings are spurious. This may be at the root of the recent replication failures in the preclinical literature 8 and the correspondingly poor translation of these findings into humans 90 . Low power is a problem in practice because of the normative publishing standards for producing novel, significant, clean results and the ubiquity of null hypothesis significance testing as the means of evaluat - ing the truth of research findings. As we have shown, these factors result in biases that are exacerbated by low power. Ultimately, these biases reduce the reproducibil - ity of neuroscience findings and negatively affect the validity of the accumulated findings. Unfortunately, publishing and reporting practices are unlikely to change rapidly. Nonetheless, existing scientific practices can be improved with small changes or additions that approximate key features of the idealized model 4 , 91 , 92 . We provide a summary of recommendations for future research practice in BOX2 . Increasing disclosure. False positives occur more fre - quently and go unnoticed when degrees of freedom in data analysis and reporting are undisclosed 5 . Researchers can improve confidence in published reports by noting in the text: “We report how we determined our sample size, all data exclusions, all data manipulations, and all measures in the study.” 7 When such a statement is not possible, disclosure of the rationale and justification of deviations from what should be common practice (that is, reporting sample size, data exclusions, manipula - tions and measures) will improve readers’ understand - ing and interpretation of the reported effects and, therefore, of what level of confidence in the reported effects is appropriate. In clinical trials, there is an increasing requirement to adhere to the Consolidated Standards of Reporting Trials ( CONSORT ), and the same is true for systematic reviews and meta-analyses, for which the Preferred Reporting Items for Systematic Reviews and Meta-Analyses ( PRISMA ) guidelines are now being adopted. A number of reporting guidelines have been produced for application to diverse study designs and tools, and an updated list is maintained by the EQUATOR Network 93 . A ten-item checklist of study quality has been developed by the Collaborative Approach to Meta-Analysis and Review of Animal Data in Experimental Stroke ( CAMARADES ), but to the best of our knowledge, this checklist is not yet widely used in primary studies. Figure 5 | The winner’s curse: effect size inflation as a function of statistical power. The winner’s curse refers to the phenomenon that studies that find evidence of an effect often provide inflated estimates of the size of that effect. Such inflation is expected when an effect has to pass a certain threshold — such as reaching statistical significance — in order for it to have been ‘discovered’. Effect inflation is worst for small, low-powered studies, which can only detect effects that happen to be large. If, for example, the true effect is medium-sized, only those small studies that, by chance, estimate the effect to be large will pass the threshold for discovery (that is, the threshold for statistical significance, which is typically set at p 0.05). In practice, this means that research findings of small studies are biased in favour of inflated effects. By contrast, large, high-powered studies can readily detect both small and large effects and so are less biased, as both over- and underestimations of the true effect size will pass the threshold for ‘discovery’. We optimistically estimate the median statistical power of �U�V�W�F�K�G�U��K�P��V�J�G��P�G�W�T�Q�U�E�K�G�P�E�G��H�K�G�N�F��V�Q��D�G��D�G�V�Y�G�G�P��`����C�P�F� ~31%. The figure shows simulations of the winner’s curse (expressed on the y - axis as relative bias of research findings). These simulations suggest that initial effect �G�U�V�K�O�C�V�G�U��H�T�Q�O��U�V�W�F�K�G�U��R�Q�Y�G�T�G�F��D�G�V�Y�G�G�P��`�����C�P�F��`���� are likely to be inflated by 25% to 50% (shown by the arrows in the figure). Inflated effect estimates make it difficult to determine an adequate sample size for �T�G�R�N�K�E�C�V�K�Q�P��U�V�W�F�K�G�U���K�P�E�T�G�C�U�K�P�I��V�J�G��R�T�Q�D�C�D�K�N�K�V�[��Q�H��V�[�R�G�|�+�+� errors. Figure is modified, with permission, from REF. 103 © (2007) Cell Press. ANALYSIS NATURE REVIEWS | NEUROSCIENCE VOLUME 14 | MAY 2013 | 373 © 2013 Macmillan Publishers Limited. All rights reserved Registration of confirmatory analysis plan. Both explor - atory and confirmatory research strategies are legiti - mate and useful. However, presenting the result of an exploratory analysis as if it arose from a confirmatory test inflates the chance that the result is a false positive. In particular, p - values lose their diagnostic value if they are not the result of a pre-specified analysis plan for which all results are reported. Pre-registration — and, ultimately, full reporting of analysis plans — clarifies the distinction between confirmatory and explora - tory analysis, encourages well-powered studies (at least in the case of confirmatory analyses) and reduces the file-drawer effect. These subsequently reduce the likeli - hood of false positive accumulation. The Open Science Framework ( OSF ) offers a registration mechanism for scientific research. For observational studies, it would be useful to register datasets in detail, so that one can be aware of how extensive the multiplicity and complexity of analyses canbe 94 . Improving availability of materials and data. Making research materials available will improve the quality of studies aimed at replicating and extending research findings. Making raw data available will improve data aggregation methods and confidence in reported results. There are multiple repositories for making data more widely available, such as The Dataverse Network Project and Dryad ) for data in general and others such as OpenfMRI , INDI and OASIS for neuroimag - ing data in particular. Also, commercial repositories (for example, figshare ) offer means for sharing data and other research materials. Finally, the OSF offers infrastructure for documenting, archiving and sharing data within collaborative teams and also making some or all of those research materials publicly available. Leading journals are increasingly adopting policies for making data, protocols and analytical codes available, at least for some types of studies. However, these poli - cies are uncommonly adhered to 95 , and thus the ability for independent experts to repeat published analysis remainslow 96 . Incentivizing replication. Weak incentives for conduct - ing and publishing replications are a threat to identifying false positives and accumulating precise estimates of research findings. There are many ways to alter repli - cation incentives 97 . For example, journals could offer a submission option for registered replications of impor - tant research results (see, for example, a possible new submission format for Cortex 98 ). Groups of researchers can also collaborate on performing one or many replica - tions to increase the total sample size (and therefore the statistical power) achieved while minimizing the labour and resource impact on any one contributor. Adoption of the gold standard of large-scale collaborative con - sortia and extensive replication in fields such as human genome epidemiology has transformed the reliability of the produced findings. Although previously almost all of the proposed candidate gene associations from small studies were false 99 (with some exceptions 100 ), col - laborative consortia have substantially improved power, and the replicated results can be considered highly reli - able. In another example, in the field of psychology, the Reproducibility Project is a collaboration of more than 100 researchers aiming to estimate the reproducibility of psychological science by replicating a large sample of studies published in 2008 in three psychology journals 92 . Each individual research study contributes just a small portion of time and effort, but the combined effect is substantial both for accumulating replications and for generating an empirical estimate of reproducibility. Concluding remarks. Small, low-powered studies are endemic in neuroscience. Nevertheless, there are reasons to be optimistic. Some fields are confronting the prob - lem of the poor reliability of research findings that arises from low-powered studies. For example, in genetic epi - demiology sample sizes increased dramatically with the widespread understanding that the effects being sought are likely to be extremely small. This, together with an increasing requirement for strong statistical evidence and independent replication, has resulted in far more reliable results. Moreover, the pressure for emphasiz - ing significant results is not absolute. For example, the Proteus phenomenon 101 suggests that refuting early results can be attractive in fields in which data can be produced rapidly. Nevertheless, we should not assume that science is effectively or efficiently self-correcting 102 . There is now substantial evidence that a large propor - tion of the evidence reported in the scientific literature may be unreliable. Acknowledging this challenge is the first step towards addressing the problematic aspects of current scientific practices and identifying effective solutions. Box 2 | Recommendations for researchers �2�G�T�H�Q�T�O��C�P��C�|�R�T�K�Q�T�K��R�Q�Y�G�T��E�C�N�E�W�N�C�V�K�Q�P �7�U�G��V�J�G��G�Z�K�U�V�K�P�I��N�K�V�G�T�C�V�W�T�G��V�Q��G�U�V�K�O�C�V�G��V�J�G��U�K�\�G��Q�H��G�H�H�G�E�V��[�Q�W��C�T�G��N�Q�Q�M�K�P�I��H�Q�T��C�P�F��F�G�U�K�I�P� �[�Q�W�T��U�V�W�F�[��C�E�E�Q�T�F�K�P�I�N�[���+�H��V�K�O�G��Q�T��H�K�P�C�P�E�K�C�N��E�Q�P�U�V�T�C�K�P�V�U��O�G�C�P��[�Q�W�T��U�V�W�F�[��K�U� �W�P�F�G�T�R�Q�Y�G�T�G�F���O�C�M�G��V�J�K�U��E�N�G�C�T��C�P�F��C�E�M�P�Q�Y�N�G�F�I�G��V�J�K�U��N�K�O�K�V�C�V�K�Q�P�� �Q�T��N�K�O�K�V�C�V�K�Q�P�U� ��K�P��V�J�G� interpretation of your results. Disclose methods and findings transparently �+�H��V�J�G��K�P�V�G�P�F�G�F��C�P�C�N�[�U�G�U��R�T�Q�F�W�E�G��P�W�N�N��H�K�P�F�K�P�I�U��C�P�F��[�Q�W��O�Q�X�G��Q�P��V�Q��G�Z�R�N�Q�T�G��[�Q�W�T��F�C�V�C��K�P� �Q�V�J�G�T��Y�C�[�U���U�C�[��U�Q���0�W�N�N��H�K�P�F�K�P�I�U��N�Q�E�M�G�F��K�P��H�K�N�G��F�T�C�Y�G�T�U��D�K�C�U��V�J�G��N�K�V�G�T�C�V�W�T�G���Y�J�G�T�G�C�U� �G�Z�R�N�Q�T�C�V�Q�T�[��C�P�C�N�[�U�G�U��C�T�G��Q�P�N�[��W�U�G�H�W�N��C�P�F��X�C�N�K�F��K�H��[�Q�W��C�E�M�P�Q�Y�N�G�F�I�G��V�J�G��E�C�X�G�C�V�U��C�P�F� limitations. Pre-register your study protocol and analysis plan Pre-registration clarifies whether analyses are confirmatory or exploratory, encourages well-powered studies and reduces opportunities for non-transparent data mining and selective reporting. Various mechanisms for this exist (for example, the Open Science �(�T�C�O�G�Y�Q�T�M ). Make study materials and data available �/�C�M�K�P�I��T�G�U�G�C�T�E�J��O�C�V�G�T�K�C�N�U��C�X�C�K�N�C�D�N�G��Y�K�N�N��K�O�R�T�Q�X�G��V�J�G��S�W�C�N�K�V�[��Q�H��U�V�W�F�K�G�U��C�K�O�G�F��C�V� �T�G�R�N�K�E�C�V�K�P�I��C�P�F��G�Z�V�G�P�F�K�P�I��T�G�U�G�C�T�E�J��H�K�P�F�K�P�I�U���/�C�M�K�P�I��T�C�Y��F�C�V�C��C�X�C�K�N�C�D�N�G��Y�K�N�N��G�P�J�C�P�E�G� �Q�R�R�Q�T�V�W�P�K�V�K�G�U��H�Q�T��F�C�V�C��C�I�I�T�G�I�C�V�K�Q�P��C�P�F��O�G�V�C��C�P�C�N�[�U�K�U���C�P�F��C�N�N�Q�Y��G�Z�V�G�T�P�C�N��E�J�G�E�M�K�P�I��Q�H� analyses and results. Work collaboratively to increase power and replicate findings Combining data increases the total sample size (and therefore power) while minimizing the labour and resource impact on any one contributor. Large-scale collaborative consortia in fields such as human genetic epidemiology have transformed the reliability of findings in these fields. ANALYSIS 374 | MAY 2013 | VOLUME 14 www.nature.com/reviews/neuro © 2013 Macmillan Publishers Limited. All rights reserved 1. Ioannidis,J.P. Why most published research findings are false. PLoS Med. 2 , e124 (2005). This study demonstrates that many (and possibly most) of the conclusions drawn from biomedical research are probably false. The reasons for this include using flexible study designs and flexible statistical analyses and running small studies with low statistical power. 2. Fanelli,D. Negative results are disappearing from most disciplines and countries. Scientometrics 90 , 891–904 (2012). 3. Greenwald,A.G. Consequences of prejudice against the null hypothesis. Psychol. Bull. 82 , 1–20 (1975). 4. Nosek,B.A., Spies,J.R. & Motyl,M. Scientific utopia: II. Restructuring incentives and practices to promote truth over publishability. Perspect. Psychol. Sci. 7 , 615–631 (2012). 5. Simmons,J.P., Nelson,L.D. & Simonsohn,U. False- positive psychology: undisclosed flexibility in data collection and analysis allows presenting anything as significant. Psychol. Sci. 22 , 1359–1366 (2011). This article empirically illustrates that flexible study designs and data analysis dramatically increase the possibility of obtaining a nominally significant result. However, conclusions drawn from these results are almost certainly false. 6. Sullivan,P.F. Spurious genetic associations. Biol. Psychiatry 61 , 1121–1126 (2007). 7. Begley, C. G. & Ellis, L. M. Drug development: raise standards for preclinical cancer research. Nature 483 , 531–533 (2012). 8. Prinz,F., Schlange,T. & Asadullah,K. Believe it or not: how much can we rely on published data on potential drug targets? Nature Rev. Drug Discov. 10 , 712 (2011). 9. Fang,F.C. & Casadevall,A. Retracted science and the retraction index. Infect. Immun. 79 , 3855–3859 (2011). 10. Munafo,M.R., Stothart,G. & Flint,J. Bias in genetic association studies and impact factor. Mol. Psychiatry 14 , 119–120 (2009). 11. Sterne,J.A. & Davey Smith,G. Sifting the evidence — what’s wrong with significance tests? BMJ 322 , 226–231 (2001). 12. Ioannidis,J.P.A., Tarone,R. & McLaughlin,J.K. The false-positive to false-negative ratio in epidemiologic studies. Epidemiology 22 , 450–456 (2011). 13. Ioannidis,J.P.A. Why most discovered true associations are inflated. Epidemiology 19 , 640–648 (2008). 14. Tversky,A. & Kahneman,D. Belief in the law of small numbers. Psychol. Bull. 75 , 105–110 (1971). 15. Masicampo,E.J. & Lalande,D.R. A peculiar prevalence of p values just below .05. Q.J.Exp. Psychol. 65 , 2271–2279 (2012). 16. Carp,J. The secret lives of experiments: methods reporting in the fMRI literature. Neuroimage 63 , 289–300 (2012). This article reviews methods reporting and methodological choices across 241 recent fMRI studies and shows that there were nearly as many unique analytical pipelines as there were studies. In addition, many studies were underpowered to detect plausible effects. 17. Dwan,K. etal. Systematic review of the empirical evidence of study publication bias and outcome reporting bias. PLoS ONE 3 , e3081 (2008). 18. Sterne,J.A. etal. Recommendations for examining and interpreting funnel plot asymmetry in meta- analyses of randomised controlled trials. BMJ 343 , d4002 (2011). 19. Joy-Gaba,J.A. & Nosek,B.A. The surprisingly limited malleability of implicit racial evaluations. Soc. Psychol. 41 , 137–146 (2010). 20. Schmidt,K. & Nosek,B.A. Implicit (and explicit) racial attitudes barely changed during Barack Obama’s presidential campaign and early presidency. J.Exp. Soc. Psychol. 46 , 308–314 (2010). 21. Evangelou,E., Siontis,K.C., Pfeiffer,T. & Ioannidis,J.P. Perceived information gain from randomized trials correlates with publication in high- impact factor journals. J.Clin. Epidemiol. 65 , 1274–1281 (2012). 22. Pereira,T.V. & Ioannidis,J.P. Statistically significant meta-analyses of clinical trials have modest credibility and inflated effects. J.Clin. Epidemiol. 64 , 1060–1069 (2011). 23. Faul,F., Erdfelder,E., Lang,A.G. & Buchner,A. G*Power 3: a flexible statistical power analysis program for the social, behavioral, and biomedical sciences. Behav. Res. Methods 39 , 175–191 (2007). 24. Babbage,D.R. etal. Meta-analysis of facial affect recognition difficulties after traumatic brain injury. Neuropsychology 25 , 277–285 (2011). 25. Bai,H. Meta-analysis of 5, 10 - methylenetetrahydrofolate reductase gene poymorphism as a risk factor for ischemic cerebrovascular disease in a Chinese Han population. Neural Regen. Res. 6 , 277–285 (2011). 26. Bjorkhem-Bergman,L., Asplund,A.B. & Lindh,J.D. Metformin for weight reduction in non-diabetic patients on antipsychotic drugs: a systematic review and meta-analysis. J.Psychopharmacol. 25 , 299–305 (2011). 27. Bucossi,S. etal. Copper in Alzheimer’s disease: a meta-analysis of serum, plasma, and cerebrospinal fluid studies. J.Alzheimers Dis. 24 , 175–185 (2011). 28. Chamberlain,S.R. etal. Translational approaches to frontostriatal dysfunction in attention-deficit/ hyperactivity disorder using a computerized neuropsychological battery. Biol. Psychiatry 69 , 1192–1203 (2011). 29. Chang,W.P., Arfken,C.L., Sangal,M.P. & Boutros,N.N. Probing the relative contribution of the first and second responses to sensory gating indices: a meta-analysis. Psychophysiology 48 , 980–992 (2011). 30. Chang,X.L. etal. Functional parkin promoter polymorphism in Parkinson’s disease: new data and meta-analysis. J.Neurol. Sci. 302 , 68–71 (2011). 31. Chen,C. etal. Allergy and risk of glioma: a meta- analysis. Eur. J.Neurol. 18 , 387–395 (2011). 32. Chung,A.K. & Chua,S.E. Effects on prolongation of Bazett’s corrected QT interval of seven second- generation antipsychotics in the treatment of schizophrenia: a meta-analysis. J.Psychopharmacol. 25 , 646–666 (2011). 33. Domellof,E., Johansson,A.M. & Ronnqvist,L. Handedness in preterm born children: a systematic review and a meta-analysis. Neuropsychologia 49 , 2299–2310 (2011). 34. Etminan,N., Vergouwen,M.D., Ilodigwe,D. & Macdonald,R.L. Effect of pharmaceutical treatment on vasospasm, delayed cerebral ischemia, and clinical outcome in patients with aneurysmal subarachnoid hemorrhage: a systematic review and meta-analysis. J.Cereb. Blood Flow Metab. 31 , 1443–1451 (2011). 35. Feng,X.L. etal. Association of FK506 binding protein 5 ( FKBP5 ) gene rs4713916 polymorphism with mood disorders: a meta-analysis. Acta Neuropsychiatr. 23 , 12–19 (2011). 36. Green,M.J., Matheson,S.L., Shepherd,A., Weickert,C.S. & Carr,V.J. Brain-derived neurotrophic factor levels in schizophrenia: a systematic review with meta-analysis. Mol. Psychiatry 16 , 960–972 (2011). 37. Han,X.M., Wang,C.H., Sima,X. & Liu,S.Y. Interleukin - 6–74G/C polymorphism and the risk of Alzheimer’s disease in Caucasians: a meta-analysis. Neurosci. Lett. 504 , 4–8 (2011). 38. Hannestad,J., DellaGioia,N. & Bloch,M. The effect of antidepressant medication treatment on serum levels of inflammatory cytokines: a meta-analysis. Neuropsychopharmacology 36 , 2452–2459 (2011). 39. Hua,Y., Zhao,H., Kong,Y. & Ye,M. Association between the MTHFR gene and Alzheimer’s disease: a meta-analysis. Int. J.Neurosci. 121 , 462–471 (2011). 40. Lindson,N. & Aveyard,P. An updated meta-analysis of nicotine preloading for smoking cessation: investigating mediators of the effect. Psychopharmacology 214 , 579–592 (2011). 41. Liu,H. etal. Association of 5 - HTT gene polymorphisms with migraine: a systematic review and meta-analysis. J.Neurol. Sci. 305 , 57–66 (2011). 42. Liu,J. etal. PITX3 gene polymorphism is associated with Parkinson’s disease in Chinese population. Brain Res. 1392 , 116–120 (2011). 43. MacKillop,J. etal. Delayed reward discounting and addictive behavior: a meta-analysis. Psychopharmacology 216 , 305–321 (2011). 44. Maneeton,N., Maneeton,B.,Srisurapanont,M. & Martin,S.D. Bupropion for adults with attention- deficit hyperactivity disorder: meta-analysis of randomized, placebo-controlled trials. Psychiatry Clin. Neurosci. 65 , 611–617 (2011). 45. Ohi,K. etal. The SIGMAR1 gene is associated with a risk of schizophrenia and activation of the prefrontal cortex. Prog. Neuropsychopharmacol. Biol. Psychiatry 35 , 1309–1315 (2011). 46. Olabi,B. etal. Are there progressive brain changes in schizophrenia? A meta-analysis of structural magnetic resonance imaging studies. Biol. Psychiatry 70 , 88–96 (2011). 47. Oldershaw,A. etal. The socio-emotional processing stream in Anorexia Nervosa. Neurosci. Biobehav. Rev. 35 , 970–988 (2011). 48. Oliver,B.J., Kohli,E. & Kasper,L.H. Interferon therapy in relapsing-remitting multiple sclerosis: a systematic review and meta-analysis of the comparative trials. J.Neurol. Sci. 302 , 96–105 (2011). 49. Peerbooms,O.L. etal. Meta-analysis of MTHFR gene variants in schizophrenia, bipolar disorder and unipolar depressive disorder: evidence for a common genetic vulnerability? Brain Behav. Immun. 25 , 1530–1543 (2011). 50. Pizzagalli,D.A. Frontocingulate dysfunction in depression: toward biomarkers of treatment response. Neuropsychopharmacology 36 , 183–206 (2011). 51. Rist,P.M., Diener,H.C., Kurth,T. & Schurks,M. Migraine, migraine aura, and cervical artery dissection: a systematic review and meta-analysis. Cephalalgia 31 , 886–896 (2011). 52. Sexton,C.E., Kalu,U.G., Filippini,N., Mackay,C.E. & Ebmeier,K.P. A meta-analysis of diffusion tensor imaging in mild cognitive impairment and Alzheimer’s disease. Neurobiol. Aging 32 , 2322.e5–2322.e18 (2011). 53. Shum,D., Levin,H. & Chan,R.C. Prospective memory in patients with closed head injury: a review. Neuropsychologia 49 , 2156–2165 (2011). 54. Sim,H. etal. Acupuncture for carpal tunnel syndrome: a systematic review of randomized controlled trials. J.Pain 12 , 307–314 (2011). 55. Song,F. etal. Meta-analysis of plasma amyloid-  levels in Alzheimer’s disease. J.Alzheimers Dis. 26 , 365–375 (2011). 56. Sun,Q.L. etal. Correlation of E - selectin gene polymorphisms with risk of ischemic stroke A meta- analysis. Neural Regen. Res. 6 , 1731–1735 (2011). 57. Tian,Y., Kang,L.G., Wang,H.Y. & Liu,Z.Y. Meta- analysis of transcranial magnetic stimulation to treat post-stroke dysfunction. Neural Regen. Res. 6 , 1736–1741 (2011). 58. Trzesniak,C. etal. Adhesio interthalamica alterations in schizophrenia spectrum disorders: a systematic review and meta-analysis. Prog. Neuropsychopharmacol. Biol. Psychiatry 35 , 877–886 (2011). 59. Veehof,M.M., Oskam,M.J., Schreurs,K.M. & Bohlmeijer,E.T. Acceptance-based interventions for the treatment of chronic pain: a systematic review and meta-analysis. Pain 152 , 533–542 (2011). 60. Vergouwen,M.D., Etminan,N., Ilodigwe,D. & Macdonald,R.L. Lower incidence of cerebral infarction correlates with improved functional outcome after aneurysmal subarachnoid hemorrhage. J.Cereb. Blood Flow Metab. 31 , 1545–1553 (2011). 61. Vieta,E. etal. Effectiveness of psychotropic medications in the maintenance phase of bipolar disorder: a meta- analysis of randomized controlled trials. Int. J.Neuropsychopharmacol. 14 , 1029–1049 (2011). 62. Wisdom,N.M., Callahan,J.L. & Hawkins,K.A. The effects of apolipoprotein E on non-impaired cognitive functioning: a meta-analysis. Neurobiol. Aging 32 , 63–74 (2011). 63. Witteman,J., van Ijzendoorn,M.H., van de Velde,D., van Heuven,V.J. & Schiller,N.O. The nature of hemispheric specialization for linguistic and emotional prosodic perception: a meta-analysis of the lesion literature. Neuropsychologia 49 , 3722–3738 (2011). 64. Woon,F. & Hedges,D.W. Gender does not moderate hippocampal volume deficits in adults with posttraumatic stress disorder: a meta-analysis. Hippocampus 21 , 243–252 (2011). 65. Xuan,C. etal. No association between APOE  4 allele and multiple sclerosis susceptibility: a meta-analysis from 5472 cases and 4727 controls. J.Neurol. Sci. 308 , 110–116 (2011). 66. Yang,W.M., Kong,F.Y., Liu,M. & Hao,Z.L. Systematic review of risk factors for progressive ischemic stroke. Neural Regen. Res. 6 , 346–352 (2011). 67. Yang,Z., Li,W.J., Huang,T., Chen,J.M. & Zhang,X. Meta-analysis of Ginkgo biloba extract for the treatment of Alzheimer’s disease. Neural Regen. Res. 6 , 1125–1129 (2011). 68. Yuan,H. etal. Meta-analysis of tau genetic polymorphism and sporadic progressive supranuclear palsy susceptibility. Neural Regen. Res. 6 , 353–359 (2011). 69. Zafar,S.N., Iqbal,A., Farez,M.F., Kamatkar,S. & de Moya,M.A. Intensive insulin therapy in brain injury: a meta-analysis. J.Neurotrauma 28 , 1307–1317 (2011). ANALYSIS NATURE REVIEWS | NEUROSCIENCE VOLUME 14 | MAY 2013 | 375 © 2013 Macmillan Publishers Limited. All rights reserved 70. Zhang,Y.G. etal. The –1082G/A polymorphism in IL - 10 gene is associated with risk of Alzheimer’s disease: a meta-analysis. J.Neurol. Sci. 303 , 133–138 (2011). 71. Zhu,Y., He,Z.Y. & Liu,H.N. Meta-analysis of the relationship between homocysteine, vitamin B(12), folate, and multiple sclerosis. J.Clin. Neurosci. 18 , 933–938 (2011). 72. Ioannidis,J.P. & Trikalinos,T.A. An exploratory test for an excess of significant findings. Clin. Trials 4 , 245–253 (2007). This study describes a test that evaluates whether there is an excess of significant findings in the published literature. The number of expected studies with statistically significant results is estimated and compared against the number of observed significant studies. 73. Ioannidis,J.P. Excess significance bias in the literature on brain volume abnormalities. Arch. Gen. Psychiatry 68 , 773–780 (2011). 74. Pfeiffer,T., Bertram,L. & Ioannidis,J.P. Quantifying selective reporting and the Proteus phenomenon for multiple datasets with similar bias. PLoS ONE 6 , e18362 (2011). 75. Tsilidis,K.K., Papatheodorou,S.I., Evangelou,E. & Ioannidis,J.P. Evaluation of excess statistical significance in meta-analyses of 98 biomarker associations with cancer risk. J.Natl Cancer Inst. 104 , 1867–1878 (2012). 76. Ioannidis,J. Clarifications on the application and interpretation of the test for excess significance and its extensions. J.Math. Psychol. (in the press). 77. David,S.P. etal. Potential reporting bias in small fMRI studies of the brain. PLoS Biol. (in the press). 78. Sena,E.S., van der Worp,H.B., Bath,P.M., Howells,D.W. & Macleod,M.R. Publication bias in reports of animal stroke studies leads to major overstatement of efficacy. PLoS Biol. 8 , e1000344 (2010). 79. Ioannidis,J.P. Extrapolating from animals to humans. Sci. Transl. Med. 4 , 151ps15 (2012). 80. Jonasson,Z. Meta-analysis of sex differences in rodent models of learning and memory: a review of behavioral and biological data. Neurosci. Biobehav. Rev. 28 , 811–825 (2005). 81. Macleod,M.R. etal. Evidence for the efficacy of NXY - 059 in experimental focal cerebral ischaemia is confounded by study quality. Stroke 39 , 2824–2829 (2008). 82. Sena,E., van der Worp,H.B., Howells,D. & Macleod,M. How can we improve the pre-clinical development of drugs for stroke? Trends Neurosci. 30 , 433–439 (2007). 83. Russell,W.M.S. & Burch,R.L. The Principles of Humane Experimental Technique (Methuen, 1958). 84. Kilkenny,C., Browne,W.J., Cuthill,I.C., Emerson,M. & Altman,D.G. Improving bioscience research reporting: the ARRIVE guidelines for reporting animal research. PLoS Biol. 8 , e1000412 (2010). 85. Bassler,D., Montori,V.M., Briel,M., Glasziou,P. & Guyatt,G. Early stopping of randomized clinical trials for overt efficacy is problematic. J.Clin. Epidemiol. 61 , 241–246 (2008). 86. Montori,V.M. etal. Randomized trials stopped early for benefit: a systematic review. JAMA 294 , 2203–2209 (2005). 87. Berger,J.O. & Wolpert,R.L. The Likelihood Principle: A Review, Generalizations, and Statistical Implications (ed. Gupta,S.S.) (Institute of Mathematical Sciences, 1998). 88. Vesterinen,H.M. etal. Systematic survey of the design, statistical analysis, and reporting of studies published in the 2008 volume of the Journal of Cerebral Blood Flow and Metabolism . J.Cereb. Blood Flow Metab. 31 , 1064–1072 (2011). 89. Smith,R.A., Levine,T.R., Lachlan,K.A. & Fediuk,T.A. The high cost of complexity in experimental design and data analysis: type I and type II error rates in multiway ANOVA. Hum. Comm. Res. 28 , 515–530 (2002). 90. Perel,P. etal. Comparison of treatment effects between animal experiments and clinical trials: systematic review. BMJ 334 , 197 (2007). 91. Nosek,B.A. & Bar-Anan,Y. Scientific utopia: I. Opening scientific communication. Psychol. Inquiry 23 , 217–243 (2012). 92. Open-Science-Collaboration. An open, large-scale, collaborative effort to estimate the reproducibility of psychological science. Perspect. Psychol. Sci. 7 , 657–660 (2012). This article describes the Reproducibility Project — an open, large-scale, collaborative effort to systematically examine the rate and predictors of reproducibility in psychological science. This will allow the empirical rate of replication to be estimated. 93. Simera,I. etal. Transparent and accurate reporting increases reliability, utility, and impact of your research: reporting guidelines and the EQUATOR Network. BMC Med. 8 , 24 (2010). 94. Ioannidis,J.P. The importance of potential studies that have not existed and registration of observational data sets. JAMA 308 , 575–576 (2012). 95. Alsheikh-Ali,A.A., Qureshi,W., Al - Mallah,M.H. & Ioannidis,J.P. Public availability of published research data in high-impact journals. PLoS ONE 6 , e24357 (2011). 96. Ioannidis,J.P. etal. Repeatability of published microarray gene expression analyses. Nature Genet. 41 , 149–155 (2009). 97. Ioannidis,J.P. & Khoury,M.J. Improving validation practices in “omics” research. Science 334 , 1230–1232 (2011). 98. Chambers, C. D. Registered Reports : A new publishing initiative at Cortex . Cortex 49 , 609–610 (2013). 99. Ioannidis,J.P., Tarone,R. & McLaughlin,J.K. The false-positive to false-negative ratio in epidemiologic studies. Epidemiology 22 , 450–456 (2011). 100. Siontis,K.C., Patsopoulos,N.A. & Ioannidis,J.P. Replication of past candidate loci for common diseases and phenotypes in 100 genome-wide association studies. Eur. J.Hum. Genet. 18 , 832–837 (2010). 101. Ioannidis,J.P. & Trikalinos,T.A. Early extreme contradictory estimates may appear in published research: the Proteus phenomenon in molecular genetics research and randomized trials. J.Clin. Epidemiol. 58 , 543–549 (2005). 102. Ioannidis,J. Why science is not necessarily self- correcting. Perspect. Psychol. Sci. 7 , 645–654 (2012). 103. Zollner,S. & Pritchard,J.K. Overcoming the winner’s curse: estimating penetrance parameters from case- control data. Am. J.Hum. Genet. 80 , 605–615 (2007). Acknowledgements M.R.M. and K.S.B. are members of the UK Centre for Tobacco Control Studies, a UK Public Health Research Centre of Excellence. Funding from British Heart Foundation, Cancer Research UK, Economic and Social Research Council, Medical Research Council and the UK National Institute for Health Research, under the auspices of the UK Clinical Research Collaboration, is gratefully acknowledged. The authors are grateful to G. Lewis for his helpful comments. Competing interests statement The authors declare no competing financial interests. ANALYSIS 376 | MAY 2013 | VOLUME 14 www.nature.com/reviews/neuro FURTHER INFORMATION Marcus R. Munafò’s homepage: http://www.bris.ac.uk/ expsych/research/brain/targ/ CAMARADES: http://www.camarades.info/ CONSORT: http://www.consort-statement.org/ Dryad: http://dat adryad.org/ EQUATOR Network: http://www.equator-network.org/ figshare: http://figshare.com/ INDI: http://fcon_1000.projects.nitrc.org/ OASIS: http://www.oasis-open.org OpenfMRI: http://www.openfmri.org/ OSF: http://openscienceframework.org/ PRISMA: http://www.prisma-statement.org/ The Dataverse Network Project: http://thedata.org ALL LINKS ARE ACTIVE IN THE ONLINE PDF © 2013 Macmillan Publishers Limited. All rights reserved About theauthors Katherine S. Button received a Ph.D. in psychiatry from the University of Bristol, UK, in 2013. She now holds a Medical Research Council Centenary Award Fellowship in the School of Social and Community Medicine at the University of Bristol. Her research focuses on the cogni - tive mechanisms of anxiety and depression and exploring whether these represent treatment targets for cognitive bias modification. John P. A. Ioannidis received an M.D. and D.Sc. from the University of Athens, Greece. He is currently the C.F. Rehnborg Professor in Disease Prevention, Professor of Medicine, Professor of Health Research and Policy, and Professor of Statistics and Director of the Stanford Prevention Research Center at Stanford University, California, USA. He is interested in developing and applying new research methods and in the interdisciplinary enhancement of existing research methods for study design and analysis in biomedicine. He has worked extensively on issues of replication and reproducibility of research findings. Claire Mokrysz received an M.Sc. in neuropsychology from the University of Bristol in 2012. She is currently a Ph.D student at University College London, UK. Her research interests include the psychological mechanisms involved in the development and main - tenance of substance dependence and, in particular, the cognitive and neurobiological processes involved in the transition from rec - reational drug use to drug dependence. Brian A. Nosek received a Ph.D. in psychology from Yale University, New Haven, Connecticut, USA, in 2002 and is now Associate Professor in the Department of Psychology at the University of Virginia, Charlottesville, USA. He co - founded and directs Project Implicit (http:// projectimplicit.net/), an Internet-based multi-university collaboration of research and education about implicit cognition. His research inves - tigates the gap between values and practices — such as when behaviour is influenced by factors other than one’s intentions and goals. He also co - founded the Center for Open Science (http://centerforopenscience. org/) to develop infrastructure and create processes to improve open - ness, integrity and reproducibility in science. Jonathan Flint received an M.D. from the University of Oxford, UK, in 1988 and is now Wellcome Trust Principal Fellow and Honourary Consultant Psychiatrist and Michael Davys Professor of Neuroscience in the Wellcome Trust Centre for Human Genetics at the University of Oxford. His research investigates the genetic basis of common psychi - atric disorders, particularly the determination of the genetic basis of stress-related conditions such as anxiety and depression. This includes work both in animal models and in humans, given the similarity of the biology of fearfulness in rodents andhumans. Emma S. J. Robinson received a Ph.D. in psychopharmacology from the University of Bristol in 1999. She was awarded a Research Councils UK Academic Fellowship, which is co - funded by the British Pharmacological Society Integrative Pharmacology Fund, in 2005 and spent part of this working in the Department of Experimental Psychology at the University of Cambridge, UK. She is now Senior Lecturer at the University of Bristol, and is based in the School of Physiology and Pharmacology. Her research focuses on the neurobiol - ogy of cognitive and emotional behaviour in animal models and how these may be disrupted in psychiatric disorders. Marcus R. Munafò received a Ph.D. in psychology from the University of Southampton, UK, in 2000. He completed a postdoctoral fellowship at the University of Oxford and the University of Pennsylvania, Philadelphia, USA, and now directs the Tobacco and Alcohol Research Group at the University of Bristol (http://www.bris. ac.uk/expsych/research/brain/targ/), where he is Professor of Biological Psychology in the School of Experimental Psychology. His research focuses on the neurobiological and genetic basis for tobacco and alcohol use, including smoking cessation, and the role of emotion perception biases in mental health, including the therapeutic potential of modifica - tion of thesebiases. At-a-glance �r � Low statistical power undermines the purpose of scientific research; it reduces the chance of detecting a trueeffect. �r � Perhaps less intuitively, low power also reduces the likelihood that a statistically significant result reflects a trueeffect. �r � Empirically, we estimate the median statistical power of studies in the neurosciences is between ~8% and ~31%. �r � We discuss the consequences of such low statistical power, which include overestimates of effect size and low reproducibility of results. �r � There are ethical dimensions to the problem of low power; unreli - able research is inefficient and wasteful. �r � Improving reproducibility in neuroscience is a key priority and requires attention to well-established, but often ignored, methodo - logical principles. �r � We discuss how problems associated with low power can be addressed by adopting current best-practice and make clear recom - mendations for how to achievethis. TOCblurb 000 Power failure: why small sample size undermines the reliability of neuroscience �-�C�V�J�G�T�K�P�G��5��|�$�W�V�V�Q�P���,�Q�J�P��2��|�#��|�+�Q�C�P�P�K�F�K�U���%�N�C�K�T�G� �/�Q�M�T�[�U�\���$�T�K�C�P��#��|�0�Q�U�G�M���,�Q�P�C�V�J�C�P��(�N�K�P�V���'�O�O�C� �5��|�,��|�4�Q�D�K�P�U�Q�P��C�P�F��/�C�T�E�W�U��4��|�/�W�P�C�H�Î Low-powered studies lead to overestimates of effect size and low reproducibility of results. In this Analysis article, Munafò and colleagues show that the average statistical power of studies in the neurosciences is very low, discuss ethical implications of low-powered studies and provide recommendations to improve research practices. Subject categories Behaviour, Molecular Neuroscience, Neurogenetics, Neuroimaging, Methods, Statistics ONLINE ONLY © 2013 Macmillan Publishers Limited. All rights reserved