/
National Cooperative Highway Research Program National Cooperative Highway Research Program

National Cooperative Highway Research Program - PowerPoint Presentation

trish-goza
trish-goza . @trish-goza
Follow
393 views
Uploaded On 2017-09-16

National Cooperative Highway Research Program - PPT Presentation

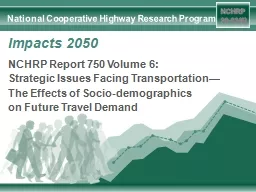
Impacts 2050 NCHRP Report 750 Volume 6 Strategic Issues Facing Transportation The Effects of Sociodemographics on Future Travel Demand End of the Car Culture The total number of miles driven in the US peaked in 2006 at 2647 trillion   ID: 588286

trends population labor impacts population trends impacts labor 2050 uncertainties vmt miles travel future force vehicle rate census scenario

Share:

Link:

Embed:

Download Presentation from below link

Download Presentation The PPT/PDF document "National Cooperative Highway Research Pr..." is the property of its rightful owner. Permission is granted to download and print the materials on this web site for personal, non-commercial use only, and to display it on your personal computer provided you do not modify the materials and that you retain all copyright notices contained in the materials. By downloading content from our website, you accept the terms of this agreement.


Presentation Transcript

Slide1

National Cooperative Highway Research Program

Impacts 2050

NCHRP Report 750 Volume 6:

Strategic Issues Facing Transportation—

The Effects of Socio-demographics

on Future Travel DemandSlide2

End of the Car Culture?

The total number of miles driven in the US peaked in 2006 at 2.647 trillion.  

In 2011, the total number of miles driven was 5% lower.  Miles driven per person and per vehicle peaked in 2004, and by 2011 had dropped by nearly 9% and 5%, respectively.

(UMTRI-2013-20 July 2013)

2Slide3

Long-Range Planning

As models are run further into future,

precision becomes challenging

Time

Uncertainty in exogenous inputs

Uncertainty in

model relationships

Variety of relationships that could be important

3Slide4

Socio-Demographic Trends

Driving Uncertainty

4Slide5

Next 100 Million

Trends, Impacts, Uncertainties

US population growing at higher rate than rest of world’s developed nations

Growth rate is slowing, but to what degree

Increase in total vehicle miles traveled (VMT)5

Projections of the Total Population for the U.S.: 2010-2050 (millions)

Source: U.S. Census Bureau, “The Next Four Decades, The Older Population in the U.S. 2010-2050.” Population Estimates and projections, P25-1138,

May 2010, pg.1. A http///www.census.gov/prod/2010publs/p2501138.pdfSlide6

Graying of America

Trends, Impacts, Uncertainties

Significant increase in population age 65+ due to Baby Boomers

How will Baby Boomers travel patterns change

Decrease in VMT per capitaDecrease in work tripsDecrease in transit useDecrease in vehicle ownership6

Percent of U.S. Population by Age Group, 1990-2010

Source: Brownell, Peter, Thomas Light, Paul Sorensen, Constantine Samaras,

Nidhi

Kalra

, and Jan

Osburg

. 2013. The Future of Mobility: Scenarios for the United States in 2030, Appendixes C–G. RAND Corporation, Santa Monica, CA. http://www.rand.org/pubs/research_reports/RR246Slide7

Browning of America

Trends, Impacts, Uncertainties

White, non-Hispanic share of

US population declining

Majority of America’s children

are of color

Increase in VMT per capita

Increase carpooling, walking,

public transit use

Increase in vehicle ageTravel behavior as people acculturate or are new mainstream

Future foreign-born percentPopulation by Race and Ethnicity(% of Total)7

Note: All races are non-Hispanic; American Indian/Alaska Native not shown.

Source: Passel, J., and D’V. Cohn. February 2008. U.S. Population Projections: 2005–2050. Pew Research Center, Washington, DC. http://pewhispanic.org/files/reports/85/pdf; Census Bureau 2011 population estimates.

Projected Slide8

Changing American Workforce

Trends, Impacts, Uncertainties

Workforce is growing older and

more diverse

Labor-force participation rate declining Decrease in VMT per capitaIncrease in work-related VMTLong-term effects of recession, technology on productivity, Hispanics on labor participation rate

Civilian Labor Force by Age

(Millions)

Source: BLS, Monthly Labor Review, December 2013;

Toossi

, M. December 2013. “Labor Force Projections to 2022:

The Labor Force Participation Rate Continues to Fall.” Monthly Labor Review. U.S. Department of Labor, Bureau of Labor Statistics. http://www.bls.gov/opub/mlr/2013/article/pdf/labor-force-projections-

to-2022-the-labor-force-participation-rate-continues-to-fall.pdf

8Slide9

Blurring City and Suburb

Trends, Impacts, Uncertainties

Both cities and suburbs home to employers and residences

Inner-ring suburbs having

density changes similar to center cityDecrease in VMT per capitaIncrease in non-motorized tripsIncrease in transit tripsLong-term demand forsuburban urbanity

9

Map by Zara Matheson, Martin Prosperity Institute

Data Source: http://www.brookings.edu/papers/2007/1128_walkableurbanisim_leinberger.aspxSlide10

Slow Growth in Households

Trends, Impacts, Uncertainties

10

Marriage rates are declining, depressing household formation and households with children

Increasing numbers of Americans are living in someone else’s home Influence of economic recession and Millennial lifestageDecrease in VMT per capitaDecrease in auto ownership

Increase in car pooling

Increase in transit useSlide11

Generation C

Trends, Impacts, Uncertainties

Demand for connected devices

Gen C = hyperlinked

Super-Cs spent entire lives with digital devices Decrease in VMT per capitaDecrease in auto ownershipWhat will be transportation

needs and expectations of Super-Cs?

11Slide12

Salience of Environment

Trends, Impacts, Uncertainties

Stronger sense of concern for environment among Millennials than other generations

Influence of Millennial’s lifestage

Decrease in VMT per capitaDecrease in auto ownershipIncrease non-motorized mode useIncrease in transit useTrends in Per-Capita Vehicle-Miles Traveled and Real Gross Domestic Product

12

Vehicle-miles traveled: see note 2; population statistics: U.S. Census Bureau,

Historical Population Estimates,

downloaded from www.census.gov/ popest/data/historical/index.html (for 1970-2011), and U.S. Census Bureau,

Statistical Abstract of the United States,

2003, Table HS-1 (1936-1969);

gross domestic product (chained 2005 dollars): U.S. Bureau of Economic Analysis,

Current-Dollar and “Real” Gross Domestic Product (Excel spreadsheet), 29

November 2012.Slide13

What is the Impact…

Conflicting

Evolving

Incomplete

of these

Trends on Future Travel Demand?

13Slide14

Our Approach: Impacts 2050

Tool for applying scenario approach for handling uncertainty

4 Scenarios for visioning the future

System dynamics model that represents links between population, land use, employment, and travel behavior

Enables users to:Examine socio-demographic trends and impact on travel demandBe in position to account for these trends in forecasts and plansExamine policy or other interventions that might offset trends14Slide15

Impacts 2050: 4 Scenarios

15Slide16

Impacts 2050: System Dynamics Model

16Slide17

User-Friendly Spreadsheet Model

17Slide18

Impacts 2050: Scenario Worksheets

18Slide19

Momentum Scenario: Atlanta

Year

2000

2010

2020

2030

2040

2050

Population

4,247,982

5,615,248

6,865,803

8,097723

9,319,548

10,562,745

Population by Age Group

19Slide20

Momentum Scenario: Atlanta

Daily Work Trips by Mode

20Slide21

Gentle Footprint Scenario: Atlanta

Year

2000

2010

2020

2030

2040

2050

Population

4,247,982

5,615,248

6,667,274

7,517,999

8,222.798

8,711,951

Population by Age Group

21Slide22

Gentle Footprint Scenario: Atlanta

Daily Work Trips by Mode

22Slide23

Enhanced Planning Approach

23Slide24

Doing Better Long-Range Planning

Study products prompt change in thinking

Output is less important than process of interacting with model

Future reality is better understood by exploring multiple plausible future scenarios

Shift to thinking strategically which is more aligned with 21st century types of problems and environments 24Slide25

Full Report

(

NCHRP Report 750 Volume 6: Strategic Issues Facing Transportation—

The Effects of Socio-demographics on Future Travel Demand

)Research BriefImpacts 2050 ToolImpacts 2050 User GuideHow to Obtain Research Products

25