/
Oct 26, 2009 Oct 26, 2009

Oct 26, 2009 - PowerPoint Presentation

trish-goza
trish-goza . @trish-goza
Follow
366 views
Uploaded On 2017-01-23

Oct 26, 2009 - PPT Presentation

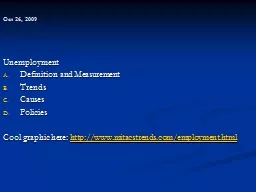
Unemployment Definition and Measurement Trends Causes Policies Cool graphic here http wwwmitacstrendscomemploymenthtml Payroll Employment 19402009 How to Calculate Unemployment Rate ID: 513100

2009 unemployment rate employment unemployment 2009 employment rate www 154 1940 payroll people adult http trends male teens 138

Share:

Link:

Embed:

Download Presentation from below link

Download Presentation The PPT/PDF document "Oct 26, 2009" is the property of its rightful owner. Permission is granted to download and print the materials on this web site for personal, non-commercial use only, and to display it on your personal computer provided you do not modify the materials and that you retain all copyright notices contained in the materials. By downloading content from our website, you accept the terms of this agreement.


Presentation Transcript

Slide1

Oct 26, 2009

Unemployment

Definition and Measurement

Trends

Causes

Policies

Cool

graphic here:

http://

www.mitacstrends.com/employment.htmlSlide2

Payroll Employment 1940-2009Slide3

How to Calculate Unemployment Rate

Yes

No

Yes

NoSlide4

September 2009 Employment and Unemployment

Labor Force

154.0

million

Employed People

138.9

millionUnemployed People 15.1 million15.1/(138.9+15.1)=15.1/(154) = 9.8%

Source: http://www.bls.gov/news.release/empsit.nr0.htmSlide5

Sept 09 Selected Unemployment Rates

All 9.8%

Adult Men

10.3%

Adult Women 7.8%

Black Male Teens 16-19 50.4%White Male Teens 16-10 26.6%Slide6

Education, Unemployment, and EarningsSlide7

Unemployment Rate 1948-2009Slide8

Recent Unemployment TrendsSlide9

In a Recession, Unemployment is LongerSlide10
Slide11
Slide12
Slide13
Slide14

Payroll Employment 1940-2009Slide15
Slide16
Slide17

Participation Rate Rose 1965-2009Slide18
Slide19

Union MembershipSlide20