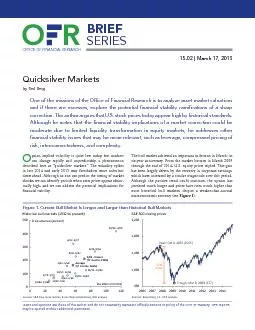
/
OFR Brief Series OFR Brief Series

OFR Brief Series - PDF document

trish-goza
trish-goza . @trish-goza
Follow
376 views
Uploaded On 2015-11-10

OFR Brief Series - PPT Presentation

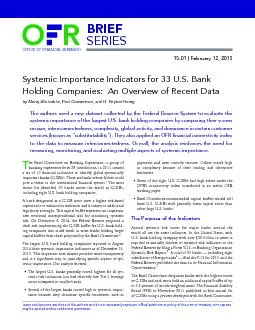
February 2015 Page 2 e committee in July 2013 updated the methodology it uses to calculate a systemic risk score for each bank and released the latest scores on November 6 2014 6 Based on thei ID: 188972

February 2015 Page 2 e

Share:

Link:

Embed:

Download Presentation from below link

Download Pdf The PPT/PDF document "OFR Brief Series" is the property of its rightful owner. Permission is granted to download and print the materials on this web site for personal, non-commercial use only, and to display it on your personal computer provided you do not modify the materials and that you retain all copyright notices contained in the materials. By downloading content from our website, you accept the terms of this agreement.


Presentation Transcript

OFR Brief Series February 2015 | Page 2 e committee in July 2013 updated the methodology it uses to calculate a systemic risk score for each bank and released the latest scores on November 6, 2014. 6 Based on their 2013 scores, the 30 banks would be required to hold extra capital of 1 percentage point to 2.5 percentage points under the Basel Committee methodology. 7 As noted, the Federal Reserve proposed potential alternative requirements with respect to funding which could result in even higher cap - ital buers for some U.S. bank holding companies. e Basel Committee suggests that national regulators phase in G-SIB capital buers beginning in January 2016. e systemic risk indicators are grouped into ve categories, as shown across the top of Figure 1 . Each category has a total weight of 20 percent divided equally among its indicators. 8 A description of the ve categories and their indicators follows. Size. is category has a single indicator, a comprehensive measure showing a bank’s total exposures. e indicator reects total assets plus the net value of certain securities nancing transactions plus credit derivatives and commitments as well as counterparty risk exposures. is measure of size is also used to calculate a bank’s supplementary leverage ratio under the Basel III international banking accord. (Basel III established a supple - mentary leverage ratio requiring large banks to hold Tier 1 cap - ital of at least 3 percent of total exposures to absorb losses; the U.S. rule set the ratio at 5 percent for bank holding companies.) Interconnectedness. e failure of a bank to meet payment obligations to other banks can accelerate the spread of a nan - cial system shock if the bank is highly interconnected. is category includes measurements of a bank’s total claims on the nancial system, its total liabilities to the nancial system, Bank Holding Company (stock ID) Size Interconnectedness Substitutability Complexity Cross- Jurisdictional Activity 2013 Score (percent) Total exposures Intranancial system assets Intranancial system liabilities Securities outstanding Payments activity Assets under custody Underwriting activity Amount of OTC derivatives Adjusted trading and AFS securities Level 3 assets Foreign claims Total cross-jurisdictional liabilities Weight (percent) 20 6.7 6.7 6.7 6.7 6.7 6.7 6.7 6.7 6.7 10 10 JPMorgan Chase & Co. (JPM) 3,570 422 544 599 321,458 21,320 508 68,004 446 69 693 674 5.05 Citigroup Inc. (C) 2,895 421 513 596 300,783 11,096 331 59,472 130 46 839 742 4.27 Bank of America Corp. (BAC) 2,696 294 220 489 83,705 136 390 54,887 203 32 387 246 3.06 Wells Fargo & Co. (WFC) 1,961 110 129 508 28,761 2,400 86 4,880 128 37 70 130 1.72 Goldman Sachs Group, Inc. (GS) 1,518 337 107 310 9,585 866 371 50,355 138 43 347 319 2.48 Morgan Stanley (MS) 1,283 535 182 231 9,812 1,369 262 43,611 316 23 353 470 2.60 U.S. Bancorp (USB) 525 11 22 139 6,918 959 17 106 13 4 3 34 0.35 PNC Financial Services (PNC) 425 18 13 68 2,004 161 10 252 26 11 5 2 0.30 Bank of New York Mellon Corp. (BK) 410 79 230 61 166,279 23,590 6 1,158 39 0 87 164 1.50 HSBC N.A. Holdings Inc. (HSBC) 406 36 55 50 1,061 43 49 5,194 40 4 43 1 0.38 State Street Corp. (STT) 345 30 209 43 59,122 20,411 - 1,141 54 8 47 125 1.48 Capital One Financial Corp. (COF) 336 14 2 94 914 3 2 63 16 4 9 2 0.19 Notes: This list shows BHCs with assets over $250 billion. The eight gray-shaded BHCs were G-SIBs as of 2013. HSBC North America is a holding company for the U.S. operations of HSBC Holdings, plc, incorporated in the United Kingdom. Sources: Company Y-15 reports, OFR analysis Figure 1. Systemic Importance Indicators Reported by Large U.S. Bank Holding Companies ($ billions) Systemic risk scores are based on size, interconnectedness, substitutability, complexity, and cross-jurisdictional activities OFR Brief Series February 2015 | Page 3 score for substitutability at 5 percent, in keeping with the Basel procedure. 11 Of the 33 U.S. banks, the eight designated as G-SIBs in 2012 had the highest systemic importance scores in 2013. JPMorgan Chase & Co. had the highest score at 5.05 percent, followed by Citigroup Inc. (4.27 percent), Bank of America Corp. (3.06 per - cent), Morgan Stanley (2.60 percent), Goldman Sachs Group, Inc. (2.48 percent), and Wells Fargo & Co. (1.72 percent). e eight U.S. G-SIBs already have sucient capital to meet their risk-based capital ratios, inclusive of the Basel G-SIB buer on a fully phased-in basis. Even so, their Tier 1 leverage ratios, which are not risk-weighted, remain below those of large U.S. banks that are not G-SIBs. Figure 2 illustrates that banks with higher overall G-SIB systemic importance scores tended to have lower Tier 1 leverage ratios than the median large non-G-SIB. Figure 2. Tier 1 Leverage Ratios (percent) Peer banks that are not G-SIBs have a higher median Tier 1 leverage ratio of close to 10 percent JPMBACCWFCGSMSUSBBKPNCHSBCCOFSTT048 1216 012345 6Sources: Federal Reserve BHC Performance Reports, OFR analysis Median leverage rao for large non-G-SIB banksTier 1 Leverage Rao (percent)Systemicimportancescore and the total value of debt and equity securities issued by a bank. For the rst two of these indicators, the nancial system includes banks, securities dealers, insurance companies, mutual funds, hedge funds, pension funds, investment banks, and cen - tral counterparties. Substitutability. A bank is more systemically important if it provides important services that customers would have dif - culty replacing if the bank failed. ree indicators measure this eect: a bank’s payments activity, assets under custody at the bank, and the bank’s total underwriting transactions. 9 e Basel Committee methodology applies a cap to the substitut - ability categories when the indicators are combined into an overall score. e draft U.S. rule would take the higher of the Basel Committee methodology or an alternative methodology which replaces the substitutability component with a score based on banks’ short-term wholesale funding usage, eectively giving substitutability indicators a zero weight in determining a bank’s G-SIB buer. Complexity. A bank with highly complex operations is more dicult to resolve and has a broader impact if it fails. Complexity is measured by a bank’s notional amount of over- the-counter (OTC) derivatives; total amount of trading and available-for-sale securities; and total illiquid and hard-to-value assets, which are also known as Level 3 assets. Cross-Jurisdictional Activity. Banks with international oper - ations can transmit problems from one region to another during a nancial crisis. Global banks are also more dicult to resolve because they require coordination among national regulators. e scale of a bank’s global activity is measured by its total for - eign claims and its total cross-jurisdictional liabilities. Each systemic risk category raises signicant measurement chal - lenges. Even the size measurement is far from straightforward. e current indicators and G-SIB capital buer are important steps in an ongoing process to strengthen prudential regulation of the largest nancial institutions. Analysis of 2013 U.S. Data In the United States, each bank reported its systemic impor - tance risk indicators as of December 31, 2013. e names of the banks and the nancial data each submitted are summarized in Figure 1 , along with each bank’s overall score of systemic importance. We followed the Basel Committee procedure in scoring banks by rst normalizing each indicator by the total value for that indicator among the world’s 75 largest banks. 10 For example, if a bank has a value of $4 billion for one indicator and the group’s total value for that indicator is $100 billion, the bank’s score for the indicator is 4 percent. is approach puts the scores for dierent indicators on a common scale. e normal - ized scores for indicators were averaged within each category to produce a subscore. e ve category subscores were then averaged to produce an overall score. We capped the category 0 1, 00 2, 00 3, 00 4, 00JPMCBACWFCGSMSOther Total exposures Total assets Note: Analysis includes JPMorgan Chase & Co., Bank of America Corporaon, Cigroup Inc., Wells Fargo & Company, Goldman Sachs, Morgan Stanley, and the me dian of remaining bank holding companies with assets greater than $50 billion. So urces: Federal Reserve Y-15 and Y-9C reports Figure 3. Exposures and Assets ($ billions) Total exposures are considerably greater than assets for U.S. G-SIBs OFR Brief Series February 2015 | Page 4 01234 05 101520 JPMCBACWFCGSMSUSBPNCBKHSBCSSTCOFNTRSBBVADB Total exposure Payments acvity Assets under custodyUnderwring acvity Sources: Federal Reserve Y-15 reports and Basel Commiee on Banking Supervision Figure 4. Substitutability (percent) Some smaller banks scored higher on substitutability due to custodian, underwriting, and payments businesses Morgan Stanley have large underwriting businesses. Deutsche Bank Trust (DB), a U.S. subsidiary of the largest German bank, has a high level of payment activity despite being the smallest of the 33 banks. e indicators were normalized (as described above) so they are all on a scale from zero to 100 percent. e gure does not reect the 5 percent cap on the substitutability indicators that is used in the Basel methodology — without the cap, the overall scores for Bank of New York Mellon, Citigroup, JPMorgan, and State Street would be even higher. Interconnectedness In the Y-15 data, a bank’s interconnectedness is measured by the intranancial system assets it owns and the intranancial system liabilities that it owes. Averaged over the 33 U.S. banks, intra - nancial system assets and liabilities were nearly equal at $75 billion and $72 billion, respectively. 13 But the averages do not reect notable dierences for individual banks (see Figure 5 ). In the gure, the bubble sizes are proportional to each bank’s total exposures. Banks above the diagonal line had net obligations to the nancial system, and banks below the diagonal line had net claims on the nancial system. Dierences in these indicators of interconnectedness partly reect dierences in activities mea - sured by the substitutability and complexity indicators: those above the line generally have large payments activities or assets under custody, while those below the line generally have large trading, derivatives, and underwriting operations. Total intranancial system assets and liabilities of the bank hold - ing companies were nearly equal — $2.5 trillion for assets and $2.4 trillion for liabilities. e largest component of total intra - nancial system assets was the fair value plus potential future exposure (PFE) of OTC derivatives, at $1.2 trillion (48 per - cent). 14 Deposits and loans to other nancial institutions were a distant second at $615 billion (25 percent). Securities nancing transactions (SFTs) accounted for just 7 percent (see Figure 6 ). Intranancial system liabilities primarily took the form of deposits, which made up $1.4 trillion or 59 percent. Most of the deposits, $1.1 trillion, were due to nonbank nancial insti - tutions. Surprisingly, OTC derivatives contributed only about half as much to intranancial system liabilities ($632 billion) as to intranancial system assets ($1.2 trillion). Across all OTC          \r  \f       \f\r\n\n\t\b\n \t\n \t\t\t\t\n\t \t­€\r\t‚\b\nƒ\t\b„\t\nƒ\t\b\t…\t\nƒ\b\t\t\n†\t\n‡„\n\b\b\tˆ‚\n\t\n‰ Figure 5. U.S. G-SIBs’ Liabilities and Assets ($ billions) Banks vary in their use and provision of funding Size Bank size is an important component of systemic risk. Figure 3 presents two measures of size, total assets and total exposures, the size measure used in the G-SIB methodology that includes derivative positions and securities nancing transactions, such as repurchase agreements and securities lending. By either mea - sure, the six largest U.S. banks dominated the others, account - ing for nearly 70 percent of total assets and 72 percent of total exposures. e same six had total exposures 44 percent larger than their total assets. By comparison, the other banks’ total exposures were just 27 percent larger than their total assets. Substitutability Six banks scored higher on the substitutability indicator than their size would suggest, as shown in Figure 4 . 12 e horizon - tal axis orders the 33 banks by size. Bank of New York Mellon Corp., State Street Corp., and Northern Trust Corp. (NTRS) have large operations as custodian banks. Goldman Sachs and OFR Brief Series February 2015 | Page 5 JPMCBACWFCGSMSUSBPNCBK HS BCSTTCOF-6-303 6 Source: Federal Reserve Y-15 Reports Figure 8. Securities Financing Transactions (percent) Banks’ net borrowings and net lending from the nancial system are shown as a percent of their total exposures Figure 7. OTC Derivatives Exposures (percent) Banks’ positive and negative OTC derivatives values are shown as a percent of their total exposures JPMCBACWFCGSMSUSBPNCBK HS BCSTTCOF-1001020 30Source: Federal Reserve Y-15 Reports market participants, derivatives assets must equal derivatives liabilities, so this imbalance indicates that the U.S. banks held large positive OTC derivatives positions with nancial institu - tions outside this group. In contrast, securities nancing transactions were a net source of funding to the U.S. banks from the rest of the nancial sys - tem. Securities lending contributed $336 billion to intranan - cial system liabilities and $186 billion to intranancial system assets. Bank holding companies are allowed to report both securities nancing transactions and derivatives transactions on a net basis (subject to a valid master netting agreement). However, OTC derivatives are reported on a more expansive basis that includes PFE. As a result, smaller reported numbers for securities nancing transactions may have underweighted their risks relative to rms’ OTC derivatives risks. Figure 7 shows individual banks’ OTC derivatives positions with positive value (intranancial system assets) and OTC positions with negative value (intranancial system liabilities) as a percent - age of the bank’s total exposures. is comparison shows that the imbalance in OTC positions was primarily due to the positions of just two U.S. banks, Goldman Sachs and Morgan Stanley. A similar comparison of the 12 largest banks’ securities nanc - ing transactions shows that the imbalance varied across banks (see Figure 8 ). Four of the six largest banks were net borrowers from the nancial system. Bank of New York Mellon and State Street, which run large securities lending businesses, had large negative net positions. Complexity e three activities measured by the systemic risk indicators for complexity — derivatives, trading assets, and illiquid (Level 3) assets — played a large role in the nancial turmoil of 2007-08. 0500 1000150020002500 OTC d erivaves ( net negave ) S FT s Credit lines obtained De p osits due to bankDeposits due to nonbanks O TC de ri a v es ( net posive ) S FT s Securies Credit l ines extende d D eposits and loans to  nancial instuons Asse t s Li ab ili es So urce: Federal Reserve Y-15 reports Figure 6. U.S. G-SIBs’ Combined Intranancial Assets and Liabilities ($ billions) Nearly half of assets are OTC derivatives and most liabilities are deposits from nonbanks OFR Brief Series February 2015 | Page 6 0 100200300400500600700 0200400600800100 0Source: Federal Reserve Y-15 reports Note: Bubble size shows total exposures. Bubble label shows number of jurisdicons in which the BHC operates. Intranancial system liabilies Foreign claimsBKSTTC100JPM60MS51BAC49GS513530WFC30 0510152025 - 5 10 15 20 25Sources: Federal Reserve BHC Performance Reports, OFR analysisNote: Bubble size shows total exposures. OFR Financial Connecvity IndexLeverage(Total assets/Tier 1 capital)BKSTTCMSJPMBACGSWFC Figure 9. Foreign Claims ($ billions) Banks with large foreign claims are also highly interconnected to the nancial system Figure 10. Leverage and the OFR Financial Connectivity Index Highly leveraged banks are also the most interconnected e six largest banks scored highest on the complexity indica - tors, with OTC derivatives largely conned to ve of those six (see Figure 1 ). Cross-Jurisdictional Activity A bank that has large foreign assets and large intranancial sys - tem liabilities is a potential source of spillover risk. If a large loss in value in foreign assets caused such an institution to fail, the losses could be transmitted to the rest of the U.S. nancial system. Five banks had large foreign assets (exceeding $300 bil - lion) and Citigroup and JPMorgan had large gures for both foreign assets and intranancial system liabilities. e bubble sizes in Figure 9 reect rm size, based on total exposures. 15 Again, the largest banks are the most interconnected and they are involved in the most cross-jurisdictional activity. OFR’s Financial Connectivity and Contagion Indexes In addition to analyzing the Y-15 data, we also estimated a nancial connectivity index for each bank holding company, as dened in an OFR working paper in 2013. 16 e index mea - sures the fraction of liabilities held by other nancial institu - tions. All else being equal, the default of a bank with a higher connectivity index would have a greater impact on the rest of the banking system because its shortfall would spill over onto other nancial institutions, creating a cascade that could lead to further defaults. High leverage, measured as the ratio of total assets to Tier 1 cap - ital, tends to be associated with high nancial connectivity and many of the largest institutions are high on both dimensions ( see Figure 10 ). Seven of the eight U.S. G-SIBs had high nan - cial connectivity index values; Bank of New York Mellon and State Street were high on both dimensions despite their relatively smaller sizes. e same OFR working paper also introduced a contagion index that combined the connectivity index with measures of a bank’s size and leverage. e larger the bank, the greater the potential spillover if it defaults; the higher its leverage, the more prone it is to default under stress; and the greater its connec - tivity index, the greater is the share of the default that cascades onto the banking system. e product of these three factors provides an overall measure of the contagion risk that the bank poses for the nancial system. Five of the U.S. banks had par - ticularly high contagion index values — Citigroup, JPMorgan, Morgan Stanley, Bank of America, and Goldman Sachs. Conclusions e collection of systemic importance indicators is a signif - icant step in providing information to banking supervisors and the public about the potential impact of the failure of a major nancial institution. Additional capital requirements for G-SIBs could enhance the resilience of the nancial system. e indicators agreed upon through the Basel Committee recognize several dimensions to systemic importance. Although the largest OFR Brief Series February 2015 | Page 7 1 e Basel Committee said the measures were not meant to reect the probability that an institution will fail. “e Committee is of the view that global systemic importance should be measured in terms of the impact that a bank’s failure can have on the global nancial system and wider economy, rather than the risk that a failure could occur.” See Basel Committee on Banking Supervision (BCBS), Global Systemically Important Banks: Updated Assessment Methodology and the Higher Loss Absorbency Requirement, Bank for International Settlements, Basel, July 2013, p. 5 (available at www.bis.org/publ/bcbs255. pdf , accessed December 2, 2014). e list of G-SIBs is available at www.bis.org/press/ p141106.htm. 2 Board of Governors of the Federal Reserve System, Press Release, December 9, 2014 (see www.federalreserve.gov/newsevents/ press/bcreg/20141209a.htm , accessed December 10, 2014). 3 Form Y-15 follows the Basel Committee’s template for collecting the systemic indi - cators (see www.bis.org/bcbs/gsib , accessed December 2, 2014). 4 ese include subsidiaries of Banco Bilbao Vizcaya Argentaria, S.A. (BBVA); BNP Paribas Group; Deutsche Bank AG; Mitsubishi UFJ Financial Group, Inc.; Royal Bank of Scotland Group plc; and Banco Santander. Each of these parent companies has been designated a G-SIB. e other two foreign parent companies are TD Bank and Bank of Montreal. Only the U.S. holding companies le Form Y-15, not their for - eign-based parent companies. A comparison of indicators across international banks will be the subject of a future OFR Brief. 5 See www.ec.gov/nicpubweb/nicweb/ NicHome.aspx . 6 See BCBS, Global Systemically Important Banks. 7 e complete list of institutions is available on the FSB’s website (see www.nancialstabilityboard. org/2014/11/2014-update-of-list-of-glob - al-systemically-important-banks , accessed December 2, 2014). 8 Information on the weights and the descrip - tions of the indicators that follow are from BCBS, Global Systemically Important Banks, and Board of Governors of the Federal Reserve System, Instructions for Preparation of Banking Organization Systemic Risk Report (available at www.ny.frb.org/banking/reportingforms/ FR_Y_15.html , accessed December 2, 2014). 9 A high score on these substitutability indicators means a lack of readily available substitutes to replace the bank’s services if it were to fail. 10 To be consistent with the Basel Committee’s procedure, in calculating normalized scores we divided by the totals for the group of 75 international banks and not the 33 U.S. banks. We normalized by the totals for 2013 as reported by the BCBS at www.bis. org/bcbs/gsib/denominators.htm (accessed December 3, 2014). 11 e 5 percent cap was imposed in the com - mittee’s July 2013 updated methodology because substitutability was found to have a greater than intended eect on the overall score. 12 U.S. G-SIBs are even more leveraged relative to non-G-SIB U.S. peers on an enhanced supplementary leverage ratio basis, which uses total exposures instead of total assets. 13 ey are not equal because the 33 bank holding companies do not make up the entire nancial system. 14 Potential future exposure (PFE) is dened as the maximum exposure estimated to occur on a future date at a high level of statistical condence. 15 e number of jurisdictions is reported as an ancillary indicator in the Basel template and in Form Y-15. 16 Specically we estimated the numerator from the Y-15 data as an institution’s intra - nancial system liabilities (which include derivative liabilities) minus deposits from nondepository institutions such as mutual funds, pension funds, and insurance com - panies. We excluded these deposits because we wanted to estimate a given institution’s potential spillover eect on other banks. If these deposits were included, the estimated connectivity index would be larger. See Paul Glasserman and H. Peyton Young, “How Likely is Contagion in Financial Networks?,” OFR Working Paper no. 0009, June 21, 2013, forthcoming in the Journal of Banking and Finance ; and Oce of Financial Research, 2013 Annual Report, Washington, pp. 63-70. Endnotes banks tend to dominate all indicators of systemic importance, the indicators of substitutability, interconnectedness, complex - ity, and global activity provide useful additional information to understand dierences among these institutions. Some dimensions of systemic importance are not captured by the indicators. One is the extent to which a bank engages in maturity and liquidity transformation. Funding long-term illiq - uid assets with short-term liabilities can make a bank resolu - tion more dicult. A second dimension is the extent to which a bank’s home sovereign relies on the bank for funding activities and nancial services; this type of reliance can contribute to a bank’s systemic importance. A third dimension is that the cur - rent substitutability indicators do not directly measure all criti - cal services, such as clearing and settlement operations. e type of analysis reported here can help drive future data collections and can point to further work on indicators. ese eorts are needed for monitoring risks as well as for identifying systemically important banks. Systemic Importance Indicators for 33 U.S. Bank Holding Companies: An Overview of Recent Data by Meraj Allahrakha, Paul Glasserman, and H. Peyton Young The authors used a new dataset collected by the Federal Reserve System to evaluate the systemic importance of the largest U.S. bank holding companies by comparing their scores on size, interconnectedness, complexity, global activity, and dominance in certain customer services (known as “substitutability”). They also applied an OFR nancial connectivity index to the data to measure interconnectedness. Overall, the analysis reinforces the need for measuring, monitoring, and evaluating multiple aspects of systemic importance. T he Basel Committee on Banking Supervision, a group of banking supervisors from 28 jurisdictions, in 2011 created a set of 12 nancial indicators to identify global systemically important banks (G-SIBs). ese are banks whose failure could pose a threat to the international nancial system. 1 e most recent list identied 30 banks across the world as G-SIBs, including eight U.S. bank holding companies. A bank designated as a G-SIB must meet a higher risk-based capital ratio to enhance its resilience, and is subject to additional new structural macroprudential tool for containing systemic risk. On December 9, 2014, the Federal Reserve proposed a draft rule implementing the G-SIB buer for U.S. bank hold - ing companies that could result in some banks holding larger capital buers than those proposed by the Basel Committee. 2 e largest U.S. bank holding companies reported in August 2014 their systemic importance indicators as of December 31, 2013. is important new dataset provides more transparency and is a signicant step in quantifying specic aspects of sys - temic importance. Our analysis showed:  e largest U.S. banks generally scored highest for all sys - temic risk indicators, but had relatively low Tier 1 leverage ratios compared to smaller banks.  Several of the largest banks scored high in systemic impor - tance because they dominate specic businesses, such as payments and asset custody services. Others scored high businesses.  Seven of the eight U.S. G-SIBs had high values under the OFR’s connectivity index, introduced in an earlier OFR working paper.  Basel Committee-recommended capital buers would still leave U.S. G-SIBs with generally lower capital ratios than other large U.S. banks. The Purpose of the Indicators Annual systemic risk scores for major banks around the U.S. bank holding company with over $50 billion in assets is required to annually disclose its systemic risk indicators to the Federal Reserve by ling a Form Y-15, or Banking Organization Systemic Risk Report. 3 A total of 33 banks — including eight subsidiaries of foreign banks 4 — led the Y-15 for 2013 and the Federal Reserve published the data on its National Information Center website. e Basel Committee designates banks with the highest scores as G-SIBs and each must hold an additional capital buer of up to 3.5 percent of its risk-weighted assets. e Financial Stability Board (FSB) in November 2011 published its rst annual list of G-SIBs using a process developed with the Basel Committee. BRIEFSERIES OFFICE OF FINANCIAL RESEARCH 15-01 | February 12, 2015 Views and opinions are those of the authors and do not necessarily represent ofcial positions or policy of the OFR or Treasury. OFR reports may be quoted without additional permission.