/
Municipal Fixed Income Municipal Fixed Income

Municipal Fixed Income - PDF document

unita
unita . @unita
Follow
344 views
Uploaded On 2021-06-30

Municipal Fixed Income - PPT Presentation

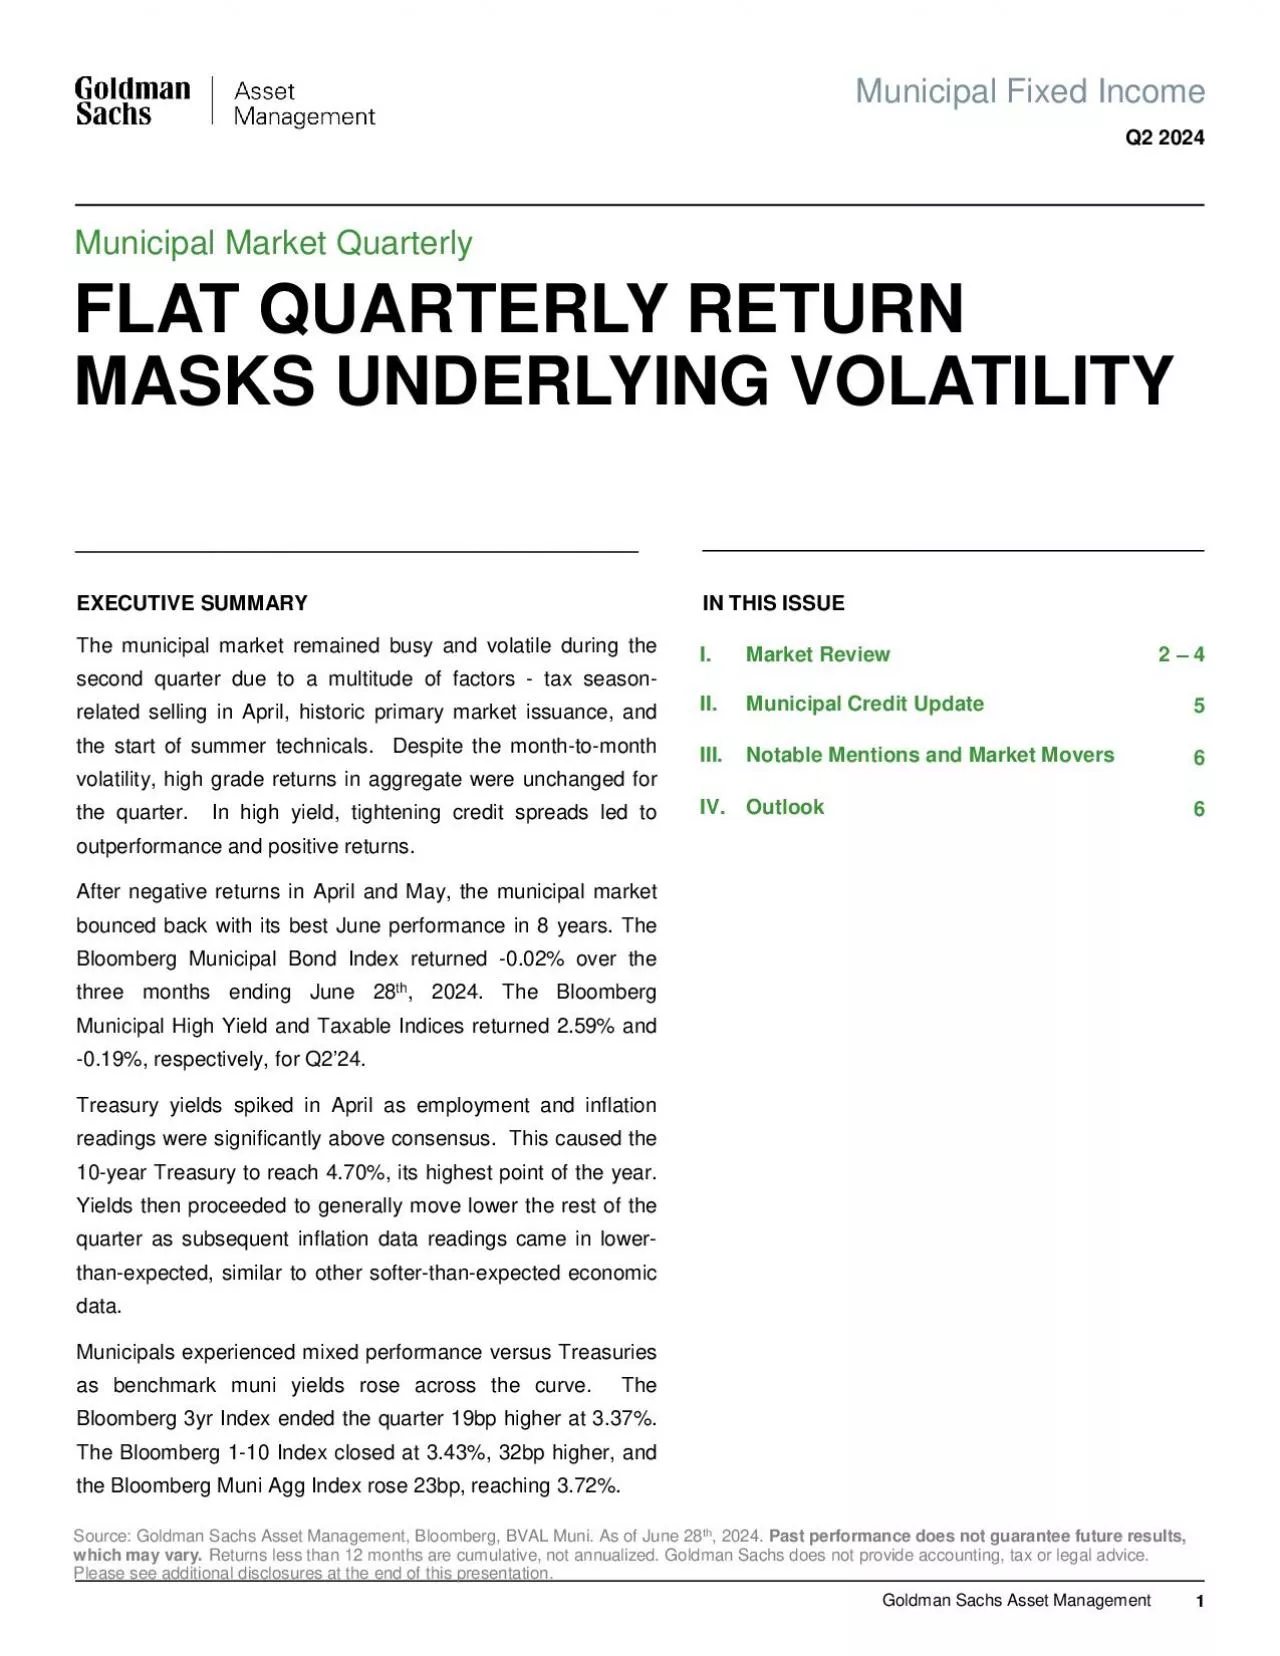
IN THIS ISSUE I Market Review 2 4 II Municipal Credit Update 5 III Outlook 6 GSAM Municipal Market Quarterly Outperformance During a Global Yield Surge Q1 2021 EXECUTIVE SUMMARY The ta ID: 849759

index municipal yield market municipal index market yield year tax investment quarter barclays bloomberg high gsam sachs goldman 2021

Share:

Link:

Embed:

Download Presentation from below link

Download Pdf The PPT/PDF document "Municipal Fixed Income" is the property of its rightful owner. Permission is granted to download and print the materials on this web site for personal, non-commercial use only, and to display it on your personal computer provided you do not modify the materials and that you retain all copyright notices contained in the materials. By downloading content from our website, you accept the terms of this agreement.


Presentation Transcript

1 Municipal Fixed Income IN THIS ISSUE I.
Municipal Fixed Income IN THIS ISSUE I. Market Review 2 – 4 II. Municipal Credit Update 5 III. Outlook 6 GSAM Municipal Market Quarterly: Outperformance During a Global Yield Surge Q1 2021 EXECUTIVE SUMMARY The tax - exempt municipal market, as represented by the Bloomberg Barclays Municipal Bond Index, returned - 0 . 35 % over the three months ending March 31 , 2021 . The Bloomberg Barclays High Yield (HY) Municipal Index returned 2 . 11 % during the quarter . Municipals significantly outperformed U . S . Treasuries over the quarter across most of the yield curve . Treasury yields rose, and the curve steepened due to strong economic growth projections that also stoked inflation fears . While municipals were not immune to the rising interest rate environment, they were able to largely escape the sharp rise in global yields due to a robust technical environment and the passage of the $ 1 . 9 tn American Rescue Plan which benefitted many municipal sectors . Short municipal yields were 0 - 21 basis points higher, while intermediate to long maturities were higher by about 35 basis points . Lower - rated credit spreads tightened due to the Federal aid package and overall investor demand for yield . Source: GSAM, Bloomberg Barclays, BVAL Muni. As of March 31, 2021. Past performance does not guarantee future results, which may vary. GSAM MUNICIPAL MARKET QUARTERLY: OUTPERFORMANCE DURING A GLOBAL YIELD SURGE GOLDMAN SACHS ASSET MANAGEMENT 2 Source: Bloomberg Barclays, BVAL Muni, BondBuyer , Lipper Fund Flows. As of March 31, 2021. Past performance does not guarantee future results, which may vary. Past correlations are not indicative of future correlations, which may vary. I. Market Review Primary Market: Flat as Refinancing Slows Down Municipal issuance for the first quarter was approximately $102bn, similar to the start a year ago but 21% below the amount issued in the previous quarter. The year got off to a slow start from an issuance perspective as January volumes were 20% below January 2020’s volumes. However, issuance accelerated and eventually normalized as the quarter progressed. March volumes this year were notably higher when compared to last March when new issue market activity was minimal due to Covid - 19 related volatility. An uptick in transactions related to new project financings, less r efunding activity, and the continued prevalence of taxable municipal issuance were emblematic of this quarter’s new issue market. Demand: Record Start with $32bn of Fund Inflows Municipal mutual funds experienced a record $32bn of inflows over the first quarter. Demand was very strong the first six weeks of the year, before becoming subdued in mid to late February as investors became increasingly concerned about rising interest rates. After this brief lull in demand, fund inflows increased again in March. For the quarter, funds experienced only one week of outflows. Long Term, High Yield, and Intermediate Funds all saw net inflows during the quarter. According to the latest US Federal Reserve (Fed) Flow of Funds report for 4Q2020, U.S. banks, insurance companies, and foreign investors added to their holdings of municipals. See Exhibit 4 on following page. Yield to Maturity (%) Source: Bloomberg Barclays, BVAL Muni. As of March 31, 2021. Exhibit 1: Q12021 Treasury vs Municipal Yield Shifts - 29 - 16 3 13 9 11 6 5 8 7 14 12 6 -40 -30 -20 -10 0 10 20 Mar-20 May-20 Jul-20 Sep-20 Nov-20 Jan-21 Mar-21 All Muni High Yield Intermediate Long-Term Lipper Fund Flows ($ bn ) 0 100 200 300 400 500 2005 2006 2007 2008 2009 2010 2011 2012 2013 2014 2015 2016 2017 2018 2019 2020 2021 Issuance ($ bn ) New Money Refunding Combined '05-'20 New Money Avg Source: Bloomberg Barclays, BondBuyer . As of March 31, 2021. Source: Lipper. As of March 31, 2021. Exhibit 2: Municipal Issuance Exhibit 3: Municipal Fund Flows 0.0 0.5 1.0 1.5 2.0 2.5 3.0 1 2 3 5 7

2 10 20 30 Years to Maturity US Treasury
10 20 30 Years to Maturity US Treasury - Dec-20 US Treasury - Mar-21 AAA Muni - Dec-20 AAA Muni - Mar-21 GSAM MUNICIPAL MARKET QUARTERLY: OUTPERFORMANCE DURING A GLOBAL YIELD SURGE GOLDMAN SACHS ASSET MANAGEMENT 1,833 1,856 1,718 1,678 1,710 1,636 1,842 1,894 1,909 1,050 920 957 949 899 943 960 1,108 1,165 365 419 452 499 549 570 505 479 523 504 497 520 535 536 537 484 496 520 98 95 100 101 115 128 163 164 171 0 500 1000 1500 2000 2500 3000 3500 4000 4500 2012 2013 2014 2015 2016 2017 2018 2019 2020 Households & Nonprofits Funds US Banks Insurers Other $ bn Source: Federal Reserve Board Flow of Funds data, BofA Merrill Lynch Global Research. As of 4Q20 , latest available . Valuation/Yield Changes: Municipal Yields Increase, but Outperform Treasuries Across the Curve Municipals outperformed Treasuries over the first quarter as they experienced only half the yield increase for most maturities. 2 - year muni yields were unchanged at 0.12%, while 2 - year Treasury yields increased 3bps to 0.16%. 5 - year muni yields increased by 29bps to 0.48%, while 5 - year Treasury yields rose by 56bps to 0.92%. 10 - year muni yields increased by 39bps to 1.06%, while 10 - year Treasury yields rose by 81bps to 1.74%; 30 - year muni yields increased by 35bps to 1.76%, while 30 - year Treasury yields rose by 76bps to 2.41%. The 2 - year Muni/Treasury ratio went lower by 17 percentage points (pp) to 75%. 5 - year ratios ended the quarter lower by 1pp to 52%. 10 - year ratios ended the quarter lower by 11pp to 61%. 30yr ratios ended the quarter lower by 12pp to 73%. Yield Curve: Shifted Upwards and Steepened Over the Quarter The municipal yield curve steepened over the first quarter as longer maturity bonds experienced a higher relative increase in yields compared to shorter maturities. The difference between 2 - year and 30 - year municipal yields increased by 35 bps to end the quarter at a slope of 164 bps. The middle of the curve, as represented by 5 - 10 year maturities, steepened by 10 bps and finished with a slope of 58 bps, while the longer end of the curve, 15 - 30 years, flattened by 2 bps to end at 42 bps. Investment Grade Index Returns & Spreads: Shorter Maturity and Lower - Rated Investment Grade Credits Outperform The Bloomberg Barclays Municipal Bond Index returned - 0.35% during 1Q21. The 1 - 10yr Blend Index posted a total return of - 0.26%, while the 3 - year Index returned 0.15%. Within investment grade credit, the ‘BBB’ portion of the muni index had the strongest returns (+1.28%), and from a curve perspective, the short end (1 Year) performed the best with a return of 0.20%. BBB credit spreads were lower by 41bps to end the quarter at 88bps. The BBB rating category has significant exposure to municipal sectors that benefitted from the $1.9tn Federal stimulus plan including states and local governments. I. Market Review Continued Source: GSAM, BVAL Muni. As of March 31, 2021. Exhibit 5: Municipal Yield Curve Exhibit 4: Municipal Holdings by Investor Type 0.0 0.5 1.0 1.5 2.0 1 2 5 10 20 30 Years to Maturity 31-Mar-2021 31-Dec-20 Yield to Maturity (%) 3 Source: GSAM, BVAL Muni, Federal Reserve Board Flow of Funds data, BofA Merrill Lynch Global Research.. Past performance does not guarantee future results, which may vary. Past correlations are not indicative of future correlations, which may vary. GSAM MUNICIPAL MARKET QUARTERLY: OUTPERFORMANCE DURING A GLOBAL YIELD SURGE GOLDMAN SACHS ASSET MANAGEMENT 4 Source : Bloomberg Barclays, GSAM . As of March 31, 2021. OAD: “Option adjusted duration” is a measure of the sensitivity of a bond's price to interest rate changes, assuming that the ex pected cash flows of the bond may change with interest rates. YTW: “Yield to worst” is calculated by making worst - case scenario assumptions (excluding issuer default) on the bond by c alculating the re

3 turns that would be received if provisi
turns that would be received if provisions, including prepayment, call, put, and sinking fund, are used by the issuer. YTW may be the same as YTM, but never hig her. YTW does not represent the performance yield for the Fund. TEY: “Taxable equivalent yield” is the return that is required on a taxable investment to make it equal to the retu rn on a tax - exempt investment. Past performance does not guarantee future results, which may vary. Goldman Sachs does not provide accounting, tax or legal advice. Please see additional disclosures at the end of this presentation. Past correlations are not indicative of future correlations, which may vary. High Yield Municipals: Positive Returns as Spreads Continue to Tighten The high yield municipal market, as represented by the Bloomberg Barclays Municipal High Yield Index, posted a positive return of 2.11% over the quarter, outperforming the investment grade index by 246bps. High y ield credits have now outperformed investment grade for four consecutive quarters. Within high yield municipals, lease appropriation credits were the best performers, posting a total return of 6.0%. Puerto Rico credits were relative underperformers, returning 0.56% over the quarter. Within the high yield municipal index, the intermediate portion (6 - 8 Years) outperformed by returning 2.63% while the shorter end (3 - 4 Years) underperformed at 1.20%. Improving credit fundamentals, less interest rate sensitivity, a strong economic backdrop, and positive fund inflows led to outperformance versus investment grades. High Yield spreads were lower by 29bps to end the quarter at 246bps. This is a significant decrease from the recent spread wides experienced in May 2020 of 375 bps. In contrast, high yield muni spreads still remain above 2020’s low of 200bps which occurred prior the market volatility last March. Taxable Municipal Market: Underperforms Tax - Exempts due to greater Treasury Yield Sensitivity The taxable municipal market, as represented by the Bloomberg Barclays Taxable Municipal Index, posted a total return of - 3.47% during the first quarter. Negative returns were driven primarily by a significant rise in long - term Treasury yields. Credit spreads tightened as the spread of the Barclays Taxable Municipal Index ended the quarter at 75bps to the 10 - year Treasury, rallying 42bps during the quarter. Taxable municipal new issuance continued to make up a significant portion of overall municipal supply (~27%). I. Market Review Continued Source: GSAM, Bloomberg Barclays. As of March 31, 2021. Exhibit 6: Municipal Index Spreads Market Statistics Returns (%) Statistics as of March 31, 2021 Statistics as of December 31, 2020 Municipal Indices 1Q21 4Q20 OAD ( yrs ) YTW (%) TEY (%) OAD ( yrs ) YTW (%) TEY (%) Municipal 3yr 0.15 0.33 2.54 0.41 0.70 2.59 0.41 0.70 Municipal Managed Money 1 - 5 - 0.19 0.17 2.79 0.35 0.60 2.84 0.27 0.46 Municipal Managed Money 1 - 10 - 0.82 0.80 4.47 0.65 1.10 4.52 0.45 0.76 Municipal 1 - 10yr Blend - 0.26 0.98 3.79 0.70 1.19 3.83 0.62 1.05 Municipal Aggregate - 0.35 1.82 5.27 1.18 1.99 5.18 1.07 1.81 Municipal High Yield 2.11 4.51 7.41 3.64 6.14 7.25 3.82 6.46 Taxable Municipal Index - 3.47 1.43 9.80 2.49 N/A 9.99 2.10 N/A 200 250 300 350 400 50 100 150 200 250 300 Mar-20 May-20 Jul-20 Sep-20 Nov-20 Jan-21 Mar-21 Yield Spread (bps) BBB Municipal Index vs AAA Municipal Index Spread (LHS) High Yield Municipal Index vs Investment Grade Municipal Index (RHS) GSAM MUNICIPAL MARKET QUARTERLY: OUTPERFORMANCE DURING A GLOBAL YIELD SURGE GOLDMAN SACHS ASSET MANAGEMENT 0 4 8 12 16 1,700 1,750 1,800 1,850 1,900 1,950 2,000 1Q 2Q 3Q 4Q 1Q 2Q 3Q 4Q 1Q 2Q 3Q 4Q 2018 2019 2020 State & Local Tax Receipts Annualized UER SA $ bn US Unemployment Rate SA (%) 5 ¹The economic and market forecasts presented herein are for informational purposes as of the date of this presentation. There can be

4 no assurance that the forecasts will b
no assurance that the forecasts will be achieved. Please see additional disclosures at the end of this presentation. Goldman Sachs does not provide accounting, tax or legal ad vic e. Please see additional disclosures at the end of this presentation. The above states are selected to highlight major developments in the municipal market over the quarter. The por tfo lio risk management process includes an effort to monitor and manage risk, but does not imply low risk . Past performance does not guarantee future results, which may vary. State and Local Revenues Outperform Through the Pandemic, We Expect Very Strong Tail Winds Through the Balance of 2021 We noted in our 4Q 2020 memo that the data as of the end of the third quarter reflected revenue performance that was showing signs of snapping back far more quickly than during the Great Financial Crisis. With two complete quarters since the worst of the Covid - 19 shutdown, we have even greater evidence that the impact was largely confined to the April - June 2020 quarter. The revenue trend line has returned to its more normalized trajectory (Exhibits 7 and 8) and in fact the generous CARES Act masks the actual decline y/y as shown in “S&L Taxes” line in Exhibit 10 below . We also suggested that state and local revenue trend line mirrors US GDP. With strong GDP growth expected from Goldman Sachs Chief Economist Jan Hatzius of over 7 %, we also expect state and local revenues to perform smartly in 2021. Exhibit 9 below paints a fascinating picture of the correlation between GDP and municipal revenue and how the Covid - 19 economic shutdown has played out for states and local governments. The graph tracks US GDP which was - 2.30% in 2020 (“GDP” line in Exhibit 9), while state and local revenues outperformed GDP with a relatively strong 1.78% growth rate y/y (“S&L Taxes” line in Exhibit 9). Importantly, the “S&L Total Receipts” line in Exhibit 9 shows all receipts, which includes federal funds. For 2020, all receipts including federal funds increased by 10.50% y/y. Finally, these assumptions do not even consider the latest federal support - “ The American Rescue Plan Act of 2021 ” - which translated into additional $ 335bn in aid to states and locals. This is in addition to the CARES Act which provided approximately $ 350bn to municipalities. In context, these two federal injections amount to about 17% of state and local revenue for each of the fiscal years 2020 and 2021. Combining the increased federal aid along with positive GDP momentum, we are quite positive on the trajectory of municipal finance over the next year or more. II. Municipal Credit Update Source: GSAM, Bureau of Economic Analysis. Data is de - annualized. As of December 31, 2020. Source: US Bureau of Labor Statistics, US Bureau of Economic Analysis, St. Louis FRED Research Database. As of December 31, 2020. Exhibit 7: State and Local Receipts Exhibit 8: COVID 19: State and Local Tax Revenues and UER Exhibit 9 : US GDP vs State & Local Tax Receipts -10% -5% 0% 5% 10% 15% 20% 1970 1975 1980 1985 1990 1995 2000 2005 2010 2015 2020 GDP S&L Taxes S&L total Receipts Source: US Bureau of Economic Analysis, National Income and Product Accounts, Table 3.3 As of December 31, 2020. 0 300 600 900 1Q 2Q 3Q 4Q 1Q 2Q 3Q 4Q 1Q 2Q 3Q 4Q 1Q 2Q 3Q 4Q 1Q 2Q 3Q 4Q 1Q 2Q 3Q 4Q 2015 2016 2017 2018 2019 2020 Quarterly State and Local Tax Receipts ($ b n ) CARES Funding CARES Funding GSAM MUNICIPAL MARKET QUARTERLY: OUTPERFORMANCE DURING A GLOBAL YIELD SURGE GOLDMAN SACHS ASSET MANAGEMENT 6 Goldman Sachs does not provide accounting, tax or legal advice. Please see additional disclosures at the end of this presentation. Supply Issuance typically tends to pick up during the second quarter after more muted first quarter volumes. Comparisons to last year will be di

5 fficult as the municipal new issue marke
fficult as the municipal new issue market was minimal during portions of March and April due to Covid - 19 related market disruptions and volatility. Higher Treasury yields may lower projected taxable muni issuance for refinancing purposes as the cost savings may be narrower or out of the money. Conversely, future supply may also be impacted by potential Federal infrastructure legislation. Demand After a record start to the year for muni fund inflows ( $32bn), we believe demand from individuals may slow and become choppier. This circumstance may be caused by the tug - of - war between cash on the sidelines looking for tax free income and concerns about significant increases in future interest rates. While individuals may continue to broadly allocate to municipal securities for the sectors high credit quality and tax advantages, the flows may be more opportunistic and variable going forward. Valuations AAA Municipal valuations across most of the yield curve are on the richer end of their historical ranges , having significantly outperformed Treasuries so far this year . Municipals may underperform in the short - term given current valuations, a less robust technical environment, and potential tax season related selling. Higher - Rated Investment Grade Credits Our expectation is that overall investment grade municipal credit quality will remain strong as the year progresses due to sizeable Federal Aid, better - than - expected revenue performance, and a high performing economy coming out of the pandemic. Major rating agencies have already improved their outlooks on large sectors of the municipal market such as states and local governments to reflect the improved environment. Lower - Rated Investment Grade Credits We continue to favor the risk - reward profile of BBB - rated municipal credits. We believe there is select opportunity to pick up additional yield in this credit rating category, while still maintaining exposure to investment grade quality municipal issuers in traditional municipal sectors such as state and local general obligations and transportation. BBB spreads have tightened to start the year, but remain elevated compared to their 2020 lows. High Yield/Non - Rated Credits We do not anticipate a significant rise in high - yield muni defaults, as most issuers were not directly affected by Covid - 19. Certain issuers, however, in sectors such as retail sales, proton therapy and waste disposal/recycling that were under stress before the pandemic hit will likely remain so. Some project finance issuance, boosted by the low - rate environment in recent years, may also struggle as they reach the critical final development and start - up stages. On a positive note, healthcare, small university and student housing sectors may start to improve as Covid - 19 vaccines are more readily available. We continue to believe there are select opportunities to add exposure in this ratings category as the economic recovery strengthens. High yield to investment grade spreads have also tightened to start the year, but similarly remain elevated compared to their 2020 lows . Potential Federal Policy Initiatives Now that the latest round of Federal stimulus is in the rearview, market participants will closely follow the new administration’s priorities and future policies for its implications on the overall municipal market. Using the budgetary reconciliation process, there is a higher probability that infrastructure and tax legislation, specifically as it relates to increasing corporate and individual taxes will be the next area of focus at the Federal level. Discussions surrounding policies such as infrastructure, the removal of the $10,000 SALT cap, and changes to other facets of the Tax Cuts and Jobs Act of 2017 have also started to garner headlines and we would expect more to come on those initiatives. III. GS

6 AM Municipal Market Outlook GSAM MUNICIP
AM Municipal Market Outlook GSAM MUNICIPAL MARKET QUARTERLY: OUTPERFORMANCE DURING A GLOBAL YIELD SURGE GOLDMAN SACHS ASSET MANAGEMENT GENERAL DISCLOSURES 7 THIS MATERIAL DOES NOT CONSTITUTE AN OFFER OR SOLICITATION IN ANY JURISDICTION WHERE OR TO ANY PERSON TO WHOM IT WOULD BE UNAUTHORIZED OR UNLAWFUL TO DO SO. Although certain information has been obtained from sources believed to be reliable, we do not guarantee its accuracy, completeness or fairness. We have relied upon and assumed without independent verification, the accuracy and completeness of all information available from public sources. The portfolio risk management process includes an effort to monitor and manage risk, but does not imply low risk. Risk Considerations Municipal Securities are subject to credit/default risk, interest rate risk and certain additional risks. High - yield, lower - rated securities involve greater price volatility and present greater credit risks than higher - rated fixed income securities. Investments in fixed - income securities are subject to credit and interest rate risks. Bond prices fluctuate inversely to changes in interest rates. Therefore, a general rise in interest rates can result in the decline in the bond’s price. Credit risk is the risk that an issuer will default on payments of interest and principal. All fixed income investments may be worth less than their original cost upon redemption or maturity. Income from municipal securities is generally free from federal taxes and state taxes for residents of the issuing state. While the interest income is tax - free, capital gains, if any, will be subject to taxes. Income for some investors may be subject to the federal Alternative Minimum Tax (AMT). Past performance does not guarantee future results, which may vary. The value of investments and the income derived from investments will fluctuate and can go down as well as up. A loss of principal may occur. Views and opinions expressed are for informational purposes only and do not constitute a recommendation by GSAM to buy, sell, or hold any security. Views and opinions are current as of the date of this presentation and may be subject to change, they should not be construed as investment advice. Economic and market forecasts presented herein reflect a series of assumptions and judgments as of the date of this presentation and are subject to change without notice. These forecasts do not take into account the specific investment objectives, restrictions, tax and financial situation or other needs of any specific client. Actual data will vary and may not be reflected here. These forecasts are subject to high levels of uncertainty that may affect actual performance. Accordingly, these forecasts should be viewed as merely representative of a broad range of possible outcomes. These forecasts are estimated, based on assumptions, and are subject to significant revision and may change materially as economic and market conditions change. Goldman Sachs has no obligation to provide updates or changes to these forecasts. Case studies and examples are for illustrative purposes only. Goldman Sachs does not provide legal, tax or accounting advice, unless explicitly agreed between you and Goldman Sachs (generally through certain services offered only to clients of Private Wealth Management). Any statement contained in this presentation concerning U.S. tax matters is not intended or written to be used and cannot be used for the purpose of avoiding penalties imposed on the relevant taxpayer. Notwithstanding anything in this document to the contrary, and except as required to enable compliance with applicable securities law, you may disclose to any person the US federal and state income tax treatment and tax structure of the transaction and all materials of any kind (including tax opinions and other tax analyses) that are provided to you relating to such tax

7 treatment and tax structure, without Go
treatment and tax structure, without Goldman Sachs imposing any limitation of any kind. Investors should be aware that a determination of the tax consequences to them should take into account their specific circumstances and that the tax law is subject to change in the future or retroactively and investors are strongly urged to consult with their own tax advisor regarding any potential strategy, investment or transaction. This information discusses general market activity, industry or sector trends, or other broad - based economic, market or political conditions and should not be construed as research or investment advice. This material has been prepared by GSAM and is not financial research nor a product of Goldman Sachs Global Investment Research (GIR). It was not prepared in compliance with applicable provisions of law designed to promote the independence of financial analysis and is not subject to a prohibition on trading following the distribution of financial research. The views and opinions expressed may differ from those of Goldman Sachs Global Investment Research or other departments or divisions of Goldman Sachs and its affiliates. Investors are urged to consult with their financial advisors before buying or selling any securities. This information may not be current and GSAM has no obligation to provide any updates or changes. Valuation levels for the assets listed in the Account statements and other documents containing prices reflect GSAM’s good faith effort to ascertain fair market levels (including accrued income, if any) for all positions. The valuation information is believed by GSAM to be reliable for round lot sizes. The prices are indicative only of the assumed fair value of the positions on the relevant date. These valuation levels may not be realized by the Account upon liquidation. Market conditions and transaction size will affect liquidity and price received upon liquidation. Current exchange rates will be applied in valuing positions in foreign currency. For portfolio valuation purposes it is the responsibility of the custodian, administrator or such other third party appointed by the client, to obtain accurate and reliable information concerning the valuation of any securities including derivative instruments which are comprised in the portfolio. The information that GSAM provides should not be deemed the official pricing and valuation for the Account. GSAM is not obligated to provide pricing information to satisfy any regulatory, tax or accounting requirements to which the Client may be subject . Index Benchmarks Indices are unmanaged. The figures for the index reflect the reinvestment of all income or dividends, as applicable, but do not reflect the deduction of any fees or expenses which would reduce returns. Investors cannot invest directly in indices. The indices reference herein have been selected because they are well known, easily recognized by investors, and reflect those indices that the Investment Manager believes, in part based on industry practice, provide a suitable benchmark against which to evaluate the investment or broader market described herein. Municipal 3 yr : Bloomberg Barclays Municipal 3 Year Index The Bloomberg Barclays Municipal Bond Index is a rules - based, market - value - weighted index engineered for the long - term tax - exempt bond market. To be included in the index, bonds must be rated investment - grade (Baa3/BBB - or higher) by at least two of the following ratings agencies: Moody's, S&P, Fitch. If only two of the three agencies rate the security, the lower rating is used to determine index eligibility. If only one of the three agencies rates a security, the rating must be investment - grade. They must have an outstanding par value of at least $7 million and be issued as part of a transaction of at least $75 million. The bonds must be fixed rate, have a dated - date aft

8 er December 31, 1990, and must be at le
er December 31, 1990, and must be at least one year from their maturity date. Remarketed issues, municipal bonds, bonds with floating rates, and derivatives, are excluded from the benchmark. This index is the 3 Year (2 - 4) component of the Municipal Bond index. Municipal 1 - 10yr Blend: Bloomberg Barclays Municipal 1 - 10 Yr Blend Index The Bloomberg Barclays Municipal Bond 1 - 10 Year Blend Index is a market value - weighted index which covers the short and intermediate components of the Bloomberg Barclays Municipal Bond Index, an unmanaged, market value - weighted index which covers the U.S. investment - grade tax - exempt bond market. The Bloomberg Barclays Municipal Bond 1 - 10 Year Blend Index tracks tax - exempt municipal General Obligation, Revenue, Insured, and Prerefunded bonds with a minimum $5 million par amount outstanding, issued as part of a transaction of at least $50 million, and with a remaining maturity from 1 up to (but not including) 12 years. The index includes reinvestment of income. GSAM MUNICIPAL MARKET QUARTERLY: OUTPERFORMANCE DURING A GLOBAL YIELD SURGE GOLDMAN SACHS ASSET MANAGEMENT GENERAL DISCLOSURES 8 Municipal Aggregate: Bloomberg Barclays Aggregate Municipal Index The Bloomberg Barclays Municipal Bond Index is a rules - based, market - value - weighted index engineered for the long - term tax - exempt bond market. To be included in the index, bonds must be rated investment - grade (Baa3/BBB - or higher) by at least two of the following ratings agencies: Moody's, S&P, Fitch. If only two of the three agencies rate the security, the lower rating is used to determine index eligibility. If only one of the three agencies rates a security, the rating must be investment - grade. They must have an outstanding par value of at least $7 million and be issued as part of a transaction of at least $75 million. The bonds must be fixed rate, have a dated - date after December 31, 1990, and must be at least one year from their maturity date. Remarketed issues, taxable municipal bonds, bonds with floating rates, and derivatives, are excluded from the benchmark . Municipal High Yield: Bloomberg Barclays High Yield Municipal Index The Bloomberg Barclays Municipal High Yield Bond Index is an unmanaged index made up of bonds that are non - investment grade, unrated, or rated below Ba1 by Moody's Investors Service with a remaining maturity of at least one year. The Index figures do not include any deduction for fees, expenses or taxes. It is not possible to invest directly in an unmanaged index . Taxable Municipal: Bloomberg Barclays Taxable Municipal Index The Bloomberg Barclays Taxable Municipal Bond Index is a rules - based, market - value - weighted index engineered for the long - term taxable bond market. To be included in the index, bonds must be rated investment - grade (Baa3/BBB - or higher) by at least two of the following ratings agencies if all three rate the bond: Moody's, S&P, Fitch. If only two of the three agencies rate the security, the lower rating is used to determine index eligibility. If only one of the three agencies rates a security, the rating must be investment - grade. They must have an outstanding par value of at least $7 million and be issued as part of a transaction of at least $75 million. The bonds must be fixed rate and must be at least one year from their maturity date. Remarketed issues (unless converted to fixed rate), bonds with floating rates, and derivatives, are excluded from the benchmark . Confidentiality No part of this material may, without GSAM’s prior written consent, be (i) copied, photocopied or duplicated in any form, by any means, or (ii) distributed to any person that is not an employee, officer, director, or authorized agent of the recipient . © 2021 Goldman Sachs. All rights reserved. Goldman Sachs & Co. LLC., member FINRA Date of First Use: 4/7/2021. Compliance Code: 236599 - O