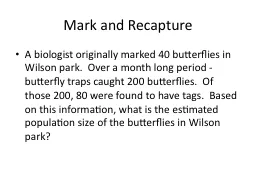
/
Mark and Recapture A biologist originally marked 40 butterflies in Wilson park.  Over Mark and Recapture A biologist originally marked 40 butterflies in Wilson park.  Over

Mark and Recapture A biologist originally marked 40 butterflies in Wilson park.  Over - PowerPoint Presentation

ventuilog
ventuilog . @ventuilog
Follow
346 views
Uploaded On 2020-06-30

Mark and Recapture A biologist originally marked 40 butterflies in Wilson park.  Over - PPT Presentation

Let us think of education as the means of developing our greatest abilities because in each of us there is a private hope and dream which if fulfilled can be translated into benefit for everyone and greater strength of the nation John F Kennedy ID: 789499

population rate birth death rate population death birth rates growth happening stage life expectancy size high infant january years

Share:

Link:

Embed:

Download Presentation from below link

Download The PPT/PDF document "Mark and Recapture A biologist originall..." is the property of its rightful owner. Permission is granted to download and print the materials on this web site for personal, non-commercial use only, and to display it on your personal computer provided you do not modify the materials and that you retain all copyright notices contained in the materials. By downloading content from our website, you accept the terms of this agreement.


Presentation Transcript

Slide1

Mark and Recapture

A biologist originally marked 40 butterflies in Wilson park.  Over a month long period ­ butterfly traps caught 200 butterflies.  Of those 200, 80 were found to have tags.  Based on this information, what is the estimated population size of the butterflies in Wilson park?

Slide2

"Let us think of education as the means of developing our greatest abilities, because in each of us there is a private hope and dream which, if fulfilled, can be translated into benefit for everyone and greater strength of the nation." -- John F. Kennedy

Slide3

Announcements

Quiz on Friday January 21

st

Extra Credit: Check Stern MASS website

Each project is worth up to 0.75 pts added to a previous EXAM.

Each student may do up to 2 (independently!!)

Due January 21, 2011

Slide4

Human Population

January 12, 2011

Slide5

Declining Death Rates

The dramatic increase in Earth’s human population in the last 200 years is because death rates have declined more rapidly than birth rates.

Slide6

Why has death rate declined?

More people have access to:

Adequate food

Clean water

Safe sewage disposal

Slide7

Life Expectancy

Def: The average number of years members of a population are likely to live

Slide8

Infant Mortality

Life expectancy is most affected by

infant mortality

, the death rate of infants less than one years old.

Infant health is affected by the parents’ access to education, food, fuel, and clean water.

Slide9

Life Expectancy By Region

Slide10

Life Expectancy

New threats arise as populations become denser.

AIDS and Tuberculosis are a concern in places where disease can spread quickly.

Slide11

The Demographic Transition

Slide12

Demographic Transition

Def: A model that describes how economic and social changes affect population growth rates.

There are 4 stages of the transition

Slide13

Stage 1: Preindustrial

Birth Rate: High

Death Rate: High

Population Size: Stable

Slide14

Stage 2: Transitional

Population Explosion Occurs!

Death Rates: Decline (hygiene, water, food).

Birth Rates: Remains high

Slide15

Stage 3: Industrial

Population growth slows.

Birth Rate: Decreases

Begins to match Death rate

Population size stabilizes

Slide16

Stage 4: Postindustrial

Birth Rate: Drops below

replacement level

birth rate.

Population Size: Begins to decrease.

Slide17

Using the Figure

What is happening to the birth rate and death rate when there is a rapid population growth?

What is happening to the birth and death rates when there is zero growth?

What is happening to the birth and death rates when population growth is negative?

Slide18

Using the Figure

What is happening to the birth rate and death rate when there is a rapid population growth?

The birth rate is higher than the death rate

What is happening to the birth and death rates when there is zero growth?

They are about the same

What is happening to the birth and death rates when population growth is negative?

The birth rate is lower than the death rate.

Slide19

Women and Fertility

Total Fertility Rate:

Developed Countries: 1.6 children per woman

Developing Countries: 3.1 children per woman

Slide20

Changing Population Trends

A rapidly growing population uses resources at an increased rate and can overwhelm the infrastructure of a community.

Infrastructure: The basic facilities and services that support a community, such as schools and hospitals.

Slide21

Urban Sprawl

Slide22

Sprawl

uses

more land than necessary;

has a lower population density than traditional cities and towns (e.g., fewer people in larger houses);

creates a dependence on cars for almost everything;

results in fragmented open spaces, wide gaps between development, and a scattered appearance;

Slide23

Sprawl

separates uses into distinct areas (so, you don't usually have a store or a movie theater within walking distance from your home);

is characterized by repetitive one-story commercial buildings surrounded by acres of parking; and.