1 1 1 1 Dr. Edward Altman NYU Stern School
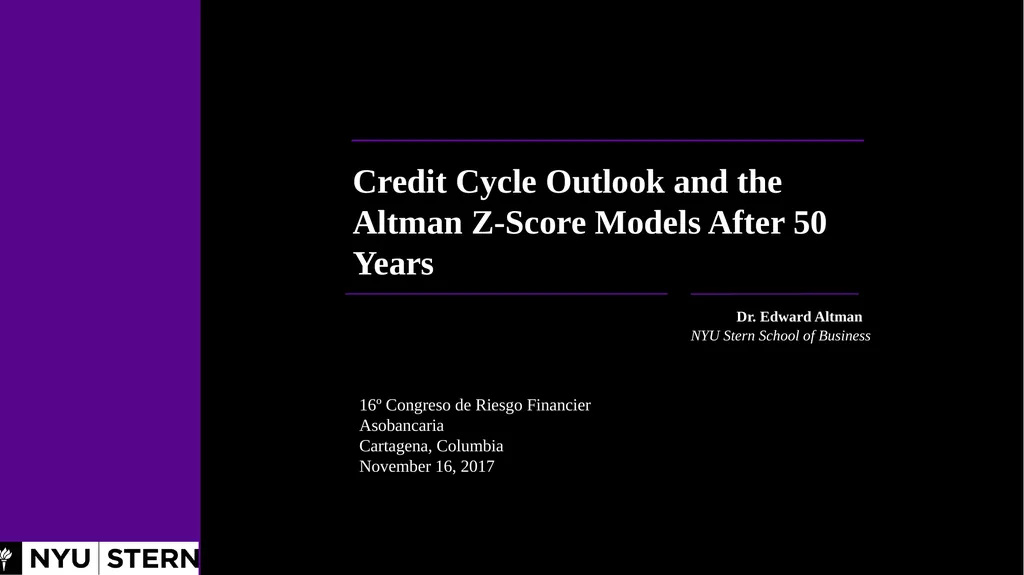
Description: 1 1 1 1 Dr. Edward Altman NYU Stern School of Business Credit Cycle Outlook and the Altman Z-Score Models After 50 Years 16º Congreso de Riesgo Financier Asobancaria Cartagena, Columbia November 16, 2017 2 50 Years of the Altman Family of
Related Topics
Download Presentation
"1 1 1 1 Dr. Edward Altman NYU Stern School" is the property of its rightful owner. Permission is granted to download and print the materials on this website for personal, non-commercial use only, and to display it on your personal computer provided you do not modify the materials and that you retain all copyright notices contained in the materials. By downloading content from our website, you accept the terms of this agreement.
Presentation Transcript
slide1. 1 1 1 1 Dr. Edward Altman NYU Stern School of Business Credit Cycle Outlook and the Altman Z-Score Models After 50 Years 16º Congreso de Riesgo Financier
Asobancaria
Cartagena, Columbia
November 16, 2017<br>
slide2. 2 50 Years of the Altman Family of Z-Score Models: Their Applications in Banking & Financial Markets<br>
slide3. Scoring Systems 3 Qualitative (Subjective) – 1800s
Univariate (Accounting/Market Measures)
Rating Agency (e.g. Moody’s (1909), S&P (1916) and Corporate (e.g., DuPont) Systems (early 1900s)
Multivariate (Accounting/Market Measures) – Late 1960s (Z-Score) - Present
Discriminant, Logit, Probit Models (Linear, Quadratic)
Non-Linear and “Black-Box” Models (e.g., Recursive Partitioning Neural Networks, 1990s)
Discriminant and Logit Models in Use for
Consumer Models - Fair Isaacs (FICO Scores)
Manufacturing Firms (1968) – Z-Scores
Extensions and Innovations for Specific Industries and Countries (1970s – Present)
ZETA Score – Industrials (1977)
Private Firm Models (e.g., Z’-Score (1983), Z”-Score (1995))
EM Score – Emerging Markets (1995)
Bank Specialized Systems (1990s)
SMEs (e.g. Edmister (1972), Altman & Sabato (2007) & Wiserfunding (2016))
Option/Contingent Claims Models (1970s – Present)
Risk of Ruin (Wilcox, 1973)
KMVs Credit Monitor Model (1993) – Extensions of Merton (1974) Structural Framework<br>
slide4. 4 Scoring Systems(continued) Artificial Intelligence Systems (1990s – Present)
Expert Systems
Neural Networks
Machine Learning
Blended Ratio/Market Value Models/Macro Data
Altman Z-Score (Fundamental Ratios and Market Values) – 1968
Bond Score (Credit Sights, 2000; RiskCalc Moody’s, 2000)
Hazard (Shumway), 2001)
Kamakura’s Reduced Form, Term Structure Model (2002)
Z-Metrics (Altman, et al, Risk Metrics©, 2010)
Re-introduction of Qualitative Factors/FinTech
Stand-alone Metrics, e.g., Invoices, Payment History
Multiple Factors – Data Mining (Big Data Payments, Governance, time spent on individual firm reports [e.g., CreditRiskMonitor’s revised FRISK Scores, 2017], etc.)
Enhanced Blended Models (2000s)<br>
slide5. 5 5 Major Agencies Bond Rating Categories 5<br>
slide6. 6 1978 – 2017 (Mid-year US$ billions) Size of the US High-Yield Bond Market Source: NYU Salomon Center estimates using Credit Suisse, S&P and Citi data.<br>
slide7. Size of Corporate HY Bond Market: U.S., Europe, Emerging Markets & Asia (ex. Japan) ($ Billions) 7 Source: NYU Salomon Center, Credit Suisse, LIM Advisors Ltd. 2Q 2017 *Mainly Latin America<br>
slide8. 8 Problems With Traditional Financial Ratio Analysis Univariate Technique
1-at-a-time
No “Bottom Line”
Subjective Weightings
Ambiguous
Misleading<br>
slide9. 9 Forecasting Distress With Discriminant Analysis Linear Form
Z = a1x1 + a2x2 + a3x3 + …… + anxn
Z = Discriminant Score (Z Score)
a1 an = Discriminant Coefficients (Weights)
x1 xn = Discriminant Variables (e.g. Ratios)
Example x x x x x x x x x x x x x x x x x x x x x x x x x x x x x x x x x x x x x x x EBIT
TA EQUITY/DEBT<br>
slide10. 10 Z-Score Component Definitions and Weightings Variable Definition Weighting Factor
X1 Working Capital 1.2
Total Assets
X2 Retained Earnings 1.4
Total Assets
X3 EBIT 3.3
Total Assets
X4 Market Value of Equity 0.6
Book Value of Total Liabilities
X5 Sales 1.0
Total Assets<br>
slide11. 11 Zones of Discrimination:Original Z - Score Model (1968) Z > 2.99 - “Safe” Zone
1.8 < Z < 2.99 - “Grey” Zone
Z < 1.80 - “Distress” Zone<br>
slide12. Time Series Impact On Corporate Z-Scores 12 • Credit Risk Migration
- Greater Use of Leverage
- Impact of HY Bond & LL Markets
- Global Competition
- More and Larger Bankruptcies
• Increased Type II Error<br>
slide13. 13 Estimating Probability of Default (PD) and Probability of Loss Given Defaults (LGD) Method #1
Credit scores on new or existing debt
Bond rating equivalents on new issues (Mortality) or existing issues (Rating Agency Cumulative Defaults)
Utilizing mortality or cumulative default rates to estimate marginal and cumulative defaults
Estimating Default Recoveries and Probability of Loss
Method #2
Credit scores on new or existing debt
Direct estimation of the probability of default
Based on PDs, assign a rating or<br>
slide14. 14 Median Z-Score by S&P Bond Rating for U.S. Manufacturing Firms: 1992 - 2013 Sources: Compustat Database, mainly S&P 500 firms, compilation by NYU Salomon Center, Stern School of Business. *AAA Only.<br>
slide15. 15 All Rated Corporate Bonds*
1971-2016 Mortality Rates by Original Rating *Rated by S&P at Issuance
Based on 3,280 issues
Source: Standard & Poor's (New York) and Author's Compilation Years After Issuance<br>
slide16. 16 All Rated Corporate Bonds*
1971-2016 Mortality Losses by Original Rating *Rated by S&P at Issuance
Based on 2,714 issues
Source: Standard & Poor's (New York) and Author's Compilation Years After Issuance<br>
slide17. 17 Z Score Trend - LTV Corp. Grey Zone Bankrupt
July ‘86 Safe Zone Distress Zone 2.99 1.8 BB+ BBB- B- B- CCC+ CCC+ D<br>
slide18. 18 IBM CorporationZ Score (1980 – 2001) Operating Co. Safe Zone Consolidated Co. Grey Zone BBB BB B 1/93: Downgrade AAA to AA- July 1993: Downgrade AA- to A<br>
slide19. 19 Z-Score Model Applied to GM (Consolidated Data):
Bond Rating Equivalents and Scores from 2005 – 2016 Z- Score: General Motors Co. Ch. 11 Filing
6/01/09 Upgrade to BBB- by S&P
9/25/14 Full Emergence from Bankruptcy 3/31/11 Emergence, New Co. Only, from Bankruptcy, 7/13/09<br>
slide20. Trend of ICA’s Stock Price & Z-Scores
(Bond Default – December 29, 2015)<br>
slide21. Peru: Z”-Scores for Austral Group S.A. 21 Bankruptcy: Mar. 2000<br>
slide22. 22 Additional Altman Z-Score Models:
Private Firm Model (1968)
Non-U.S., Emerging Markets Models for Non Financial Industrial Firms (1995)
e.g. Latin America (1977, 1995), China (2010), etc.
Sovereign Risk Bottom-Up Model (2010)
SME Models for the U.S. (2007) & Europe
e.g. Italian Minibonds (2016), U.K. (2017), Spain (?)<br>
slide23. 23 Z” Score Model for Manufacturers, Non-Manufacturer Industrials; Developed and Emerging Market Credits (1995) Z” = 3.25 + 6.56X1 + 3.26X2 + 6.72X3 + 1.05X4
X1 = Current Assets - Current Liabilities
Total Assets
X2 = Retained Earnings
Total Assets
X3 = Earnings Before Interest and Taxes
Total Assets
X4 = Book Value of Equity
Total Liabilities<br>
slide24. 24 US Bond Rating Equivalents Based on Z”-Score Model Z”=3.25+6.56X1+3.26X2+6.72X3+1.05X4 aSample Size in Parantheses. bInterpolated between CCC and CC/D. cBased on 94 Chapter 11 bankruptcy filings, 2010-2013.
Sources: Compustat, Company Filings and S&P.<br>
slide25. 25 Z and Z”-Score Models Applied to Sears, Roebuck & Co.:
Bond Rating Equivalents and Scores from 2014 – 2016 Z and Z”- Score: Sears, Roebuck & Co. B+ B B- D CCC CCC Source: E. Altman, NYU Salomon Center<br>
slide26. 26 Z and Z”-Score Models Applied to Toys “R” Us, Inc.:
Bond Rating Equivalents and Scores from 2014 – 2Q17 Z and Z”- Score: Toys “R” Us, Inc. B- B- CCC+ Source: E. Altman, NYU Salomon Center B- Ch. 11 Filed 9/18/17<br>
slide27. 27 27 27 Current Conditions and Outlook in Global Credit Markets<br>
slide28. 28 Where Are We in the Credit Cycle: Outlook for Global Credit Markets<br>
slide29. Benign Credit Cycle? Is It Over? 29 Length of Benign Credit Cycles: Is the Current Cycle Over? No.
Default Rates (no)
Default Forecast (no)
Recovery Rates (no)
Yields (no)
Liquidity (no)<br>
slide30. Straight Bonds Only Excluding Defaulted Issues From Par Value Outstanding, (US$ millions), 1971 – 2017 (11/03) Historical H.Y. Bond Default Rates 30 a Weighted by par value of amount outstanding for each year. Source: NYU Salomon Center and Citigroup/Credit Suisse estimates<br>
slide31. Quarterly Default Rate and Four-Quarter Moving Average
1989 – 2017 (3Q) Source: Author’s Compilations Default Rates on High-Yield Bonds 31<br>
slide32. June 01, 2007 – November 03, 2017 Sources: Citigroup Yieldbook Index Data and Bank of America Merrill Lynch. 32 YTM & Option-Adjusted Spreads Between High Yield Markets & U.S. Treasury Notes YTMS = 539bp,
OAS = 544bp 12/16/08 (YTMS = 2,046bp, OAS = 2,144bp) 6/12/07 (YTMS = 260bp, OAS = 249bp) 11/03/17 (YTMS = 385p, OAS = 352bp)<br>
slide33. 33 Comparative Health of High-Yield Firms (2007 vs. 2012/2014/3Q 2016)<br>
slide34. Comparing Financial Strength of High-Yield Bond Issuers in 2007& 2012/2014/3Q 2016 34 *Bond Rating Equivalent
Source: Authors’ calculations, data from Altman and Hotchkiss (2006) and S&P Capital IQ/Compustat.<br>
slide35. Combining Micro Firm Analysis (e.g. Z-Scores) with Macro Risk<br>
slide36. U.S. Non-financial Corporate Debt to GDP: Comparison to 4-Quarter Moving Average Default Rate January 1, 1987 – March 31, 2017 Sources: FRED, Federal Reserve Bank of St. Louis and Altman/Kuehne High-Yield Default Rate data.<br>
slide37. Financial Distress (Z-Score) Prediction Applications<br>
slide38. 38 Applying the Z Score Models to Recent Energy & Mining Company Bankruptcies Source: S&P Capital IQ * One or Two Quarters before Filing
** Five or Six Quarters before Filing 2015-9/15/2017<br>
slide39. Managing a Financial Turnaround: Applications of the Z-Score Model The GTI Case 39<br>
slide40. Objectives To demonstrate that specific management tools which work are available in crisis situations
To illustrate that predictive models can be turned “inside out” and used as internal management tools to, in effect, reverse their predictions
To illustrate an interactive, as opposed to a passive, approach to financial decision making 40<br>
slide41. Z-Score Component Definitions 41<br>
slide42. Z-Score Distressed Firm Predictor:Application to GTI Corporation (1972 – 1975) 42<br>
slide43. Management Tools Used Altman’s Distressed Firm Predictor (Z-Score)
Function / Location Matrix
Financial Statements
Planning Systems
Trend Charts 43<br>
slide44. Managerial & Financial Restructuring
Actions and Impact on Z-Score 44<br>
slide45. Z-Score Distressed Firm PredictorApplication to GTI Corporation (1972 – 1984) 45<br>
Asobancaria
Cartagena, Columbia
November 16, 2017<br>
slide2. 2 50 Years of the Altman Family of Z-Score Models: Their Applications in Banking & Financial Markets<br>
slide3. Scoring Systems 3 Qualitative (Subjective) – 1800s
Univariate (Accounting/Market Measures)
Rating Agency (e.g. Moody’s (1909), S&P (1916) and Corporate (e.g., DuPont) Systems (early 1900s)
Multivariate (Accounting/Market Measures) – Late 1960s (Z-Score) - Present
Discriminant, Logit, Probit Models (Linear, Quadratic)
Non-Linear and “Black-Box” Models (e.g., Recursive Partitioning Neural Networks, 1990s)
Discriminant and Logit Models in Use for
Consumer Models - Fair Isaacs (FICO Scores)
Manufacturing Firms (1968) – Z-Scores
Extensions and Innovations for Specific Industries and Countries (1970s – Present)
ZETA Score – Industrials (1977)
Private Firm Models (e.g., Z’-Score (1983), Z”-Score (1995))
EM Score – Emerging Markets (1995)
Bank Specialized Systems (1990s)
SMEs (e.g. Edmister (1972), Altman & Sabato (2007) & Wiserfunding (2016))
Option/Contingent Claims Models (1970s – Present)
Risk of Ruin (Wilcox, 1973)
KMVs Credit Monitor Model (1993) – Extensions of Merton (1974) Structural Framework<br>
slide4. 4 Scoring Systems(continued) Artificial Intelligence Systems (1990s – Present)
Expert Systems
Neural Networks
Machine Learning
Blended Ratio/Market Value Models/Macro Data
Altman Z-Score (Fundamental Ratios and Market Values) – 1968
Bond Score (Credit Sights, 2000; RiskCalc Moody’s, 2000)
Hazard (Shumway), 2001)
Kamakura’s Reduced Form, Term Structure Model (2002)
Z-Metrics (Altman, et al, Risk Metrics©, 2010)
Re-introduction of Qualitative Factors/FinTech
Stand-alone Metrics, e.g., Invoices, Payment History
Multiple Factors – Data Mining (Big Data Payments, Governance, time spent on individual firm reports [e.g., CreditRiskMonitor’s revised FRISK Scores, 2017], etc.)
Enhanced Blended Models (2000s)<br>
slide5. 5 5 Major Agencies Bond Rating Categories 5<br>
slide6. 6 1978 – 2017 (Mid-year US$ billions) Size of the US High-Yield Bond Market Source: NYU Salomon Center estimates using Credit Suisse, S&P and Citi data.<br>
slide7. Size of Corporate HY Bond Market: U.S., Europe, Emerging Markets & Asia (ex. Japan) ($ Billions) 7 Source: NYU Salomon Center, Credit Suisse, LIM Advisors Ltd. 2Q 2017 *Mainly Latin America<br>
slide8. 8 Problems With Traditional Financial Ratio Analysis Univariate Technique
1-at-a-time
No “Bottom Line”
Subjective Weightings
Ambiguous
Misleading<br>
slide9. 9 Forecasting Distress With Discriminant Analysis Linear Form
Z = a1x1 + a2x2 + a3x3 + …… + anxn
Z = Discriminant Score (Z Score)
a1 an = Discriminant Coefficients (Weights)
x1 xn = Discriminant Variables (e.g. Ratios)
Example x x x x x x x x x x x x x x x x x x x x x x x x x x x x x x x x x x x x x x x EBIT
TA EQUITY/DEBT<br>
slide10. 10 Z-Score Component Definitions and Weightings Variable Definition Weighting Factor
X1 Working Capital 1.2
Total Assets
X2 Retained Earnings 1.4
Total Assets
X3 EBIT 3.3
Total Assets
X4 Market Value of Equity 0.6
Book Value of Total Liabilities
X5 Sales 1.0
Total Assets<br>
slide11. 11 Zones of Discrimination:Original Z - Score Model (1968) Z > 2.99 - “Safe” Zone
1.8 < Z < 2.99 - “Grey” Zone
Z < 1.80 - “Distress” Zone<br>
slide12. Time Series Impact On Corporate Z-Scores 12 • Credit Risk Migration
- Greater Use of Leverage
- Impact of HY Bond & LL Markets
- Global Competition
- More and Larger Bankruptcies
• Increased Type II Error<br>
slide13. 13 Estimating Probability of Default (PD) and Probability of Loss Given Defaults (LGD) Method #1
Credit scores on new or existing debt
Bond rating equivalents on new issues (Mortality) or existing issues (Rating Agency Cumulative Defaults)
Utilizing mortality or cumulative default rates to estimate marginal and cumulative defaults
Estimating Default Recoveries and Probability of Loss
Method #2
Credit scores on new or existing debt
Direct estimation of the probability of default
Based on PDs, assign a rating or<br>
slide14. 14 Median Z-Score by S&P Bond Rating for U.S. Manufacturing Firms: 1992 - 2013 Sources: Compustat Database, mainly S&P 500 firms, compilation by NYU Salomon Center, Stern School of Business. *AAA Only.<br>
slide15. 15 All Rated Corporate Bonds*
1971-2016 Mortality Rates by Original Rating *Rated by S&P at Issuance
Based on 3,280 issues
Source: Standard & Poor's (New York) and Author's Compilation Years After Issuance<br>
slide16. 16 All Rated Corporate Bonds*
1971-2016 Mortality Losses by Original Rating *Rated by S&P at Issuance
Based on 2,714 issues
Source: Standard & Poor's (New York) and Author's Compilation Years After Issuance<br>
slide17. 17 Z Score Trend - LTV Corp. Grey Zone Bankrupt
July ‘86 Safe Zone Distress Zone 2.99 1.8 BB+ BBB- B- B- CCC+ CCC+ D<br>
slide18. 18 IBM CorporationZ Score (1980 – 2001) Operating Co. Safe Zone Consolidated Co. Grey Zone BBB BB B 1/93: Downgrade AAA to AA- July 1993: Downgrade AA- to A<br>
slide19. 19 Z-Score Model Applied to GM (Consolidated Data):
Bond Rating Equivalents and Scores from 2005 – 2016 Z- Score: General Motors Co. Ch. 11 Filing
6/01/09 Upgrade to BBB- by S&P
9/25/14 Full Emergence from Bankruptcy 3/31/11 Emergence, New Co. Only, from Bankruptcy, 7/13/09<br>
slide20. Trend of ICA’s Stock Price & Z-Scores
(Bond Default – December 29, 2015)<br>
slide21. Peru: Z”-Scores for Austral Group S.A. 21 Bankruptcy: Mar. 2000<br>
slide22. 22 Additional Altman Z-Score Models:
Private Firm Model (1968)
Non-U.S., Emerging Markets Models for Non Financial Industrial Firms (1995)
e.g. Latin America (1977, 1995), China (2010), etc.
Sovereign Risk Bottom-Up Model (2010)
SME Models for the U.S. (2007) & Europe
e.g. Italian Minibonds (2016), U.K. (2017), Spain (?)<br>
slide23. 23 Z” Score Model for Manufacturers, Non-Manufacturer Industrials; Developed and Emerging Market Credits (1995) Z” = 3.25 + 6.56X1 + 3.26X2 + 6.72X3 + 1.05X4
X1 = Current Assets - Current Liabilities
Total Assets
X2 = Retained Earnings
Total Assets
X3 = Earnings Before Interest and Taxes
Total Assets
X4 = Book Value of Equity
Total Liabilities<br>
slide24. 24 US Bond Rating Equivalents Based on Z”-Score Model Z”=3.25+6.56X1+3.26X2+6.72X3+1.05X4 aSample Size in Parantheses. bInterpolated between CCC and CC/D. cBased on 94 Chapter 11 bankruptcy filings, 2010-2013.
Sources: Compustat, Company Filings and S&P.<br>
slide25. 25 Z and Z”-Score Models Applied to Sears, Roebuck & Co.:
Bond Rating Equivalents and Scores from 2014 – 2016 Z and Z”- Score: Sears, Roebuck & Co. B+ B B- D CCC CCC Source: E. Altman, NYU Salomon Center<br>
slide26. 26 Z and Z”-Score Models Applied to Toys “R” Us, Inc.:
Bond Rating Equivalents and Scores from 2014 – 2Q17 Z and Z”- Score: Toys “R” Us, Inc. B- B- CCC+ Source: E. Altman, NYU Salomon Center B- Ch. 11 Filed 9/18/17<br>
slide27. 27 27 27 Current Conditions and Outlook in Global Credit Markets<br>
slide28. 28 Where Are We in the Credit Cycle: Outlook for Global Credit Markets<br>
slide29. Benign Credit Cycle? Is It Over? 29 Length of Benign Credit Cycles: Is the Current Cycle Over? No.
Default Rates (no)
Default Forecast (no)
Recovery Rates (no)
Yields (no)
Liquidity (no)<br>
slide30. Straight Bonds Only Excluding Defaulted Issues From Par Value Outstanding, (US$ millions), 1971 – 2017 (11/03) Historical H.Y. Bond Default Rates 30 a Weighted by par value of amount outstanding for each year. Source: NYU Salomon Center and Citigroup/Credit Suisse estimates<br>
slide31. Quarterly Default Rate and Four-Quarter Moving Average
1989 – 2017 (3Q) Source: Author’s Compilations Default Rates on High-Yield Bonds 31<br>
slide32. June 01, 2007 – November 03, 2017 Sources: Citigroup Yieldbook Index Data and Bank of America Merrill Lynch. 32 YTM & Option-Adjusted Spreads Between High Yield Markets & U.S. Treasury Notes YTMS = 539bp,
OAS = 544bp 12/16/08 (YTMS = 2,046bp, OAS = 2,144bp) 6/12/07 (YTMS = 260bp, OAS = 249bp) 11/03/17 (YTMS = 385p, OAS = 352bp)<br>
slide33. 33 Comparative Health of High-Yield Firms (2007 vs. 2012/2014/3Q 2016)<br>
slide34. Comparing Financial Strength of High-Yield Bond Issuers in 2007& 2012/2014/3Q 2016 34 *Bond Rating Equivalent
Source: Authors’ calculations, data from Altman and Hotchkiss (2006) and S&P Capital IQ/Compustat.<br>
slide35. Combining Micro Firm Analysis (e.g. Z-Scores) with Macro Risk<br>
slide36. U.S. Non-financial Corporate Debt to GDP: Comparison to 4-Quarter Moving Average Default Rate January 1, 1987 – March 31, 2017 Sources: FRED, Federal Reserve Bank of St. Louis and Altman/Kuehne High-Yield Default Rate data.<br>
slide37. Financial Distress (Z-Score) Prediction Applications<br>
slide38. 38 Applying the Z Score Models to Recent Energy & Mining Company Bankruptcies Source: S&P Capital IQ * One or Two Quarters before Filing
** Five or Six Quarters before Filing 2015-9/15/2017<br>
slide39. Managing a Financial Turnaround: Applications of the Z-Score Model The GTI Case 39<br>
slide40. Objectives To demonstrate that specific management tools which work are available in crisis situations
To illustrate that predictive models can be turned “inside out” and used as internal management tools to, in effect, reverse their predictions
To illustrate an interactive, as opposed to a passive, approach to financial decision making 40<br>
slide41. Z-Score Component Definitions 41<br>
slide42. Z-Score Distressed Firm Predictor:Application to GTI Corporation (1972 – 1975) 42<br>
slide43. Management Tools Used Altman’s Distressed Firm Predictor (Z-Score)
Function / Location Matrix
Financial Statements
Planning Systems
Trend Charts 43<br>
slide44. Managerial & Financial Restructuring
Actions and Impact on Z-Score 44<br>
slide45. Z-Score Distressed Firm PredictorApplication to GTI Corporation (1972 – 1984) 45<br>