
1 QUARTER 4 PERFORMANCE AND FINANCE REPORT



Description: 1 QUARTER 4 PERFORMANCE AND FINANCE REPORT Manabela Chauke, Director, PSiRA 15 May 2018 DELEGATION COUNCIL MEMBERS: Mr. Nhlanhla Ngubane : Acting Chairperson of Council MANAGEMENT TEAM Mr. Manabela(Sam) Chauke : Director Mrs. Mmatlou
Related Topics
Download Presentation
"1 QUARTER 4 PERFORMANCE AND FINANCE REPORT" is the property of its rightful owner. Permission is granted to download and print the materials on this website for personal, non-commercial use only, and to display it on your personal computer provided you do not modify the materials and that you retain all copyright notices contained in the materials. By downloading content from our website, you accept the terms of this agreement.
Presentation Transcript
slide1. 1 QUARTER 4 PERFORMANCE AND FINANCE REPORT Manabela Chauke, Director, PSiRA
15 May 2018<br>
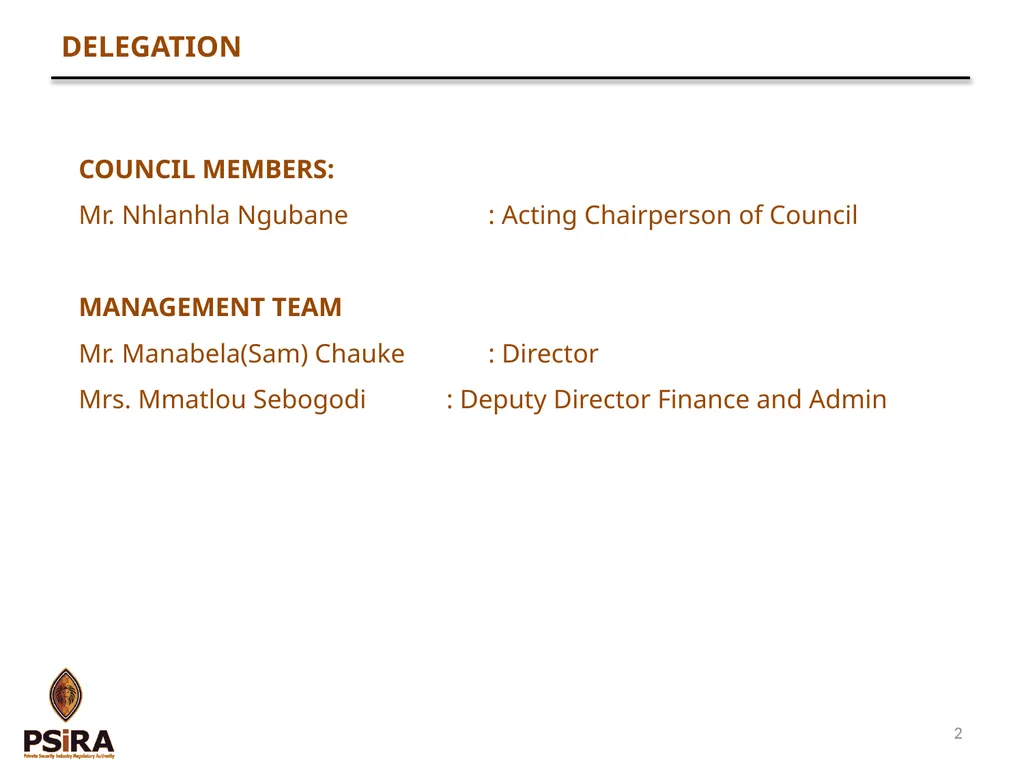
slide2. DELEGATION COUNCIL MEMBERS:
Mr. Nhlanhla Ngubane : Acting Chairperson of Council
MANAGEMENT TEAM
Mr. Manabela(Sam) Chauke : Director
Mrs. Mmatlou Sebogodi : Deputy Director Finance and Admin 2<br>
slide3. PRESENTATION OVERVIEW PART A: KEY HIGHLIGHTS
PART B: 3rd QUARTER PREDETERMINED OBJECTIVES
PART B: 3rd QUARTER FINANCIAL PERFORMANCE
PART B: 4th QUARTER PREDETERMINED OBJECTIVES
PART C: 4th QUARTER FINANCIAL PERFORMANCE 3<br>
slide4. KEY HIGHLIGHTS 4<br>
slide5. MATTERS OF PROGRESS Audit of firearms in the Private Security Industry.
Regulations on issue, use and possession of firearms.
Review of the funding model and introduction of the Private Security Levies Act. 5<br>
slide6. QUARTER 3
PREDETERMINED OBJECTIVES 6<br>
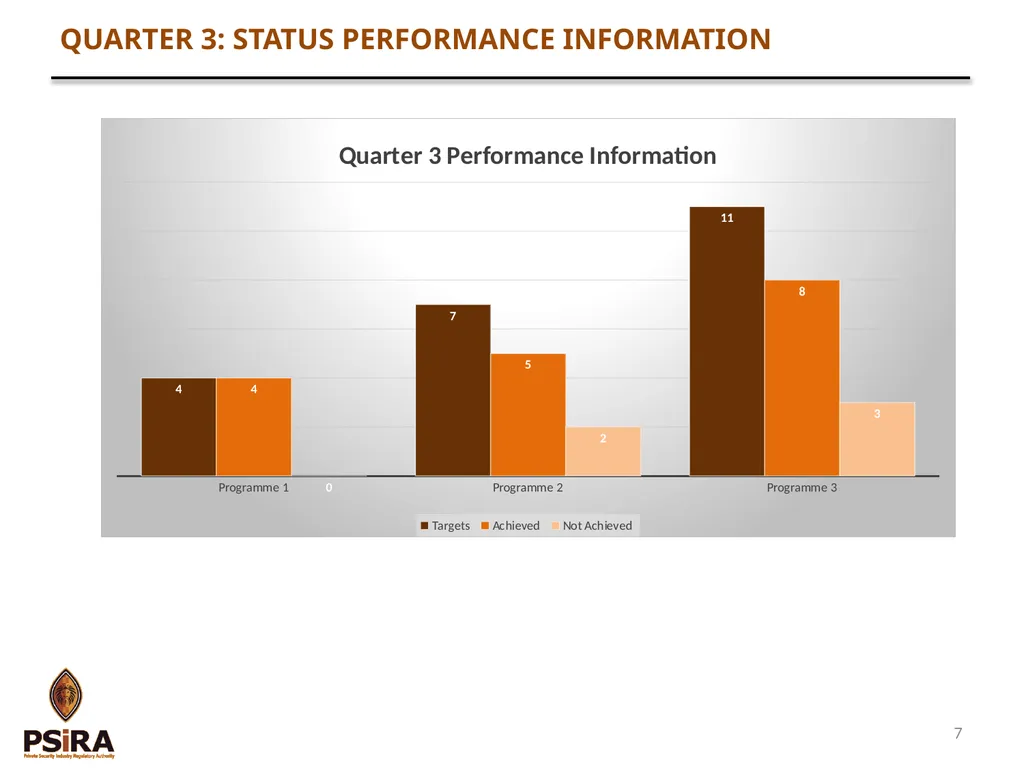
slide7. QUARTER 3: STATUS PERFORMANCE INFORMATION 7<br>
slide8. QUARTER 3
FINANCIAL PERFORMANCE 8<br>
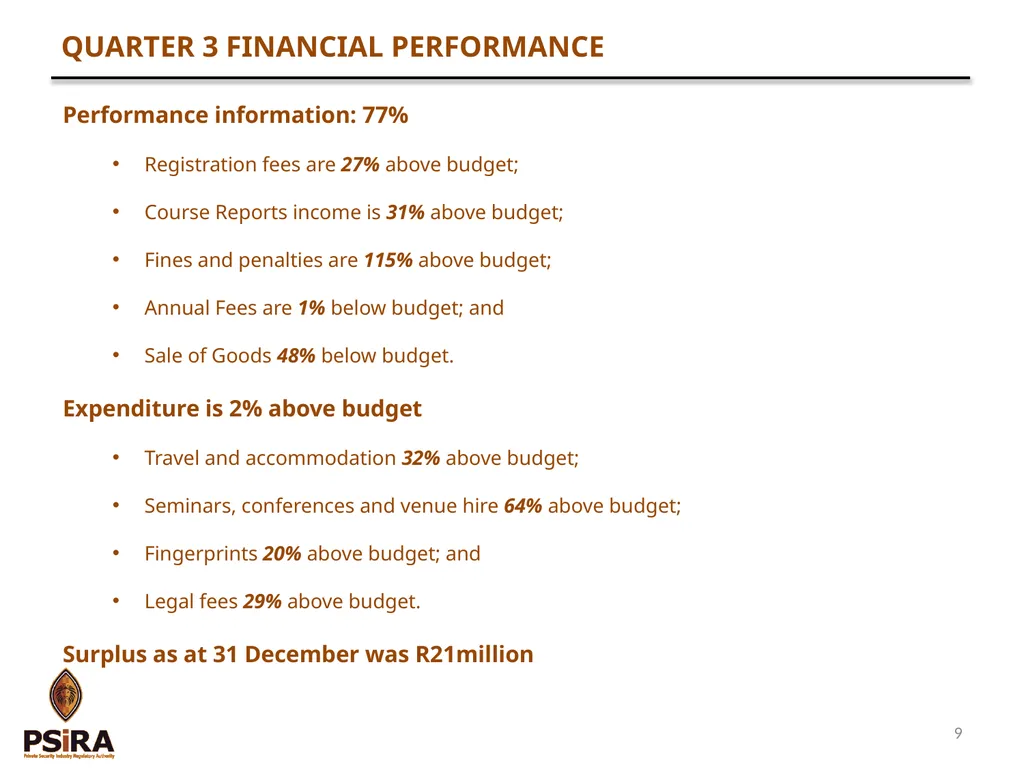
slide9. QUARTER 3 FINANCIAL PERFORMANCE Performance information: 77%
Registration fees are 27% above budget;
Course Reports income is 31% above budget;
Fines and penalties are 115% above budget;
Annual Fees are 1% below budget; and
Sale of Goods 48% below budget.
Expenditure is 2% above budget
Travel and accommodation 32% above budget;
Seminars, conferences and venue hire 64% above budget;
Fingerprints 20% above budget; and
Legal fees 29% above budget.
Surplus as at 31 December was R21million 9<br>
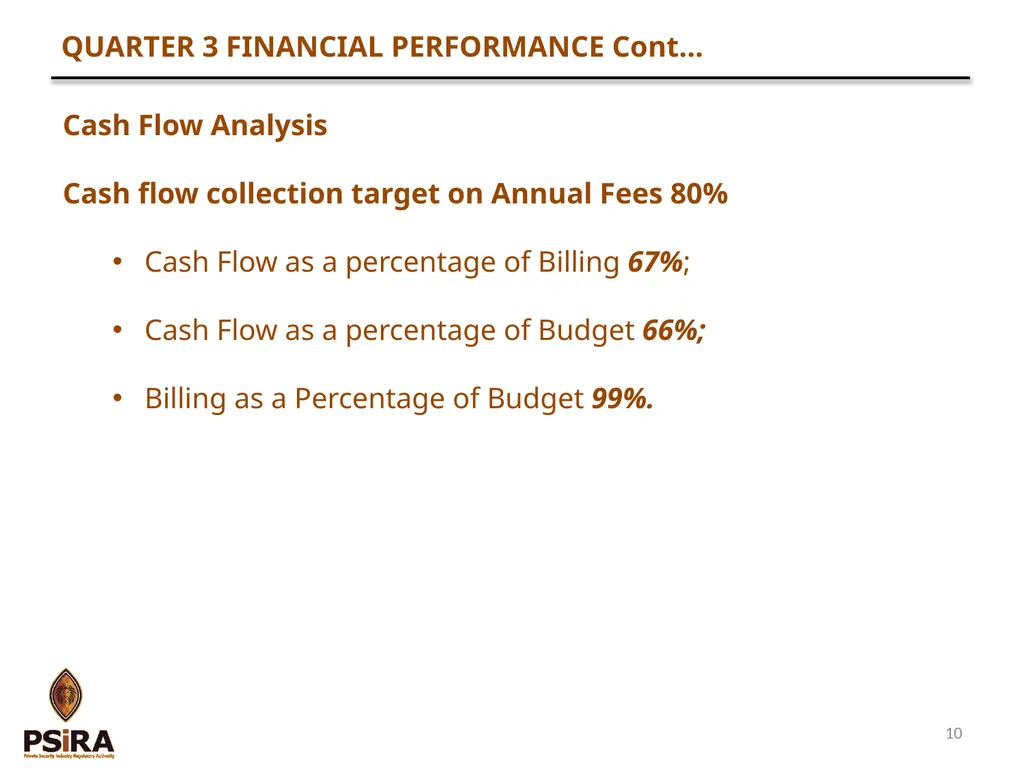
slide10. QUARTER 3 FINANCIAL PERFORMANCE Cont… Cash Flow Analysis
Cash flow collection target on Annual Fees 80%
Cash Flow as a percentage of Billing 67%;
Cash Flow as a percentage of Budget 66%;
Billing as a Percentage of Budget 99%. 10<br>
slide11. QUARTER 4
PREDETERMINED OBJECTIVES 11<br>
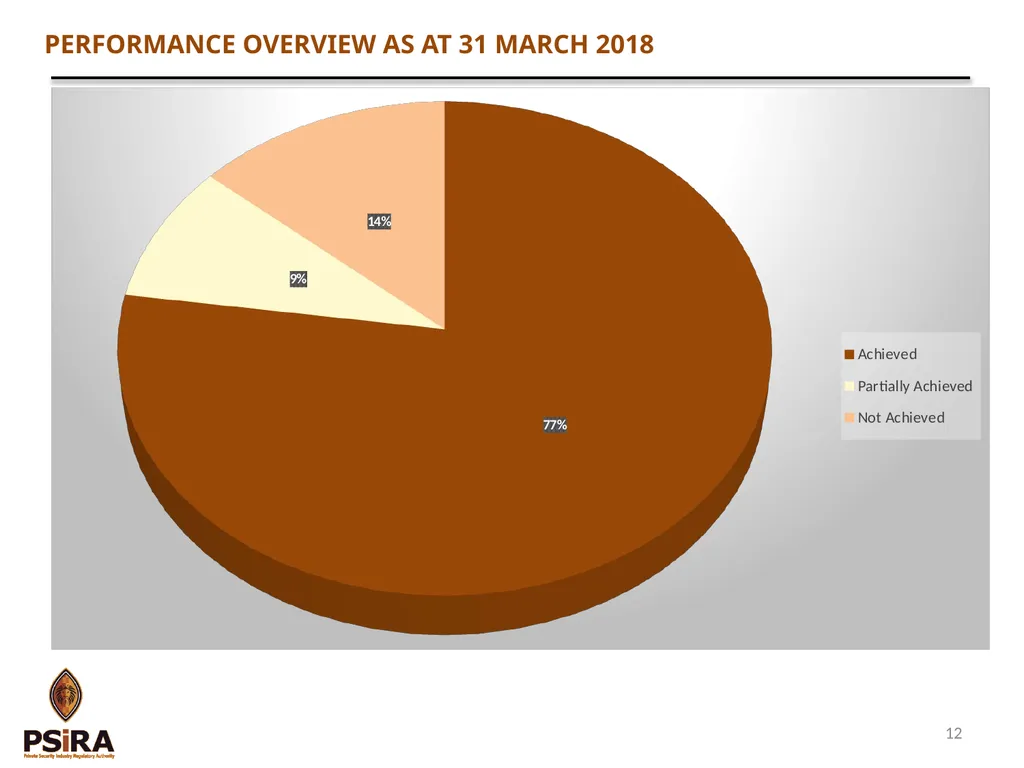
slide12. PERFORMANCE OVERVIEW AS AT 31 MARCH 2018 12<br>
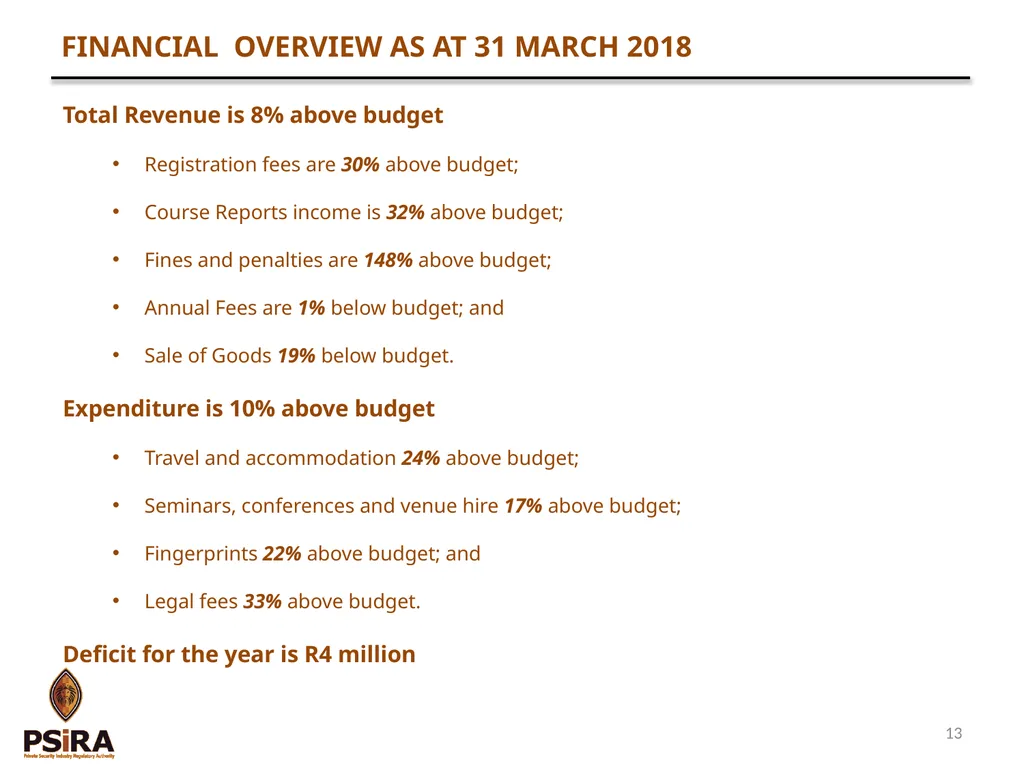
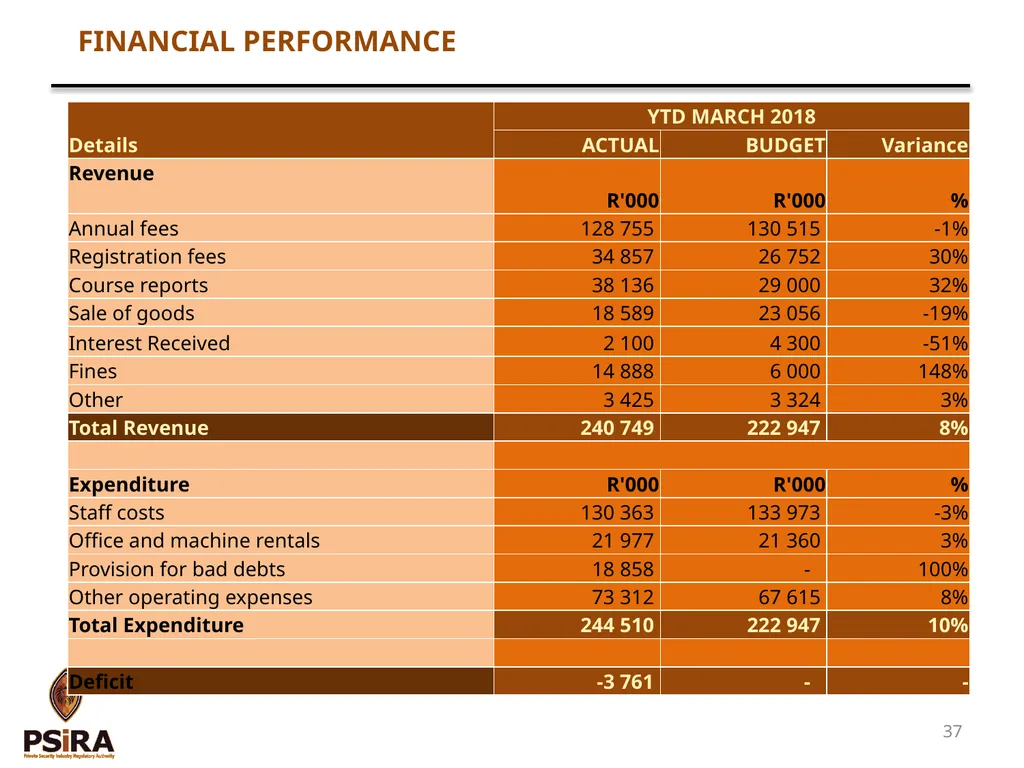
slide13. FINANCIAL OVERVIEW AS AT 31 MARCH 2018 Total Revenue is 8% above budget
Registration fees are 30% above budget;
Course Reports income is 32% above budget;
Fines and penalties are 148% above budget;
Annual Fees are 1% below budget; and
Sale of Goods 19% below budget.
Expenditure is 10% above budget
Travel and accommodation 24% above budget;
Seminars, conferences and venue hire 17% above budget;
Fingerprints 22% above budget; and
Legal fees 33% above budget.
Deficit for the year is R4 million 13<br>
slide14. QUARTER 4
PREDETERMINED OBJECTIVES 14<br>
slide15. Tittle Goes here… PROGRAMME 1
FINANCE
AND
ADMINISTRATION 15<br>
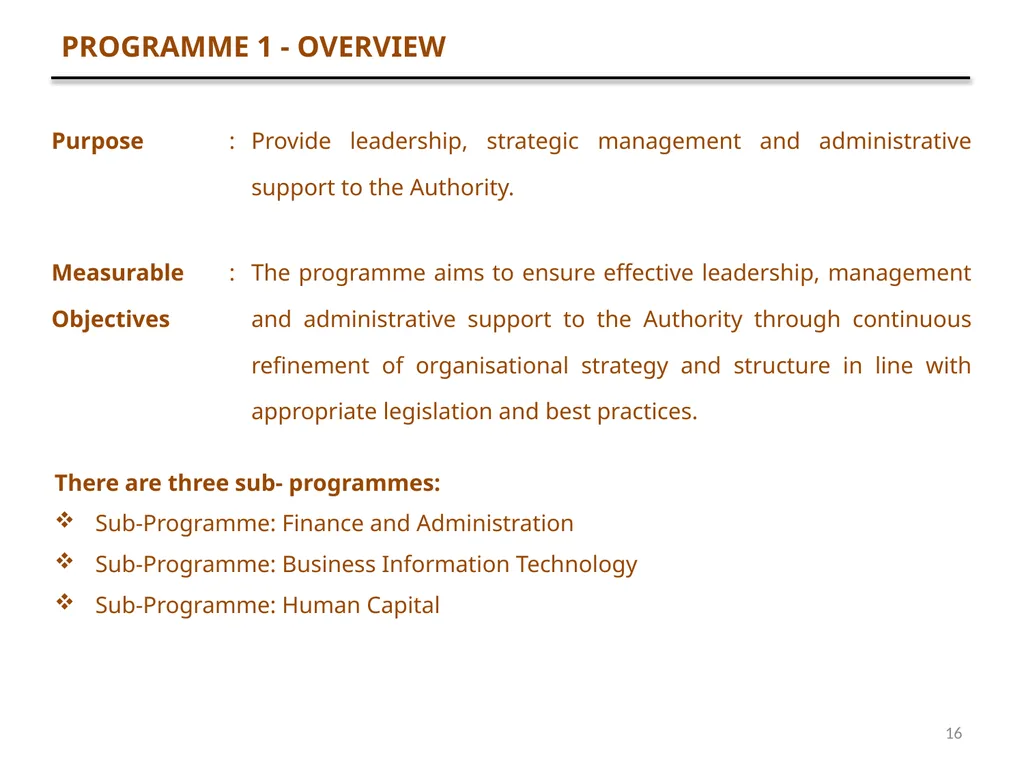
slide16. PROGRAMME 1 - OVERVIEW There are three sub- programmes:
Sub-Programme: Finance and Administration
Sub-Programme: Business Information Technology
Sub-Programme: Human Capital 16<br>
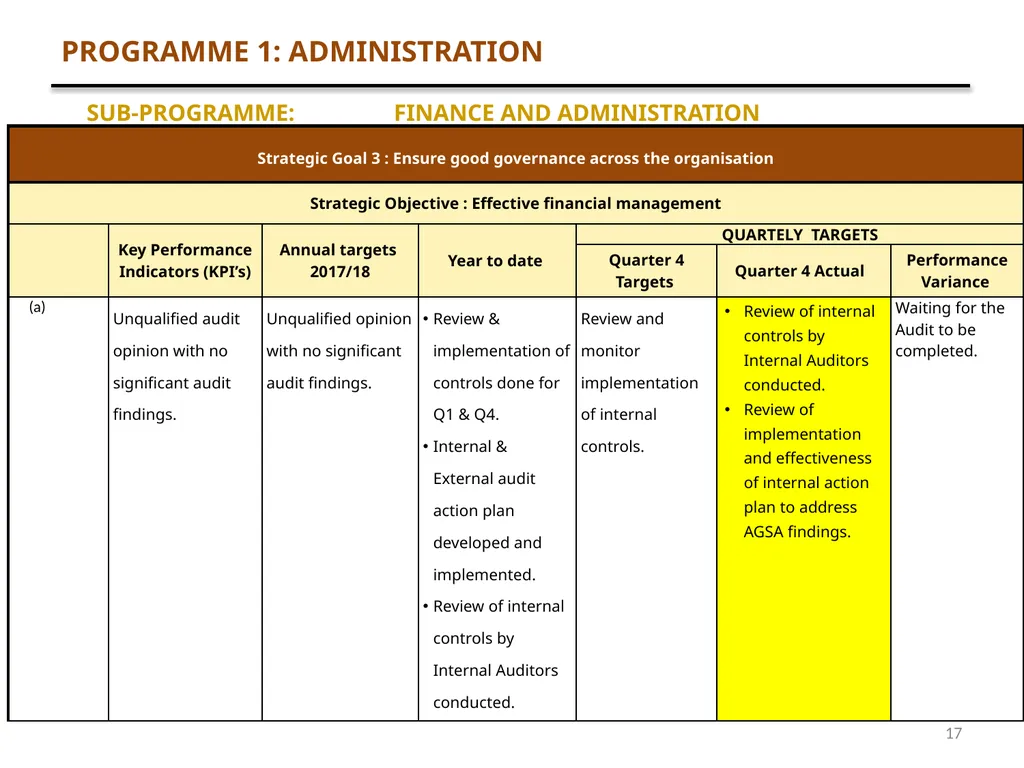
slide17. PROGRAMME 1: ADMINISTRATION SUB-PROGRAMME: FINANCE AND ADMINISTRATION 17<br>
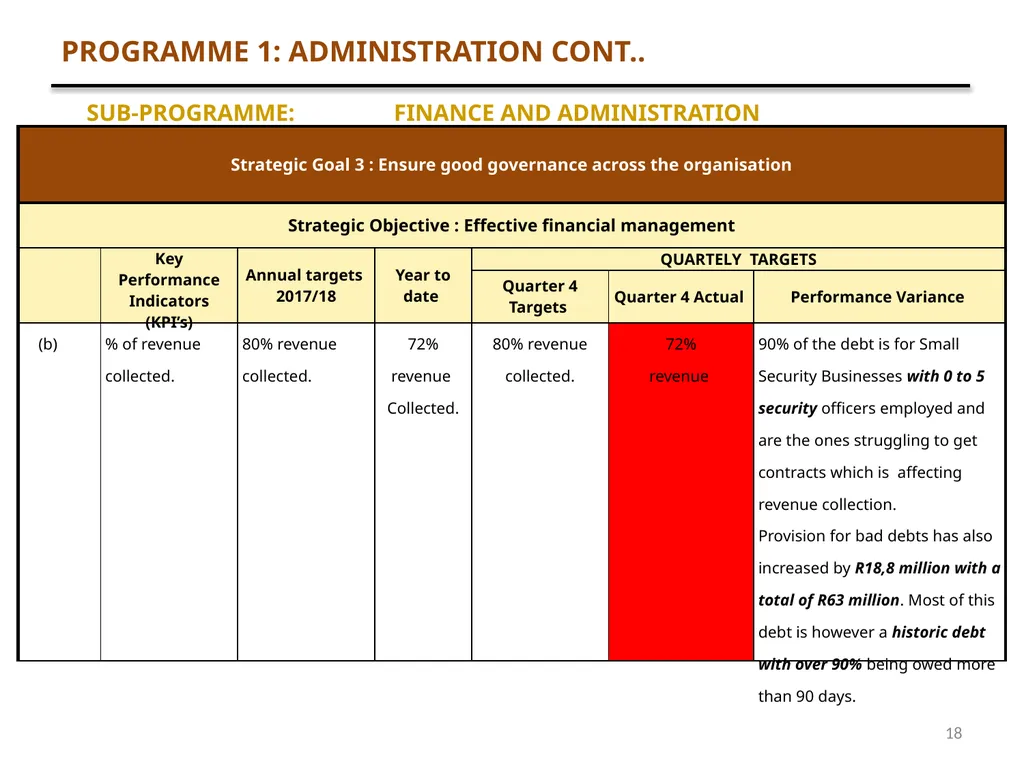
slide18. PROGRAMME 1: ADMINISTRATION CONT.. SUB-PROGRAMME: FINANCE AND ADMINISTRATION 18<br>
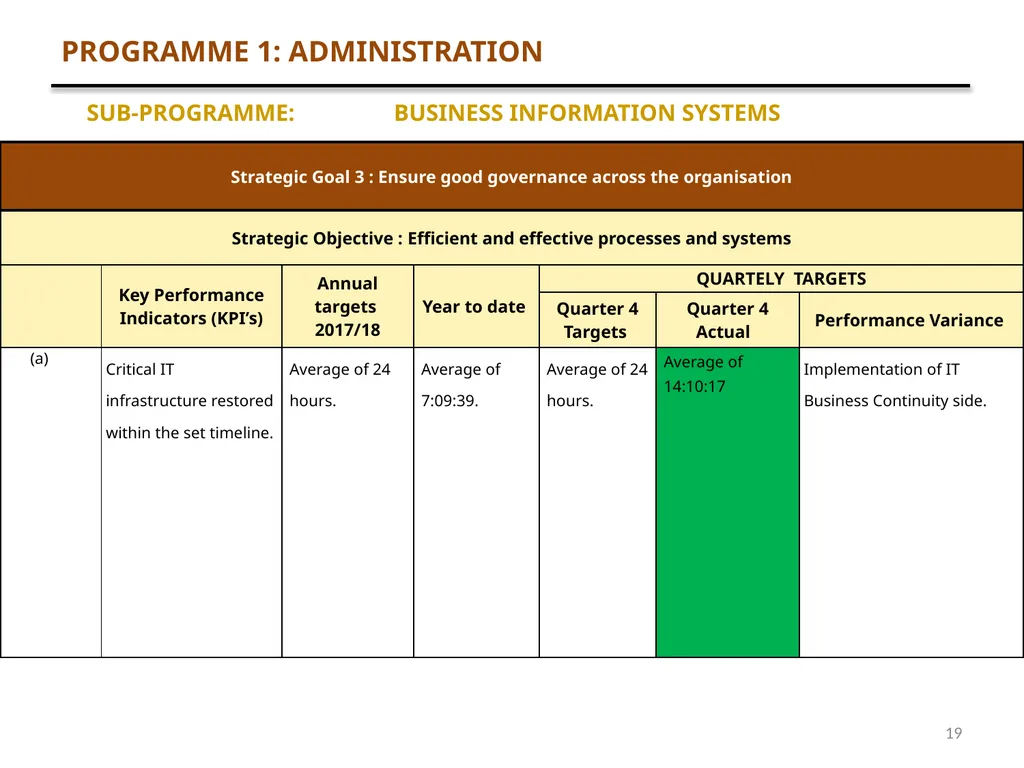
slide19. PROGRAMME 1: ADMINISTRATION SUB-PROGRAMME: BUSINESS INFORMATION SYSTEMS 19<br>
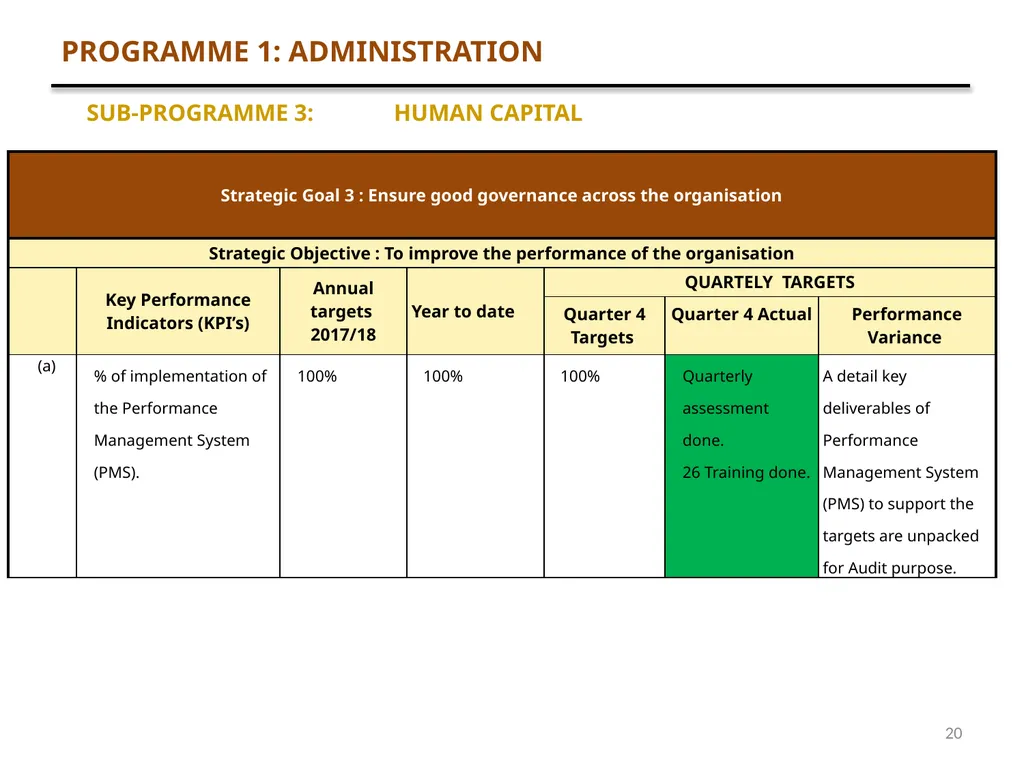
slide20. PROGRAMME 1: ADMINISTRATION SUB-PROGRAMME 3: HUMAN CAPITAL 20<br>
slide21. Tittle Goes here… PROGRAMME 2
LAW ENFORCEMENT 21<br>
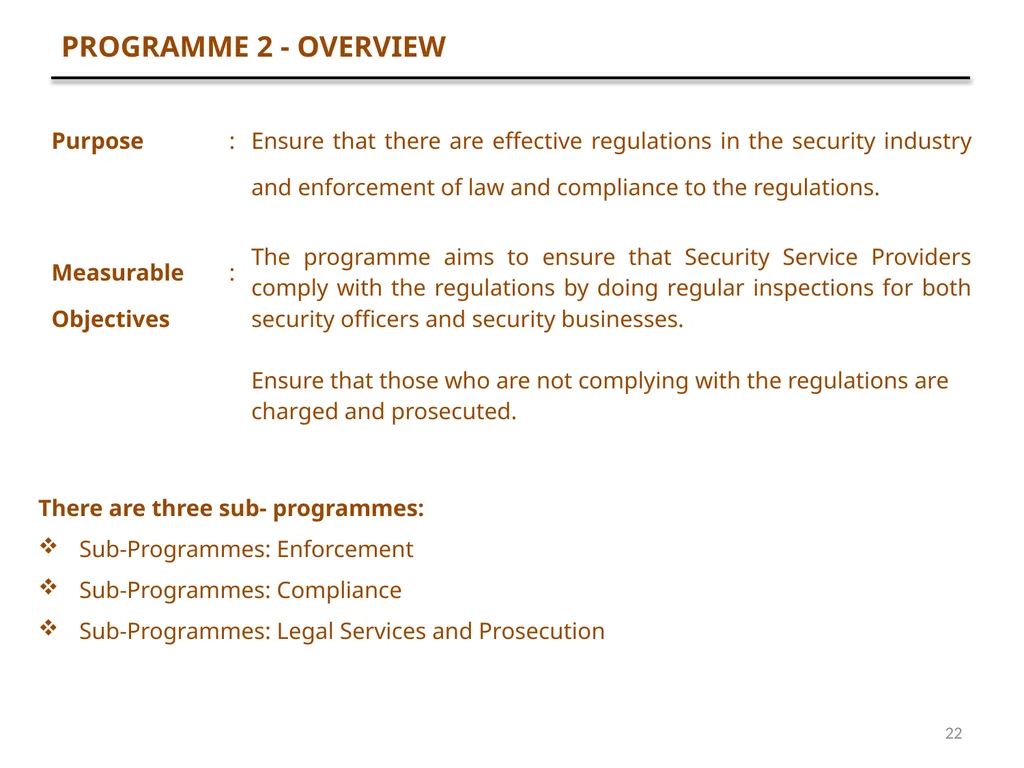
slide22. PROGRAMME 2 - OVERVIEW There are three sub- programmes:
Sub-Programmes: Enforcement
Sub-Programmes: Compliance
Sub-Programmes: Legal Services and Prosecution 22<br>
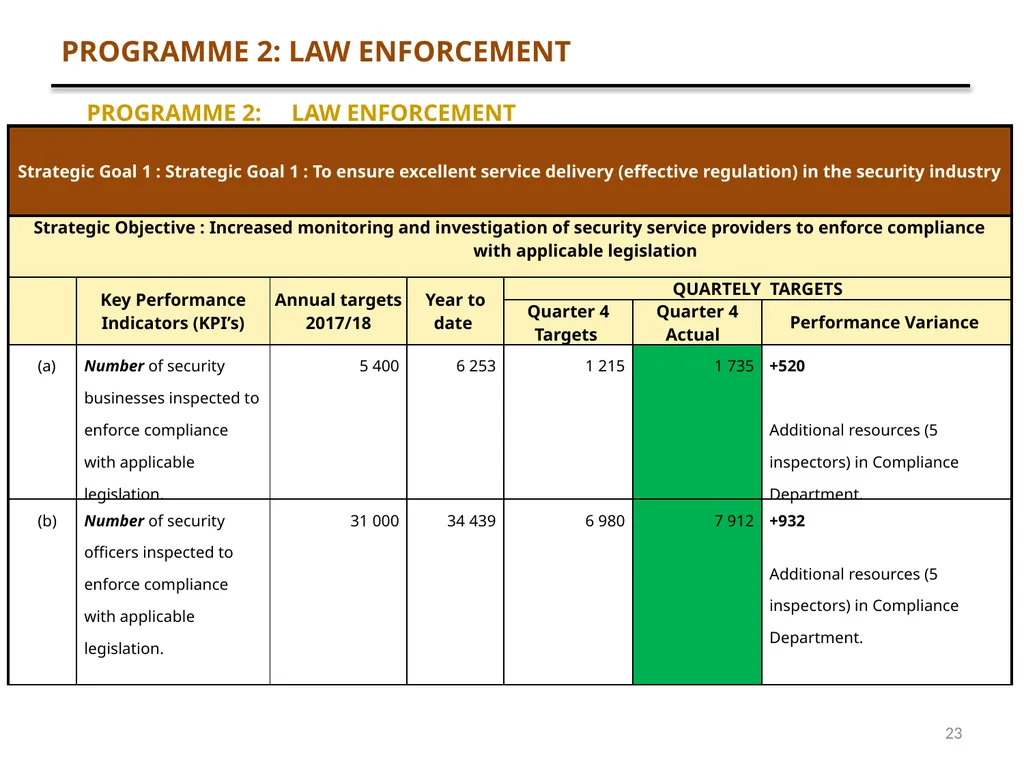
slide23. PROGRAMME 2: LAW ENFORCEMENT PROGRAMME 2: LAW ENFORCEMENT 23<br>
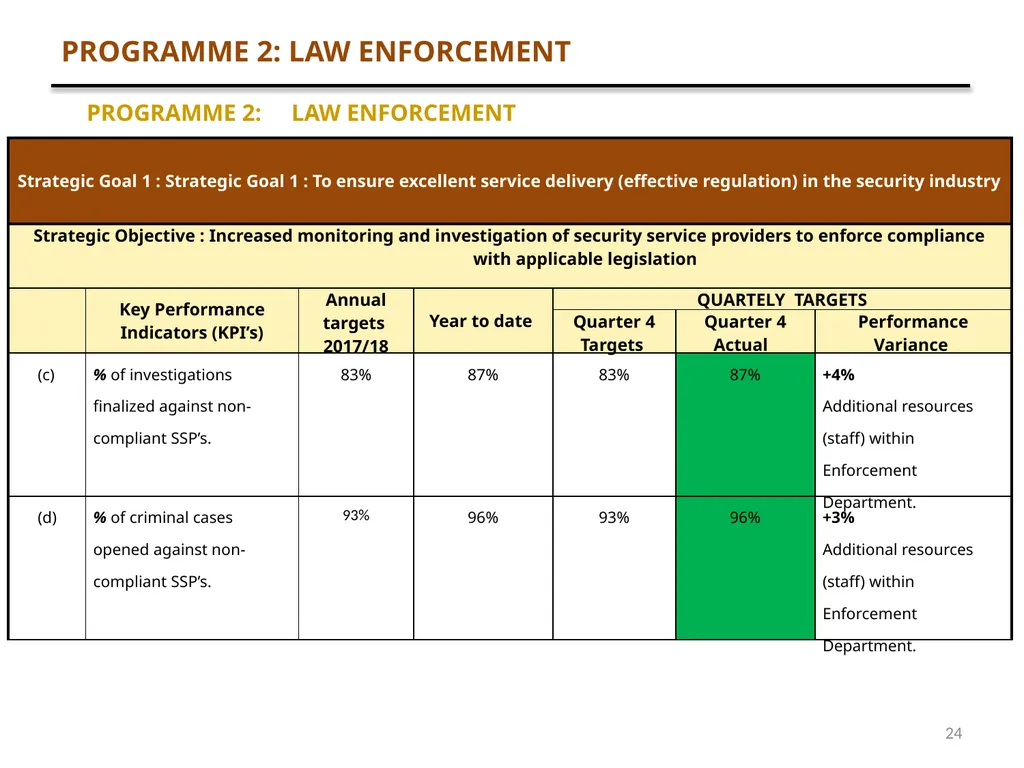
slide24. PROGRAMME 2: LAW ENFORCEMENT PROGRAMME 2: LAW ENFORCEMENT 24<br>
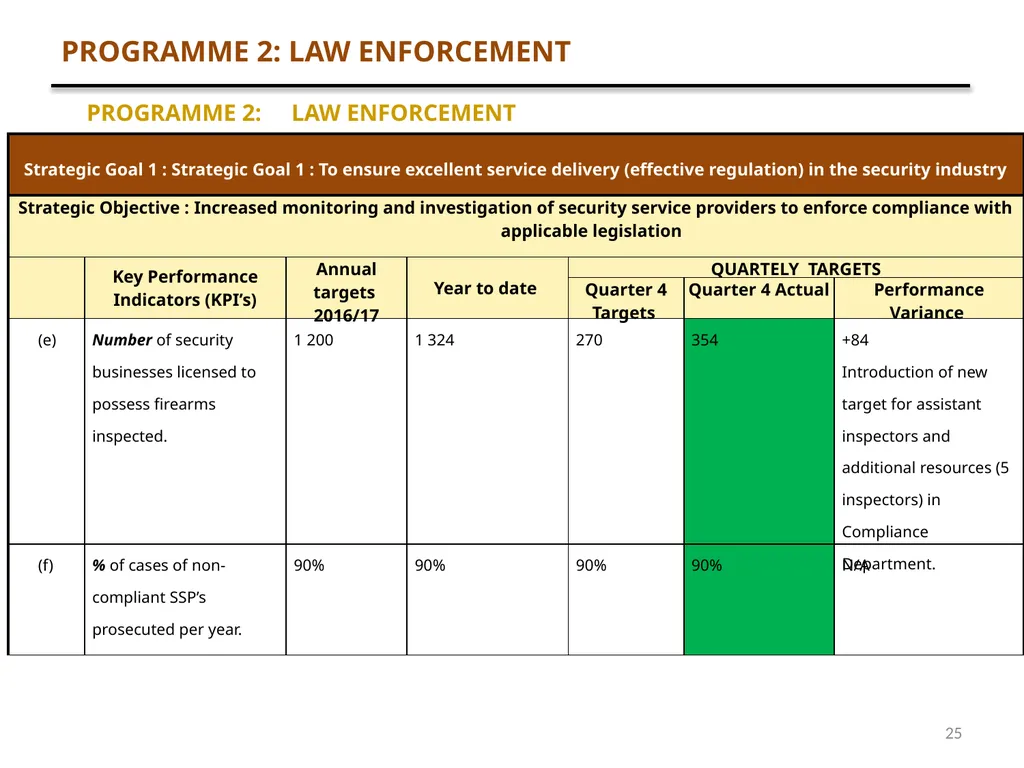
slide25. PROGRAMME 2: LAW ENFORCEMENT PROGRAMME 2: LAW ENFORCEMENT 25<br>
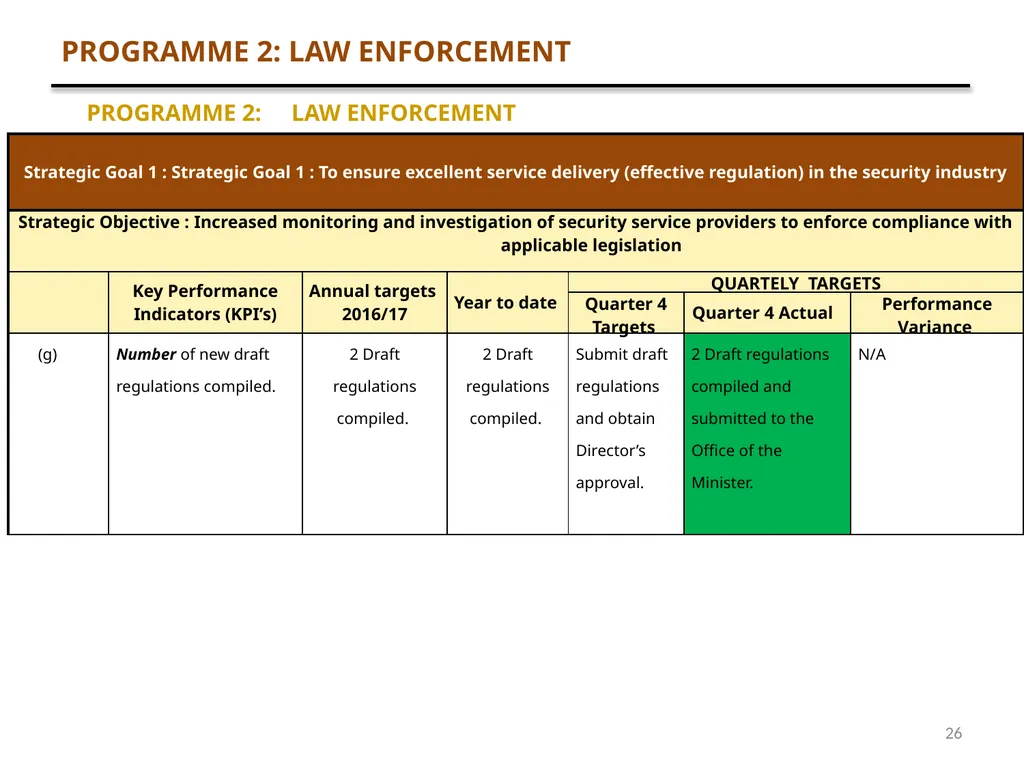
slide26. PROGRAMME 2: LAW ENFORCEMENT PROGRAMME 2: LAW ENFORCEMENT 26<br>
slide27. Tittle Goes here… PROGRAMME 3
COMMUNICATIONS, REGISTRATION & TRAINING 27<br>
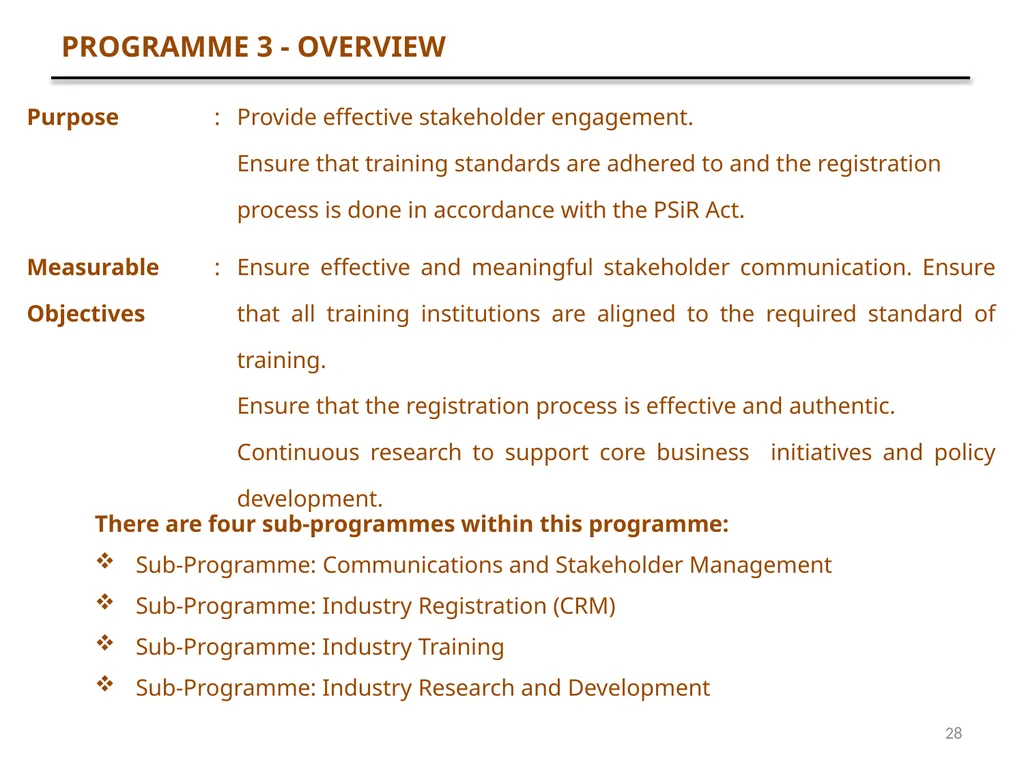
slide28. PROGRAMME 3 - OVERVIEW There are four sub-programmes within this programme:
Sub-Programme: Communications and Stakeholder Management
Sub-Programme: Industry Registration (CRM)
Sub-Programme: Industry Training
Sub-Programme: Industry Research and Development 28<br>
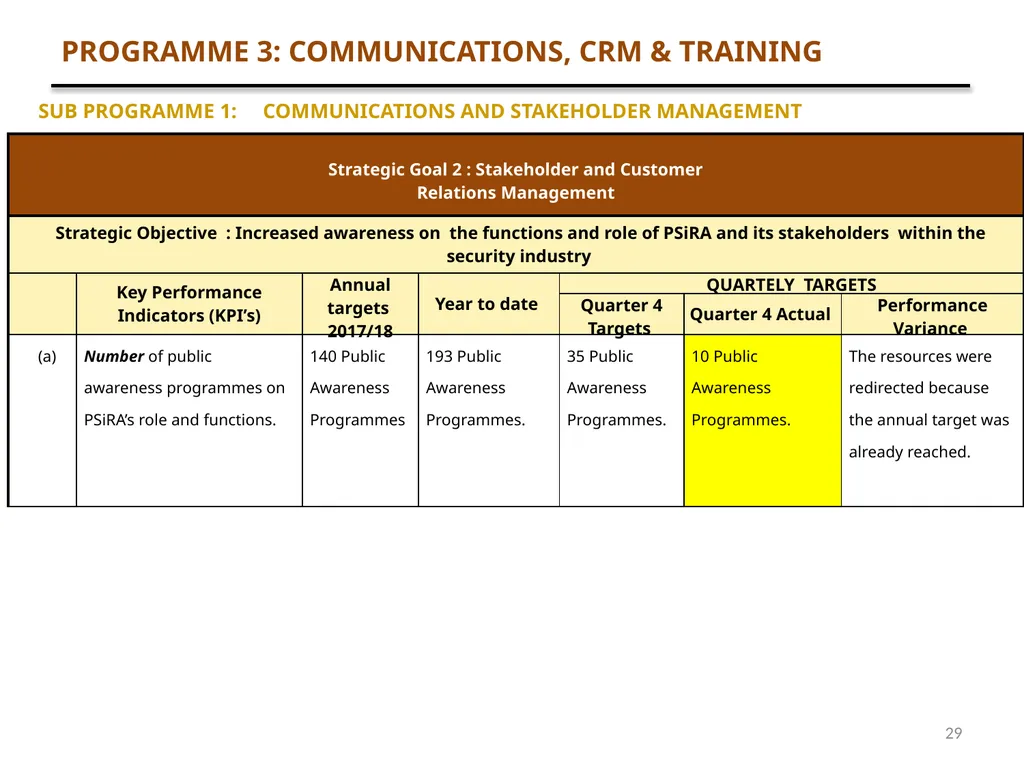
slide29. PROGRAMME 3: COMMUNICATIONS, CRM & TRAINING SUB PROGRAMME 1: COMMUNICATIONS AND STAKEHOLDER MANAGEMENT 29<br>
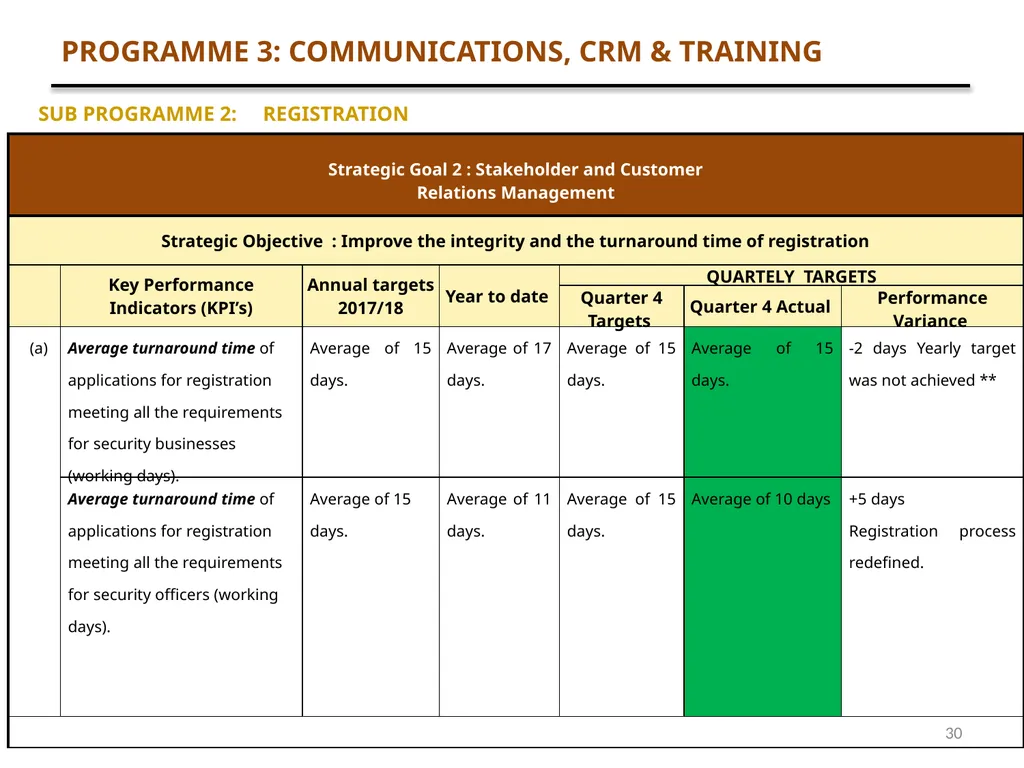
slide30. PROGRAMME 3: COMMUNICATIONS, CRM & TRAINING SUB PROGRAMME 2: REGISTRATION 30<br>
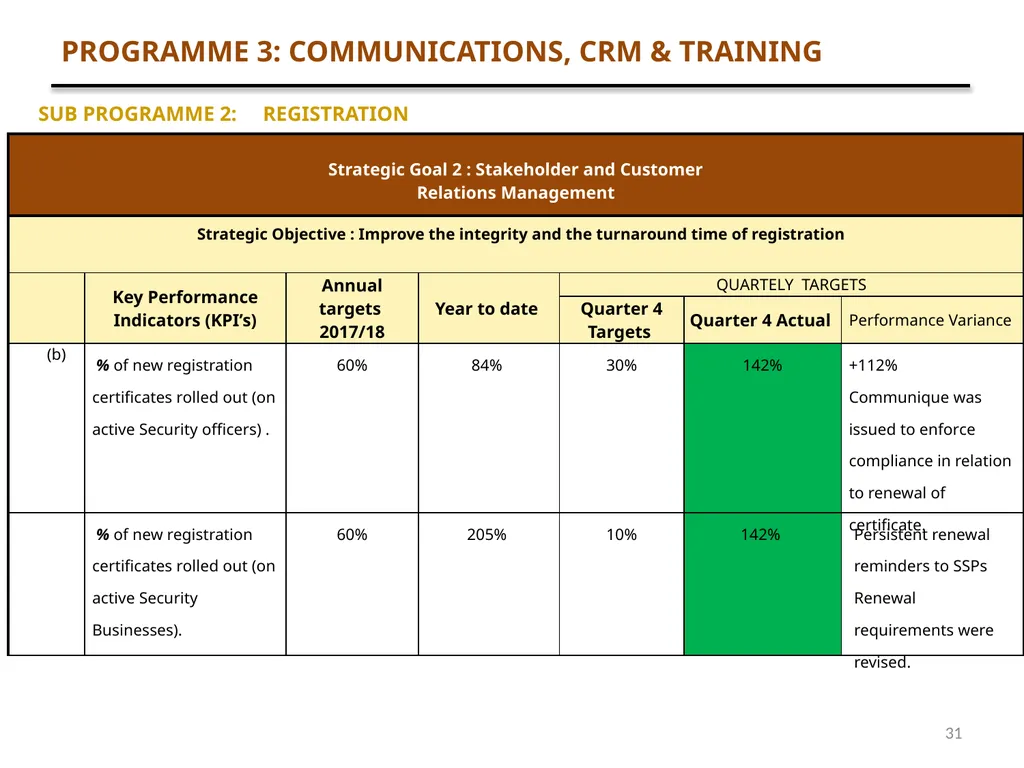
slide31. PROGRAMME 3: COMMUNICATIONS, CRM & TRAINING SUB PROGRAMME 2: REGISTRATION 31<br>
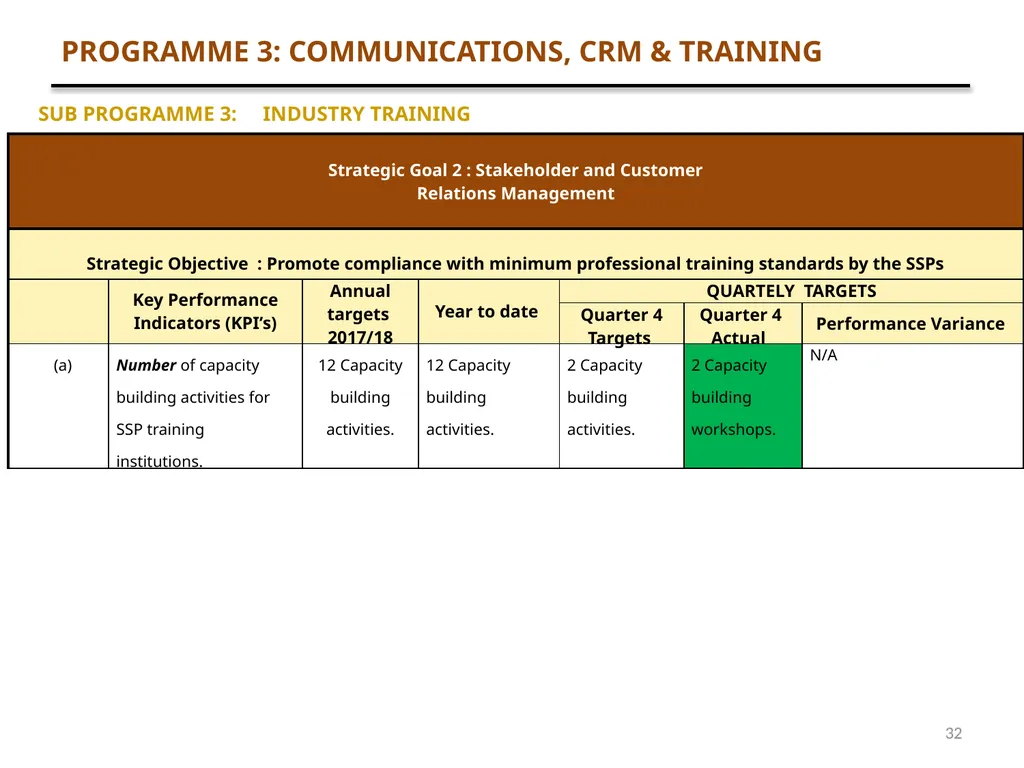
slide32. PROGRAMME 3: COMMUNICATIONS, CRM & TRAINING SUB PROGRAMME 3: INDUSTRY TRAINING 32<br>
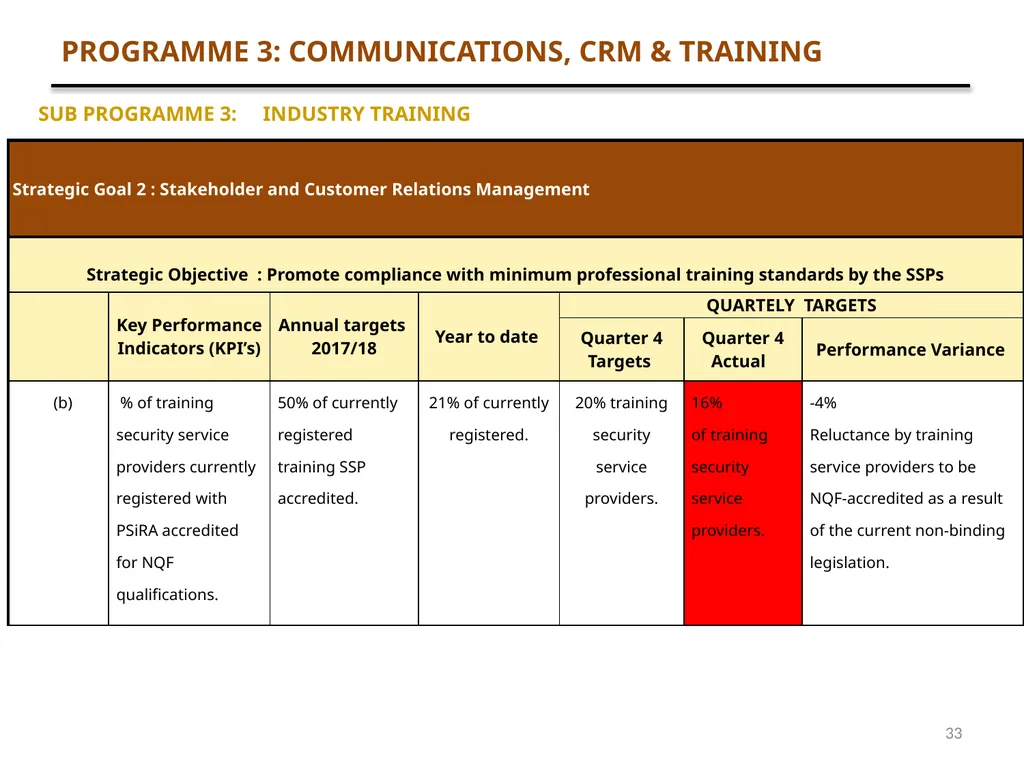
slide33. PROGRAMME 3: COMMUNICATIONS, CRM & TRAINING SUB PROGRAMME 3: INDUSTRY TRAINING 33<br>
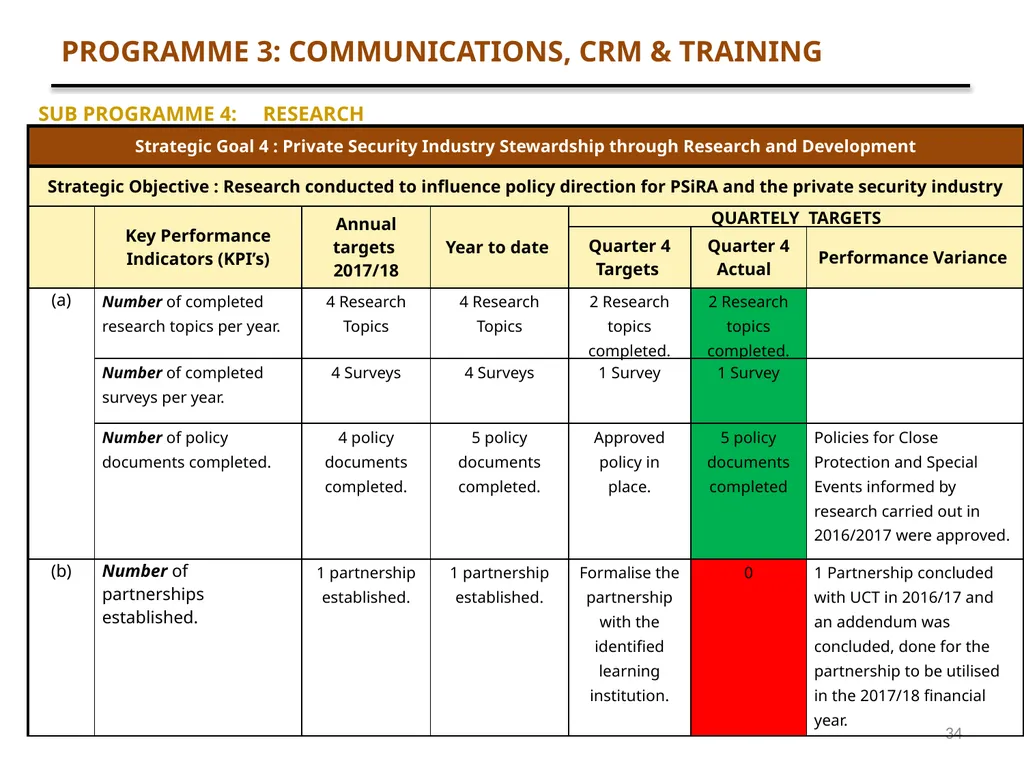
slide34. PROGRAMME 3: COMMUNICATIONS, CRM & TRAINING SUB PROGRAMME 4: RESEARCH 34<br>
slide35. QUARTER 4
FINANCIAL PERFORMANCE 35<br>
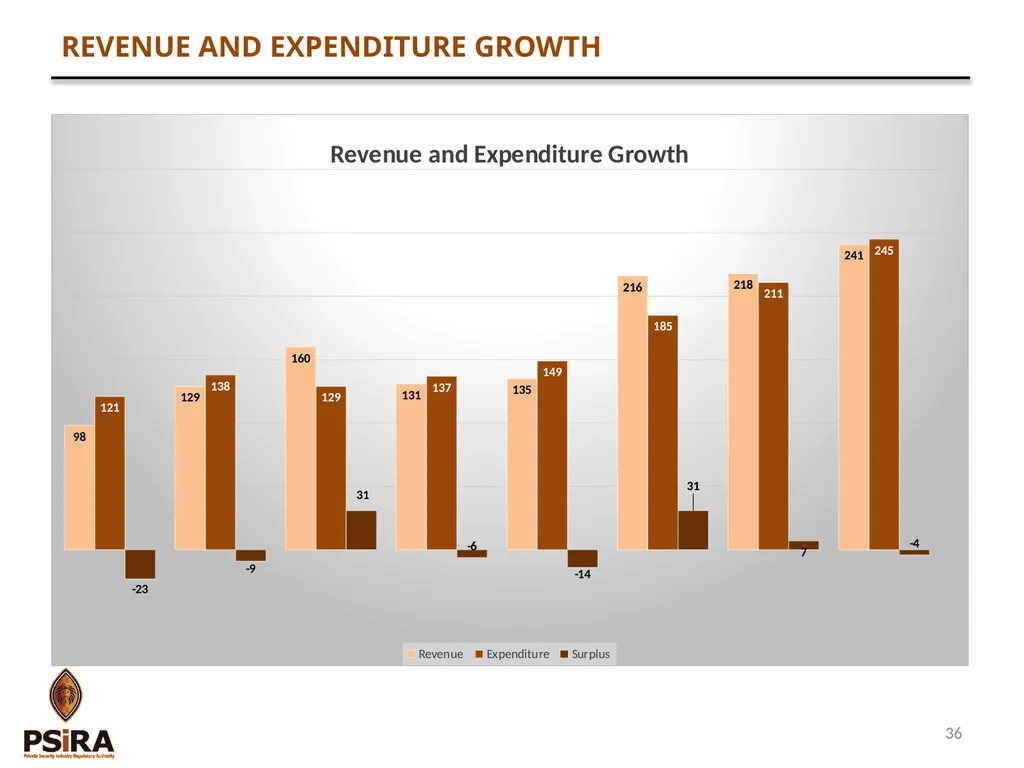
slide36. REVENUE AND EXPENDITURE GROWTH 36<br>
slide37. FINANCIAL PERFORMANCE 37<br>
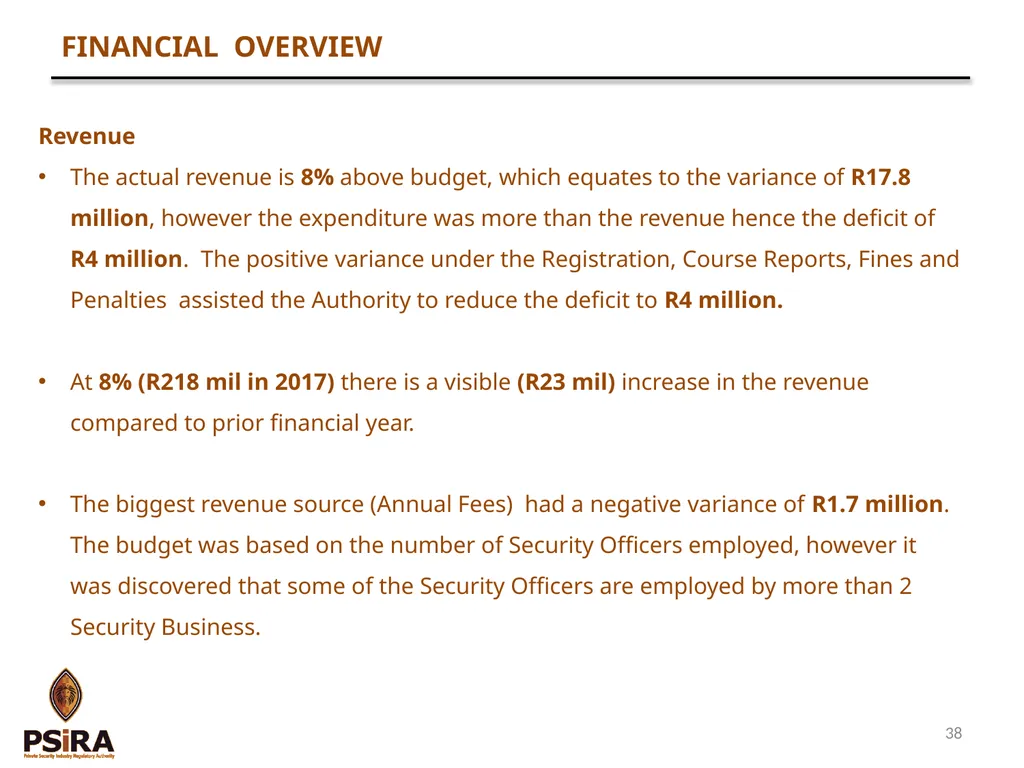
slide38. FINANCIAL OVERVIEW Revenue
The actual revenue is 8% above budget, which equates to the variance of R17.8 million, however the expenditure was more than the revenue hence the deficit of R4 million. The positive variance under the Registration, Course Reports, Fines and Penalties assisted the Authority to reduce the deficit to R4 million.
At 8% (R218 mil in 2017) there is a visible (R23 mil) increase in the revenue compared to prior financial year.
The biggest revenue source (Annual Fees) had a negative variance of R1.7 million. The budget was based on the number of Security Officers employed, however it was discovered that some of the Security Officers are employed by more than 2 Security Business. 38<br>
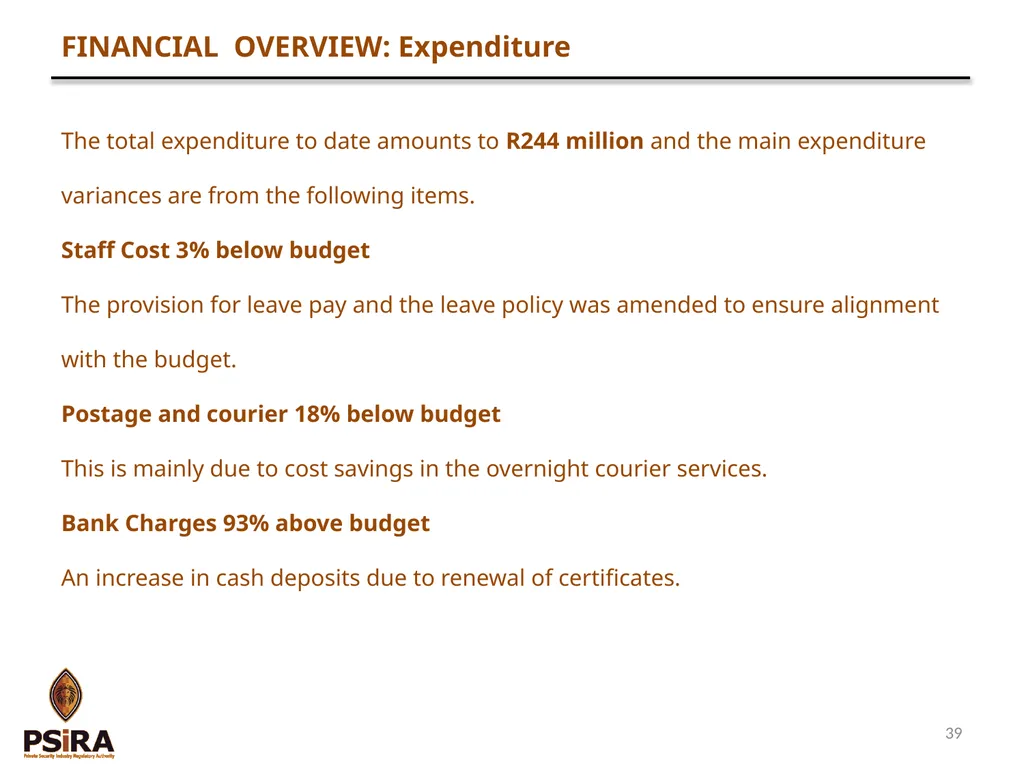
slide39. FINANCIAL OVERVIEW: Expenditure The total expenditure to date amounts to R244 million and the main expenditure variances are from the following items.
Staff Cost 3% below budget
The provision for leave pay and the leave policy was amended to ensure alignment with the budget.
Postage and courier 18% below budget
This is mainly due to cost savings in the overnight courier services.
Bank Charges 93% above budget
An increase in cash deposits due to renewal of certificates. 39<br>
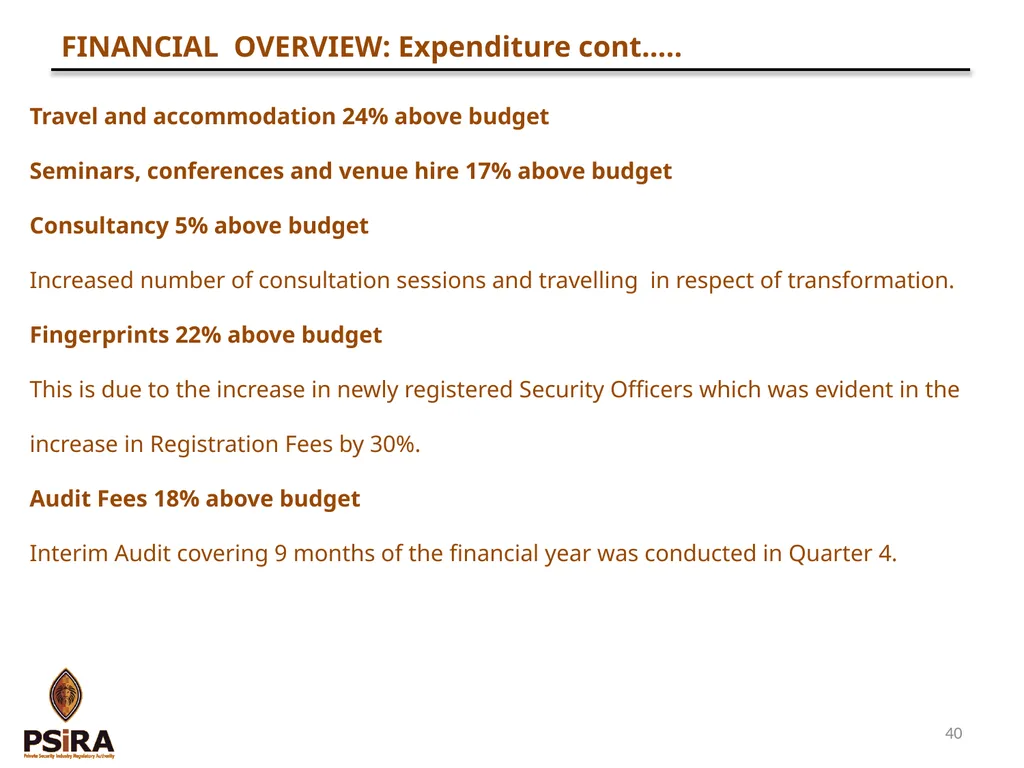
slide40. FINANCIAL OVERVIEW: Expenditure cont.…. Travel and accommodation 24% above budget
Seminars, conferences and venue hire 17% above budget
Consultancy 5% above budget
Increased number of consultation sessions and travelling in respect of transformation.
Fingerprints 22% above budget
This is due to the increase in newly registered Security Officers which was evident in the increase in Registration Fees by 30%.
Audit Fees 18% above budget
Interim Audit covering 9 months of the financial year was conducted in Quarter 4. 40<br>
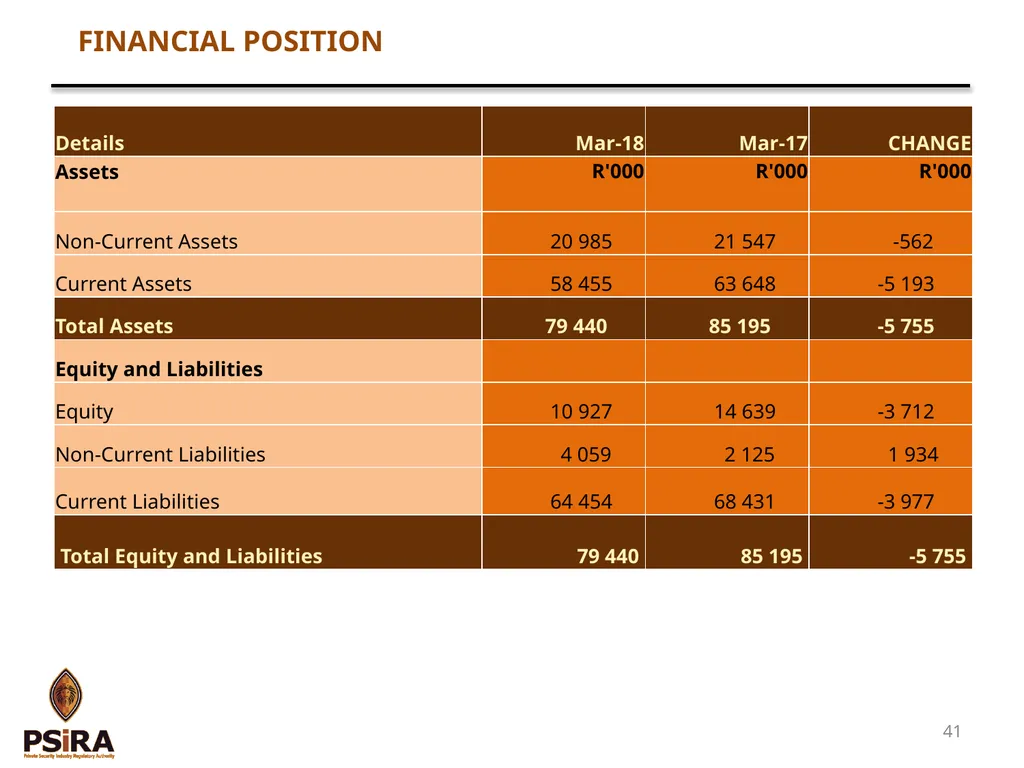
slide41. FINANCIAL POSITION 41<br>
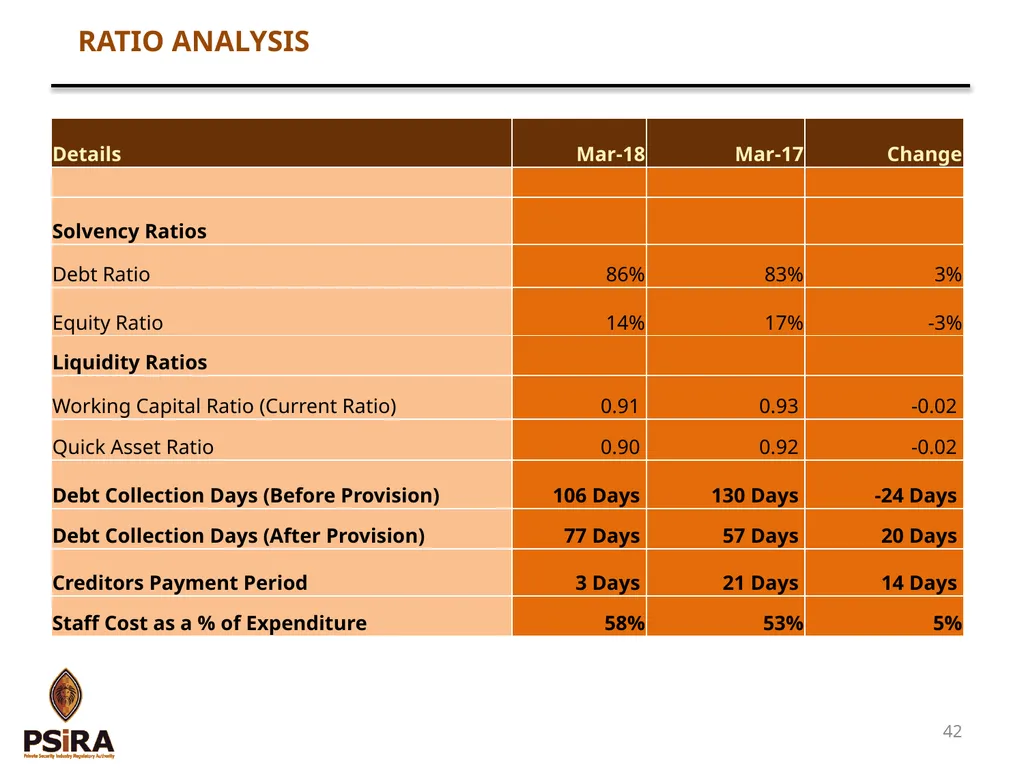
slide42. RATIO ANALYSIS 42<br>
slide43. FINANCIAL OVERVIEW RATIOS
Debt Ratio
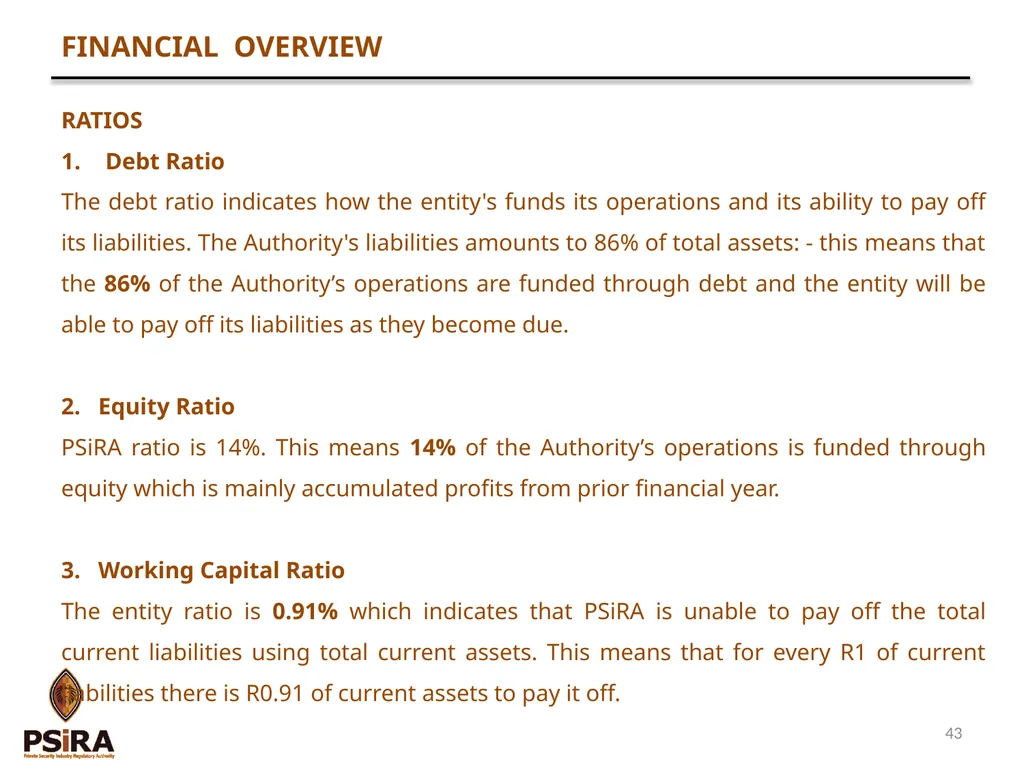
The debt ratio indicates how the entity's funds its operations and its ability to pay off its liabilities. The Authority's liabilities amounts to 86% of total assets: - this means that the 86% of the Authority’s operations are funded through debt and the entity will be able to pay off its liabilities as they become due.
2. Equity Ratio
PSiRA ratio is 14%. This means 14% of the Authority’s operations is funded through equity which is mainly accumulated profits from prior financial year.
3. Working Capital Ratio
The entity ratio is 0.91% which indicates that PSiRA is unable to pay off the total current liabilities using total current assets. This means that for every R1 of current liabilities there is R0.91 of current assets to pay it off. 43<br>
slide44. FINANCIAL OVERVIEW RATIOS
Debt Collection Days
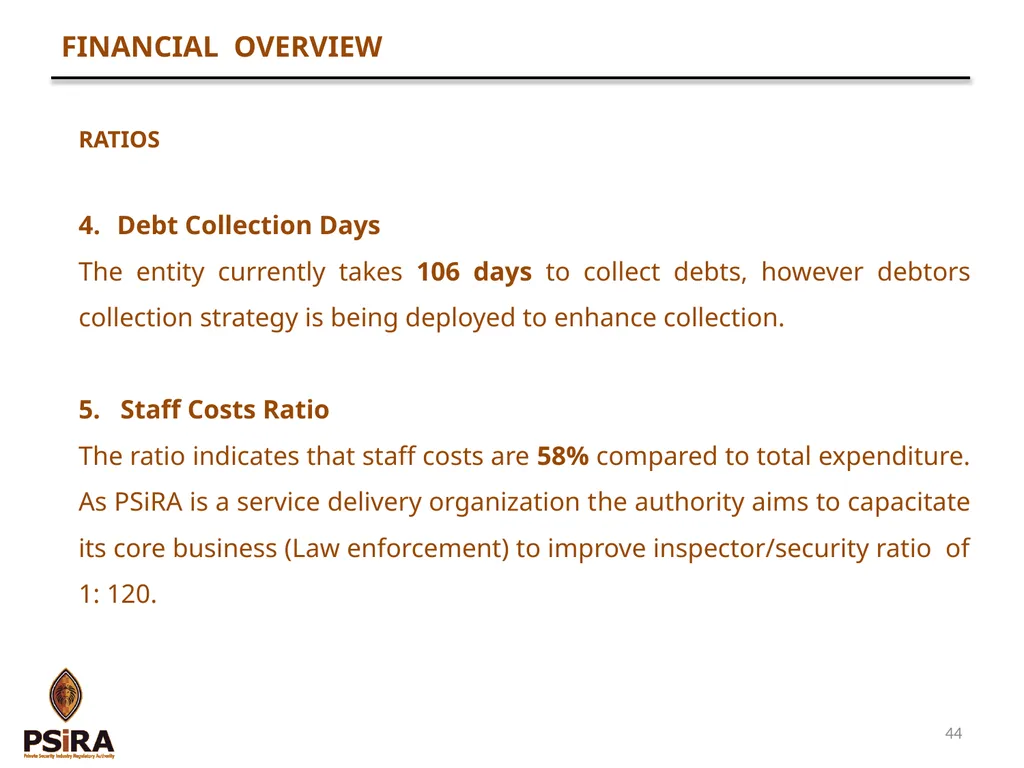
The entity currently takes 106 days to collect debts, however debtors collection strategy is being deployed to enhance collection.
5. Staff Costs Ratio
The ratio indicates that staff costs are 58% compared to total expenditure. As PSiRA is a service delivery organization the authority aims to capacitate its core business (Law enforcement) to improve inspector/security ratio of 1: 120. 44<br>
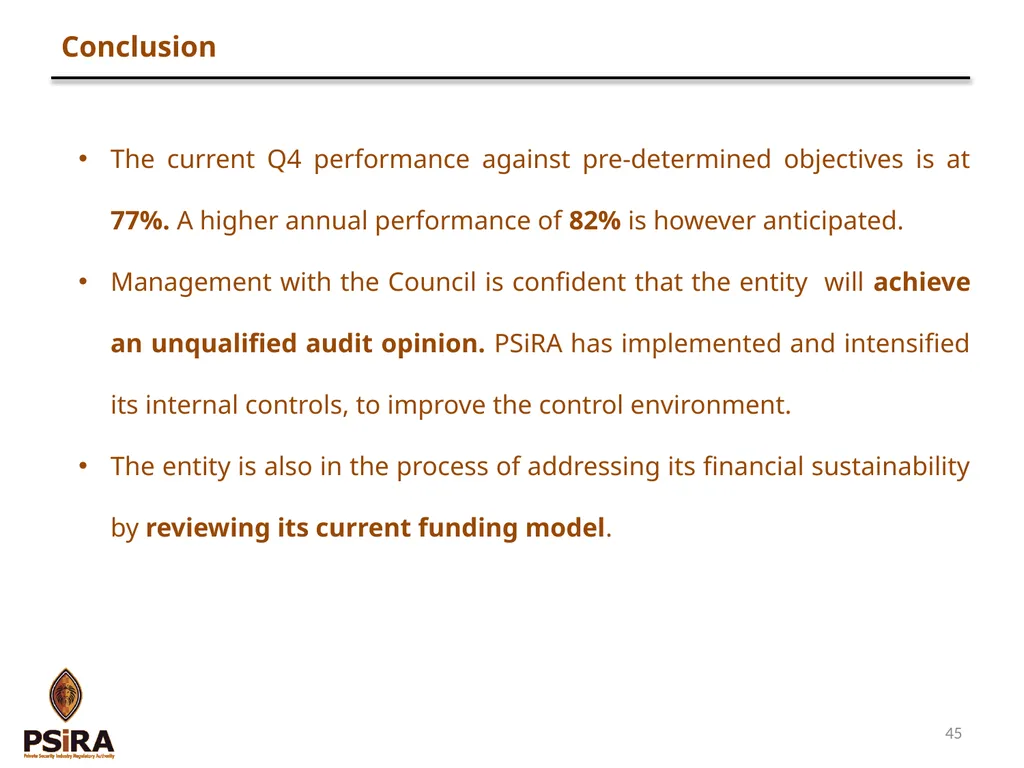
slide45. Conclusion The current Q4 performance against pre-determined objectives is at 77%. A higher annual performance of 82% is however anticipated.
Management with the Council is confident that the entity will achieve an unqualified audit opinion. PSiRA has implemented and intensified its internal controls, to improve the control environment.
The entity is also in the process of addressing its financial sustainability by reviewing its current funding model. 45<br>
slide46. Thank you<br>
15 May 2018<br>
slide2. DELEGATION COUNCIL MEMBERS:
Mr. Nhlanhla Ngubane : Acting Chairperson of Council
MANAGEMENT TEAM
Mr. Manabela(Sam) Chauke : Director
Mrs. Mmatlou Sebogodi : Deputy Director Finance and Admin 2<br>
slide3. PRESENTATION OVERVIEW PART A: KEY HIGHLIGHTS
PART B: 3rd QUARTER PREDETERMINED OBJECTIVES
PART B: 3rd QUARTER FINANCIAL PERFORMANCE
PART B: 4th QUARTER PREDETERMINED OBJECTIVES
PART C: 4th QUARTER FINANCIAL PERFORMANCE 3<br>
slide4. KEY HIGHLIGHTS 4<br>
slide5. MATTERS OF PROGRESS Audit of firearms in the Private Security Industry.
Regulations on issue, use and possession of firearms.
Review of the funding model and introduction of the Private Security Levies Act. 5<br>
slide6. QUARTER 3
PREDETERMINED OBJECTIVES 6<br>
slide7. QUARTER 3: STATUS PERFORMANCE INFORMATION 7<br>
slide8. QUARTER 3
FINANCIAL PERFORMANCE 8<br>
slide9. QUARTER 3 FINANCIAL PERFORMANCE Performance information: 77%
Registration fees are 27% above budget;
Course Reports income is 31% above budget;
Fines and penalties are 115% above budget;
Annual Fees are 1% below budget; and
Sale of Goods 48% below budget.
Expenditure is 2% above budget
Travel and accommodation 32% above budget;
Seminars, conferences and venue hire 64% above budget;
Fingerprints 20% above budget; and
Legal fees 29% above budget.
Surplus as at 31 December was R21million 9<br>
slide10. QUARTER 3 FINANCIAL PERFORMANCE Cont… Cash Flow Analysis
Cash flow collection target on Annual Fees 80%
Cash Flow as a percentage of Billing 67%;
Cash Flow as a percentage of Budget 66%;
Billing as a Percentage of Budget 99%. 10<br>
slide11. QUARTER 4
PREDETERMINED OBJECTIVES 11<br>
slide12. PERFORMANCE OVERVIEW AS AT 31 MARCH 2018 12<br>
slide13. FINANCIAL OVERVIEW AS AT 31 MARCH 2018 Total Revenue is 8% above budget
Registration fees are 30% above budget;
Course Reports income is 32% above budget;
Fines and penalties are 148% above budget;
Annual Fees are 1% below budget; and
Sale of Goods 19% below budget.
Expenditure is 10% above budget
Travel and accommodation 24% above budget;
Seminars, conferences and venue hire 17% above budget;
Fingerprints 22% above budget; and
Legal fees 33% above budget.
Deficit for the year is R4 million 13<br>
slide14. QUARTER 4
PREDETERMINED OBJECTIVES 14<br>
slide15. Tittle Goes here… PROGRAMME 1
FINANCE
AND
ADMINISTRATION 15<br>
slide16. PROGRAMME 1 - OVERVIEW There are three sub- programmes:
Sub-Programme: Finance and Administration
Sub-Programme: Business Information Technology
Sub-Programme: Human Capital 16<br>
slide17. PROGRAMME 1: ADMINISTRATION SUB-PROGRAMME: FINANCE AND ADMINISTRATION 17<br>
slide18. PROGRAMME 1: ADMINISTRATION CONT.. SUB-PROGRAMME: FINANCE AND ADMINISTRATION 18<br>
slide19. PROGRAMME 1: ADMINISTRATION SUB-PROGRAMME: BUSINESS INFORMATION SYSTEMS 19<br>
slide20. PROGRAMME 1: ADMINISTRATION SUB-PROGRAMME 3: HUMAN CAPITAL 20<br>
slide21. Tittle Goes here… PROGRAMME 2
LAW ENFORCEMENT 21<br>
slide22. PROGRAMME 2 - OVERVIEW There are three sub- programmes:
Sub-Programmes: Enforcement
Sub-Programmes: Compliance
Sub-Programmes: Legal Services and Prosecution 22<br>
slide23. PROGRAMME 2: LAW ENFORCEMENT PROGRAMME 2: LAW ENFORCEMENT 23<br>
slide24. PROGRAMME 2: LAW ENFORCEMENT PROGRAMME 2: LAW ENFORCEMENT 24<br>
slide25. PROGRAMME 2: LAW ENFORCEMENT PROGRAMME 2: LAW ENFORCEMENT 25<br>
slide26. PROGRAMME 2: LAW ENFORCEMENT PROGRAMME 2: LAW ENFORCEMENT 26<br>
slide27. Tittle Goes here… PROGRAMME 3
COMMUNICATIONS, REGISTRATION & TRAINING 27<br>
slide28. PROGRAMME 3 - OVERVIEW There are four sub-programmes within this programme:
Sub-Programme: Communications and Stakeholder Management
Sub-Programme: Industry Registration (CRM)
Sub-Programme: Industry Training
Sub-Programme: Industry Research and Development 28<br>
slide29. PROGRAMME 3: COMMUNICATIONS, CRM & TRAINING SUB PROGRAMME 1: COMMUNICATIONS AND STAKEHOLDER MANAGEMENT 29<br>
slide30. PROGRAMME 3: COMMUNICATIONS, CRM & TRAINING SUB PROGRAMME 2: REGISTRATION 30<br>
slide31. PROGRAMME 3: COMMUNICATIONS, CRM & TRAINING SUB PROGRAMME 2: REGISTRATION 31<br>
slide32. PROGRAMME 3: COMMUNICATIONS, CRM & TRAINING SUB PROGRAMME 3: INDUSTRY TRAINING 32<br>
slide33. PROGRAMME 3: COMMUNICATIONS, CRM & TRAINING SUB PROGRAMME 3: INDUSTRY TRAINING 33<br>
slide34. PROGRAMME 3: COMMUNICATIONS, CRM & TRAINING SUB PROGRAMME 4: RESEARCH 34<br>
slide35. QUARTER 4
FINANCIAL PERFORMANCE 35<br>
slide36. REVENUE AND EXPENDITURE GROWTH 36<br>
slide37. FINANCIAL PERFORMANCE 37<br>
slide38. FINANCIAL OVERVIEW Revenue
The actual revenue is 8% above budget, which equates to the variance of R17.8 million, however the expenditure was more than the revenue hence the deficit of R4 million. The positive variance under the Registration, Course Reports, Fines and Penalties assisted the Authority to reduce the deficit to R4 million.
At 8% (R218 mil in 2017) there is a visible (R23 mil) increase in the revenue compared to prior financial year.
The biggest revenue source (Annual Fees) had a negative variance of R1.7 million. The budget was based on the number of Security Officers employed, however it was discovered that some of the Security Officers are employed by more than 2 Security Business. 38<br>
slide39. FINANCIAL OVERVIEW: Expenditure The total expenditure to date amounts to R244 million and the main expenditure variances are from the following items.
Staff Cost 3% below budget
The provision for leave pay and the leave policy was amended to ensure alignment with the budget.
Postage and courier 18% below budget
This is mainly due to cost savings in the overnight courier services.
Bank Charges 93% above budget
An increase in cash deposits due to renewal of certificates. 39<br>
slide40. FINANCIAL OVERVIEW: Expenditure cont.…. Travel and accommodation 24% above budget
Seminars, conferences and venue hire 17% above budget
Consultancy 5% above budget
Increased number of consultation sessions and travelling in respect of transformation.
Fingerprints 22% above budget
This is due to the increase in newly registered Security Officers which was evident in the increase in Registration Fees by 30%.
Audit Fees 18% above budget
Interim Audit covering 9 months of the financial year was conducted in Quarter 4. 40<br>
slide41. FINANCIAL POSITION 41<br>
slide42. RATIO ANALYSIS 42<br>
slide43. FINANCIAL OVERVIEW RATIOS
Debt Ratio
The debt ratio indicates how the entity's funds its operations and its ability to pay off its liabilities. The Authority's liabilities amounts to 86% of total assets: - this means that the 86% of the Authority’s operations are funded through debt and the entity will be able to pay off its liabilities as they become due.
2. Equity Ratio
PSiRA ratio is 14%. This means 14% of the Authority’s operations is funded through equity which is mainly accumulated profits from prior financial year.
3. Working Capital Ratio
The entity ratio is 0.91% which indicates that PSiRA is unable to pay off the total current liabilities using total current assets. This means that for every R1 of current liabilities there is R0.91 of current assets to pay it off. 43<br>
slide44. FINANCIAL OVERVIEW RATIOS
Debt Collection Days
The entity currently takes 106 days to collect debts, however debtors collection strategy is being deployed to enhance collection.
5. Staff Costs Ratio
The ratio indicates that staff costs are 58% compared to total expenditure. As PSiRA is a service delivery organization the authority aims to capacitate its core business (Law enforcement) to improve inspector/security ratio of 1: 120. 44<br>
slide45. Conclusion The current Q4 performance against pre-determined objectives is at 77%. A higher annual performance of 82% is however anticipated.
Management with the Council is confident that the entity will achieve an unqualified audit opinion. PSiRA has implemented and intensified its internal controls, to improve the control environment.
The entity is also in the process of addressing its financial sustainability by reviewing its current funding model. 45<br>
slide46. Thank you<br>