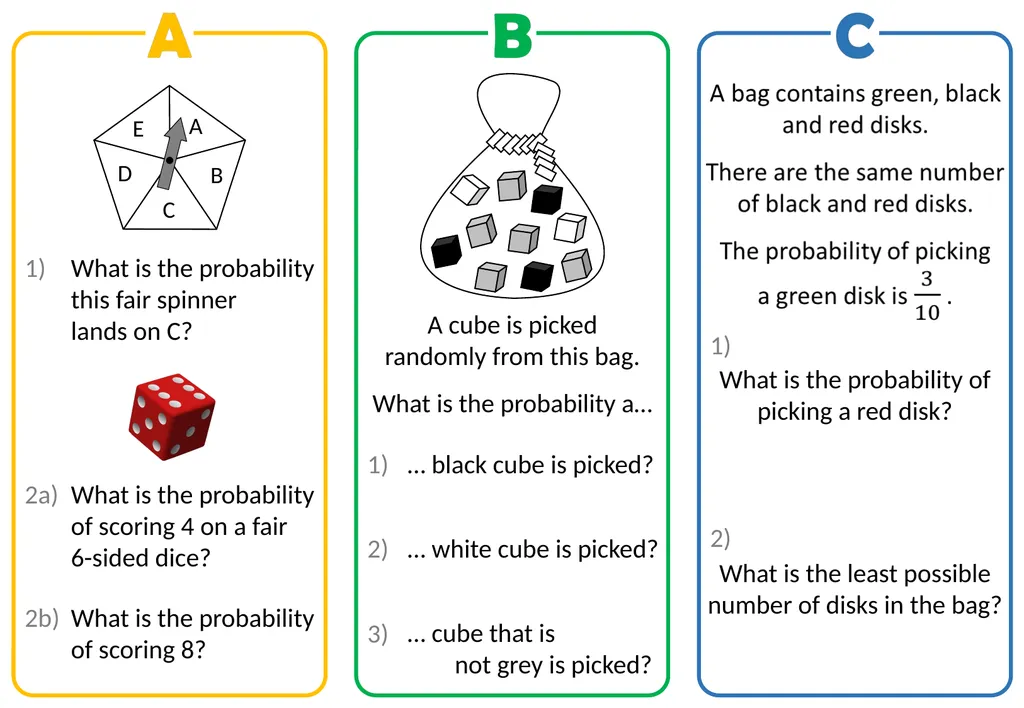
1) What is the probability this fair spinner lands on C? 2a) What is the probability of scoring 4 on a fair 6-sided dice? 2b) What is the probability of scoring 8? A cube is picked randomly from this bag. What is the probability a 1)
"1) What is the probability this fair spinner lands" is the property of its rightful owner. Permission is granted to
download and print the materials on this website for personal, non-commercial use only, and to display it
on your personal computer provided you do not modify the materials and that you retain all copyright
notices contained in the materials. By downloading content from our website, you accept the terms of this
agreement.
Presentation Transcript
01
1) What is the probability
this fair spinner
lands on C? 2a) What is the probability
of scoring 4 on a fair
6-sided dice? 2b) What is the probability
of scoring 8? A cube is picked
randomly from this bag.
What is the probability a… 1) … black cube is picked? What is the probability of
picking a red disk? 1) 2) What is the least possible
number of disks in the bag?<br>
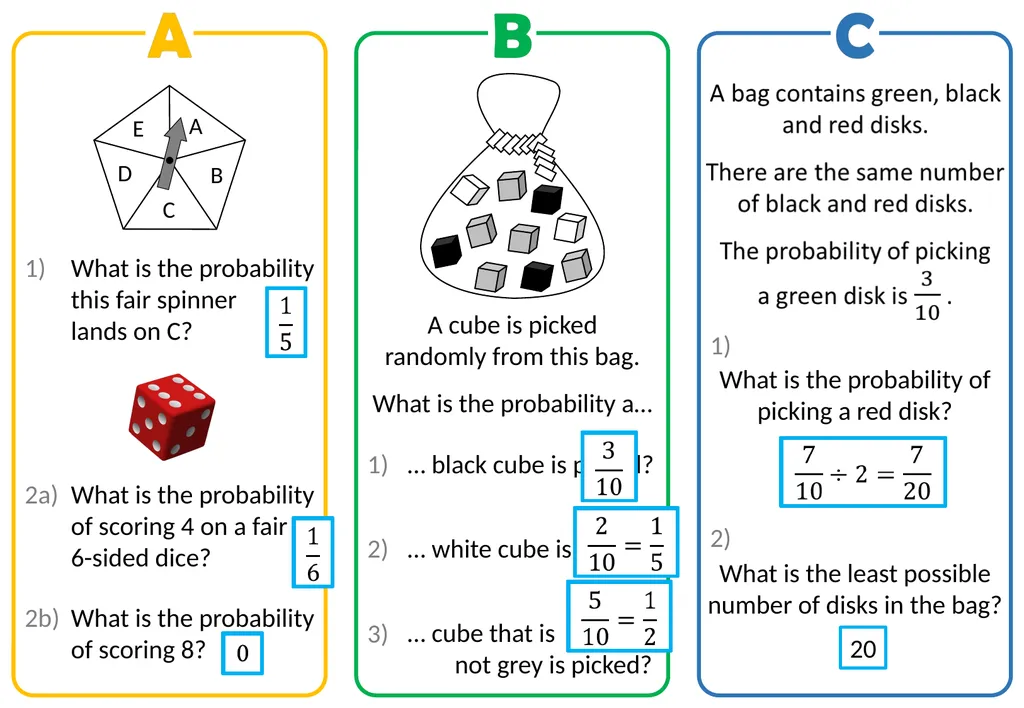
02
1) What is the probability
this fair spinner
lands on C? 2a) What is the probability
of scoring 4 on a fair
6-sided dice? 2b) What is the probability
of scoring 8? A cube is picked
randomly from this bag.
What is the probability a… 1) … black cube is picked? What is the probability of
picking a red disk? 1) 2) What is the least possible
number of disks in the bag? 20<br>
03
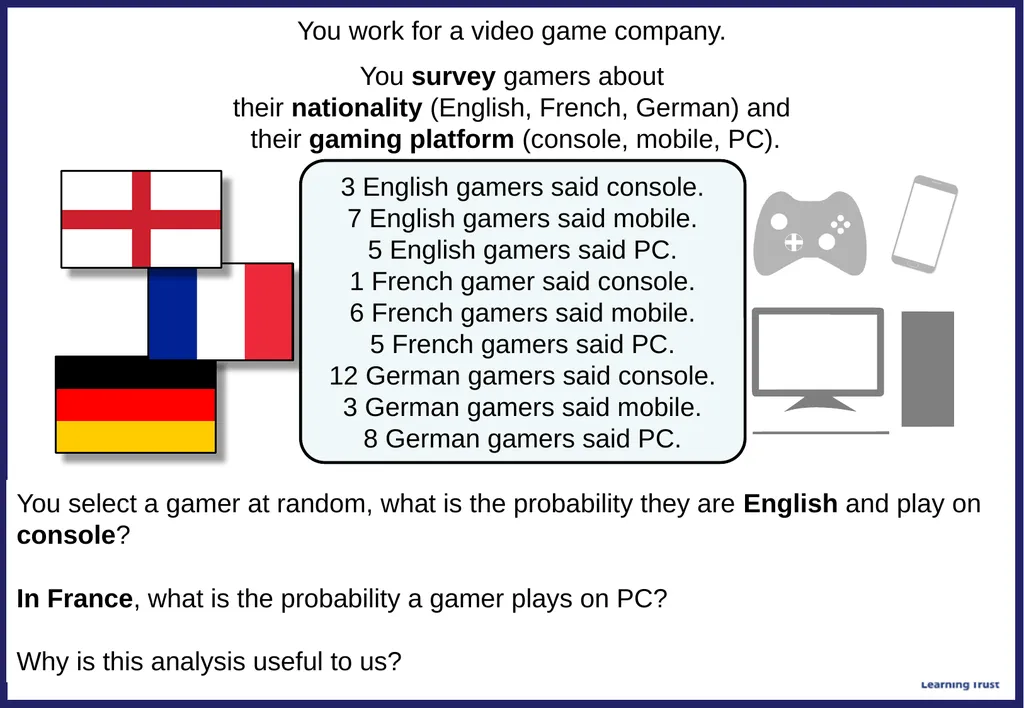
You work for a video game company.
You survey gamers about
their nationality (English, French, German) and
their gaming platform (console, mobile, PC). You select a gamer at random, what is the probability they are English and play on console?
In France, what is the probability a gamer plays on PC?
Why is this analysis useful to us? 3 English gamers said console.
7 English gamers said mobile.
5 English gamers said PC.
1 French gamer said console.
6 French gamers said mobile.
5 French gamers said PC.
12 German gamers said console.
3 German gamers said mobile.
8 German gamers said PC.<br>
04
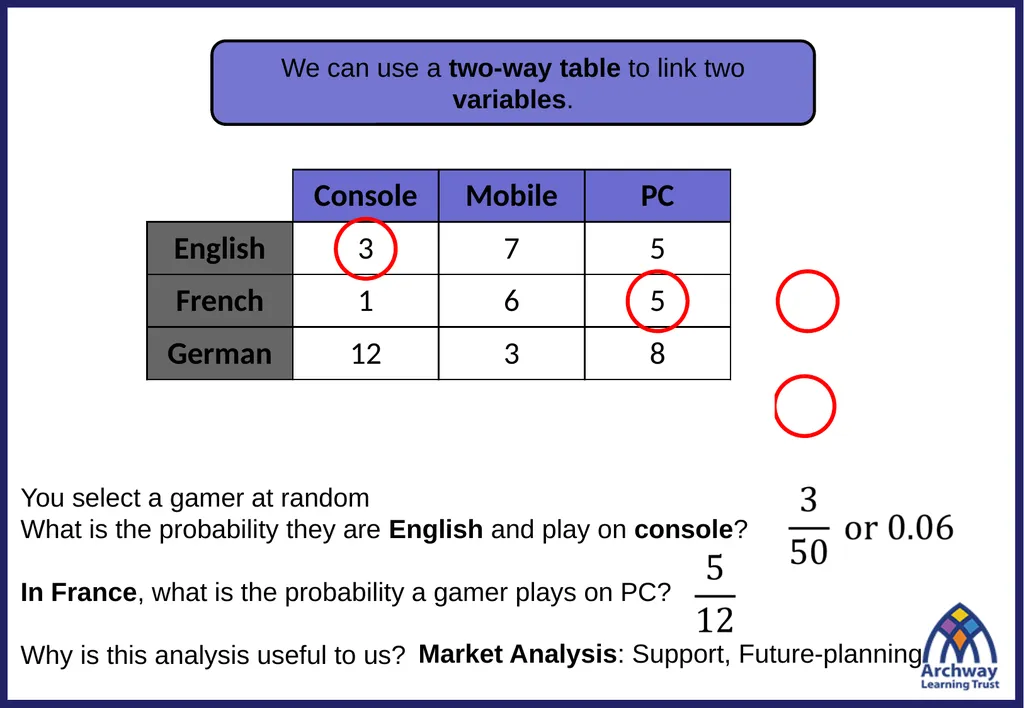
We can use a two-way table to link two variables. You select a gamer at random
What is the probability they are English and play on console?
In France, what is the probability a gamer plays on PC?
Why is this analysis useful to us? Market Analysis: Support, Future-planning<br>
05
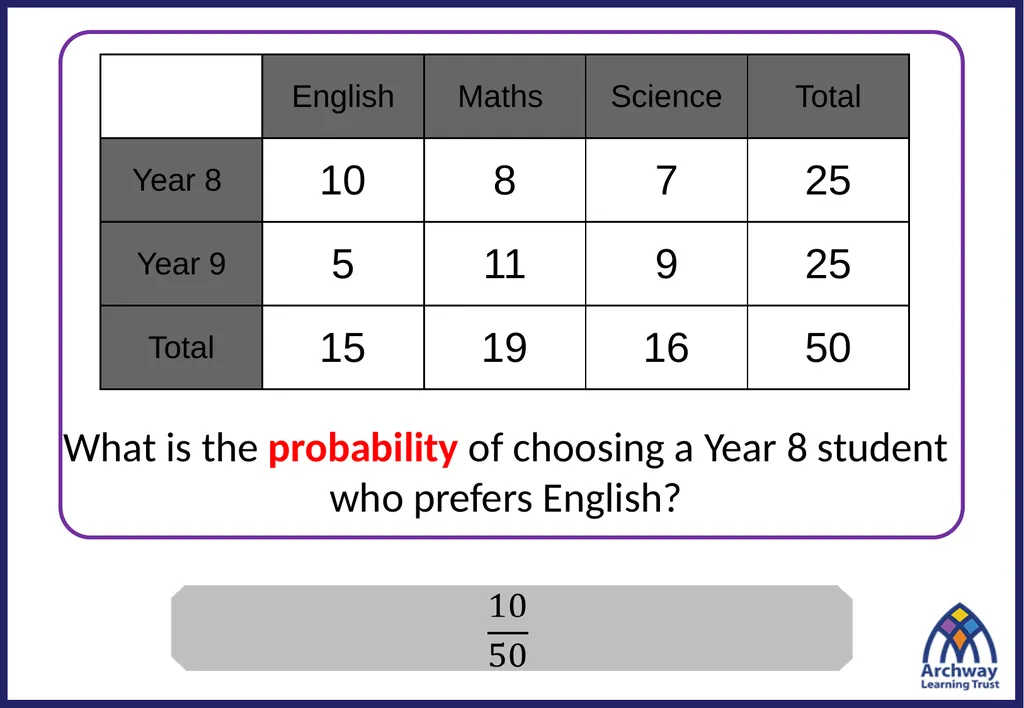
Answer What is the probability of choosing a Year 8 student
who prefers English?<br>
06
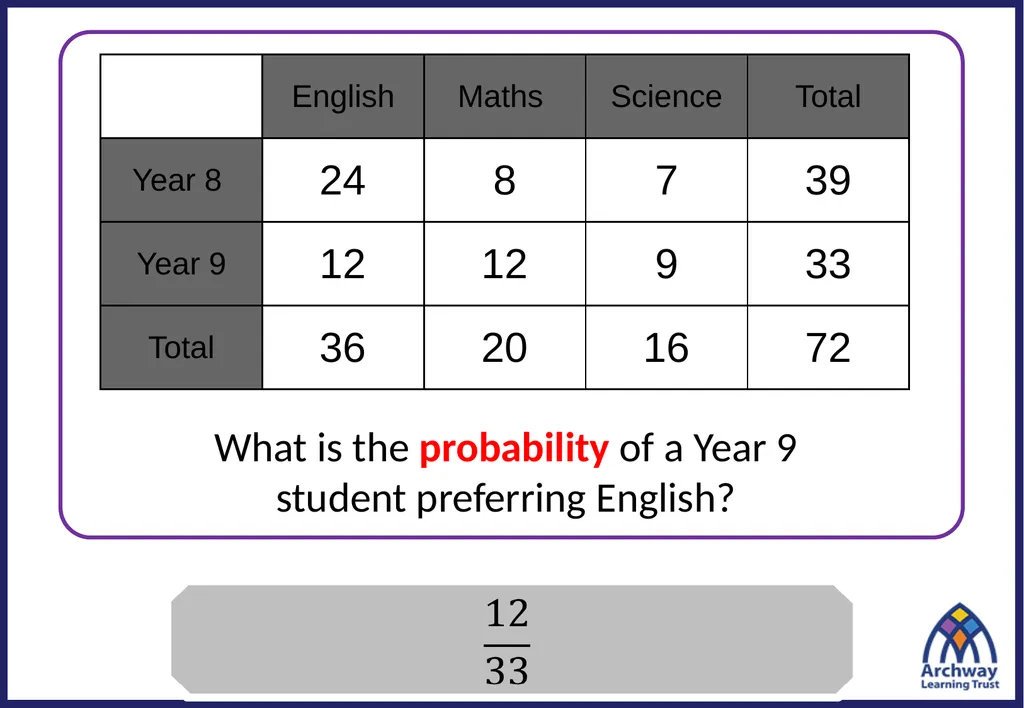
Answer What is the probability of a Year 9
student preferring English?<br>
07
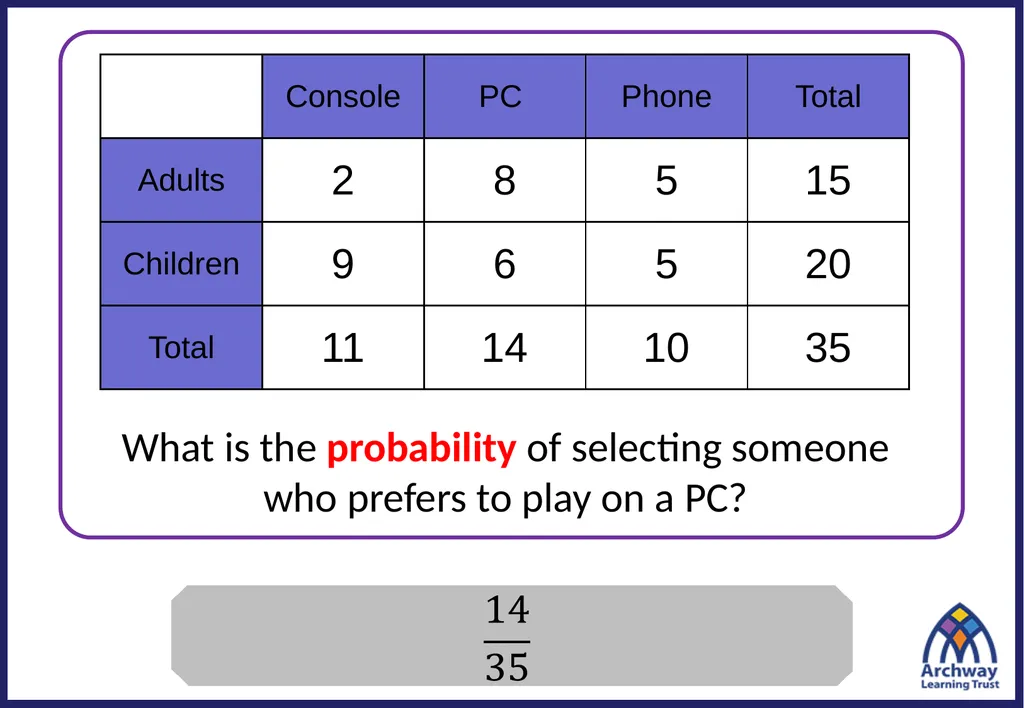
Answer What is the probability of selecting someone
who prefers to play on a PC?<br>
08
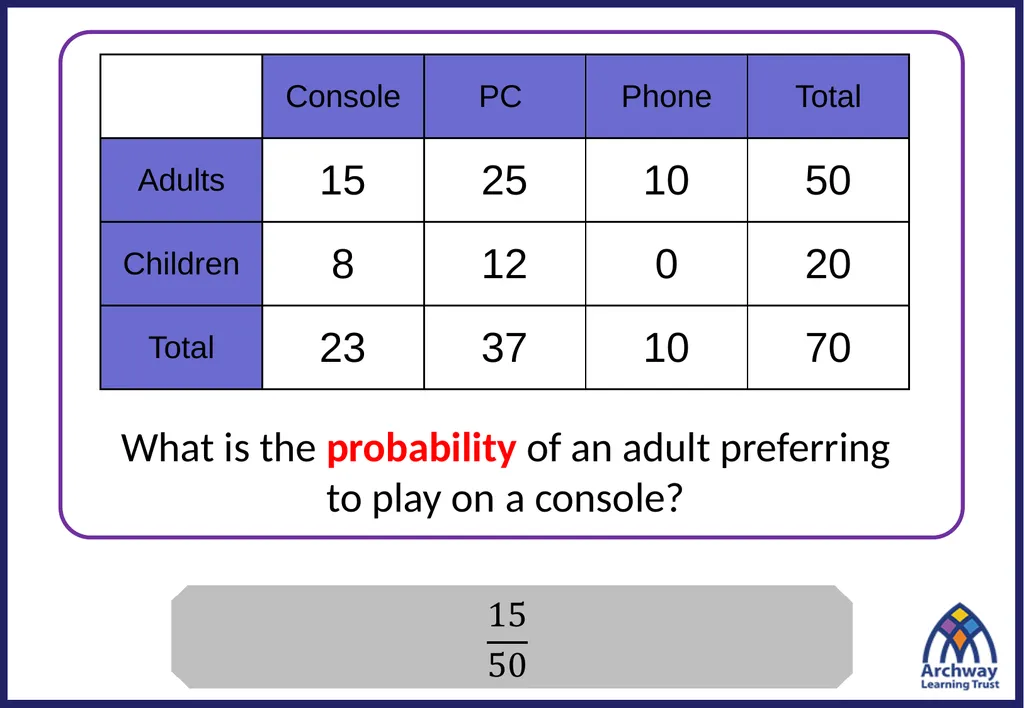
Answer What is the probability of an adult preferring
to play on a console?<br>
09
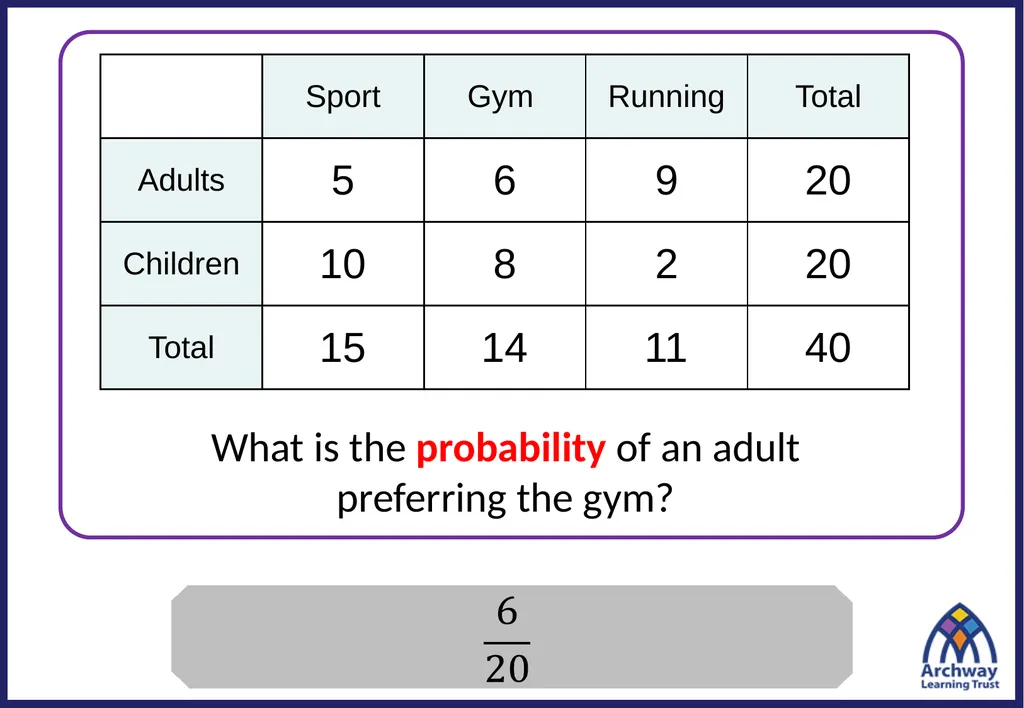
Answer What is the probability of an adult
preferring the gym?<br>
10
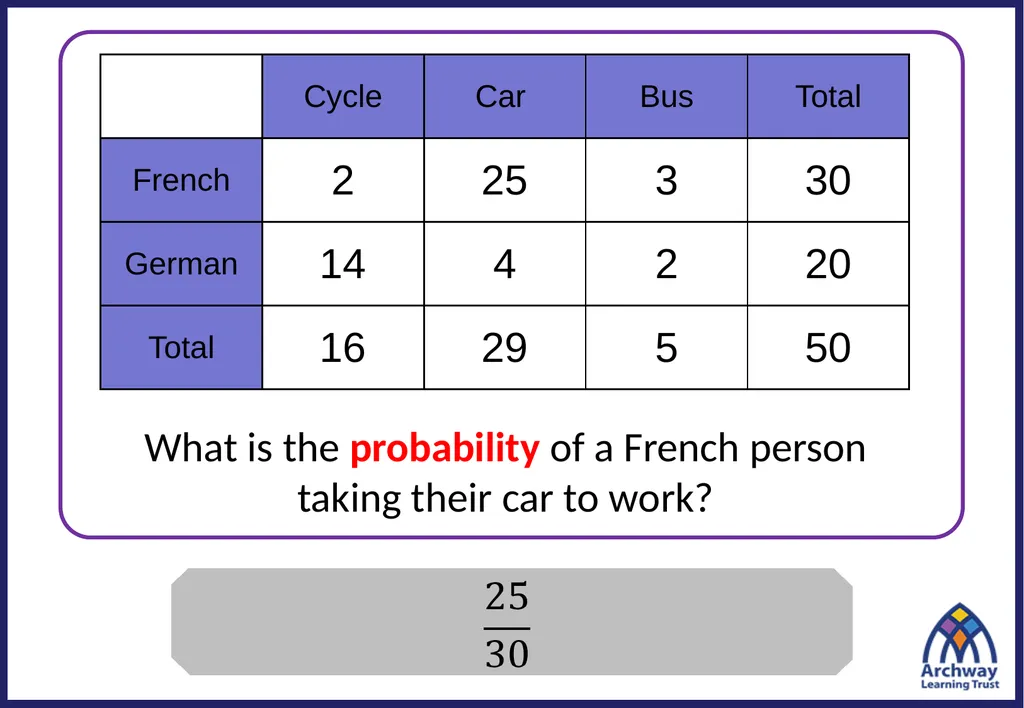
Answer What is the probability of a French person
taking their car to work?<br>
11
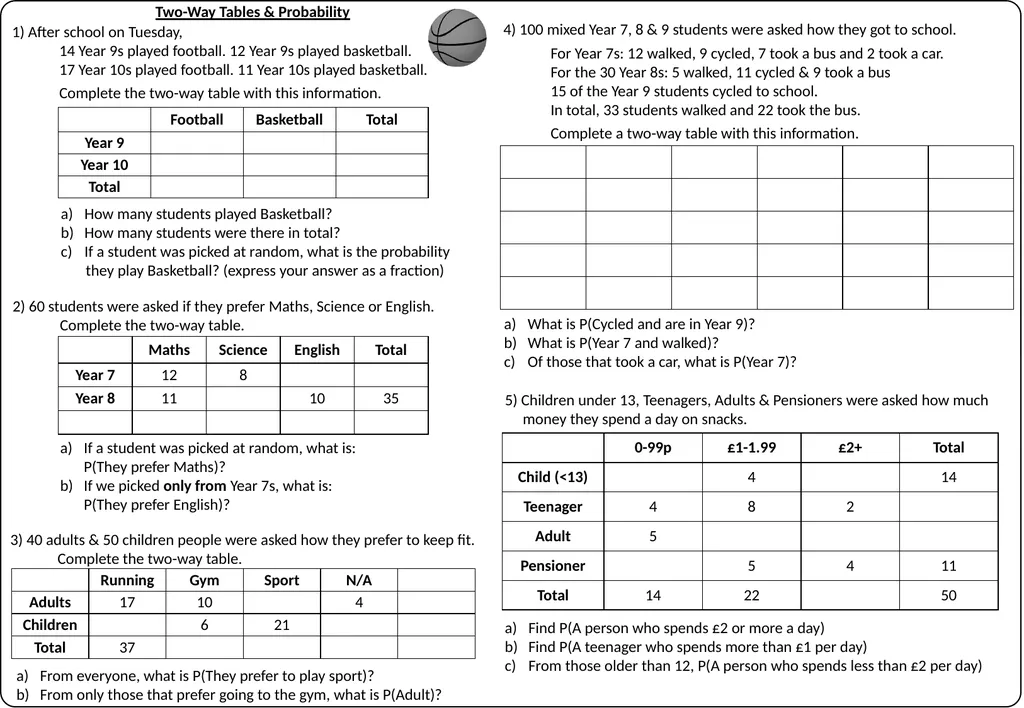
Two-Way Tables & Probability 1) After school on Tuesday,
14 Year 9s played football. 12 Year 9s played basketball.
17 Year 10s played football. 11 Year 10s played basketball.
Complete the two-way table with this information. 2) 60 students were asked if they prefer Maths, Science or English.
Complete the two-way table. 5) Children under 13, Teenagers, Adults & Pensioners were asked how much
money they spend a day on snacks. 4) 100 mixed Year 7, 8 & 9 students were asked how they got to school.
For Year 7s: 12 walked, 9 cycled, 7 took a bus and 2 took a car.
For the 30 Year 8s: 5 walked, 11 cycled & 9 took a bus
15 of the Year 9 students cycled to school.
In total, 33 students walked and 22 took the bus.
Complete a two-way table with this information. If a student was picked at random, what is: P(They prefer Maths)?
If we picked only from Year 7s, what is: P(They prefer English)? 3) 40 adults & 50 children people were asked how they prefer to keep fit.
Complete the two-way table. From everyone, what is P(They prefer to play sport)?
From only those that prefer going to the gym, what is P(Adult)? Find P(A person who spends £2 or more a day)
Find P(A teenager who spends more than £1 per day)
From those older than 12, P(A person who spends less than £2 per day) How many students played Basketball?
How many students were there in total?
If a student was picked at random, what is the probability
they play Basketball? (express your answer as a fraction) What is P(Cycled and are in Year 9)?
What is P(Year 7 and walked)?
Of those that took a car, what is P(Year 7)?<br>
12
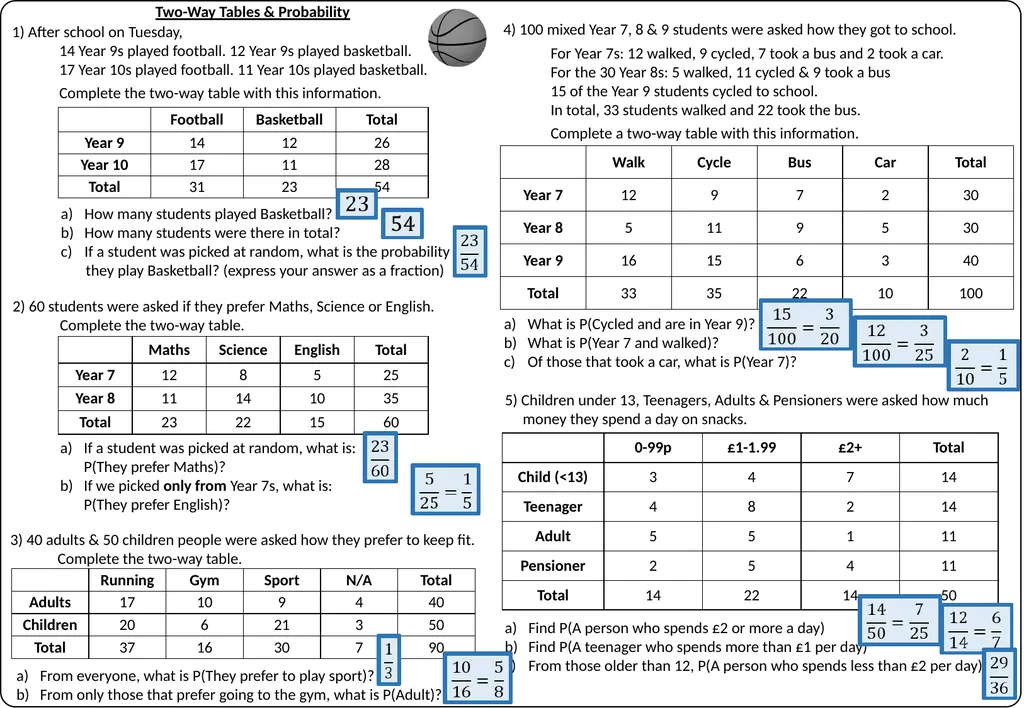
Two-Way Tables & Probability 1) After school on Tuesday,
14 Year 9s played football. 12 Year 9s played basketball.
17 Year 10s played football. 11 Year 10s played basketball.
Complete the two-way table with this information. How many students played Basketball?
How many students were there in total?
If a student was picked at random, what is the probability
they play Basketball? (express your answer as a fraction) 2) 60 students were asked if they prefer Maths, Science or English.
Complete the two-way table. If a student was picked at random, what is: P(They prefer Maths)?
If we picked only from Year 7s, what is: P(They prefer English)? 3) 40 adults & 50 children people were asked how they prefer to keep fit.
Complete the two-way table. From everyone, what is P(They prefer to play sport)?
From only those that prefer going to the gym, what is P(Adult)? What is P(Cycled and are in Year 9)?
What is P(Year 7 and walked)?
Of those that took a car, what is P(Year 7)? 5) Children under 13, Teenagers, Adults & Pensioners were asked how much
money they spend a day on snacks. Find P(A person who spends £2 or more a day)
Find P(A teenager who spends more than £1 per day)
From those older than 12, P(A person who spends less than £2 per day) 4) 100 mixed Year 7, 8 & 9 students were asked how they got to school.
For Year 7s: 12 walked, 9 cycled, 7 took a bus and 2 took a car.
For the 30 Year 8s: 5 walked, 11 cycled & 9 took a bus
15 of the Year 9 students cycled to school.
In total, 33 students walked and 22 took the bus.
Complete a two-way table with this information.<br>
13
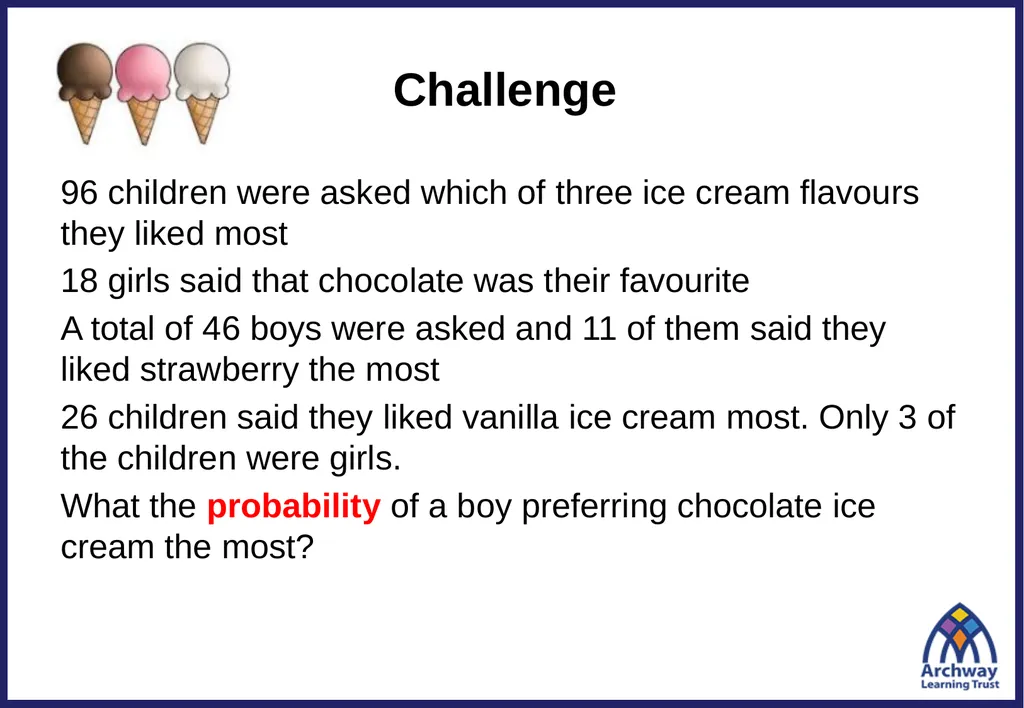
Challenge 96 children were asked which of three ice cream flavours they liked most
18 girls said that chocolate was their favourite
A total of 46 boys were asked and 11 of them said they liked strawberry the most
26 children said they liked vanilla ice cream most. Only 3 of the children were girls.
What the probability of a boy preferring chocolate ice cream the most?<br>