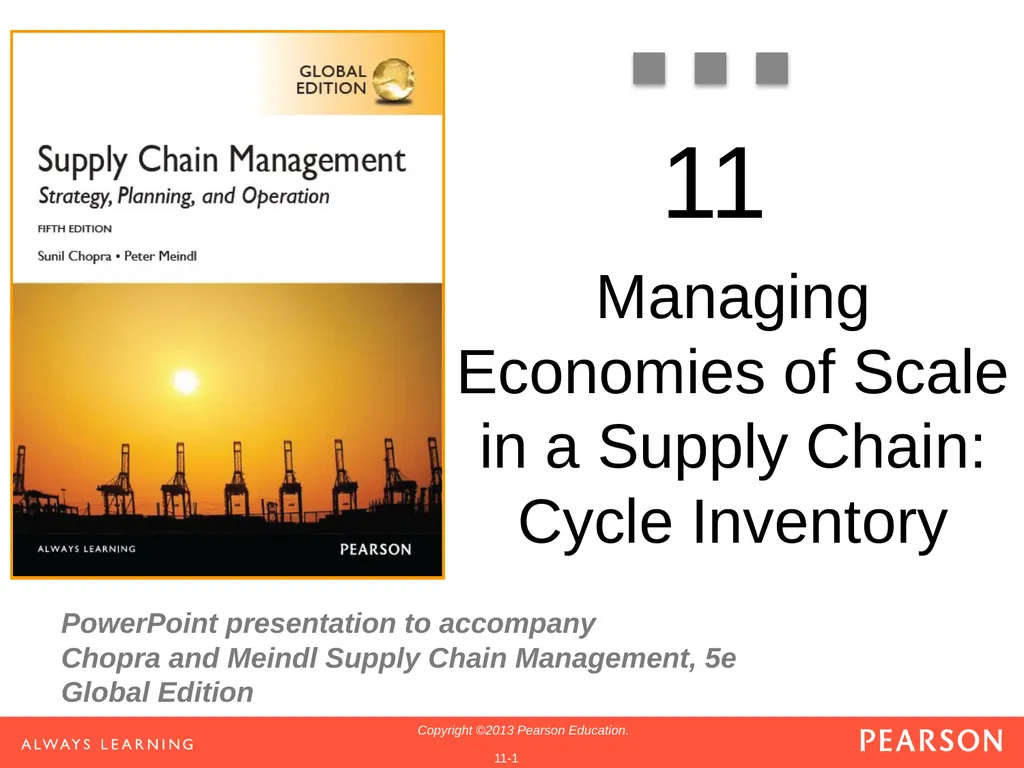
11 Managing Economies of Scale in a Supply Chain:
Description: 11 Managing Economies of Scale in a Supply Chain: Cycle Inventory Learning Objectives Balance the appropriate costs to choose the optimal lot size and cycle inventory in a supply chain. Identify managerial levers that reduce lot size and
Related Topics
Download Presentation
"11 Managing Economies of Scale in a Supply Chain:" is the property of its rightful owner. Permission is granted to download and print the materials on this website for personal, non-commercial use only, and to display it on your personal computer provided you do not modify the materials and that you retain all copyright notices contained in the materials. By downloading content from our website, you accept the terms of this agreement.
Presentation Transcript
slide1. 11 Managing Economies of Scale in a Supply Chain: Cycle Inventory<br>
slide2. Learning Objectives Balance the appropriate costs to choose the optimal lot size and cycle inventory in a supply chain.
Identify managerial levers that reduce lot size and cycle inventory in a supply chain without increasing cost.<br>
slide3. Inventory Stock of items or resources used in an organisation
Manufacturing inventory refers to materials that contribute or become part of a firm’s product output.
Raw materials
Component parts or supplies
Work-in-process
Finished goods<br>
slide4. Purpose of Inventory meet variation in product demand
provide safeguard for variation in raw material delivery
maintain independence of operations
allow flexibility in production scheduling
take advantage of quantity discounts<br>
slide5. Inventory Costs storage
handling
insurance and taxes
pilferage and breakage
obsolescence and depreciation
opportunity cost of capital order processing
shipping and receiving
production setup / changeover
lost sales
backorders
lateness penalties<br>
slide6. Estimating Cycle Inventory Related Costs in Practice Inventory Holding Cost
Cost of capital<br>
slide7. Inventory Holding Cost
Cost of capital Estimating Cycle Inventory Related Costs in Practice<br>
slide8. Estimating Cycle Inventory Related Costs in Practice Inventory Holding Cost
Obsolescence cost
Handling cost
Storage/Occupancy cost
Miscellaneous costs
Theft, security, damage, tax, insurance<br>
slide9. Estimating Cycle Inventory Related Costs in Practice Ordering Cost
Buyer time
Transportation costs
Receiving costs
Other costs<br>
slide10. Janny Leung Inventory EOQ 10 Inventory System Set of policies and controls that monitor levels of inventory (for all items)
.
determine what levels should be maintained
when stock should be replenished
how large an order should be
keep track of orders sent and received
reconcile records with physical inventory<br>
slide11. 11 Economic Order Quantity (EOQ) Model Assumptions:
demand rate constant
instantaneous replenishment
price per item independent of order size
no shortage or backorders allowed
Questions:
When to order?
How much to order?<br>
slide12. Inventory Profile Figure 11-1<br>
slide13. 13 EOQ Model Notation:
D = demand rate per unit time (year)
C = cost per unit item
S = fixed setup/order cost per order
H = holding cost per unit item per unit time
h = inventory holding percentage
(H = hC)
Q = quantity to be ordered<br>
slide14. Economies of Scaleto Exploit Fixed Costs Minimize
Annual material cost
Annual ordering cost
Annual holding cost<br>
slide15. Lot Sizing for a Single Product<br>
slide16. 16 Total Cost (per unit time)
= purchase cost + ordering cost + holding cost
TC = DC + SD/Q + HQ/2
Best Q?
or EOQ<br>
slide17. Lot Sizing for a Single Product Figure 11-2<br>
slide18. Lot Sizing for a Single Product<br>
slide19. Role of Cycle Inventoryin a Supply Chain Lot or batch size is the quantity that a stage of a supply chain either produces or purchases at a time
Cycle inventory is the average inventory in a supply chain due to either production or purchases in lot sizes that are larger than those demanded by the customer
Q: Quantity in a lot or batch size
D: Demand per unit time<br>
slide20. Role of Cycle Inventoryin a Supply Chain Average price paid per unit purchased is a key cost in the lot-sizing decision
Material cost = C
Fixed ordering cost includes all costs that do not vary with the size of the order but are incurred each time an order is placed
Fixed ordering cost = S
Holding cost is the cost of carrying one unit in inventory for a specified period of time
Holding cost = H = hC<br>
slide21. Role of Cycle Inventoryin a Supply Chain<br>
slide22. Role of Cycle Inventoryin a Supply Chain Lower cycle inventory has
Shorter average flow time
Lower working capital requirements
Lower inventory holding costs
Cycle inventory is held to
Take advantage of economies of scale
Reduce costs in the supply chain<br>
slide23. Role of Cycle Inventoryin a Supply Chain Primary role of cycle inventory is to allow different stages to purchase product in lot sizes that minimize the sum of material, ordering, and holding costs
Ideally, cycle inventory decisions should consider costs across the entire supply chain
In practice, each stage generally makes its own supply chain decisions
Increases total cycle inventory and total costs in the supply chain<br>
slide24. 24 Economic Order Quantity (EOQ) Model Assumptions:
demand rate constant
instantaneous replenishment
price per item independent of order size
no shortage or backorders allowed
Questions:
When to order?
How much to order? X<br>
slide25. Janny Leung Inventory EOQ 25 Basic Fixed-Order Quantity Model with Lead Time Order when inventory drops to
R = DL where L = lead time<br>
slide26. Janny Leung Inventory EOQ 26 Inventory position =on-hand + on-order inventory<br>
slide27. Production Lot Sizing The entire lot does not arrive at the same time
Production occurs at a specified rate P
Inventory builds up at a rate of P – D<br>
slide28. Janny Leung Inventory EOQ 28 Production lot sizing p = replenishment rate
d = demand rate<br>
slide29. Janny Leung Inventory EOQ 29 EOQ vs. JIT EOQ:
order quantity set according to EOQ formula
JIT:
reduce inventory as much as possible
Who is right? Who is wrong?
What is the “right” order quantity?
What is the “true” cost of inventory?<br>
slide30. EOQ Example Annual demand, D = 1,000 x 12 = 12,000 units
Order cost per lot, S = $4,000
Unit cost per computer, C = $500
Holding cost per year as a fraction of unit cost, h = 0.2<br>
slide31. EOQ Example<br>
slide32. Example (continued) Suppose lot size is reduced to Q=200, which would reduce flow time:
Annual ordering and holding cost =
= (12000/200)(4000) + (200/2)(0.2)(500)
= $240,000 + $10,000 = $250,000
To make it economically feasible to reduce lot size, the fixed cost associated with each lot would have to be reduced<br>
slide33. Lot Size and Ordering Cost If the lot size Q* = 200, how much should the ordering cost be reduced? Desired lot size, Q* = 200
Annual demand, D = 1,000 × 12 = 12,000 units
Unit cost per computer, C = $500
Holding cost per year as a fraction of inventory value, h = 0.2
Use EOQ equation and solve for S: To reduce optimal lot size by a factor of k, the fixed order cost must be reduced by a factor of k2<br>
slide34. Janny Leung Inventory EOQ 34 Inventory Pooling What happens to the optimal order quantity when the demand rate doubles? Triples?
Consequences?
Large supermarkets vs. mom-&-pop stores
“backup” agreements between stores<br>
slide35. Janny Leung Inventory EOQ Global Supply/Distribution Chains Decentralized System:
Centralized System: Factory Retailers Factory Depot Retailers<br>
slide36. Janny Leung Inventory EOQ 36 Multiple Products EOQ system requires constant monitoring
Ordering cycle may be different for different products
Delivery cost to different retailers in same region may be shared<br>
slide37. Role of Cycle Inventoryin a Supply Chain Economies of scale exploited in three typical situations
A fixed cost is incurred each time an order is placed or produced
The supplier offers price discounts based on the quantity purchased per lot
The supplier offers short-term price discounts or holds trade promotions<br>
slide38. All rights reserved. No part of this publication may be reproduced, stored in a retrieval system, or transmitted, in any form or by any means, electronic, mechanical, photocopying, recording, or otherwise, without the prior written permission of the publisher.
Printed in the United States of America.<br>
slide2. Learning Objectives Balance the appropriate costs to choose the optimal lot size and cycle inventory in a supply chain.
Identify managerial levers that reduce lot size and cycle inventory in a supply chain without increasing cost.<br>
slide3. Inventory Stock of items or resources used in an organisation
Manufacturing inventory refers to materials that contribute or become part of a firm’s product output.
Raw materials
Component parts or supplies
Work-in-process
Finished goods<br>
slide4. Purpose of Inventory meet variation in product demand
provide safeguard for variation in raw material delivery
maintain independence of operations
allow flexibility in production scheduling
take advantage of quantity discounts<br>
slide5. Inventory Costs storage
handling
insurance and taxes
pilferage and breakage
obsolescence and depreciation
opportunity cost of capital order processing
shipping and receiving
production setup / changeover
lost sales
backorders
lateness penalties<br>
slide6. Estimating Cycle Inventory Related Costs in Practice Inventory Holding Cost
Cost of capital<br>
slide7. Inventory Holding Cost
Cost of capital Estimating Cycle Inventory Related Costs in Practice<br>
slide8. Estimating Cycle Inventory Related Costs in Practice Inventory Holding Cost
Obsolescence cost
Handling cost
Storage/Occupancy cost
Miscellaneous costs
Theft, security, damage, tax, insurance<br>
slide9. Estimating Cycle Inventory Related Costs in Practice Ordering Cost
Buyer time
Transportation costs
Receiving costs
Other costs<br>
slide10. Janny Leung Inventory EOQ 10 Inventory System Set of policies and controls that monitor levels of inventory (for all items)
.
determine what levels should be maintained
when stock should be replenished
how large an order should be
keep track of orders sent and received
reconcile records with physical inventory<br>
slide11. 11 Economic Order Quantity (EOQ) Model Assumptions:
demand rate constant
instantaneous replenishment
price per item independent of order size
no shortage or backorders allowed
Questions:
When to order?
How much to order?<br>
slide12. Inventory Profile Figure 11-1<br>
slide13. 13 EOQ Model Notation:
D = demand rate per unit time (year)
C = cost per unit item
S = fixed setup/order cost per order
H = holding cost per unit item per unit time
h = inventory holding percentage
(H = hC)
Q = quantity to be ordered<br>
slide14. Economies of Scaleto Exploit Fixed Costs Minimize
Annual material cost
Annual ordering cost
Annual holding cost<br>
slide15. Lot Sizing for a Single Product<br>
slide16. 16 Total Cost (per unit time)
= purchase cost + ordering cost + holding cost
TC = DC + SD/Q + HQ/2
Best Q?
or EOQ<br>
slide17. Lot Sizing for a Single Product Figure 11-2<br>
slide18. Lot Sizing for a Single Product<br>
slide19. Role of Cycle Inventoryin a Supply Chain Lot or batch size is the quantity that a stage of a supply chain either produces or purchases at a time
Cycle inventory is the average inventory in a supply chain due to either production or purchases in lot sizes that are larger than those demanded by the customer
Q: Quantity in a lot or batch size
D: Demand per unit time<br>
slide20. Role of Cycle Inventoryin a Supply Chain Average price paid per unit purchased is a key cost in the lot-sizing decision
Material cost = C
Fixed ordering cost includes all costs that do not vary with the size of the order but are incurred each time an order is placed
Fixed ordering cost = S
Holding cost is the cost of carrying one unit in inventory for a specified period of time
Holding cost = H = hC<br>
slide21. Role of Cycle Inventoryin a Supply Chain<br>
slide22. Role of Cycle Inventoryin a Supply Chain Lower cycle inventory has
Shorter average flow time
Lower working capital requirements
Lower inventory holding costs
Cycle inventory is held to
Take advantage of economies of scale
Reduce costs in the supply chain<br>
slide23. Role of Cycle Inventoryin a Supply Chain Primary role of cycle inventory is to allow different stages to purchase product in lot sizes that minimize the sum of material, ordering, and holding costs
Ideally, cycle inventory decisions should consider costs across the entire supply chain
In practice, each stage generally makes its own supply chain decisions
Increases total cycle inventory and total costs in the supply chain<br>
slide24. 24 Economic Order Quantity (EOQ) Model Assumptions:
demand rate constant
instantaneous replenishment
price per item independent of order size
no shortage or backorders allowed
Questions:
When to order?
How much to order? X<br>
slide25. Janny Leung Inventory EOQ 25 Basic Fixed-Order Quantity Model with Lead Time Order when inventory drops to
R = DL where L = lead time<br>
slide26. Janny Leung Inventory EOQ 26 Inventory position =on-hand + on-order inventory<br>
slide27. Production Lot Sizing The entire lot does not arrive at the same time
Production occurs at a specified rate P
Inventory builds up at a rate of P – D<br>
slide28. Janny Leung Inventory EOQ 28 Production lot sizing p = replenishment rate
d = demand rate<br>
slide29. Janny Leung Inventory EOQ 29 EOQ vs. JIT EOQ:
order quantity set according to EOQ formula
JIT:
reduce inventory as much as possible
Who is right? Who is wrong?
What is the “right” order quantity?
What is the “true” cost of inventory?<br>
slide30. EOQ Example Annual demand, D = 1,000 x 12 = 12,000 units
Order cost per lot, S = $4,000
Unit cost per computer, C = $500
Holding cost per year as a fraction of unit cost, h = 0.2<br>
slide31. EOQ Example<br>
slide32. Example (continued) Suppose lot size is reduced to Q=200, which would reduce flow time:
Annual ordering and holding cost =
= (12000/200)(4000) + (200/2)(0.2)(500)
= $240,000 + $10,000 = $250,000
To make it economically feasible to reduce lot size, the fixed cost associated with each lot would have to be reduced<br>
slide33. Lot Size and Ordering Cost If the lot size Q* = 200, how much should the ordering cost be reduced? Desired lot size, Q* = 200
Annual demand, D = 1,000 × 12 = 12,000 units
Unit cost per computer, C = $500
Holding cost per year as a fraction of inventory value, h = 0.2
Use EOQ equation and solve for S: To reduce optimal lot size by a factor of k, the fixed order cost must be reduced by a factor of k2<br>
slide34. Janny Leung Inventory EOQ 34 Inventory Pooling What happens to the optimal order quantity when the demand rate doubles? Triples?
Consequences?
Large supermarkets vs. mom-&-pop stores
“backup” agreements between stores<br>
slide35. Janny Leung Inventory EOQ Global Supply/Distribution Chains Decentralized System:
Centralized System: Factory Retailers Factory Depot Retailers<br>
slide36. Janny Leung Inventory EOQ 36 Multiple Products EOQ system requires constant monitoring
Ordering cycle may be different for different products
Delivery cost to different retailers in same region may be shared<br>
slide37. Role of Cycle Inventoryin a Supply Chain Economies of scale exploited in three typical situations
A fixed cost is incurred each time an order is placed or produced
The supplier offers price discounts based on the quantity purchased per lot
The supplier offers short-term price discounts or holds trade promotions<br>
slide38. All rights reserved. No part of this publication may be reproduced, stored in a retrieval system, or transmitted, in any form or by any means, electronic, mechanical, photocopying, recording, or otherwise, without the prior written permission of the publisher.
Printed in the United States of America.<br>