
14 Transportation in a Supply Chain Learning
Description: 14 Transportation in a Supply Chain Learning Objectives Understand the role of transportation in a supply chain Evaluate the strengths and weaknesses of different modes of transportation Discuss the role of infrastructure and policies in
Related Topics
Download Presentation
"14 Transportation in a Supply Chain Learning" is the property of its rightful owner. Permission is granted to download and print the materials on this website for personal, non-commercial use only, and to display it on your personal computer provided you do not modify the materials and that you retain all copyright notices contained in the materials. By downloading content from our website, you accept the terms of this agreement.
Presentation Transcript
slide1. 14 Transportation in a Supply Chain<br>
slide2. Learning Objectives Understand the role of transportation in a supply chain
Evaluate the strengths and weaknesses of different modes of transportation
Discuss the role of infrastructure and policies in transportation
Identify the relative strengths and weaknesses of various transportation network design options
Identify trade-offs that shippers need to consider when designing a transportation network<br>
slide3. The Role of Transportation in a Supply Chain Movement of product from one location to another
Products rarely produced and consumed in the same location
Significant cost component
Shipper requires the movement of the product
Carrier moves or transports the product<br>
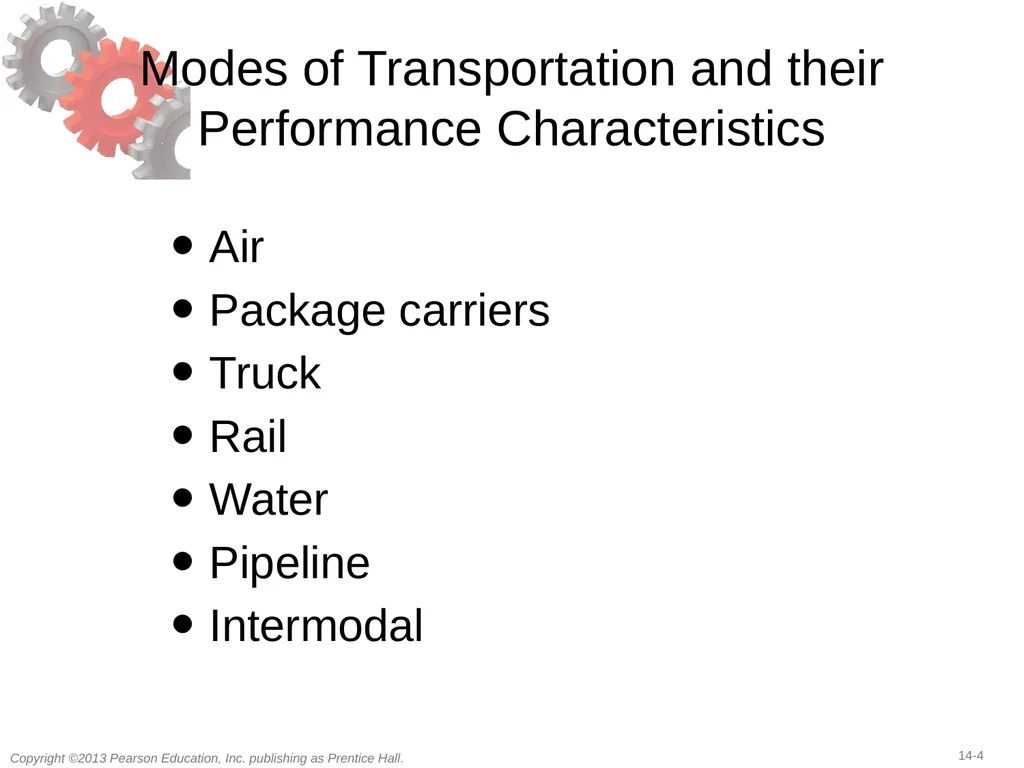
slide4. Modes of Transportation and their Performance Characteristics Air
Package carriers
Truck
Rail
Water
Pipeline
Intermodal<br>
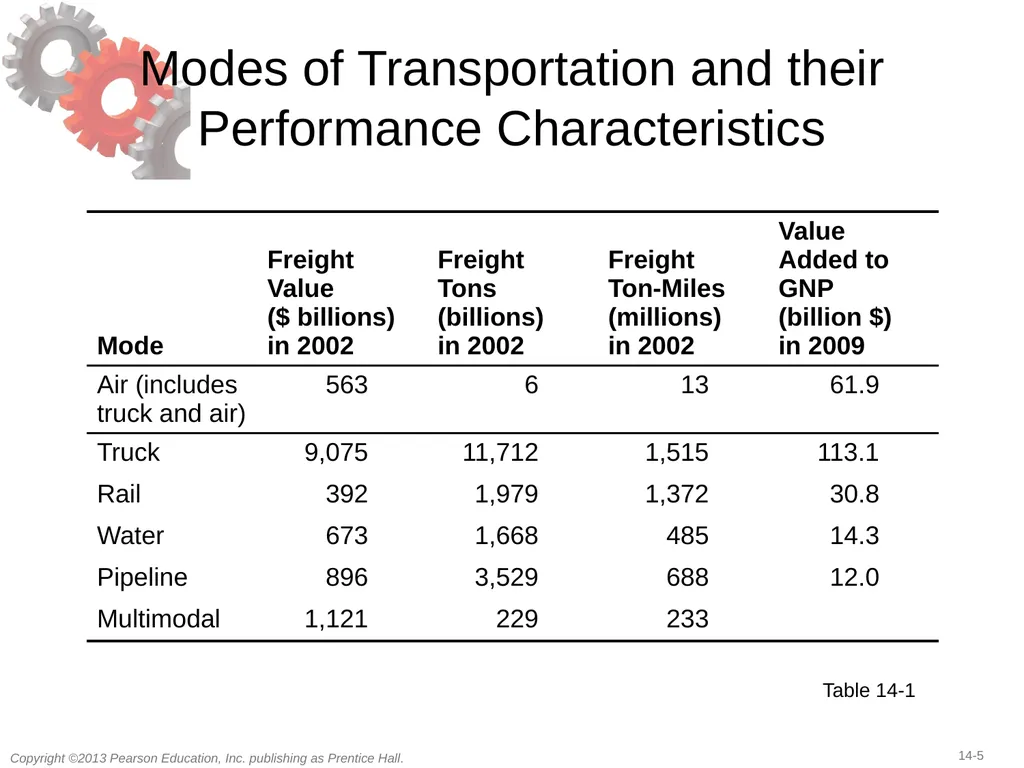
slide5. Modes of Transportation and their Performance Characteristics Table 14-1<br>
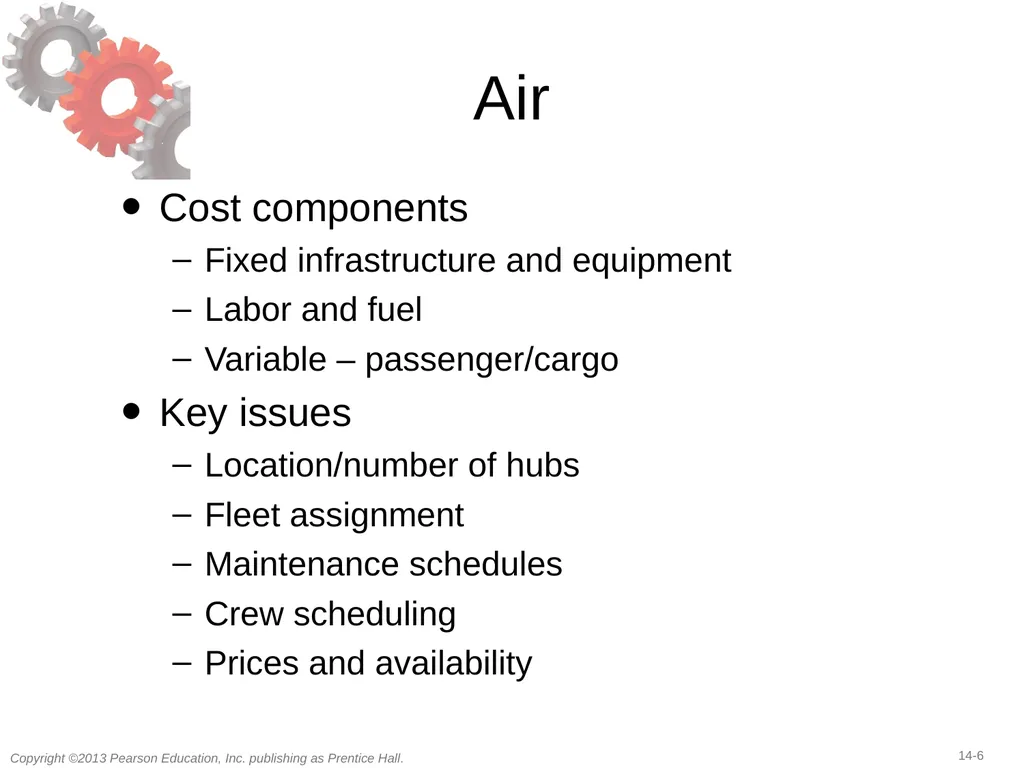
slide6. Air Cost components
Fixed infrastructure and equipment
Labor and fuel
Variable – passenger/cargo
Key issues
Location/number of hubs
Fleet assignment
Maintenance schedules
Crew scheduling
Prices and availability<br>
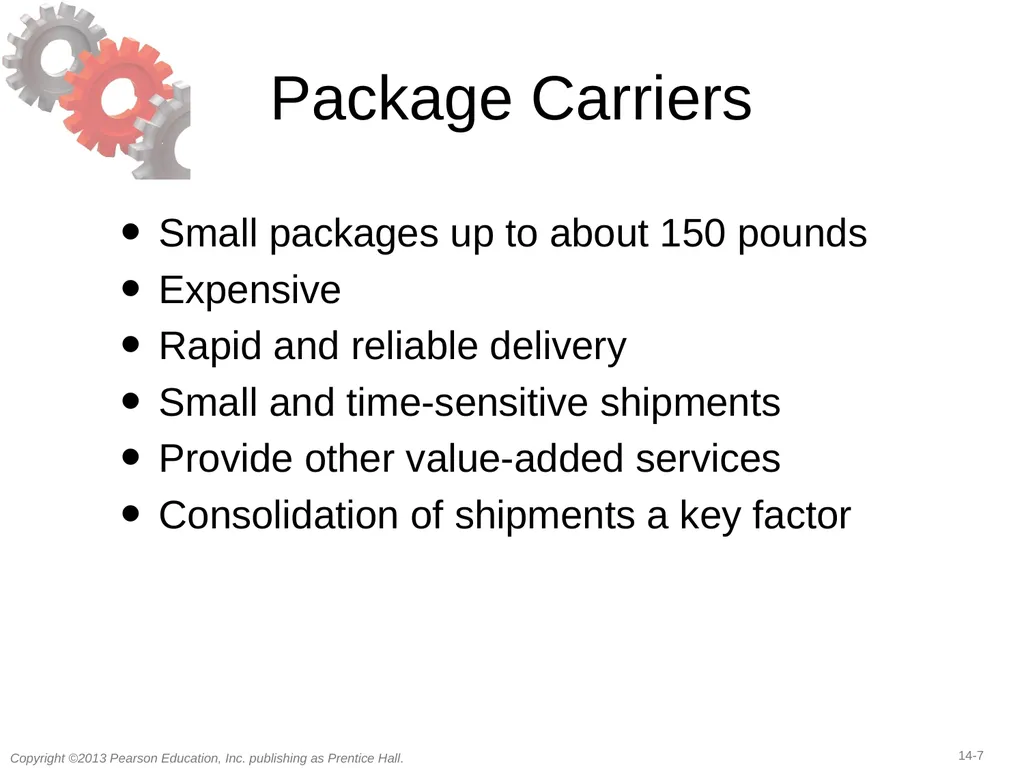
slide7. Package Carriers Small packages up to about 150 pounds
Expensive
Rapid and reliable delivery
Small and time-sensitive shipments
Provide other value-added services
Consolidation of shipments a key factor<br>
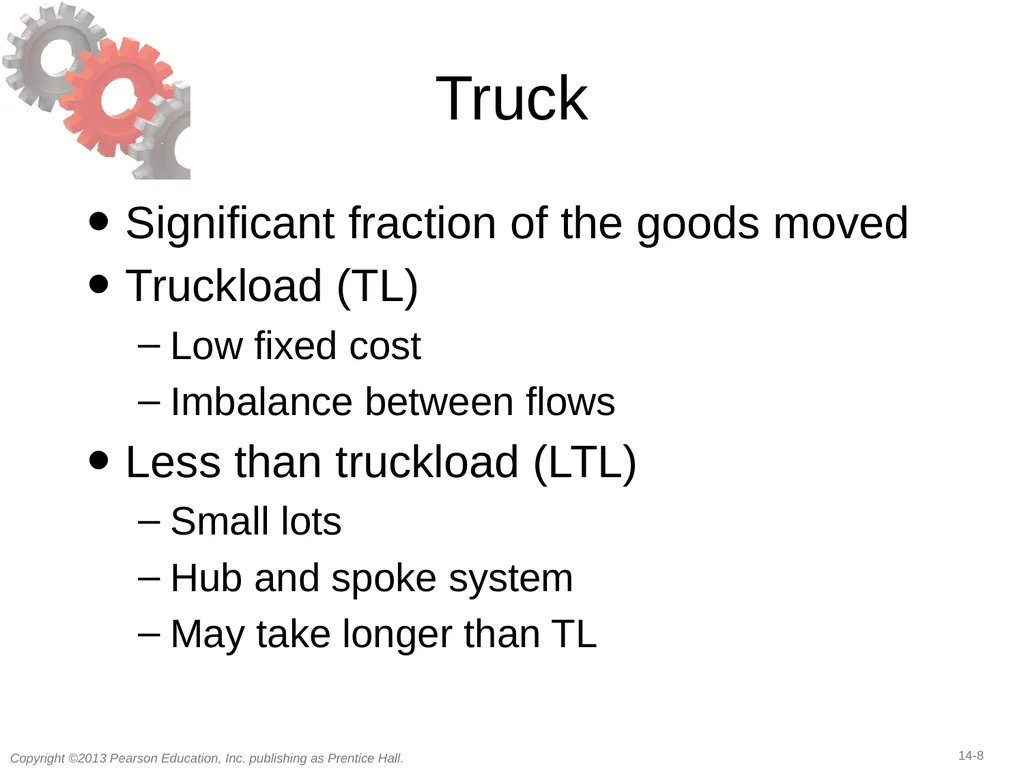
slide8. Truck Significant fraction of the goods moved
Truckload (TL)
Low fixed cost
Imbalance between flows
Less than truckload (LTL)
Small lots
Hub and spoke system
May take longer than TL<br>
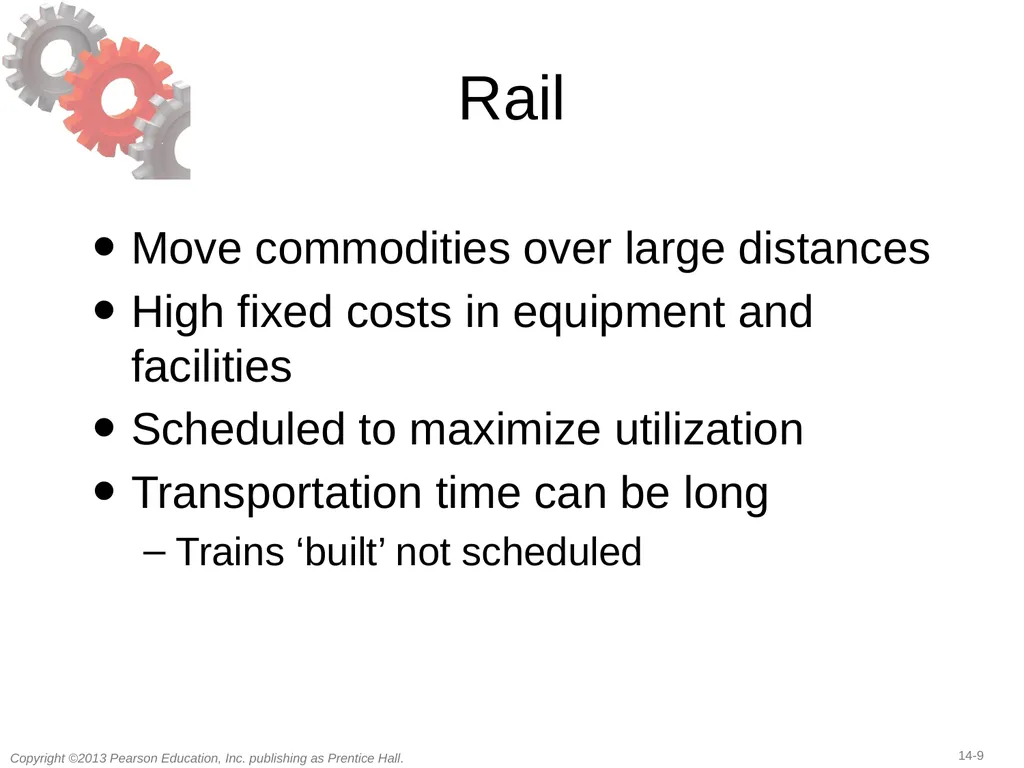
slide9. Rail Move commodities over large distances
High fixed costs in equipment and facilities
Scheduled to maximize utilization
Transportation time can be long
Trains ‘built’ not scheduled<br>
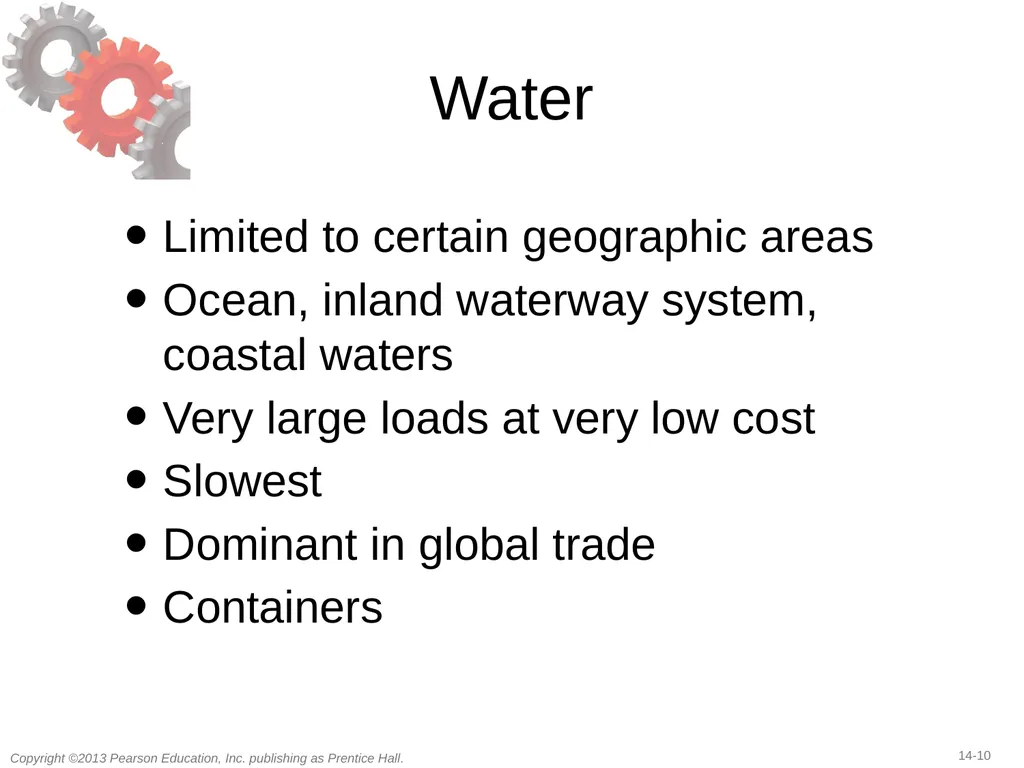
slide10. Water Limited to certain geographic areas
Ocean, inland waterway system, coastal waters
Very large loads at very low cost
Slowest
Dominant in global trade
Containers<br>
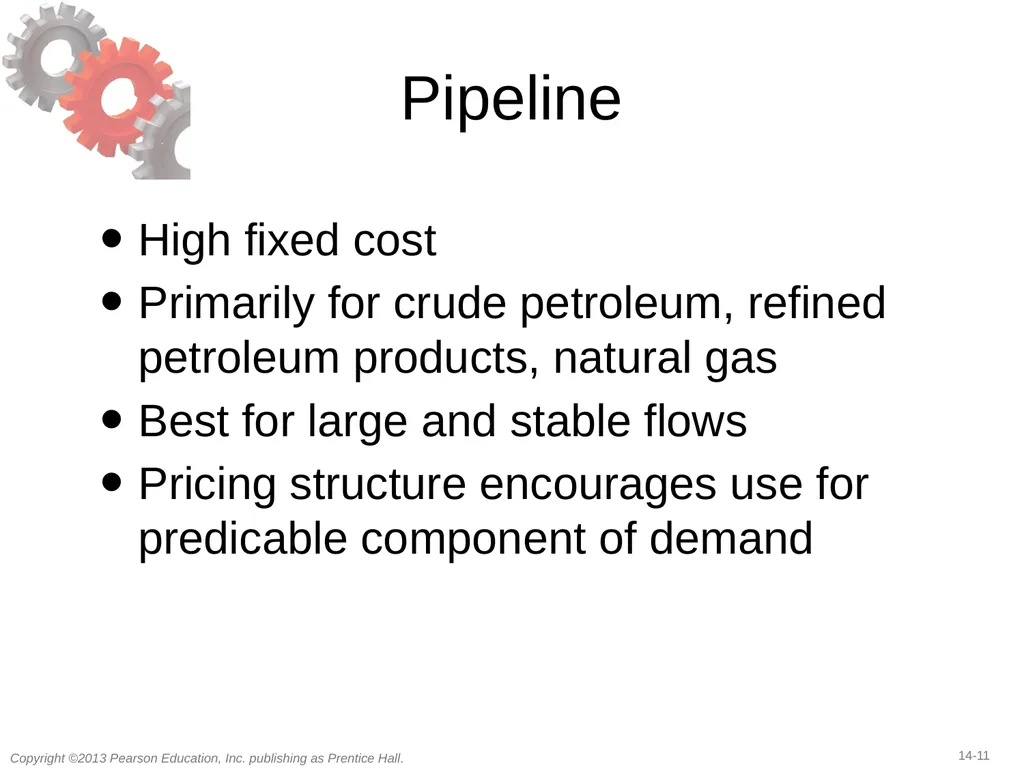
slide11. Pipeline High fixed cost
Primarily for crude petroleum, refined petroleum products, natural gas
Best for large and stable flows
Pricing structure encourages use for predicable component of demand<br>
slide12. Intermodal Use of more than one mode of transportation to move a shipment
Grown considerably with increased use of containers
May be the only option for global trade
More convenient for shippers – one entity
Key issue – exchange of information to facilitate transfer between different modes<br>
slide13. Transportation Infrastructure and Policies Governments generally take full responsibility or played a significant role in building and managing infrastructure elements
Without a monopoly, deregulation and market forces help create an effective industry structure
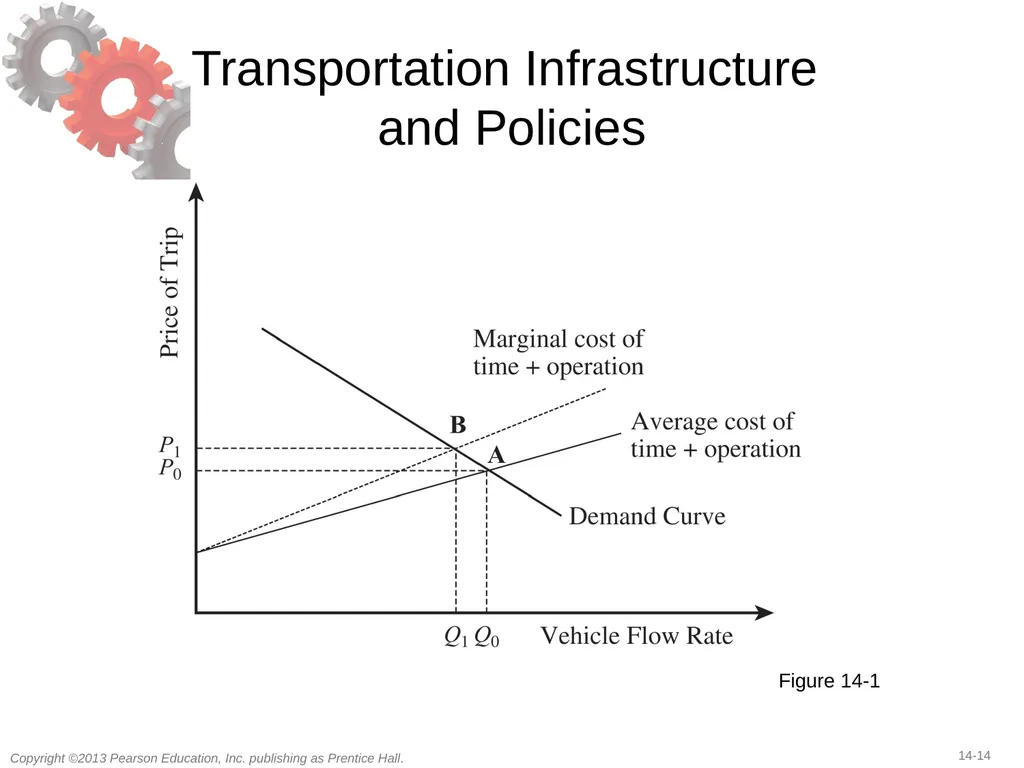
Pricing should reflect the marginal impact on the cost to society<br>
slide14. Transportation Infrastructure and Policies Figure 14-1<br>
slide15. Design Options for a Transportation Network When designing a transportation network
Should transportation be direct or through an intermediate site?
Should the intermediate site stock product or only serve as a cross-docking location?
Should each delivery route supply a single destination or multiple destinations (milk run)?<br>
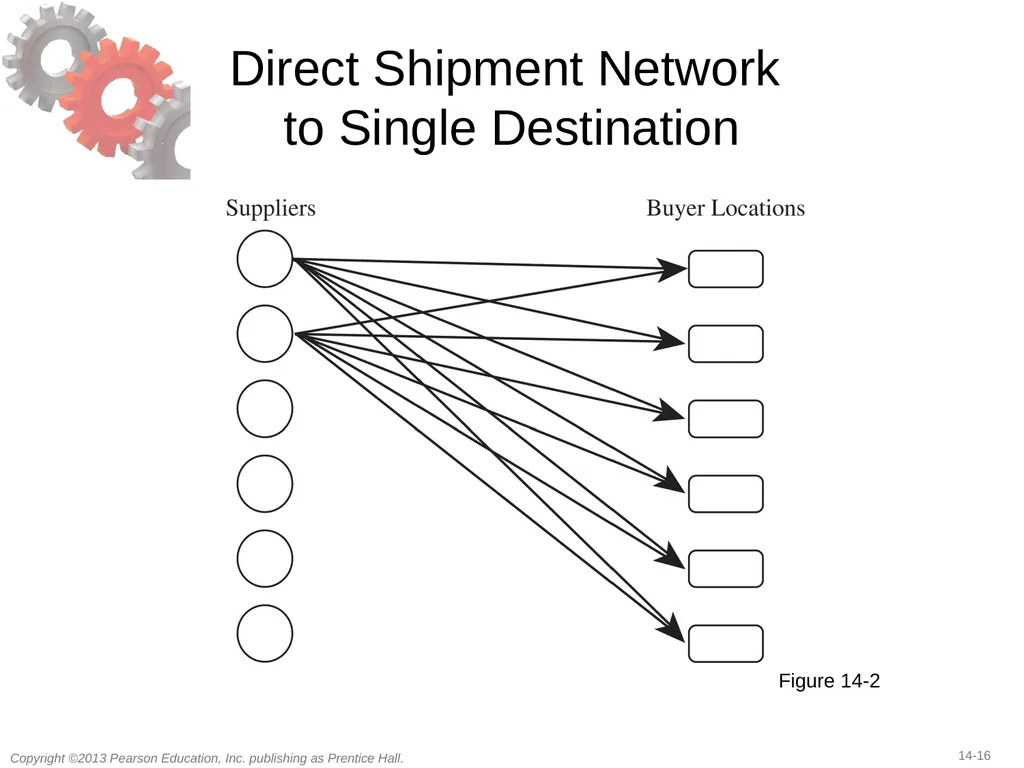
slide16. Direct Shipment Network to Single Destination Figure 14-2<br>
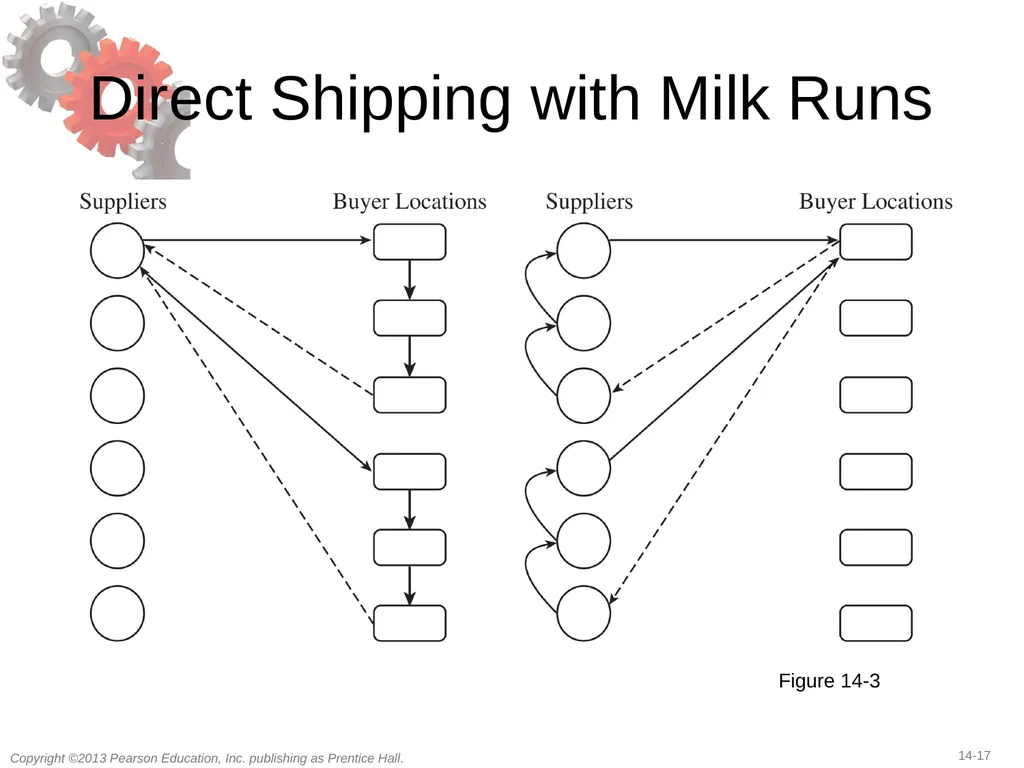
slide17. Direct Shipping with Milk Runs Figure 14-3<br>
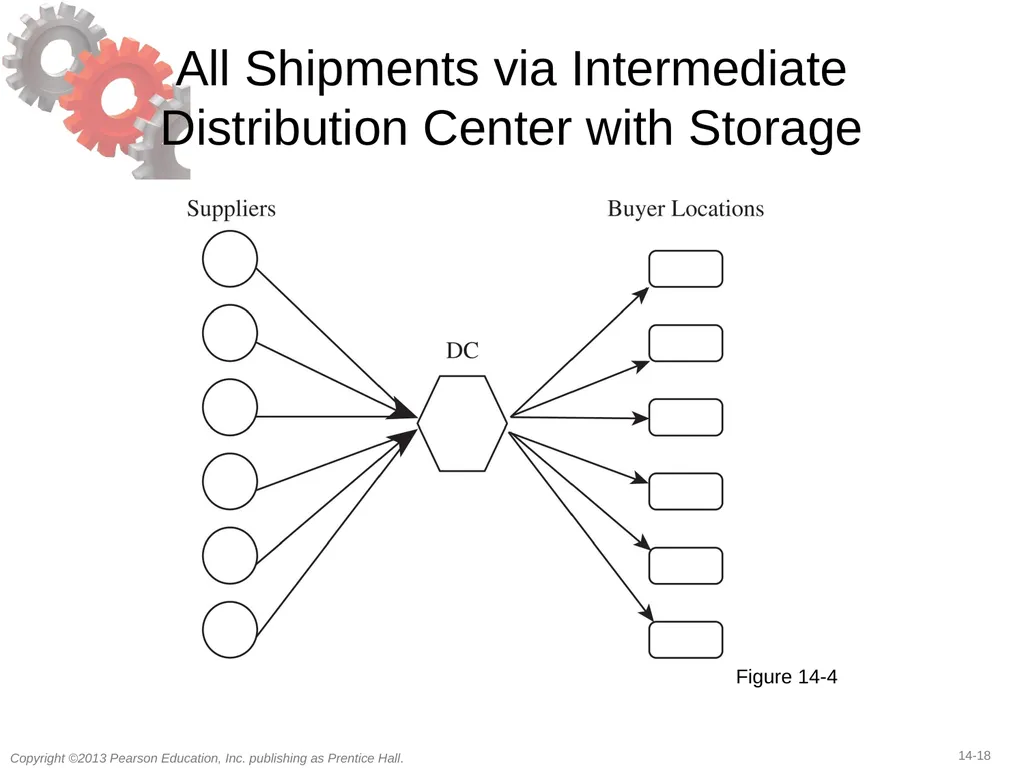
slide18. All Shipments via Intermediate Distribution Center with Storage Figure 14-4<br>
slide19. All Shipments via Intermediate Transit Point with Cross-Docking Suppliers send their shipments to an intermediate transit point
They are cross-docked and sent to buyer locations without storing them<br>
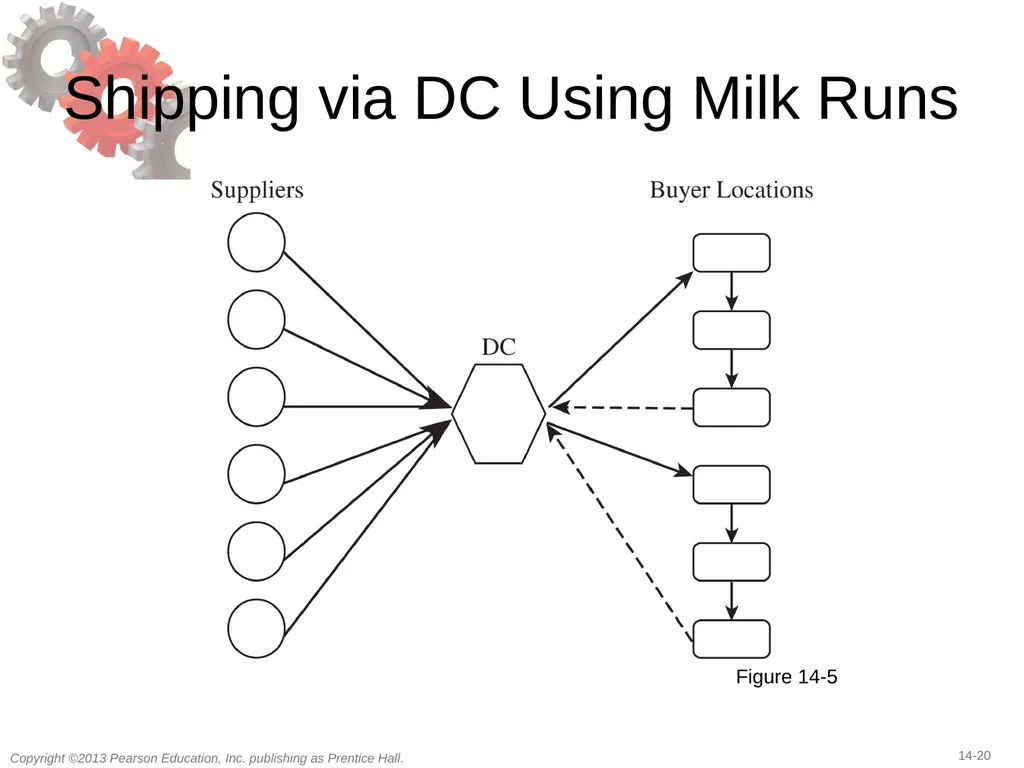
slide20. Shipping via DC Using Milk Runs Figure 14-5<br>
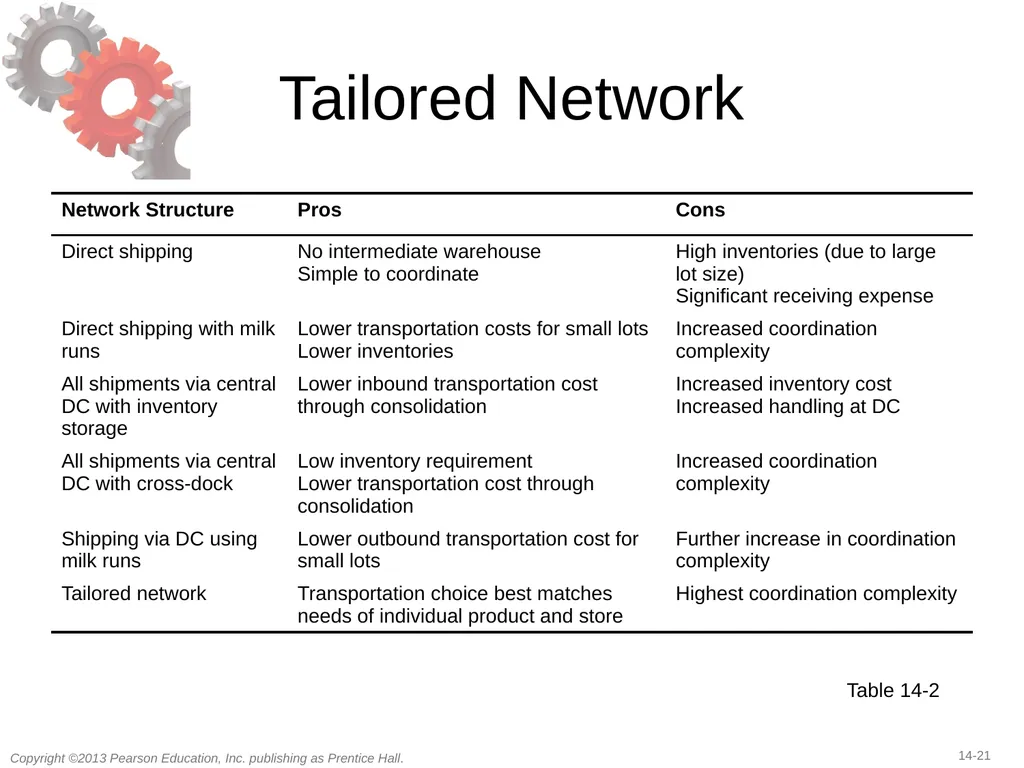
slide21. Tailored Network Table 14-2<br>
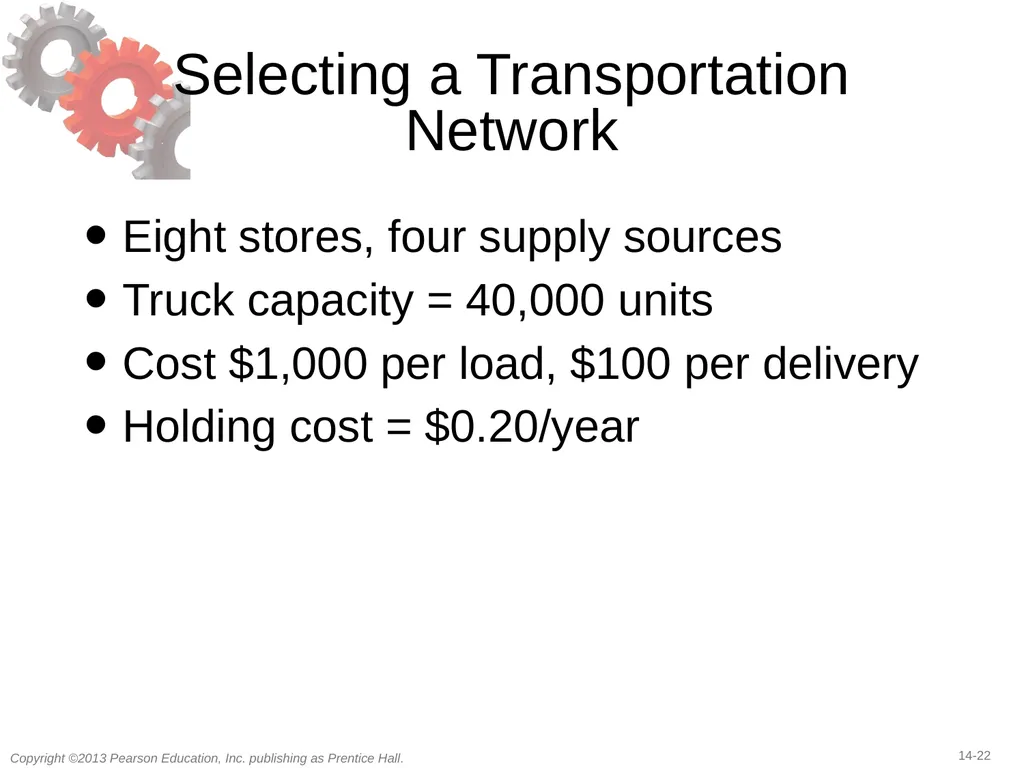
slide22. Selecting a Transportation Network Eight stores, four supply sources
Truck capacity = 40,000 units
Cost $1,000 per load, $100 per delivery
Holding cost = $0.20/year<br>
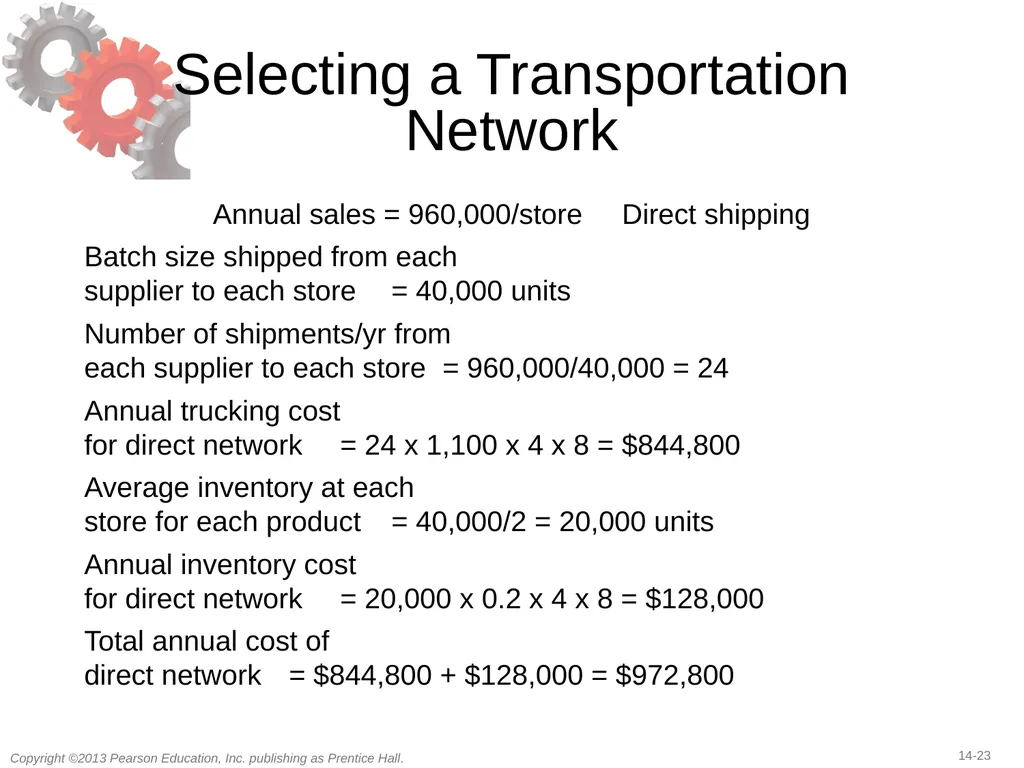
slide23. Selecting a Transportation Network Annual sales = 960,000/store Direct shipping
Batch size shipped from each supplier to each store = 40,000 units
Number of shipments/yr from each supplier to each store = 960,000/40,000 = 24
Annual trucking cost for direct network = 24 x 1,100 x 4 x 8 = $844,800
Average inventory at each store for each product = 40,000/2 = 20,000 units
Annual inventory cost for direct network = 20,000 x 0.2 x 4 x 8 = $128,000
Total annual cost of direct network = $844,800 + $128,000 = $972,800<br>
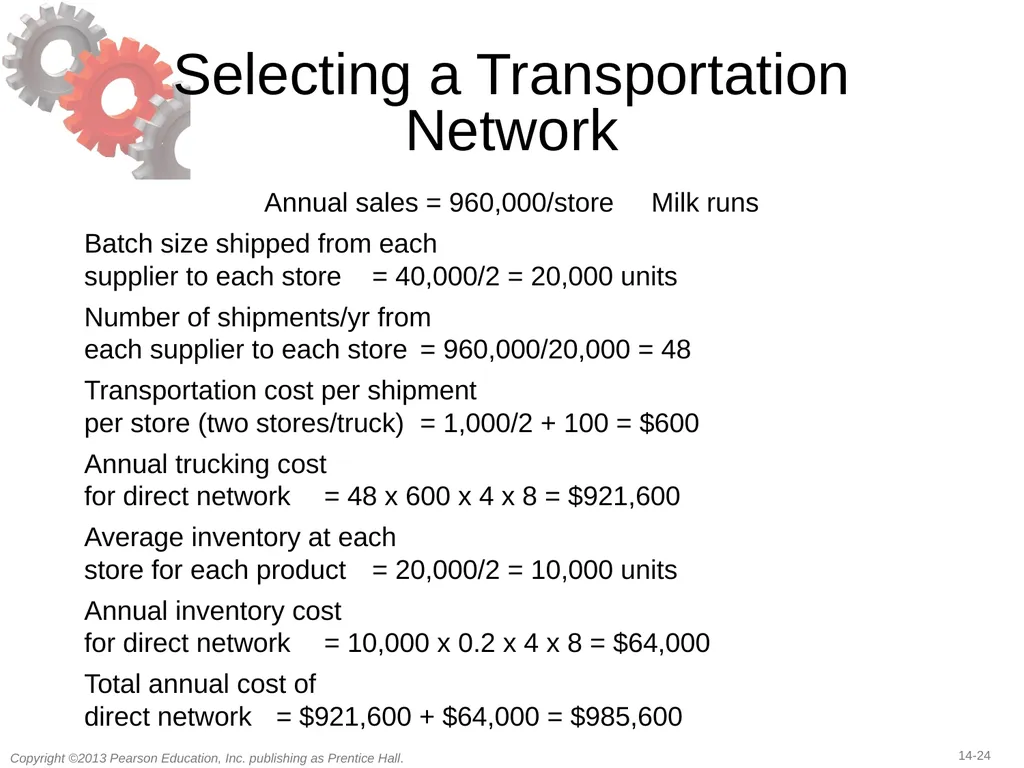
slide24. Selecting a Transportation Network Annual sales = 960,000/store Milk runs
Batch size shipped from each supplier to each store = 40,000/2 = 20,000 units
Number of shipments/yr from each supplier to each store = 960,000/20,000 = 48
Transportation cost per shipment per store (two stores/truck) = 1,000/2 + 100 = $600
Annual trucking cost for direct network = 48 x 600 x 4 x 8 = $921,600
Average inventory at each store for each product = 20,000/2 = 10,000 units
Annual inventory cost for direct network = 10,000 x 0.2 x 4 x 8 = $64,000
Total annual cost of direct network = $921,600 + $64,000 = $985,600<br>
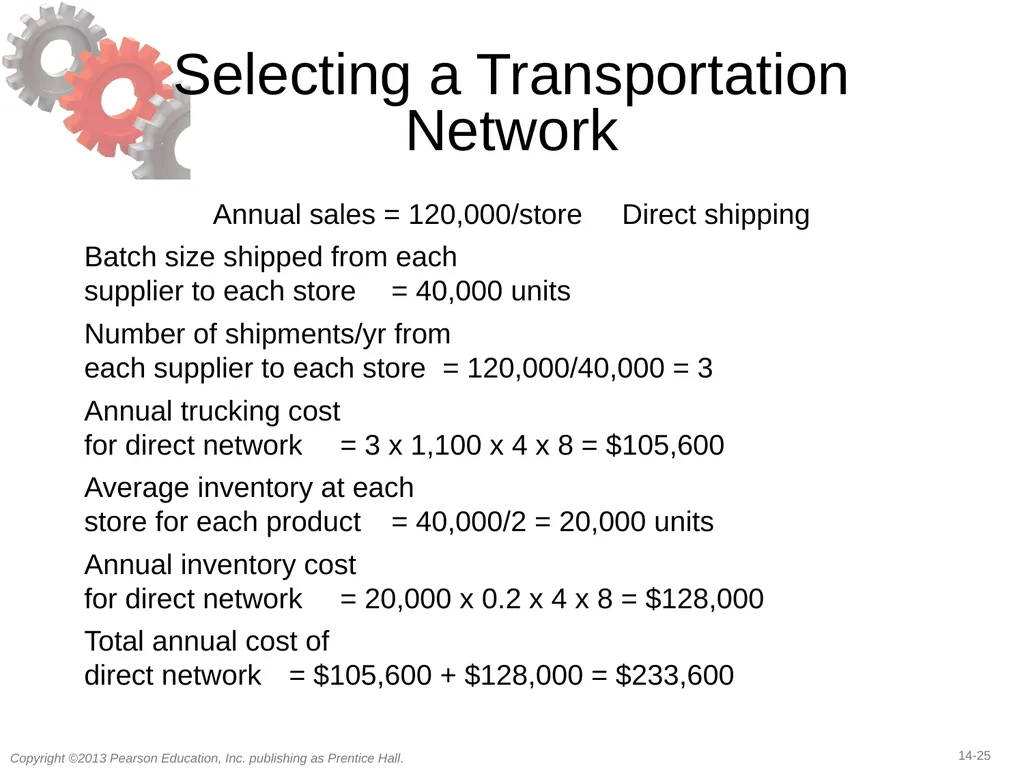
slide25. Selecting a Transportation Network Annual sales = 120,000/store Direct shipping
Batch size shipped from each supplier to each store = 40,000 units
Number of shipments/yr from each supplier to each store = 120,000/40,000 = 3
Annual trucking cost for direct network = 3 x 1,100 x 4 x 8 = $105,600
Average inventory at each store for each product = 40,000/2 = 20,000 units
Annual inventory cost for direct network = 20,000 x 0.2 x 4 x 8 = $128,000
Total annual cost of direct network = $105,600 + $128,000 = $233,600<br>
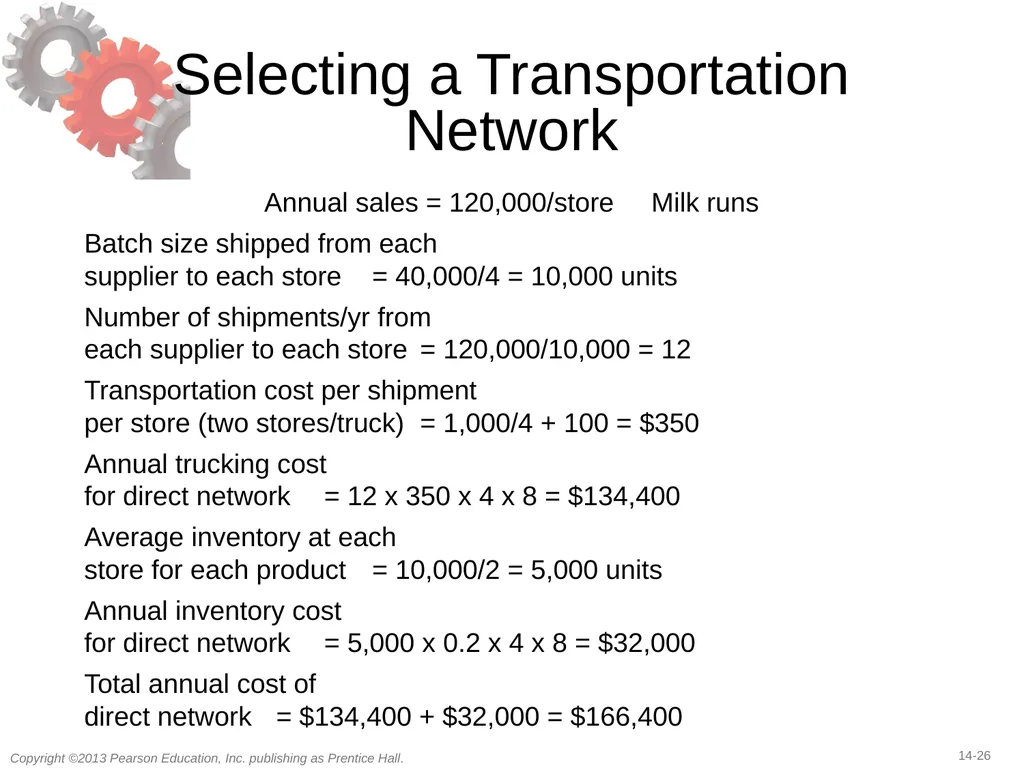
slide26. Selecting a Transportation Network Annual sales = 120,000/store Milk runs
Batch size shipped from each supplier to each store = 40,000/4 = 10,000 units
Number of shipments/yr from each supplier to each store = 120,000/10,000 = 12
Transportation cost per shipment per store (two stores/truck) = 1,000/4 + 100 = $350
Annual trucking cost for direct network = 12 x 350 x 4 x 8 = $134,400
Average inventory at each store for each product = 10,000/2 = 5,000 units
Annual inventory cost for direct network = 5,000 x 0.2 x 4 x 8 = $32,000
Total annual cost of direct network = $134,400 + $32,000 = $166,400<br>
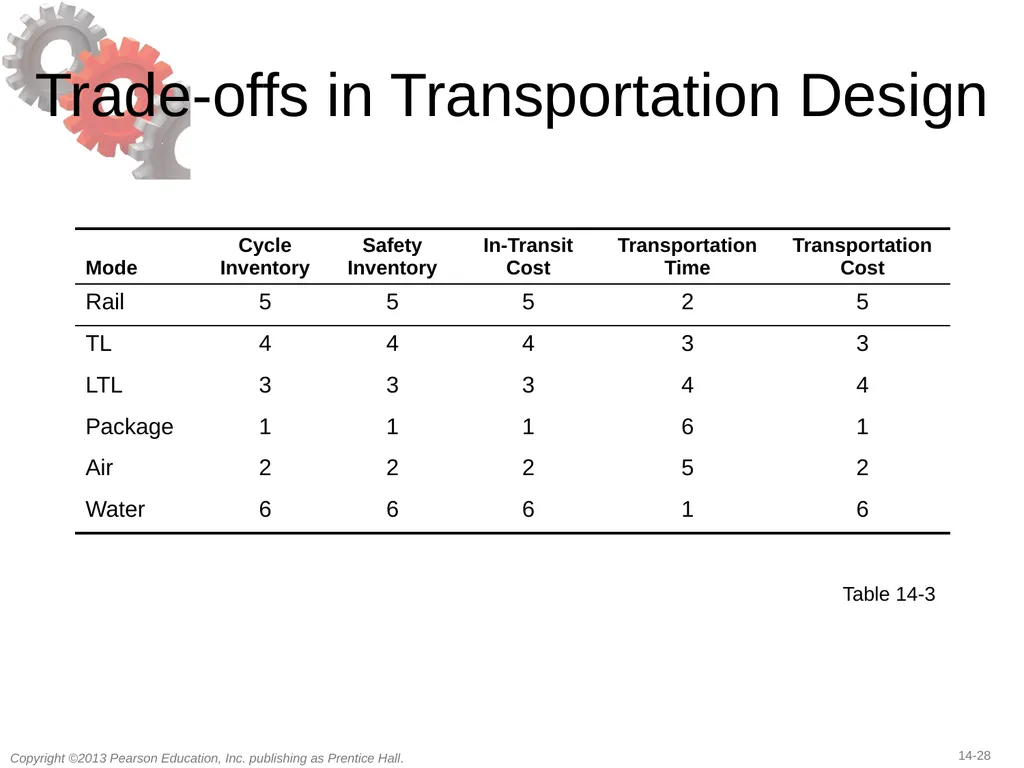
slide27. Trade-offs in Transportation Design Transportation and inventory cost trade-off
Choice of transportation mode
Inventory aggregation
Transportation cost and responsiveness trade-off<br>
slide28. Trade-offs in Transportation Design Table 14-3<br>
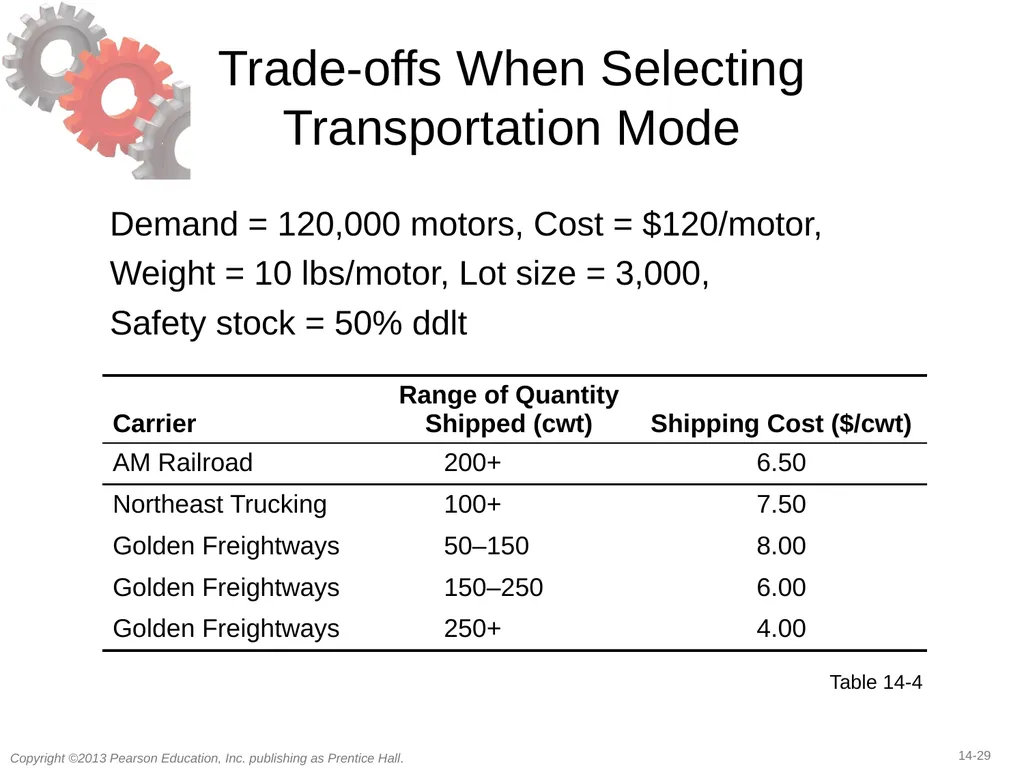
slide29. Trade-offs When Selecting Transportation Mode Demand = 120,000 motors, Cost = $120/motor,
Weight = 10 lbs/motor, Lot size = 3,000,
Safety stock = 50% ddlt Table 14-4<br>
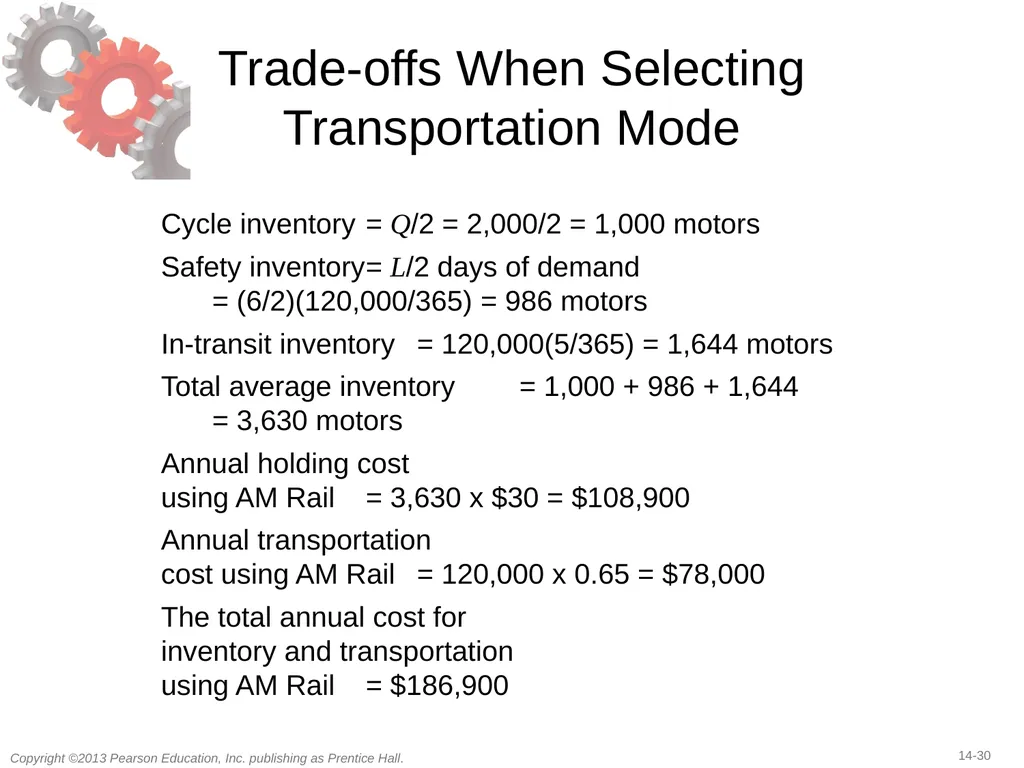
slide30. Trade-offs When Selecting Transportation Mode Cycle inventory = Q/2 = 2,000/2 = 1,000 motors
Safety inventory = L/2 days of demand = (6/2)(120,000/365) = 986 motors
In-transit inventory = 120,000(5/365) = 1,644 motors
Total average inventory = 1,000 + 986 + 1,644 = 3,630 motors
Annual holding cost using AM Rail = 3,630 x $30 = $108,900
Annual transportation cost using AM Rail = 120,000 x 0.65 = $78,000
The total annual cost for inventory and transportation using AM Rail = $186,900<br>
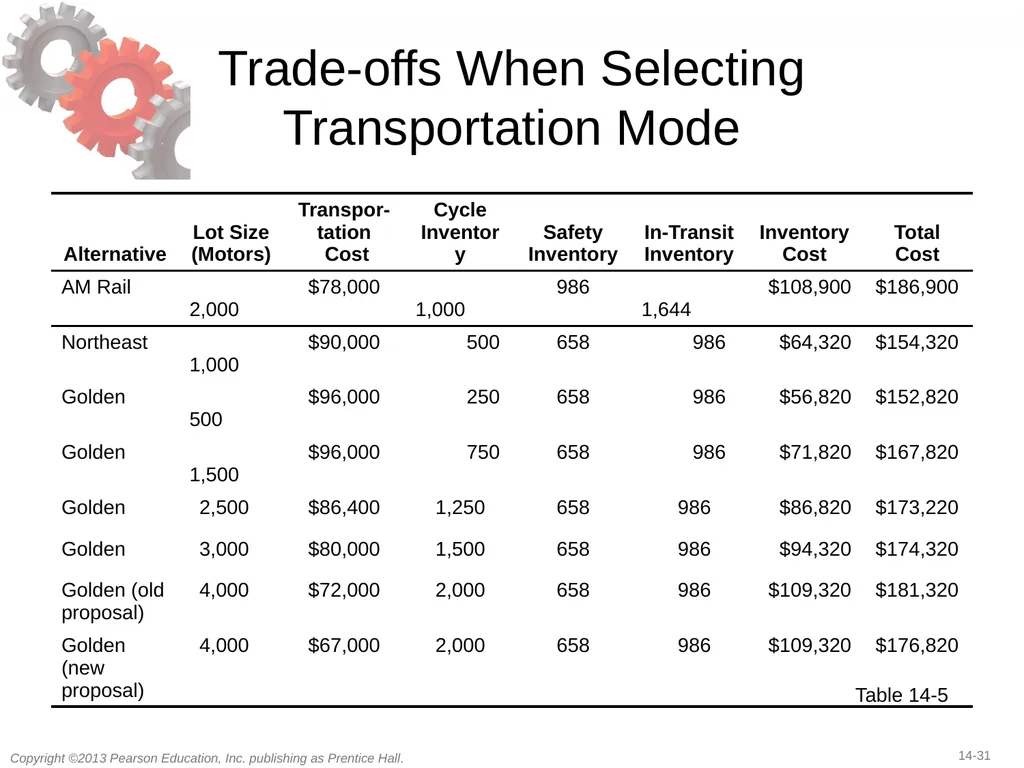
slide31. Trade-offs When Selecting Transportation Mode Table 14-5<br>
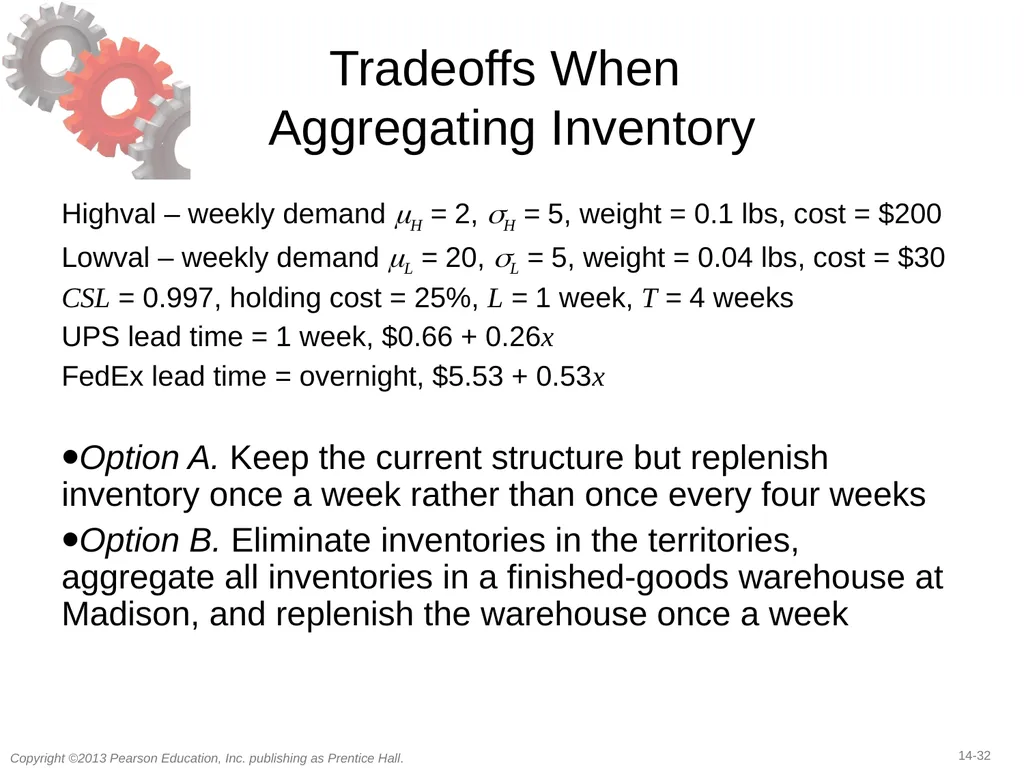
slide32. Tradeoffs When Aggregating Inventory Highval – weekly demand μH = 2, σH = 5, weight = 0.1 lbs, cost = $200
Lowval – weekly demand μL = 20, σL = 5, weight = 0.04 lbs, cost = $30
CSL = 0.997, holding cost = 25%, L = 1 week, T = 4 weeks
UPS lead time = 1 week, $0.66 + 0.26x
FedEx lead time = overnight, $5.53 + 0.53x
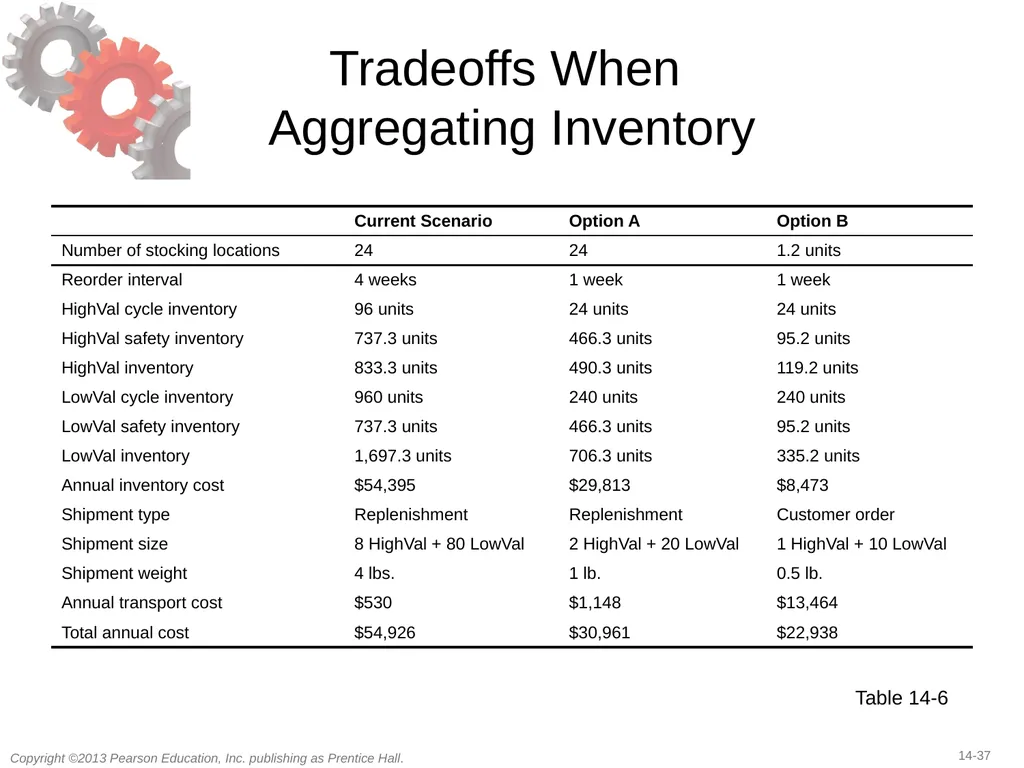
Option A. Keep the current structure but replenish inventory once a week rather than once every four weeks
Option B. Eliminate inventories in the territories, aggregate all inventories in a finished-goods warehouse at Madison, and replenish the warehouse once a week<br>
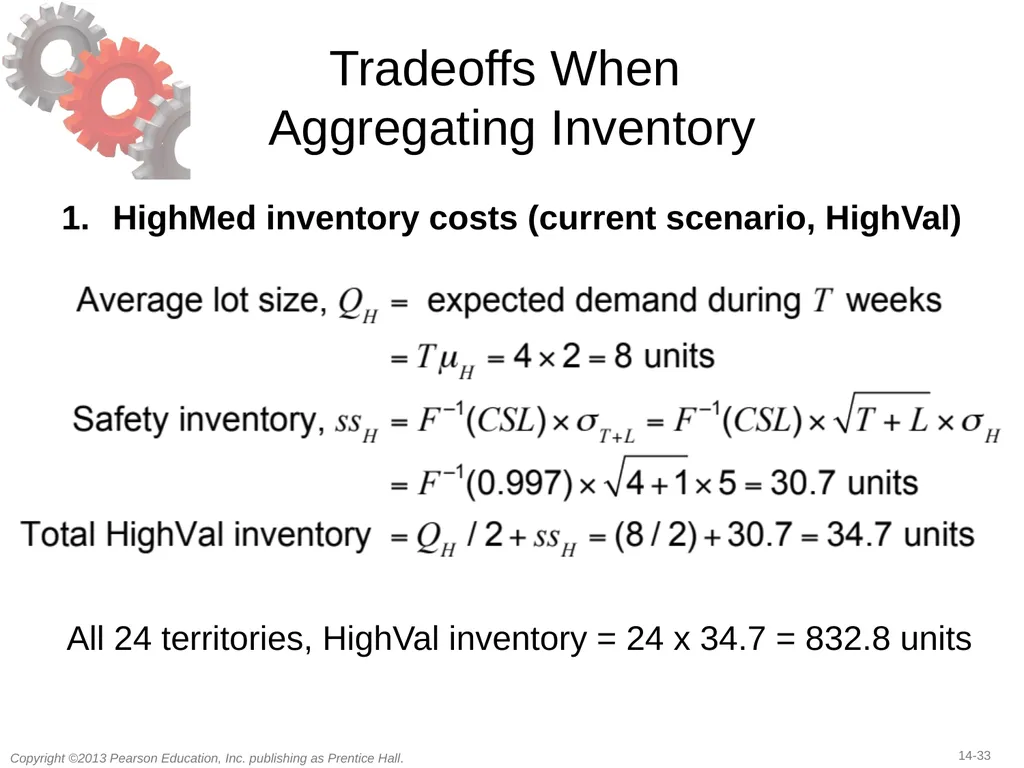
slide33. Tradeoffs When Aggregating Inventory HighMed inventory costs (current scenario, HighVal) All 24 territories, HighVal inventory = 24 x 34.7 = 832.8 units<br>
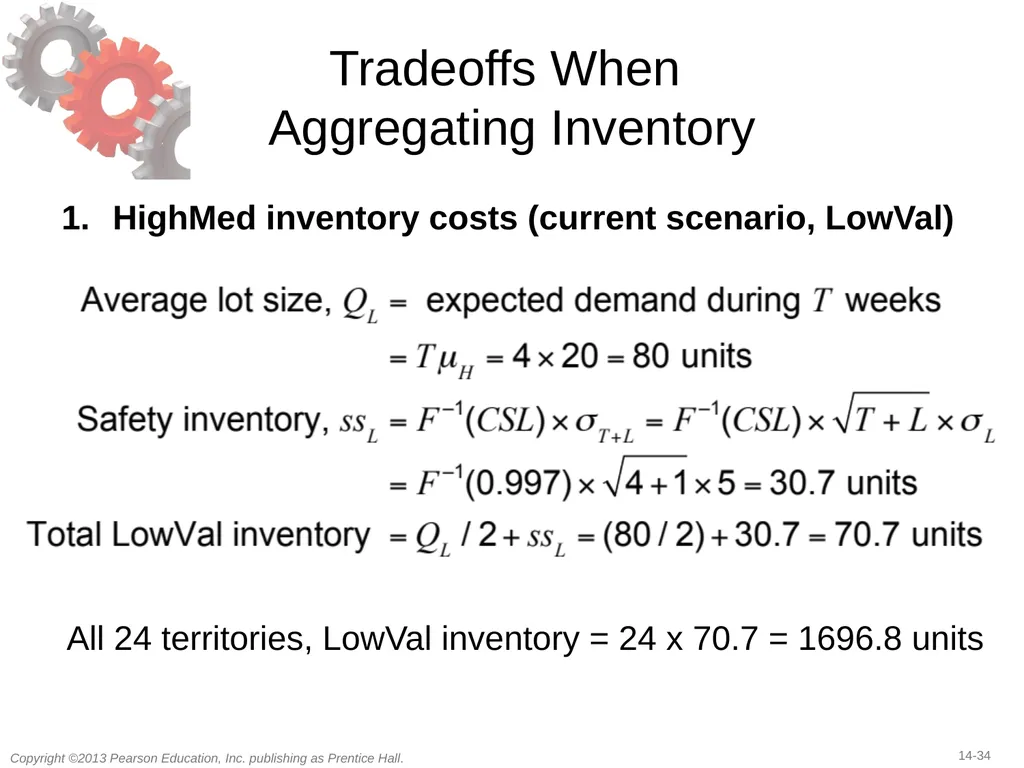
slide34. Tradeoffs When Aggregating Inventory HighMed inventory costs (current scenario, LowVal) All 24 territories, LowVal inventory = 24 x 70.7 = 1696.8 units<br>
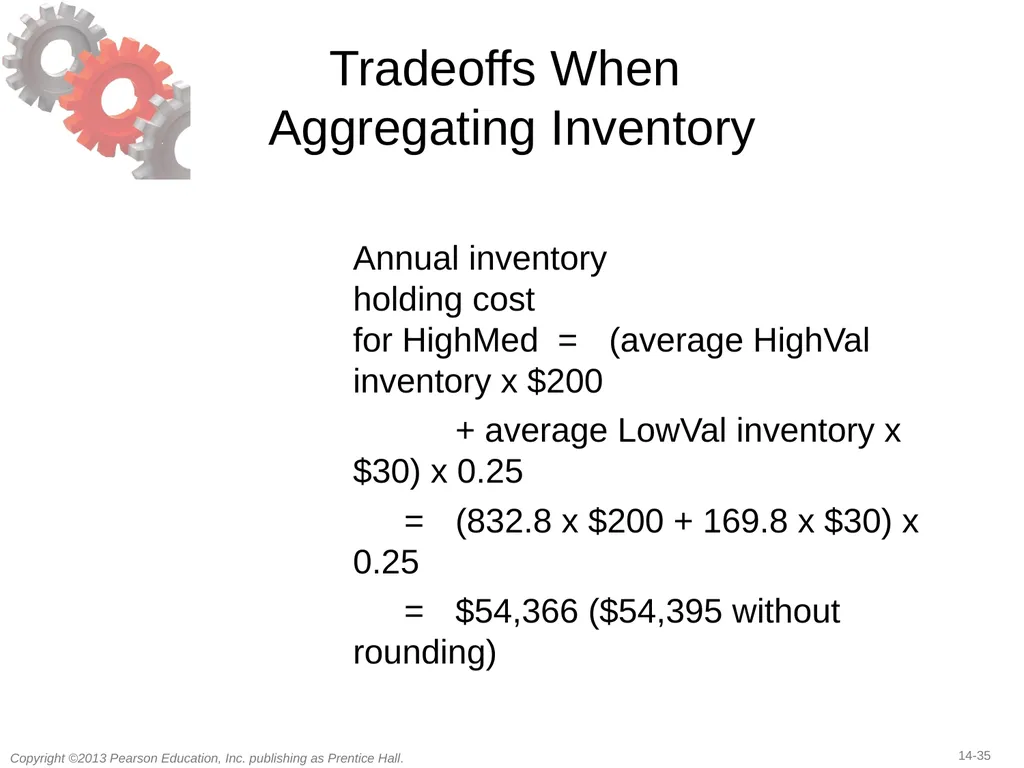
slide35. Tradeoffs When Aggregating Inventory Annual inventory
holding cost
for HighMed = (average HighVal inventory x $200
+ average LowVal inventory x $30) x 0.25
= (832.8 x $200 + 169.8 x $30) x 0.25
= $54,366 ($54,395 without rounding)<br>
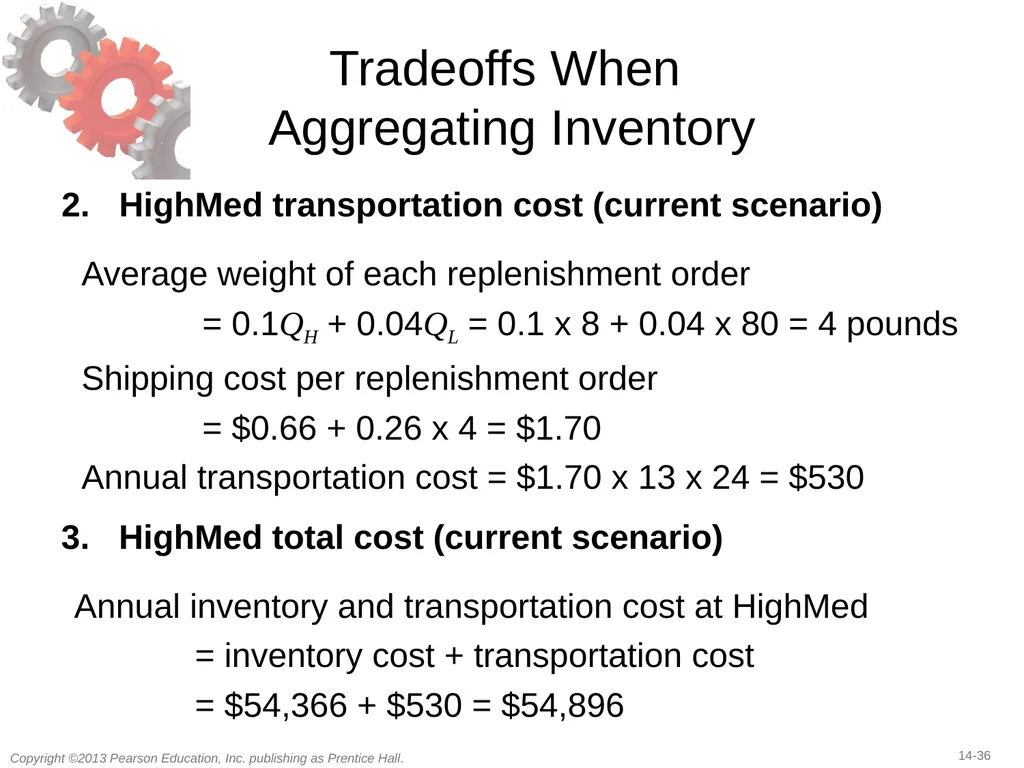
slide36. Tradeoffs When Aggregating Inventory HighMed transportation cost (current scenario) Average weight of each replenishment order
= 0.1QH + 0.04QL = 0.1 x 8 + 0.04 x 80 = 4 pounds
Shipping cost per replenishment order
= $0.66 + 0.26 x 4 = $1.70
Annual transportation cost = $1.70 x 13 x 24 = $530 HighMed total cost (current scenario) Annual inventory and transportation cost at HighMed
= inventory cost + transportation cost
= $54,366 + $530 = $54,896<br>
slide37. Tradeoffs When Aggregating Inventory Table 14-6<br>
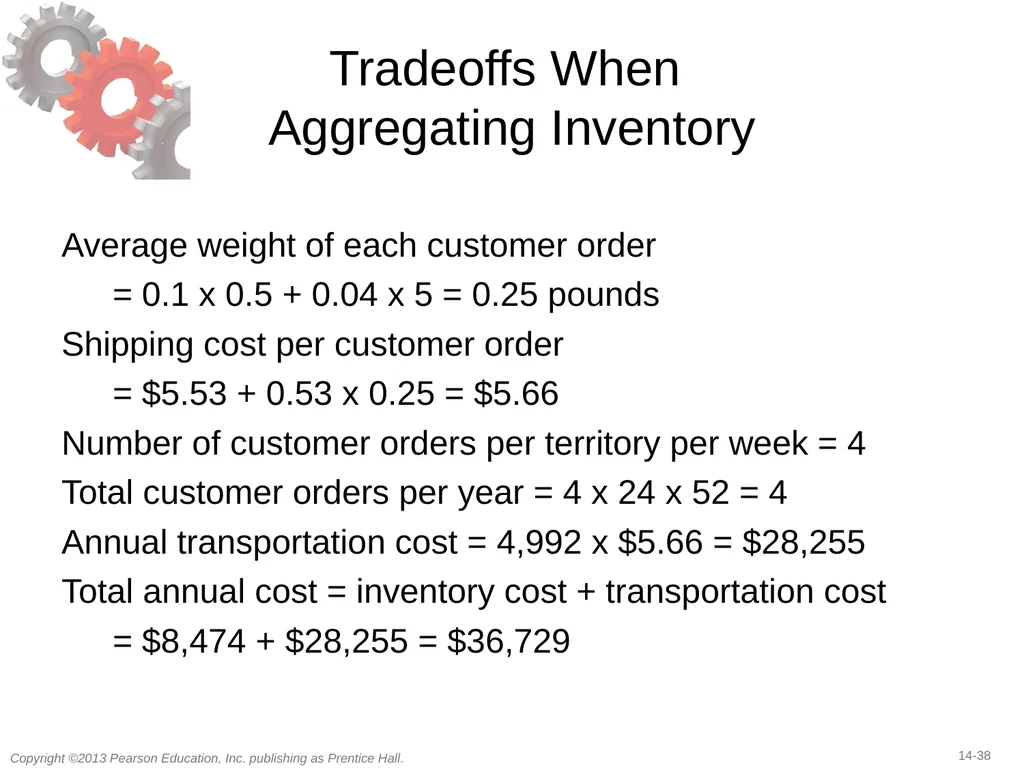
slide38. Tradeoffs When Aggregating Inventory Average weight of each customer order
= 0.1 x 0.5 + 0.04 x 5 = 0.25 pounds
Shipping cost per customer order
= $5.53 + 0.53 x 0.25 = $5.66
Number of customer orders per territory per week = 4
Total customer orders per year = 4 x 24 x 52 = 4
Annual transportation cost = 4,992 x $5.66 = $28,255
Total annual cost = inventory cost + transportation cost
= $8,474 + $28,255 = $36,729<br>
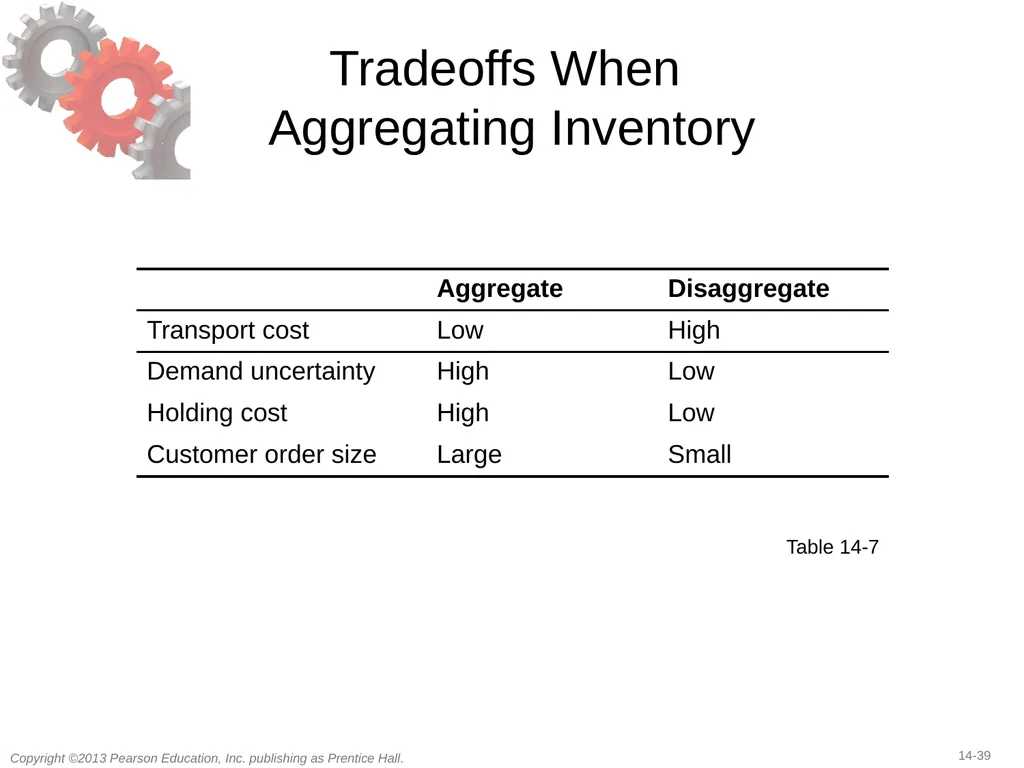
slide39. Tradeoffs When Aggregating Inventory Table 14-7<br>
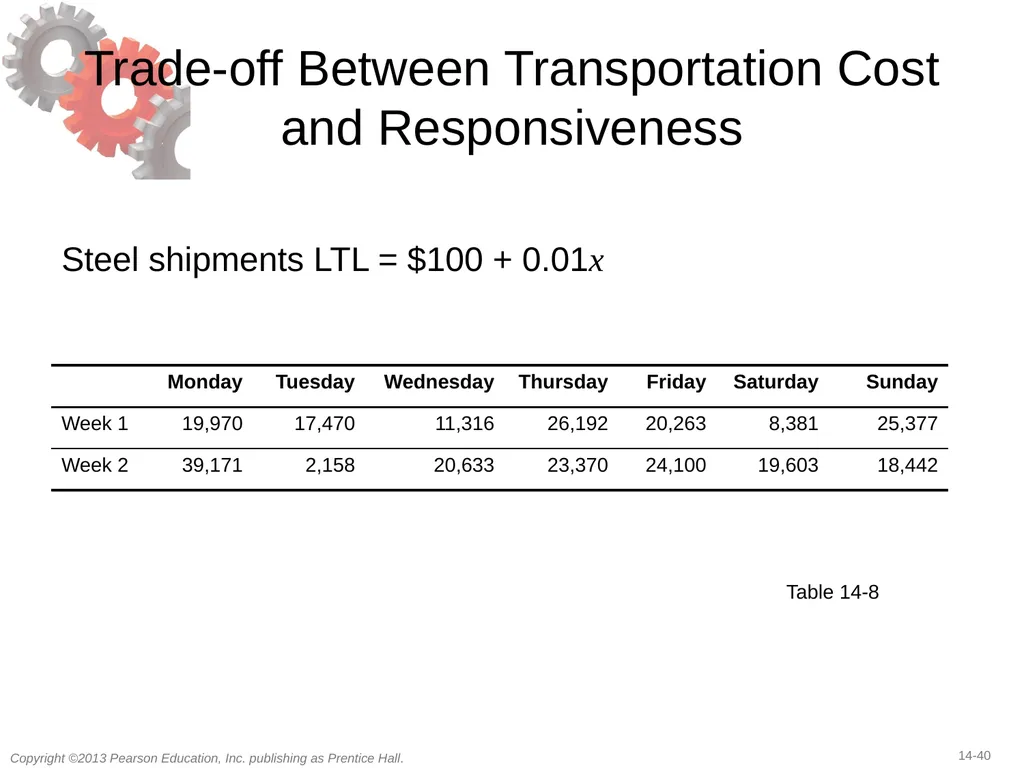
slide40. Trade-off Between Transportation Cost and Responsiveness Steel shipments LTL = $100 + 0.01x Table 14-8<br>
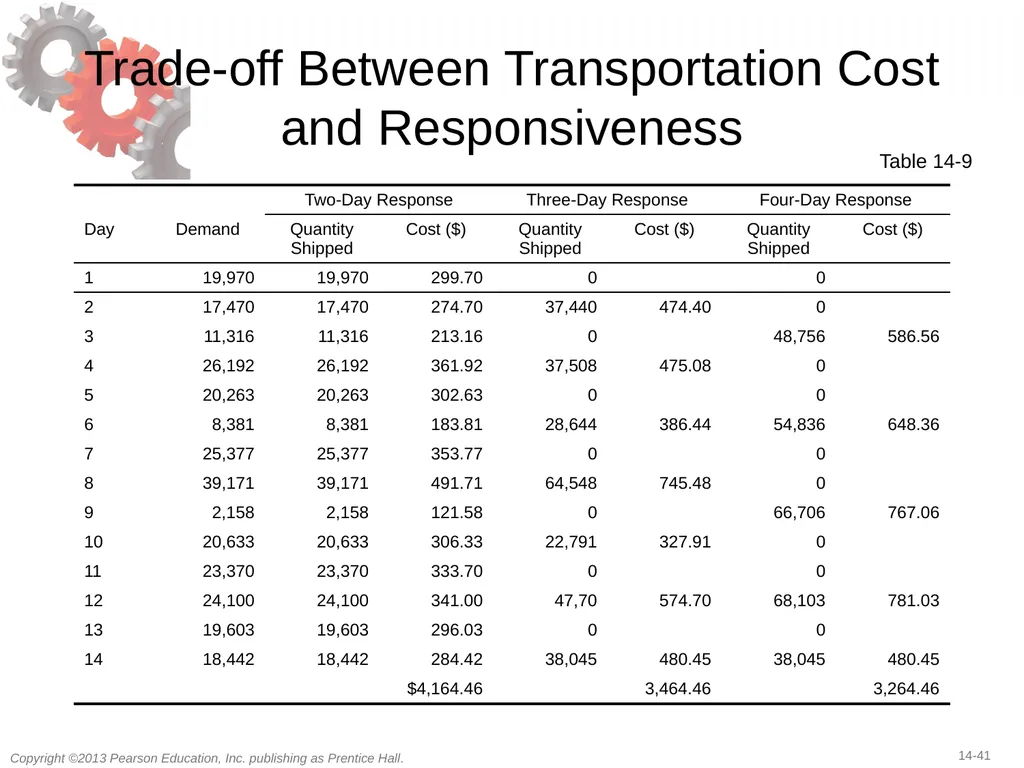
slide41. Trade-off Between Transportation Cost and Responsiveness Table 14-9<br>
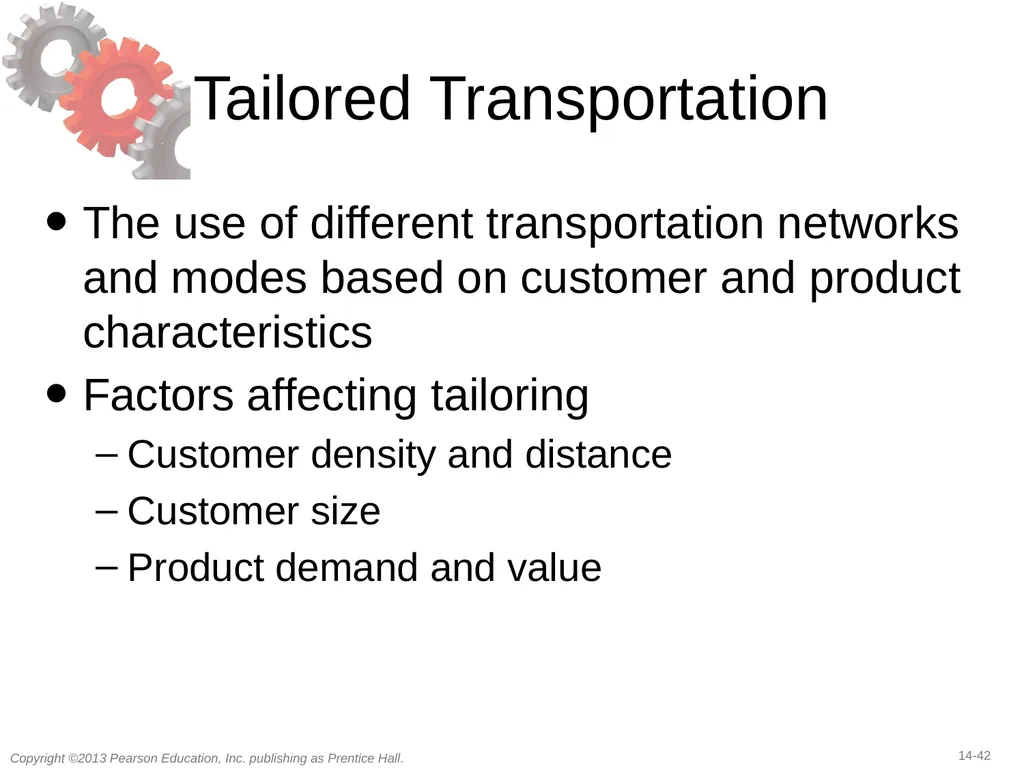
slide42. Tailored Transportation The use of different transportation networks and modes based on customer and product characteristics
Factors affecting tailoring
Customer density and distance
Customer size
Product demand and value<br>
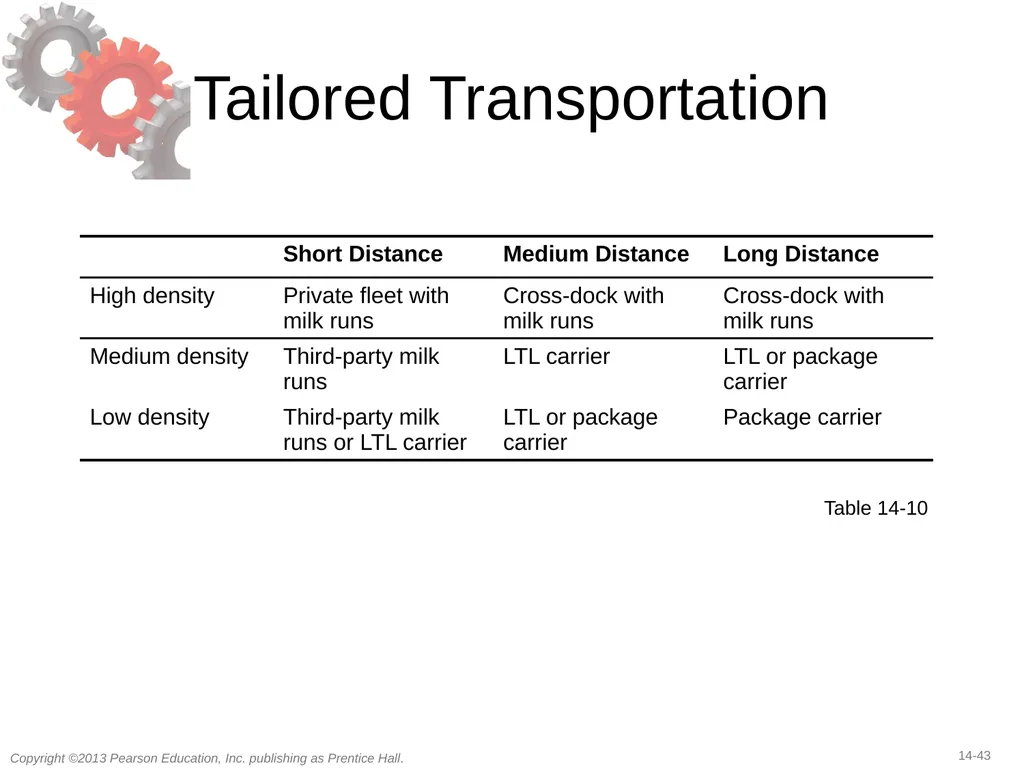
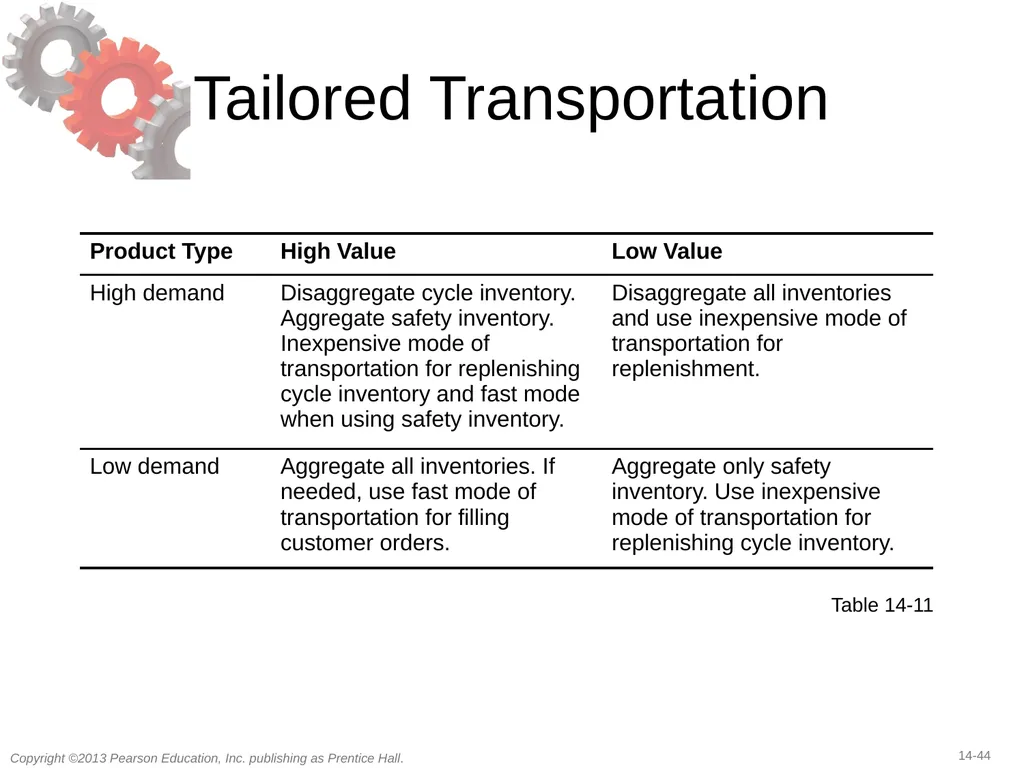
slide43. Tailored Transportation Table 14-10<br>
slide44. Tailored Transportation Table 14-11<br>
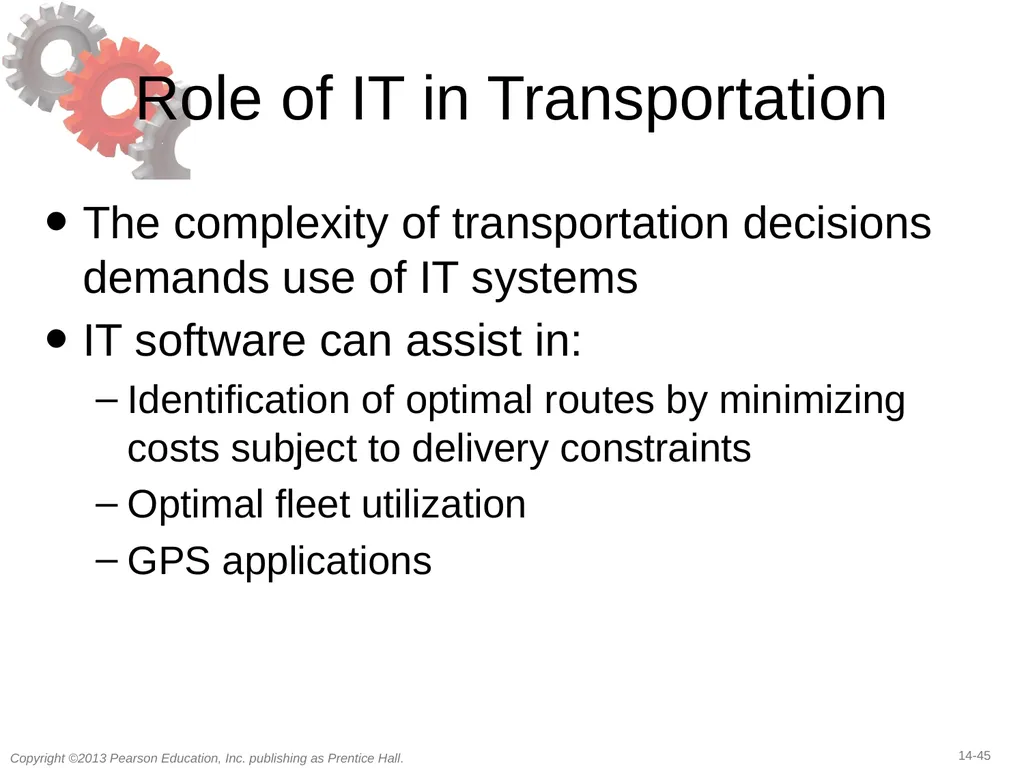
slide45. Role of IT in Transportation The complexity of transportation decisions demands use of IT systems
IT software can assist in:
Identification of optimal routes by minimizing costs subject to delivery constraints
Optimal fleet utilization
GPS applications<br>
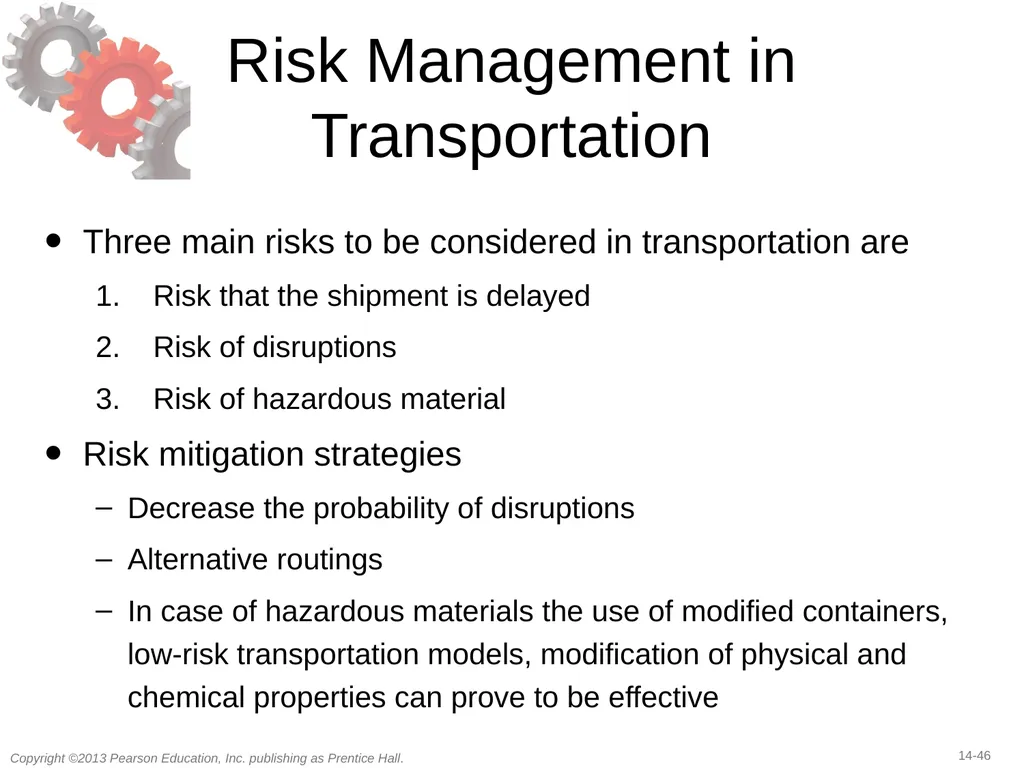
slide46. Risk Management in Transportation Three main risks to be considered in transportation are
Risk that the shipment is delayed
Risk of disruptions
Risk of hazardous material
Risk mitigation strategies
Decrease the probability of disruptions
Alternative routings
In case of hazardous materials the use of modified containers, low-risk transportation models, modification of physical and chemical properties can prove to be effective<br>
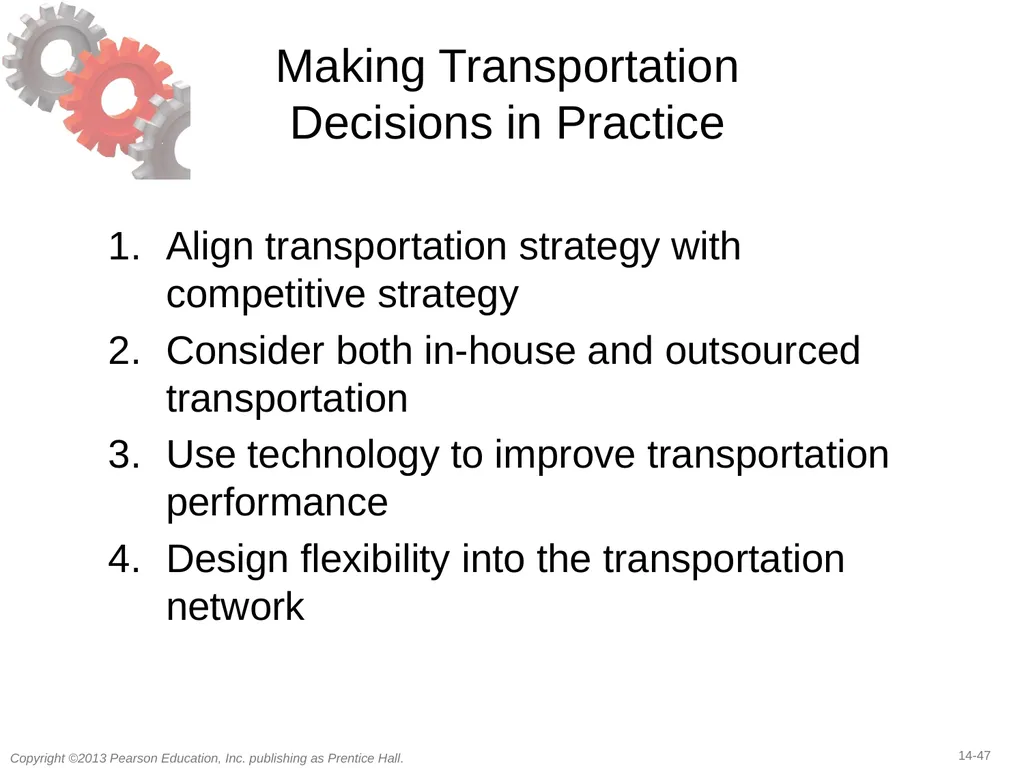
slide47. Making Transportation Decisions in Practice Align transportation strategy with competitive strategy
Consider both in-house and outsourced transportation
Use technology to improve transportation performance
Design flexibility into the transportation network<br>
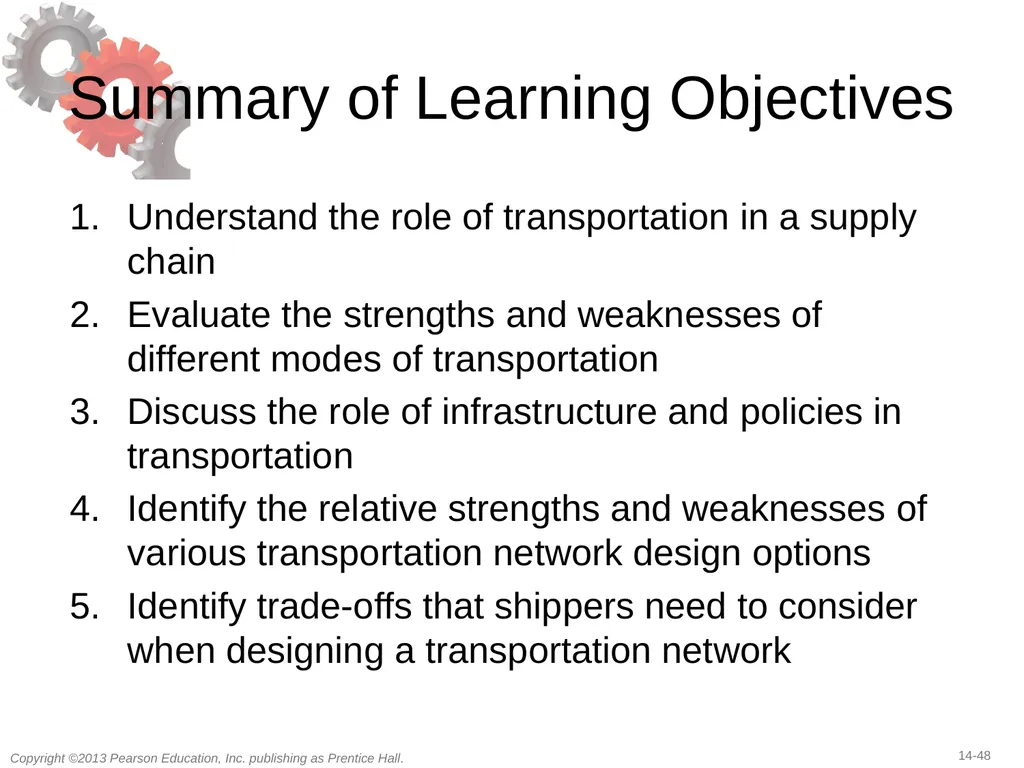
slide48. Summary of Learning Objectives Understand the role of transportation in a supply chain
Evaluate the strengths and weaknesses of different modes of transportation
Discuss the role of infrastructure and policies in transportation
Identify the relative strengths and weaknesses of various transportation network design options
Identify trade-offs that shippers need to consider when designing a transportation network<br>
slide49. All rights reserved. No part of this publication may be reproduced, stored in a retrieval system, or transmitted, in any form or by any means, electronic, mechanical, photocopying, recording, or otherwise, without the prior written permission of the publisher.
Printed in the United States of America.<br>
slide2. Learning Objectives Understand the role of transportation in a supply chain
Evaluate the strengths and weaknesses of different modes of transportation
Discuss the role of infrastructure and policies in transportation
Identify the relative strengths and weaknesses of various transportation network design options
Identify trade-offs that shippers need to consider when designing a transportation network<br>
slide3. The Role of Transportation in a Supply Chain Movement of product from one location to another
Products rarely produced and consumed in the same location
Significant cost component
Shipper requires the movement of the product
Carrier moves or transports the product<br>
slide4. Modes of Transportation and their Performance Characteristics Air
Package carriers
Truck
Rail
Water
Pipeline
Intermodal<br>
slide5. Modes of Transportation and their Performance Characteristics Table 14-1<br>
slide6. Air Cost components
Fixed infrastructure and equipment
Labor and fuel
Variable – passenger/cargo
Key issues
Location/number of hubs
Fleet assignment
Maintenance schedules
Crew scheduling
Prices and availability<br>
slide7. Package Carriers Small packages up to about 150 pounds
Expensive
Rapid and reliable delivery
Small and time-sensitive shipments
Provide other value-added services
Consolidation of shipments a key factor<br>
slide8. Truck Significant fraction of the goods moved
Truckload (TL)
Low fixed cost
Imbalance between flows
Less than truckload (LTL)
Small lots
Hub and spoke system
May take longer than TL<br>
slide9. Rail Move commodities over large distances
High fixed costs in equipment and facilities
Scheduled to maximize utilization
Transportation time can be long
Trains ‘built’ not scheduled<br>
slide10. Water Limited to certain geographic areas
Ocean, inland waterway system, coastal waters
Very large loads at very low cost
Slowest
Dominant in global trade
Containers<br>
slide11. Pipeline High fixed cost
Primarily for crude petroleum, refined petroleum products, natural gas
Best for large and stable flows
Pricing structure encourages use for predicable component of demand<br>
slide12. Intermodal Use of more than one mode of transportation to move a shipment
Grown considerably with increased use of containers
May be the only option for global trade
More convenient for shippers – one entity
Key issue – exchange of information to facilitate transfer between different modes<br>
slide13. Transportation Infrastructure and Policies Governments generally take full responsibility or played a significant role in building and managing infrastructure elements
Without a monopoly, deregulation and market forces help create an effective industry structure
Pricing should reflect the marginal impact on the cost to society<br>
slide14. Transportation Infrastructure and Policies Figure 14-1<br>
slide15. Design Options for a Transportation Network When designing a transportation network
Should transportation be direct or through an intermediate site?
Should the intermediate site stock product or only serve as a cross-docking location?
Should each delivery route supply a single destination or multiple destinations (milk run)?<br>
slide16. Direct Shipment Network to Single Destination Figure 14-2<br>
slide17. Direct Shipping with Milk Runs Figure 14-3<br>
slide18. All Shipments via Intermediate Distribution Center with Storage Figure 14-4<br>
slide19. All Shipments via Intermediate Transit Point with Cross-Docking Suppliers send their shipments to an intermediate transit point
They are cross-docked and sent to buyer locations without storing them<br>
slide20. Shipping via DC Using Milk Runs Figure 14-5<br>
slide21. Tailored Network Table 14-2<br>
slide22. Selecting a Transportation Network Eight stores, four supply sources
Truck capacity = 40,000 units
Cost $1,000 per load, $100 per delivery
Holding cost = $0.20/year<br>
slide23. Selecting a Transportation Network Annual sales = 960,000/store Direct shipping
Batch size shipped from each supplier to each store = 40,000 units
Number of shipments/yr from each supplier to each store = 960,000/40,000 = 24
Annual trucking cost for direct network = 24 x 1,100 x 4 x 8 = $844,800
Average inventory at each store for each product = 40,000/2 = 20,000 units
Annual inventory cost for direct network = 20,000 x 0.2 x 4 x 8 = $128,000
Total annual cost of direct network = $844,800 + $128,000 = $972,800<br>
slide24. Selecting a Transportation Network Annual sales = 960,000/store Milk runs
Batch size shipped from each supplier to each store = 40,000/2 = 20,000 units
Number of shipments/yr from each supplier to each store = 960,000/20,000 = 48
Transportation cost per shipment per store (two stores/truck) = 1,000/2 + 100 = $600
Annual trucking cost for direct network = 48 x 600 x 4 x 8 = $921,600
Average inventory at each store for each product = 20,000/2 = 10,000 units
Annual inventory cost for direct network = 10,000 x 0.2 x 4 x 8 = $64,000
Total annual cost of direct network = $921,600 + $64,000 = $985,600<br>
slide25. Selecting a Transportation Network Annual sales = 120,000/store Direct shipping
Batch size shipped from each supplier to each store = 40,000 units
Number of shipments/yr from each supplier to each store = 120,000/40,000 = 3
Annual trucking cost for direct network = 3 x 1,100 x 4 x 8 = $105,600
Average inventory at each store for each product = 40,000/2 = 20,000 units
Annual inventory cost for direct network = 20,000 x 0.2 x 4 x 8 = $128,000
Total annual cost of direct network = $105,600 + $128,000 = $233,600<br>
slide26. Selecting a Transportation Network Annual sales = 120,000/store Milk runs
Batch size shipped from each supplier to each store = 40,000/4 = 10,000 units
Number of shipments/yr from each supplier to each store = 120,000/10,000 = 12
Transportation cost per shipment per store (two stores/truck) = 1,000/4 + 100 = $350
Annual trucking cost for direct network = 12 x 350 x 4 x 8 = $134,400
Average inventory at each store for each product = 10,000/2 = 5,000 units
Annual inventory cost for direct network = 5,000 x 0.2 x 4 x 8 = $32,000
Total annual cost of direct network = $134,400 + $32,000 = $166,400<br>
slide27. Trade-offs in Transportation Design Transportation and inventory cost trade-off
Choice of transportation mode
Inventory aggregation
Transportation cost and responsiveness trade-off<br>
slide28. Trade-offs in Transportation Design Table 14-3<br>
slide29. Trade-offs When Selecting Transportation Mode Demand = 120,000 motors, Cost = $120/motor,
Weight = 10 lbs/motor, Lot size = 3,000,
Safety stock = 50% ddlt Table 14-4<br>
slide30. Trade-offs When Selecting Transportation Mode Cycle inventory = Q/2 = 2,000/2 = 1,000 motors
Safety inventory = L/2 days of demand = (6/2)(120,000/365) = 986 motors
In-transit inventory = 120,000(5/365) = 1,644 motors
Total average inventory = 1,000 + 986 + 1,644 = 3,630 motors
Annual holding cost using AM Rail = 3,630 x $30 = $108,900
Annual transportation cost using AM Rail = 120,000 x 0.65 = $78,000
The total annual cost for inventory and transportation using AM Rail = $186,900<br>
slide31. Trade-offs When Selecting Transportation Mode Table 14-5<br>
slide32. Tradeoffs When Aggregating Inventory Highval – weekly demand μH = 2, σH = 5, weight = 0.1 lbs, cost = $200
Lowval – weekly demand μL = 20, σL = 5, weight = 0.04 lbs, cost = $30
CSL = 0.997, holding cost = 25%, L = 1 week, T = 4 weeks
UPS lead time = 1 week, $0.66 + 0.26x
FedEx lead time = overnight, $5.53 + 0.53x
Option A. Keep the current structure but replenish inventory once a week rather than once every four weeks
Option B. Eliminate inventories in the territories, aggregate all inventories in a finished-goods warehouse at Madison, and replenish the warehouse once a week<br>
slide33. Tradeoffs When Aggregating Inventory HighMed inventory costs (current scenario, HighVal) All 24 territories, HighVal inventory = 24 x 34.7 = 832.8 units<br>
slide34. Tradeoffs When Aggregating Inventory HighMed inventory costs (current scenario, LowVal) All 24 territories, LowVal inventory = 24 x 70.7 = 1696.8 units<br>
slide35. Tradeoffs When Aggregating Inventory Annual inventory
holding cost
for HighMed = (average HighVal inventory x $200
+ average LowVal inventory x $30) x 0.25
= (832.8 x $200 + 169.8 x $30) x 0.25
= $54,366 ($54,395 without rounding)<br>
slide36. Tradeoffs When Aggregating Inventory HighMed transportation cost (current scenario) Average weight of each replenishment order
= 0.1QH + 0.04QL = 0.1 x 8 + 0.04 x 80 = 4 pounds
Shipping cost per replenishment order
= $0.66 + 0.26 x 4 = $1.70
Annual transportation cost = $1.70 x 13 x 24 = $530 HighMed total cost (current scenario) Annual inventory and transportation cost at HighMed
= inventory cost + transportation cost
= $54,366 + $530 = $54,896<br>
slide37. Tradeoffs When Aggregating Inventory Table 14-6<br>
slide38. Tradeoffs When Aggregating Inventory Average weight of each customer order
= 0.1 x 0.5 + 0.04 x 5 = 0.25 pounds
Shipping cost per customer order
= $5.53 + 0.53 x 0.25 = $5.66
Number of customer orders per territory per week = 4
Total customer orders per year = 4 x 24 x 52 = 4
Annual transportation cost = 4,992 x $5.66 = $28,255
Total annual cost = inventory cost + transportation cost
= $8,474 + $28,255 = $36,729<br>
slide39. Tradeoffs When Aggregating Inventory Table 14-7<br>
slide40. Trade-off Between Transportation Cost and Responsiveness Steel shipments LTL = $100 + 0.01x Table 14-8<br>
slide41. Trade-off Between Transportation Cost and Responsiveness Table 14-9<br>
slide42. Tailored Transportation The use of different transportation networks and modes based on customer and product characteristics
Factors affecting tailoring
Customer density and distance
Customer size
Product demand and value<br>
slide43. Tailored Transportation Table 14-10<br>
slide44. Tailored Transportation Table 14-11<br>
slide45. Role of IT in Transportation The complexity of transportation decisions demands use of IT systems
IT software can assist in:
Identification of optimal routes by minimizing costs subject to delivery constraints
Optimal fleet utilization
GPS applications<br>
slide46. Risk Management in Transportation Three main risks to be considered in transportation are
Risk that the shipment is delayed
Risk of disruptions
Risk of hazardous material
Risk mitigation strategies
Decrease the probability of disruptions
Alternative routings
In case of hazardous materials the use of modified containers, low-risk transportation models, modification of physical and chemical properties can prove to be effective<br>
slide47. Making Transportation Decisions in Practice Align transportation strategy with competitive strategy
Consider both in-house and outsourced transportation
Use technology to improve transportation performance
Design flexibility into the transportation network<br>
slide48. Summary of Learning Objectives Understand the role of transportation in a supply chain
Evaluate the strengths and weaknesses of different modes of transportation
Discuss the role of infrastructure and policies in transportation
Identify the relative strengths and weaknesses of various transportation network design options
Identify trade-offs that shippers need to consider when designing a transportation network<br>
slide49. All rights reserved. No part of this publication may be reproduced, stored in a retrieval system, or transmitted, in any form or by any means, electronic, mechanical, photocopying, recording, or otherwise, without the prior written permission of the publisher.
Printed in the United States of America.<br>