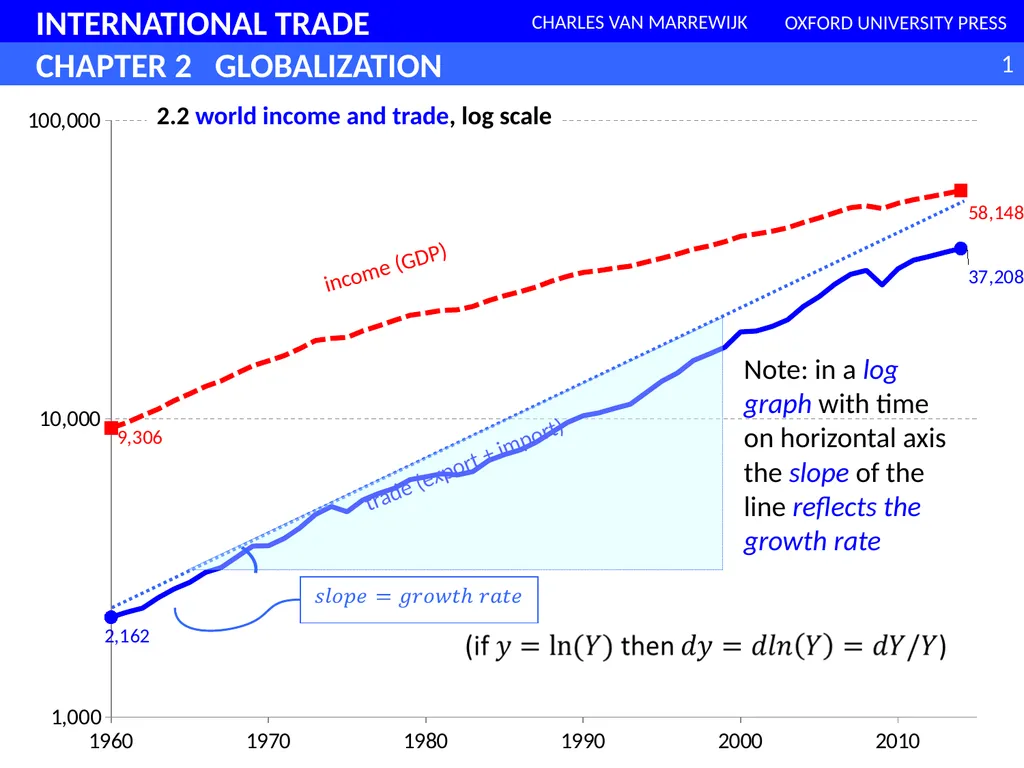
2.2 world income and trade, log scale income (GDP)
Author: calandra-battersby | Published: 2025-05-28
Description: 2.2 world income and trade, log scale income (GDP) trade (export import) Note: in a log graph with time on horizontal axis the slope of the line reflects the growth rate 2.3b world trade and income growth; 5-year moving average,
Download Presentation
Download the PPT/PDF: Download
Transcript:
Loading transcript�