
© 2013 Cengage Learning. All Rights Reserved. May


Description: 2013 Cengage Learning. All Rights Reserved. May not be scanned, copied, duplicated, or posted to a publicly accessible website, in whole or in part. Chapter 15: Capital Budgeting 2013 Cengage Learning. All Rights Reserved. May not be
Related Topics
Download Presentation
"© 2013 Cengage Learning. All Rights Reserved. May" is the property of its rightful owner. Permission is granted to download and print the materials on this website for personal, non-commercial use only, and to display it on your personal computer provided you do not modify the materials and that you retain all copyright notices contained in the materials. By downloading content from our website, you accept the terms of this agreement.
Presentation Transcript
slide1. © 2013 Cengage Learning. All Rights Reserved. May not be scanned, copied, duplicated, or posted to a publicly accessible website, in whole or in part. Chapter 15:
Capital Budgeting<br>
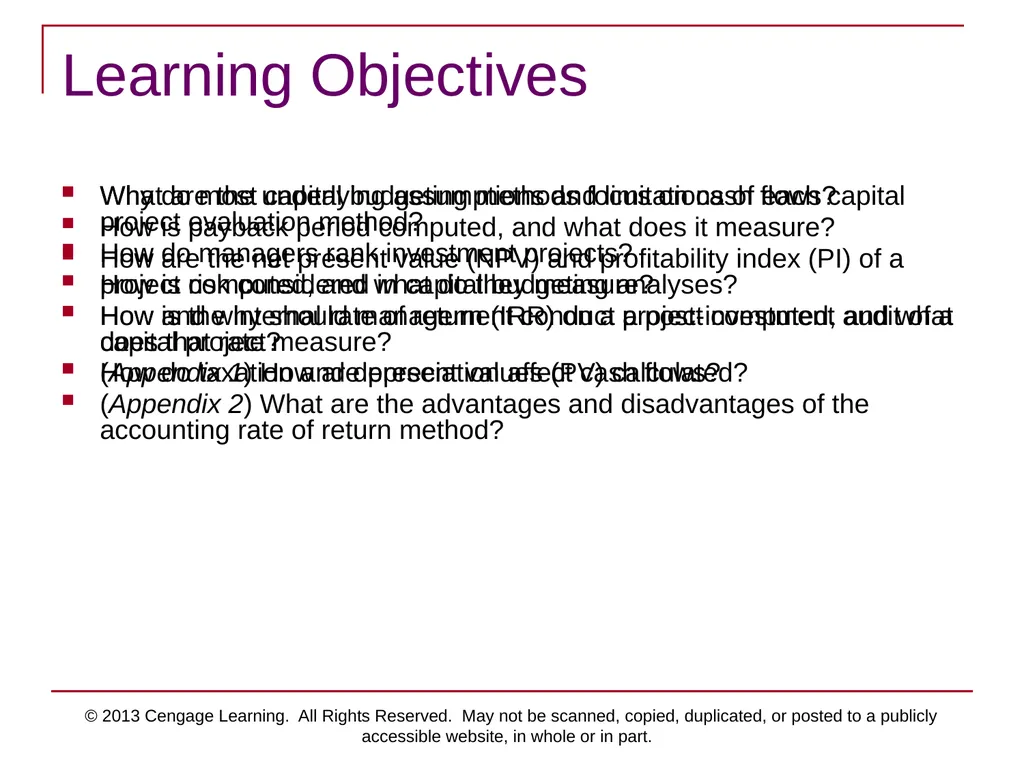
slide2. © 2013 Cengage Learning. All Rights Reserved. May not be scanned, copied, duplicated, or posted to a publicly accessible website, in whole or in part. Learning Objectives Why do most capital budgeting methods focus on cash flows?
How is payback period computed, and what does it measure?
How are the net present value (NPV) and profitability index (PI) of a project computed, and what do they measure?
How is the internal rate of return (IRR) on a project computed, and what does that rate measure?
How do taxation and depreciation affect cash flows? What are the underlying assumptions and limitations of each capital project evaluation method?
How do managers rank investment projects?
How is risk considered in capital budgeting analyses?
How and why should management conduct a post-investment audit of a capital project?
(Appendix 1) How are present values (PV) calculated?
(Appendix 2) What are the advantages and disadvantages of the accounting rate of return method?<br>
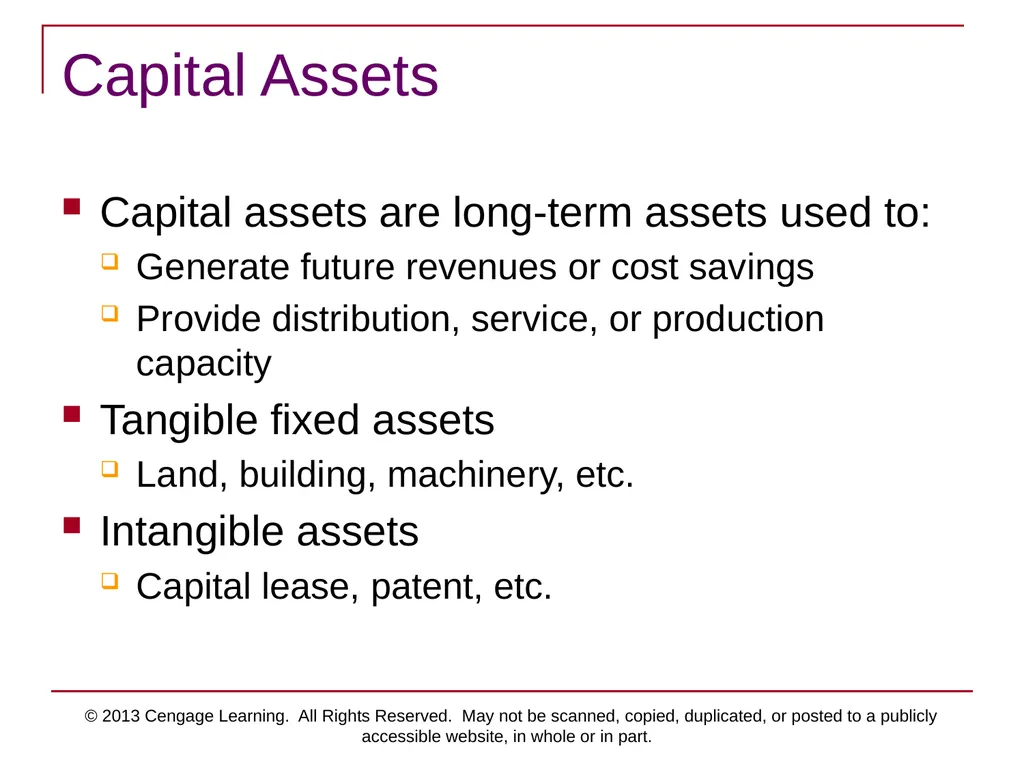
slide3. © 2013 Cengage Learning. All Rights Reserved. May not be scanned, copied, duplicated, or posted to a publicly accessible website, in whole or in part. Capital Assets Capital assets are long-term assets used to:
Generate future revenues or cost savings
Provide distribution, service, or production capacity
Tangible fixed assets
Land, building, machinery, etc.
Intangible assets
Capital lease, patent, etc.<br>
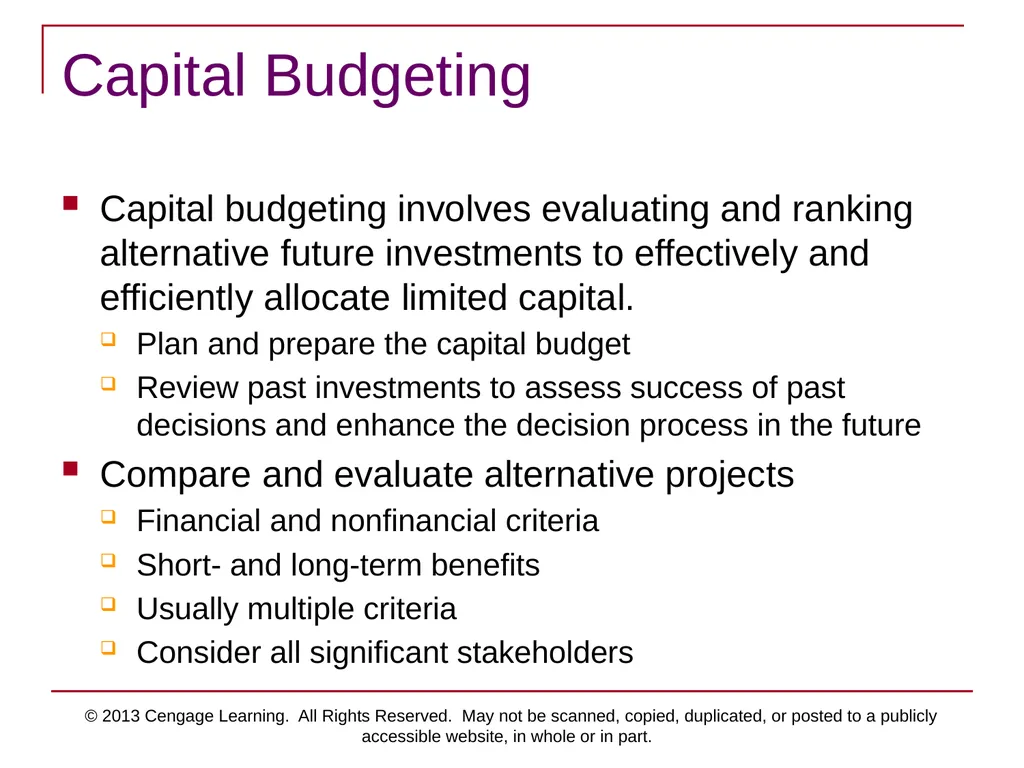
slide4. © 2013 Cengage Learning. All Rights Reserved. May not be scanned, copied, duplicated, or posted to a publicly accessible website, in whole or in part. Capital Budgeting Capital budgeting involves evaluating and ranking alternative future investments to effectively and efficiently allocate limited capital.
Plan and prepare the capital budget
Review past investments to assess success of past decisions and enhance the decision process in the future
Compare and evaluate alternative projects
Financial and nonfinancial criteria
Short- and long-term benefits
Usually multiple criteria
Consider all significant stakeholders<br>
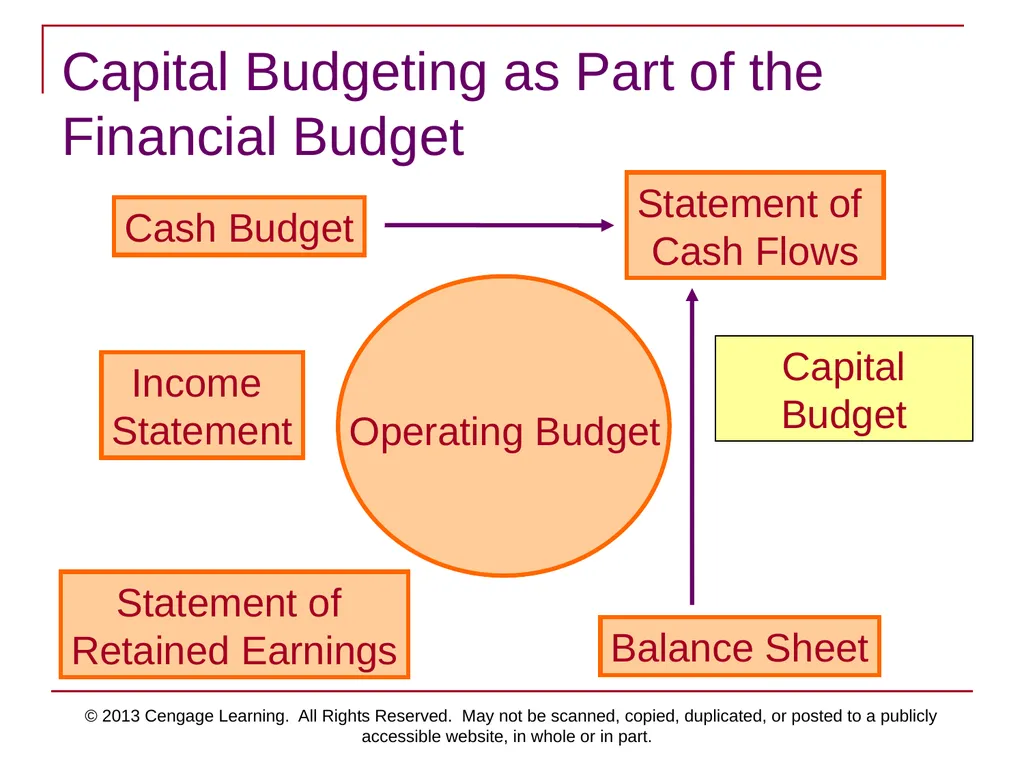
slide5. © 2013 Cengage Learning. All Rights Reserved. May not be scanned, copied, duplicated, or posted to a publicly accessible website, in whole or in part. Capital Budgeting as Part of the Financial Budget Operating Budget Cash Budget Capital Budget Income
Statement Statement of
Retained Earnings Balance Sheet Statement of
Cash Flows<br>
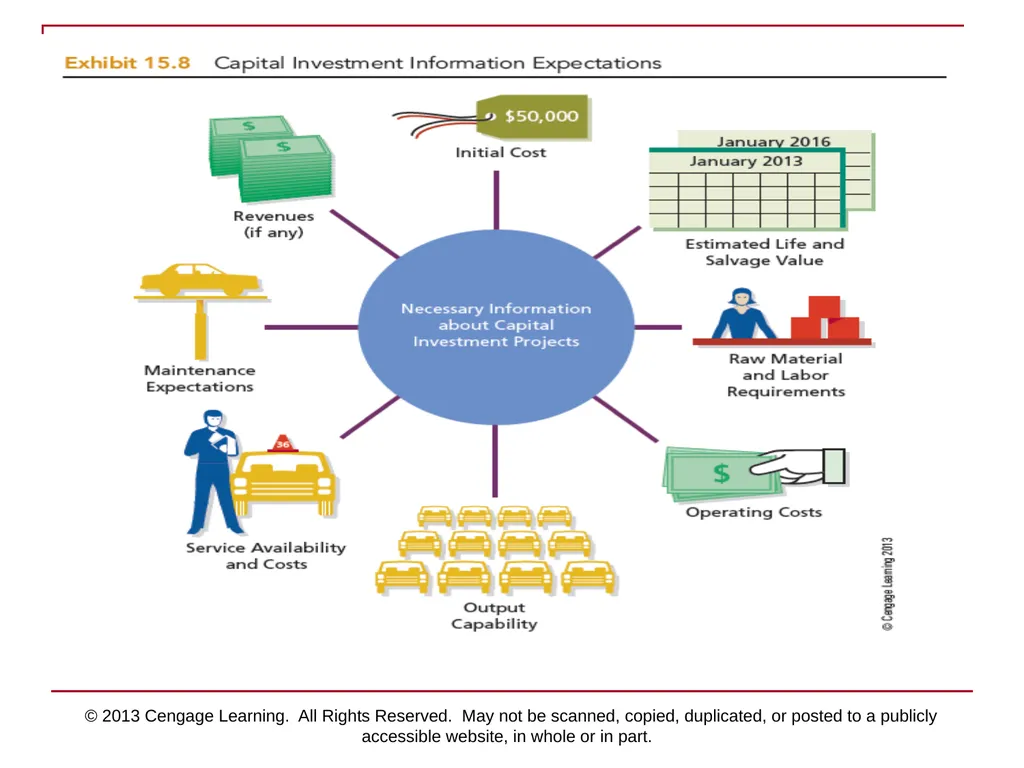
slide6. © 2013 Cengage Learning. All Rights Reserved. May not be scanned, copied, duplicated, or posted to a publicly accessible website, in whole or in part.<br>
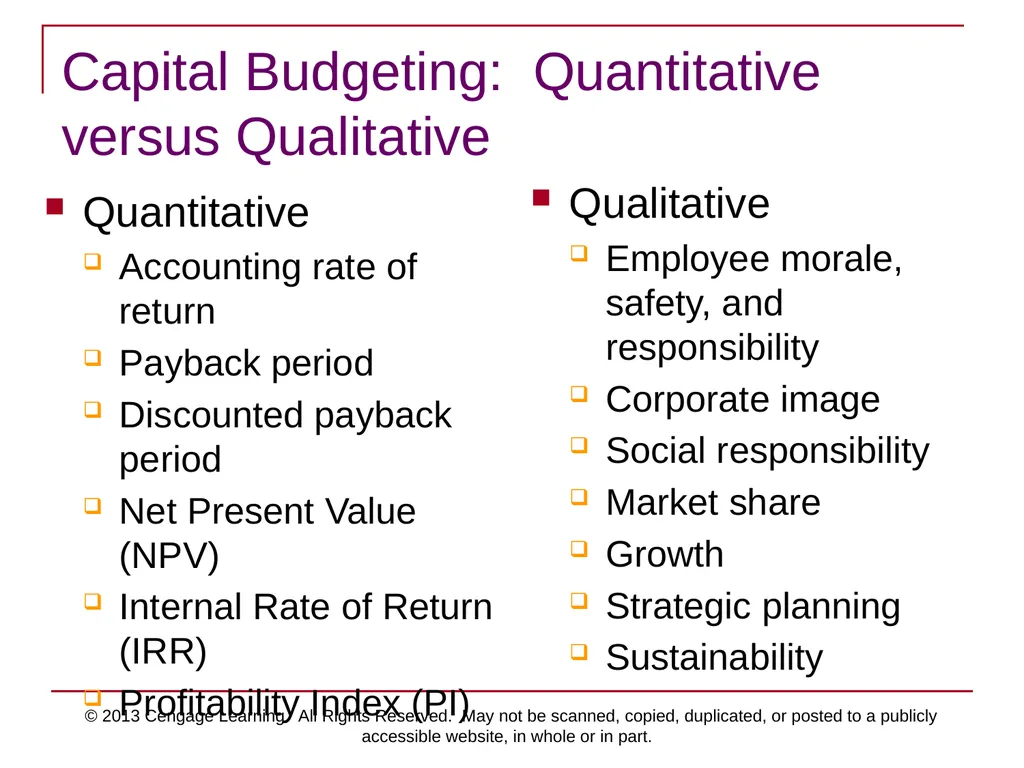
slide7. © 2013 Cengage Learning. All Rights Reserved. May not be scanned, copied, duplicated, or posted to a publicly accessible website, in whole or in part. Capital Budgeting: Quantitative versus Qualitative Quantitative
Accounting rate of return
Payback period
Discounted payback period
Net Present Value (NPV)
Internal Rate of Return (IRR)
Profitability Index (PI) Qualitative
Employee morale, safety, and responsibility
Corporate image
Social responsibility
Market share
Growth
Strategic planning
Sustainability<br>
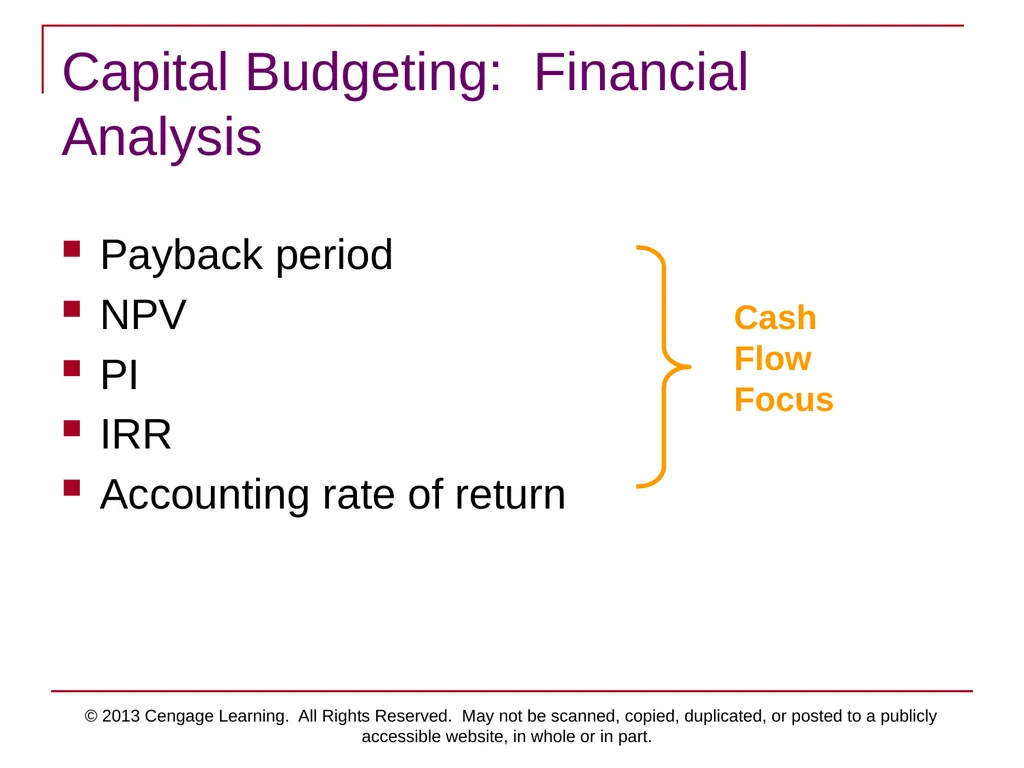
slide8. © 2013 Cengage Learning. All Rights Reserved. May not be scanned, copied, duplicated, or posted to a publicly accessible website, in whole or in part. Capital Budgeting: Financial Analysis Payback period
NPV
PI
IRR
Accounting rate of return<br>
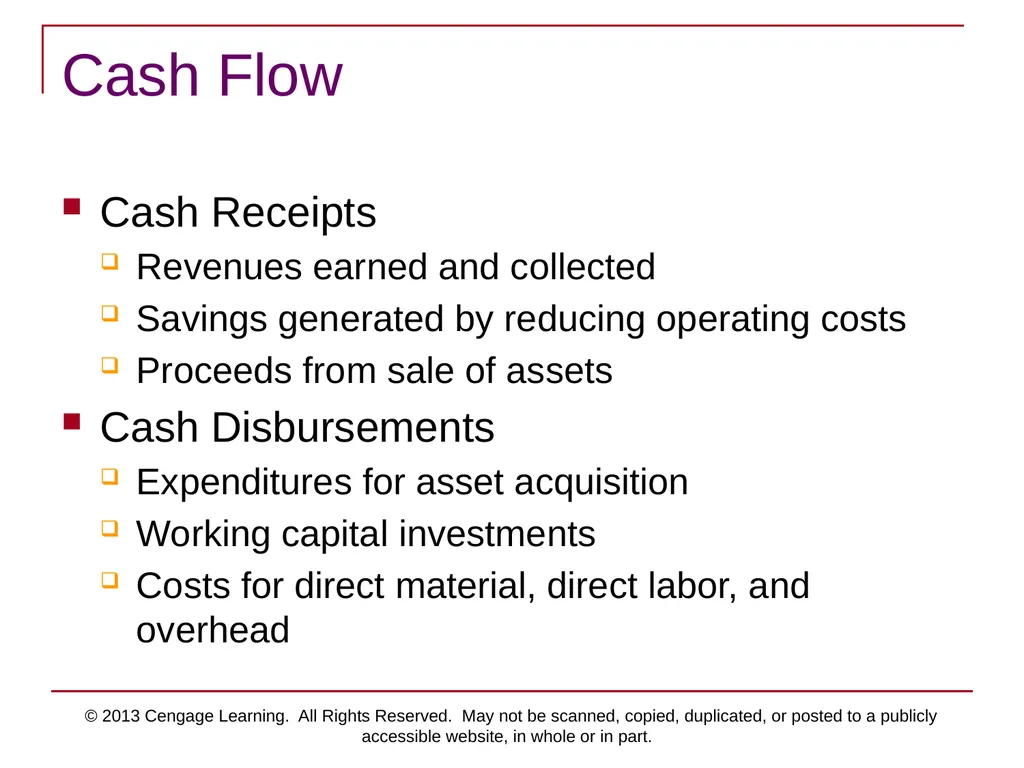
slide9. © 2013 Cengage Learning. All Rights Reserved. May not be scanned, copied, duplicated, or posted to a publicly accessible website, in whole or in part. Cash Flow Cash Receipts
Revenues earned and collected
Savings generated by reducing operating costs
Proceeds from sale of assets
Cash Disbursements
Expenditures for asset acquisition
Working capital investments
Costs for direct material, direct labor, and overhead<br>
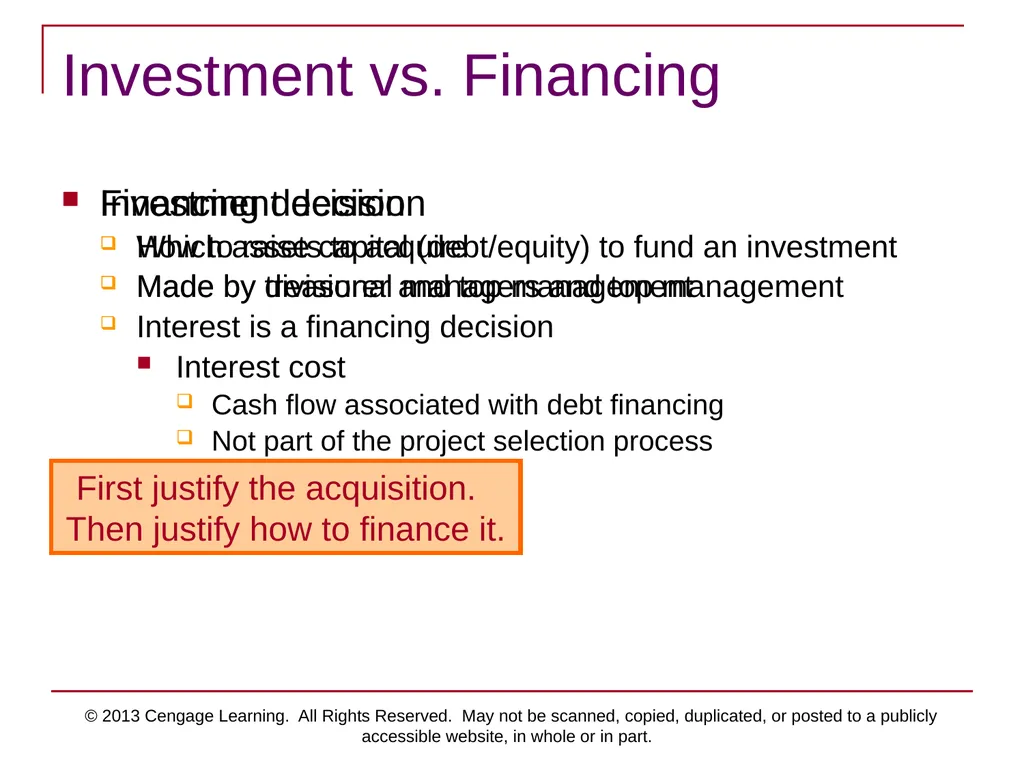
slide10. © 2013 Cengage Learning. All Rights Reserved. May not be scanned, copied, duplicated, or posted to a publicly accessible website, in whole or in part. Investment vs. Financing Investment decision
Which assets to acquire
Made by divisional managers and top management Financing decision
How to raise capital (debt/equity) to fund an investment
Made by treasurer and top management
Interest is a financing decision
Interest cost
Cash flow associated with debt financing
Not part of the project selection process First justify the acquisition.
Then justify how to finance it.<br>
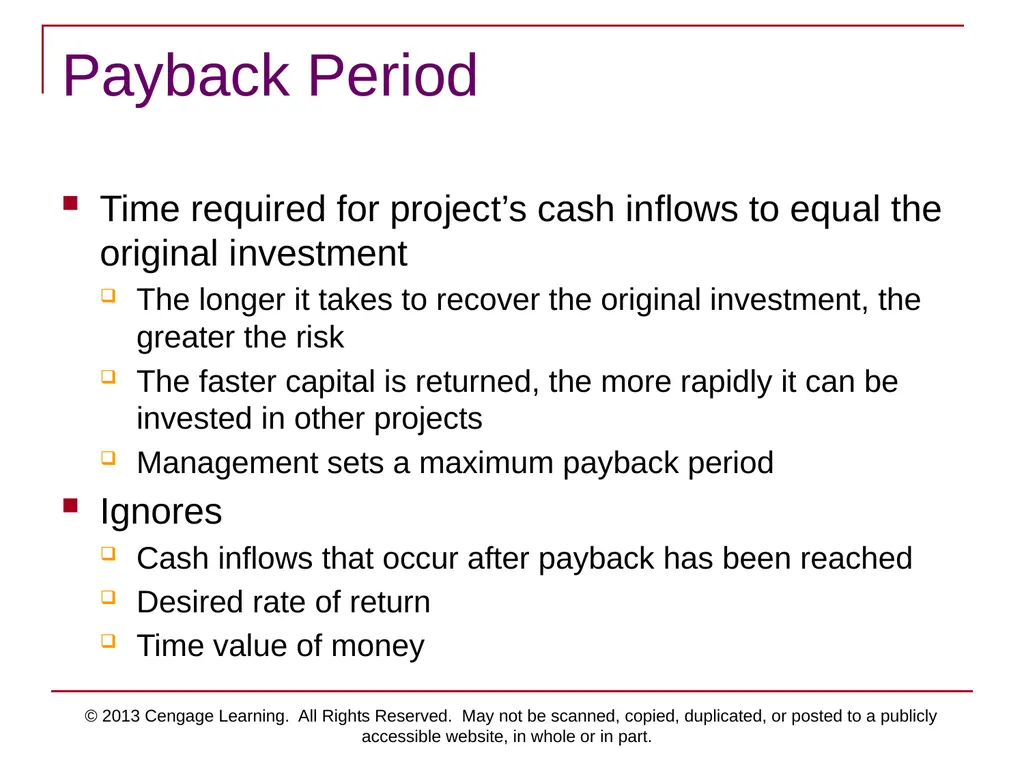
slide11. © 2013 Cengage Learning. All Rights Reserved. May not be scanned, copied, duplicated, or posted to a publicly accessible website, in whole or in part. Payback Period Time required for project’s cash inflows to equal the original investment
The longer it takes to recover the original investment, the greater the risk
The faster capital is returned, the more rapidly it can be invested in other projects
Management sets a maximum payback period
Ignores
Cash inflows that occur after payback has been reached
Desired rate of return
Time value of money<br>
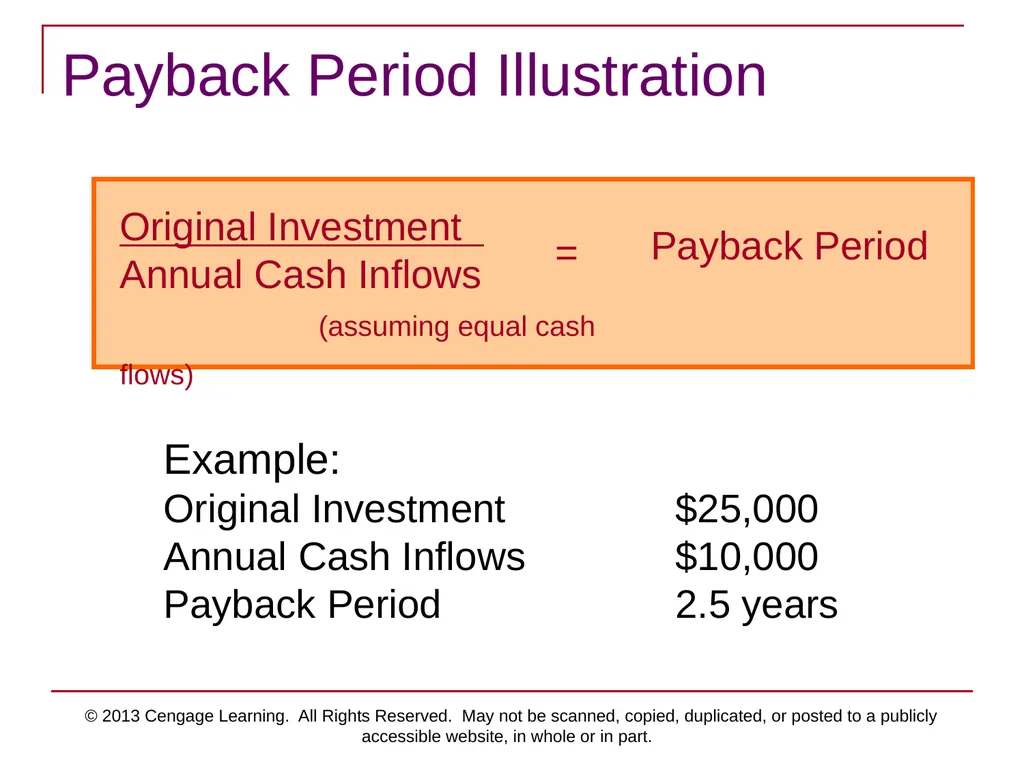
slide12. © 2013 Cengage Learning. All Rights Reserved. May not be scanned, copied, duplicated, or posted to a publicly accessible website, in whole or in part. Payback Period Illustration Original Investment
Annual Cash Inflows (assuming equal cash flows) Payback Period Example:
Original Investment $25,000
Annual Cash Inflows $10,000
Payback Period 2.5 years =<br>
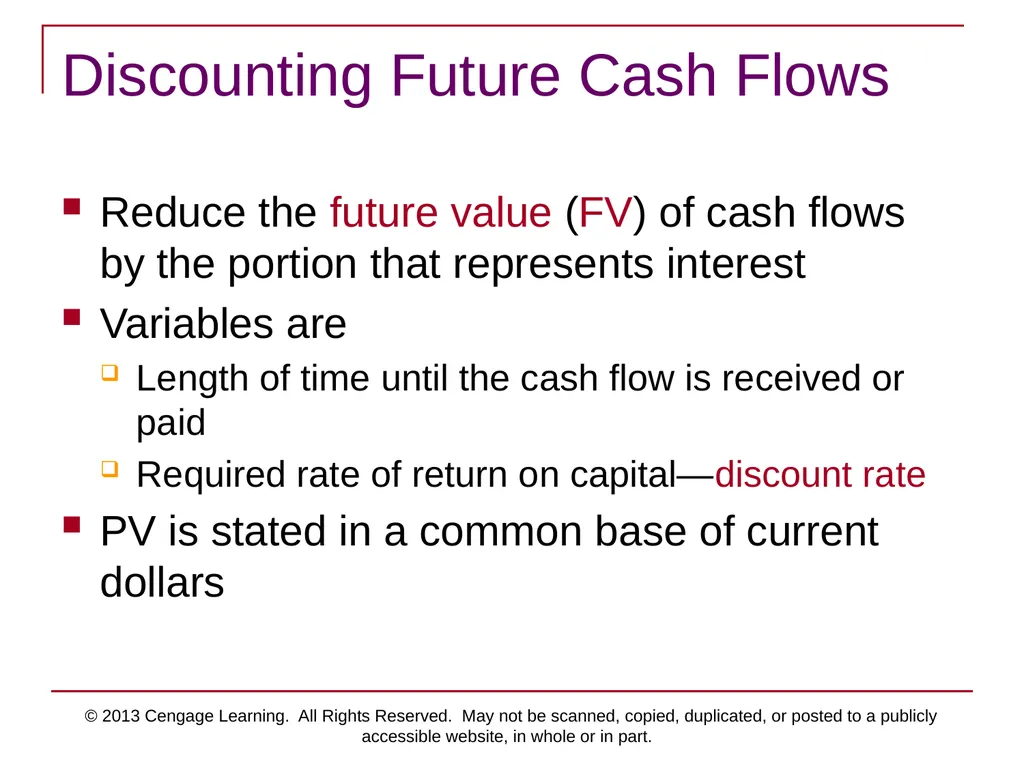
slide13. © 2013 Cengage Learning. All Rights Reserved. May not be scanned, copied, duplicated, or posted to a publicly accessible website, in whole or in part. Discounting Future Cash Flows Reduce the future value (FV) of cash flows by the portion that represents interest
Variables are
Length of time until the cash flow is received or paid
Required rate of return on capital—discount rate
PV is stated in a common base of current dollars<br>
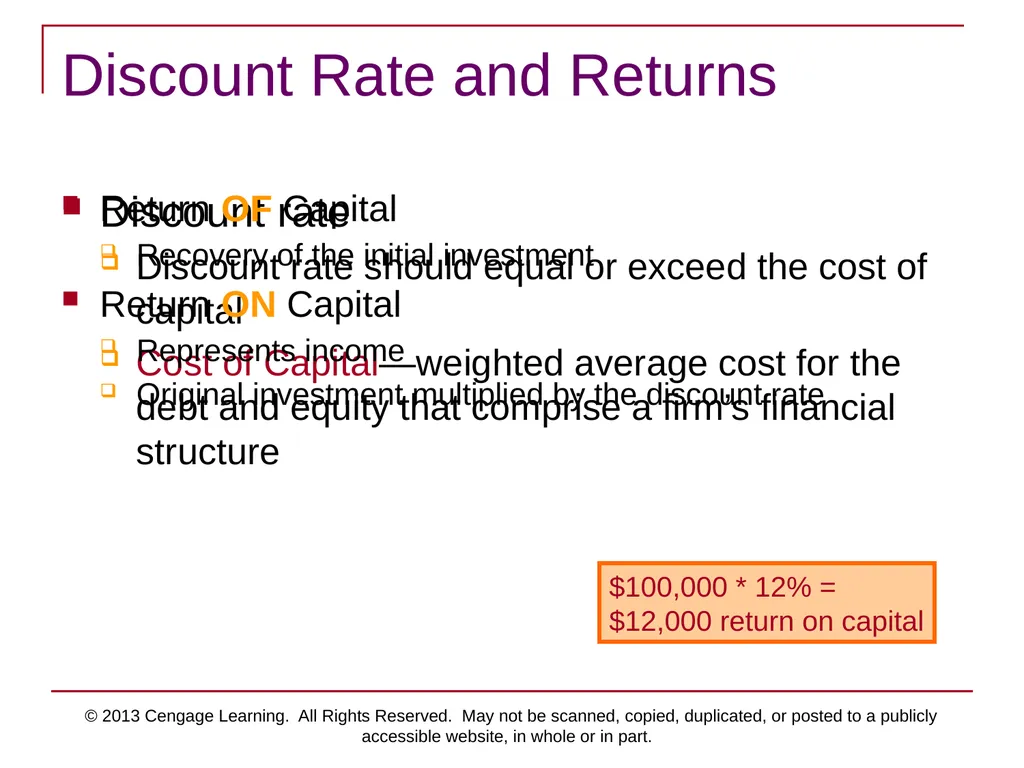
slide14. © 2013 Cengage Learning. All Rights Reserved. May not be scanned, copied, duplicated, or posted to a publicly accessible website, in whole or in part. Discount Rate and Returns Discount rate
Discount rate should equal or exceed the cost of capital
Cost of Capital—weighted average cost for the debt and equity that comprise a firm’s financial structure Return OF Capital
Recovery of the initial investment
Return ON Capital
Represents income
Original investment multiplied by the discount rate $100,000 * 12% =
$12,000 return on capital<br>
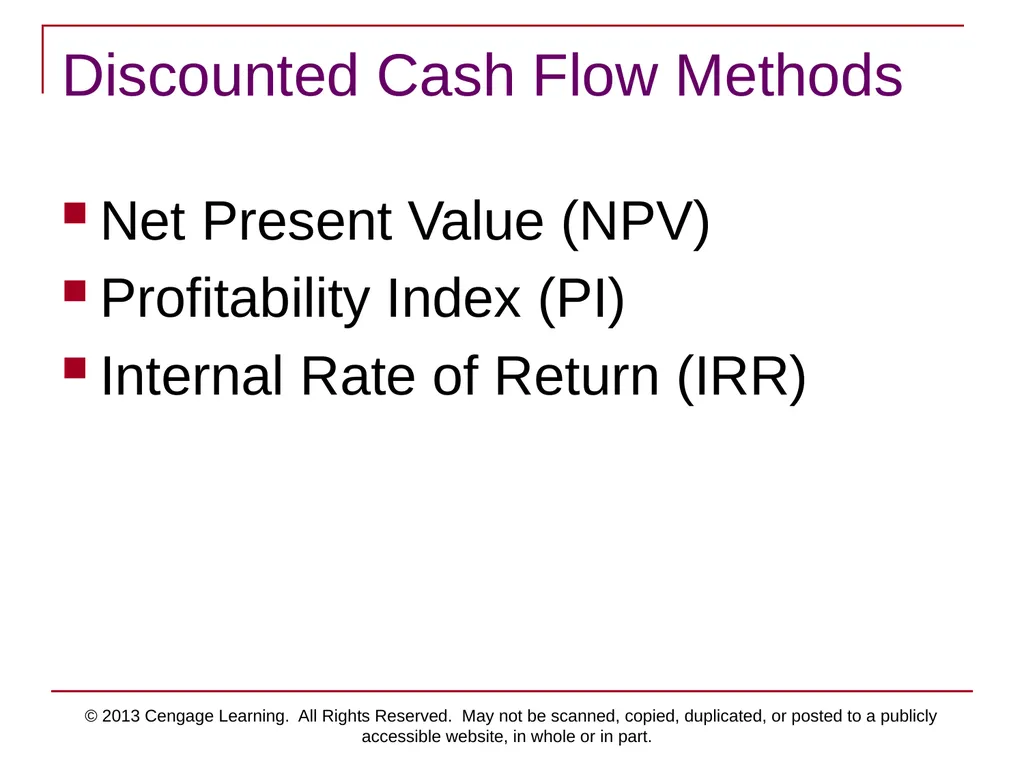
slide15. © 2013 Cengage Learning. All Rights Reserved. May not be scanned, copied, duplicated, or posted to a publicly accessible website, in whole or in part. Discounted Cash Flow Methods Net Present Value (NPV)
Profitability Index (PI)
Internal Rate of Return (IRR)<br>
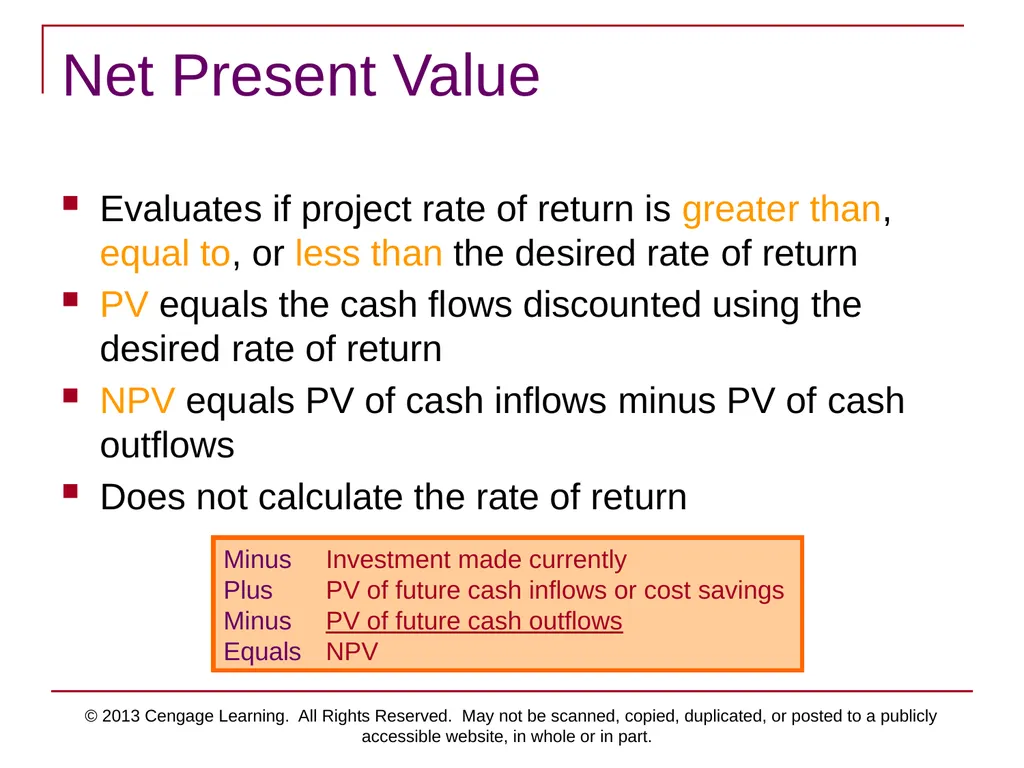
slide16. © 2013 Cengage Learning. All Rights Reserved. May not be scanned, copied, duplicated, or posted to a publicly accessible website, in whole or in part. Net Present Value Evaluates if project rate of return is greater than, equal to, or less than the desired rate of return
PV equals the cash flows discounted using the desired rate of return
NPV equals PV of cash inflows minus PV of cash outflows
Does not calculate the rate of return Minus Investment made currently
Plus PV of future cash inflows or cost savings
Minus PV of future cash outflows
Equals NPV<br>
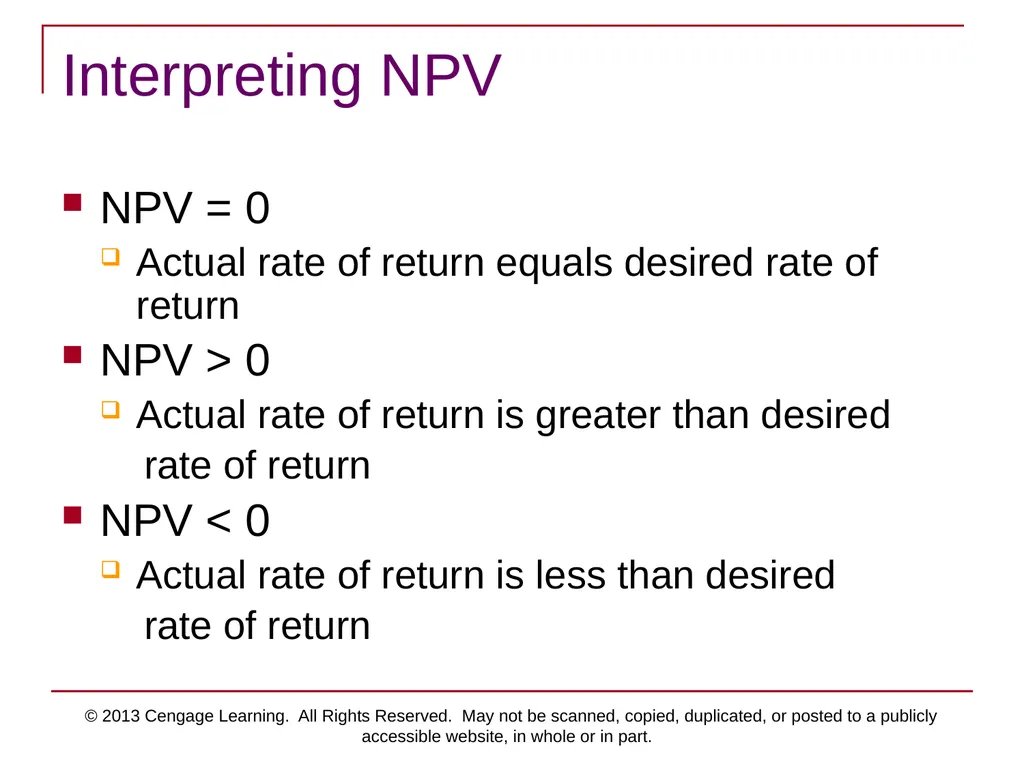
slide17. © 2013 Cengage Learning. All Rights Reserved. May not be scanned, copied, duplicated, or posted to a publicly accessible website, in whole or in part. Interpreting NPV NPV = 0
Actual rate of return equals desired rate of return
NPV > 0
Actual rate of return is greater than desired
rate of return
NPV < 0
Actual rate of return is less than desired
rate of return<br>
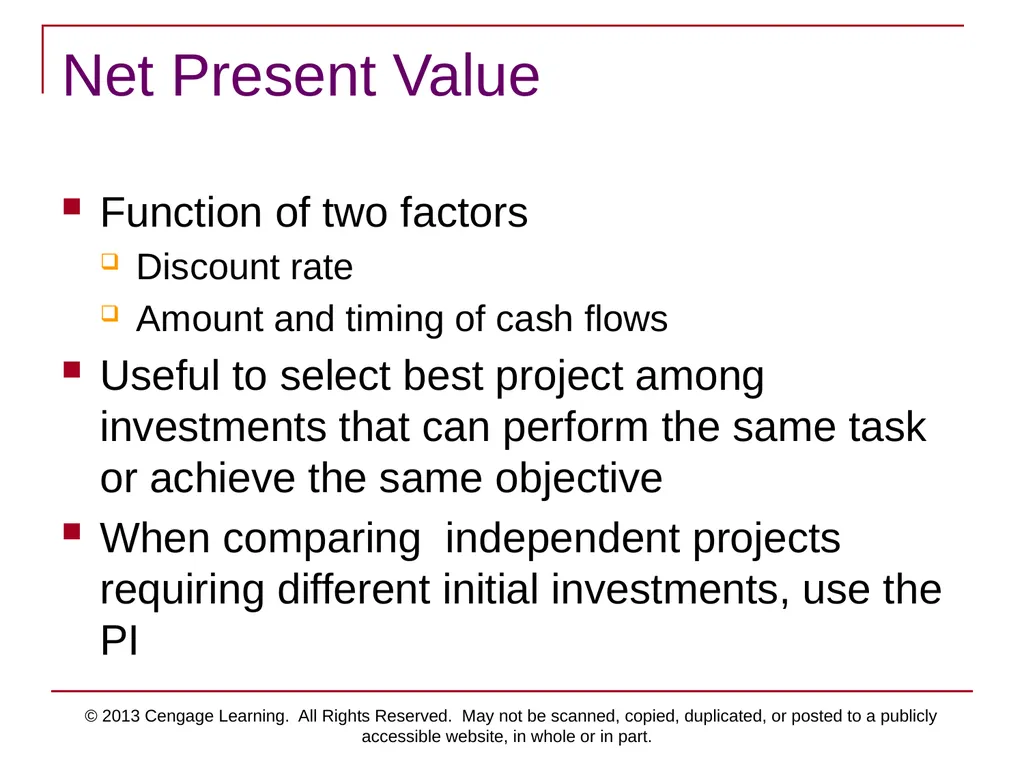
slide18. © 2013 Cengage Learning. All Rights Reserved. May not be scanned, copied, duplicated, or posted to a publicly accessible website, in whole or in part. Net Present Value Function of two factors
Discount rate
Amount and timing of cash flows
Useful to select best project among investments that can perform the same task or achieve the same objective
When comparing independent projects requiring different initial investments, use the PI<br>
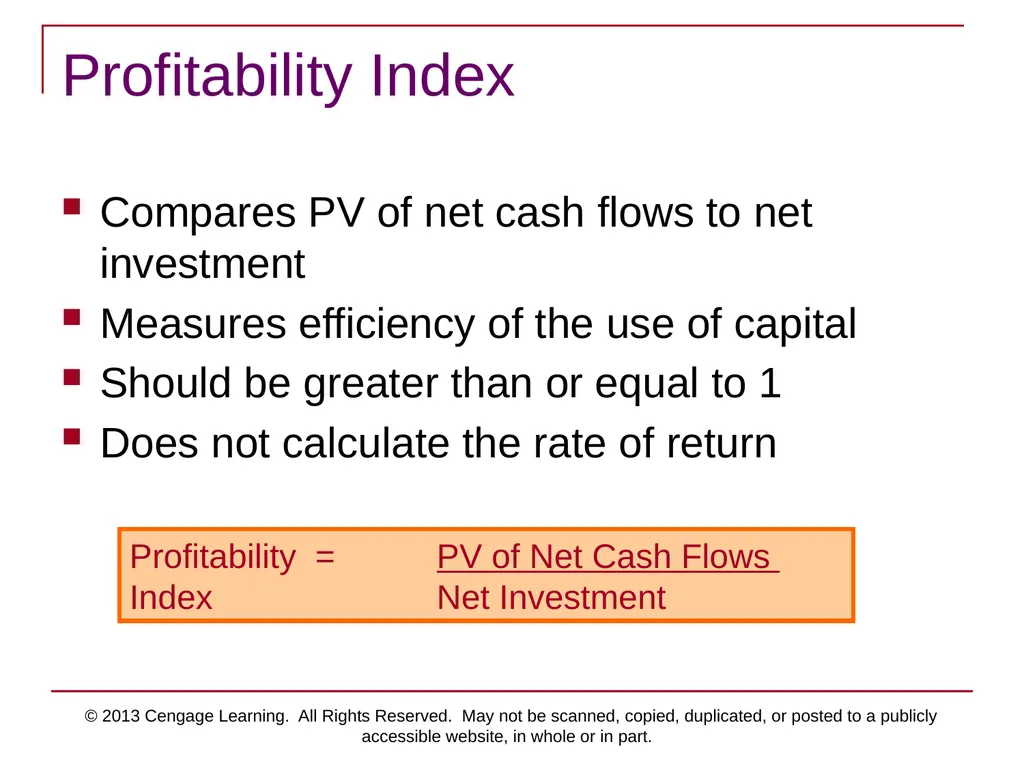
slide19. © 2013 Cengage Learning. All Rights Reserved. May not be scanned, copied, duplicated, or posted to a publicly accessible website, in whole or in part. Profitability Index Compares PV of net cash flows to net investment
Measures efficiency of the use of capital
Should be greater than or equal to 1
Does not calculate the rate of return Profitability = PV of Net Cash Flows
Index Net Investment<br>
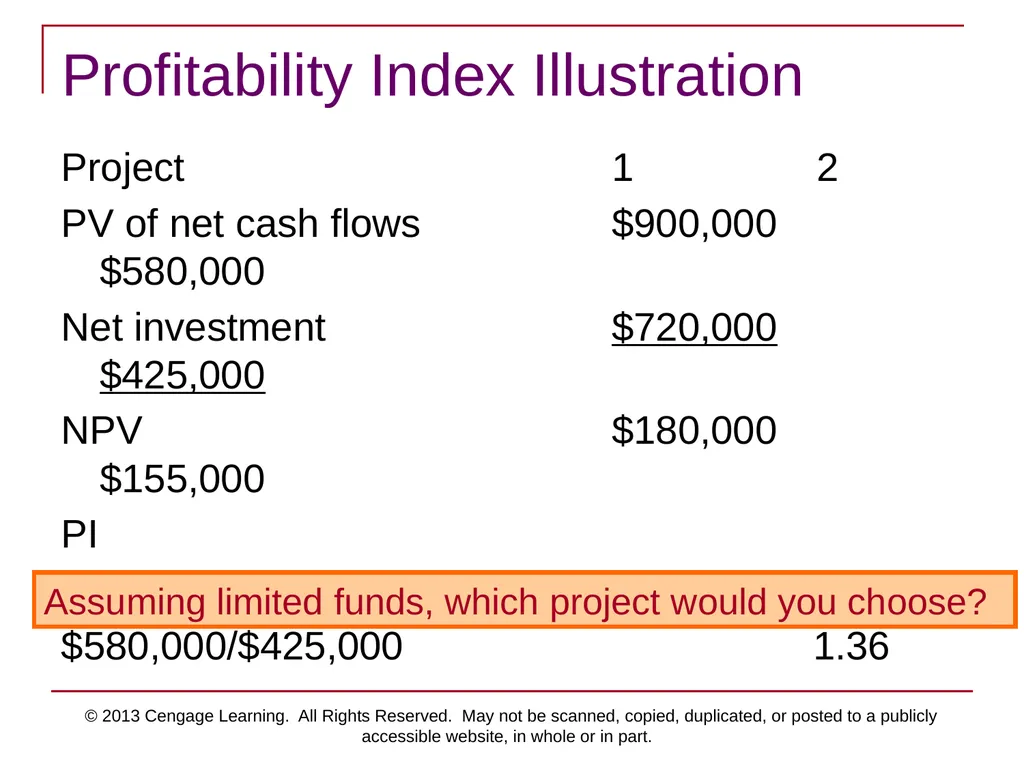
slide20. © 2013 Cengage Learning. All Rights Reserved. May not be scanned, copied, duplicated, or posted to a publicly accessible website, in whole or in part. Profitability Index Illustration Project 1 2
PV of net cash flows $900,000 $580,000
Net investment $720,000 $425,000
NPV $180,000 $155,000
PI
$900,000/$720,000 1.25
$580,000/$425,000 1.36 Assuming limited funds, which project would you choose?<br>
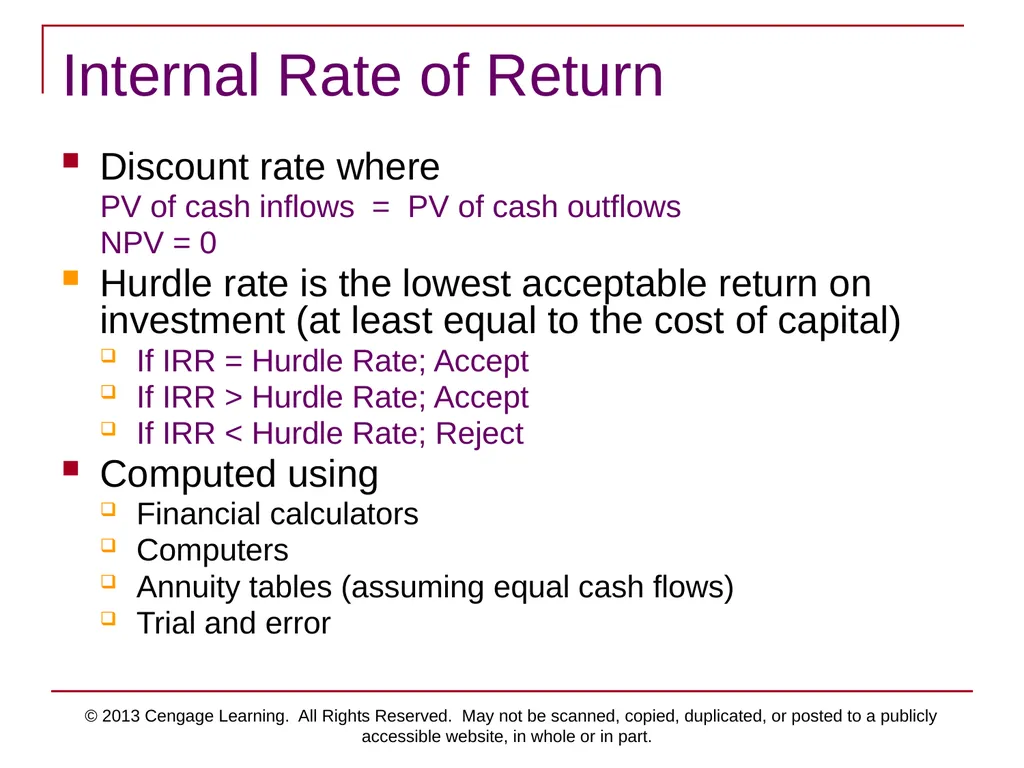
slide21. © 2013 Cengage Learning. All Rights Reserved. May not be scanned, copied, duplicated, or posted to a publicly accessible website, in whole or in part. Internal Rate of Return Discount rate where
PV of cash inflows = PV of cash outflows
NPV = 0
Hurdle rate is the lowest acceptable return on investment (at least equal to the cost of capital)
If IRR = Hurdle Rate; Accept
If IRR > Hurdle Rate; Accept
If IRR < Hurdle Rate; Reject
Computed using
Financial calculators
Computers
Annuity tables (assuming equal cash flows)
Trial and error<br>
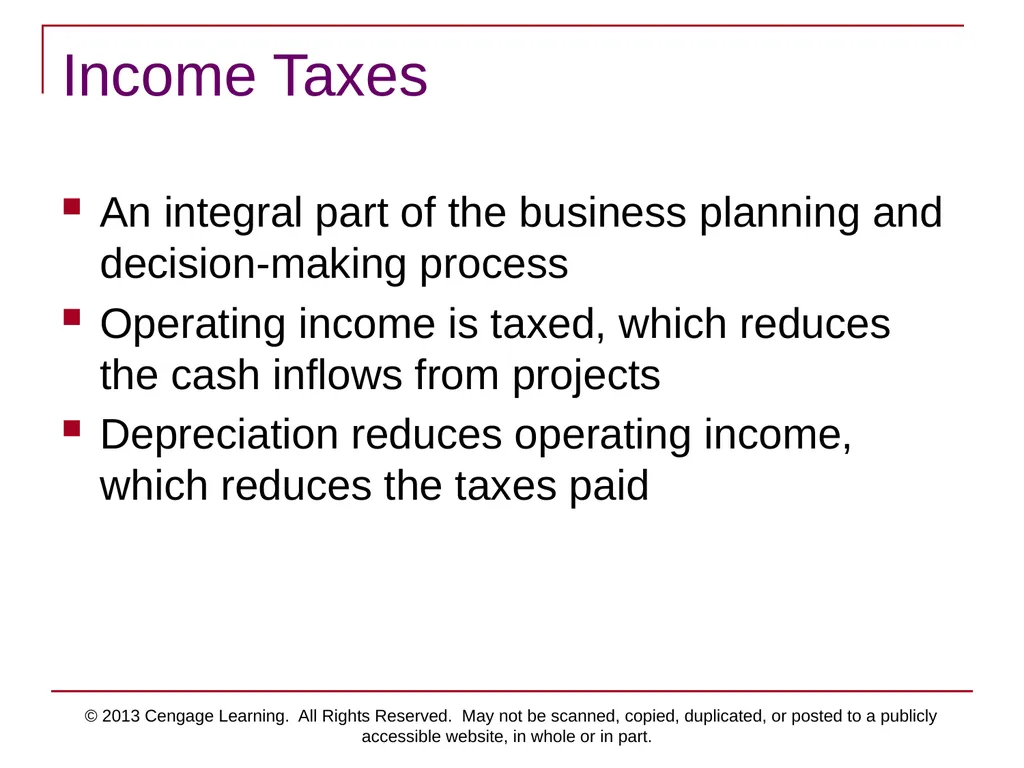
slide22. © 2013 Cengage Learning. All Rights Reserved. May not be scanned, copied, duplicated, or posted to a publicly accessible website, in whole or in part. Income Taxes An integral part of the business planning and decision-making process
Operating income is taxed, which reduces the cash inflows from projects
Depreciation reduces operating income, which reduces the taxes paid<br>
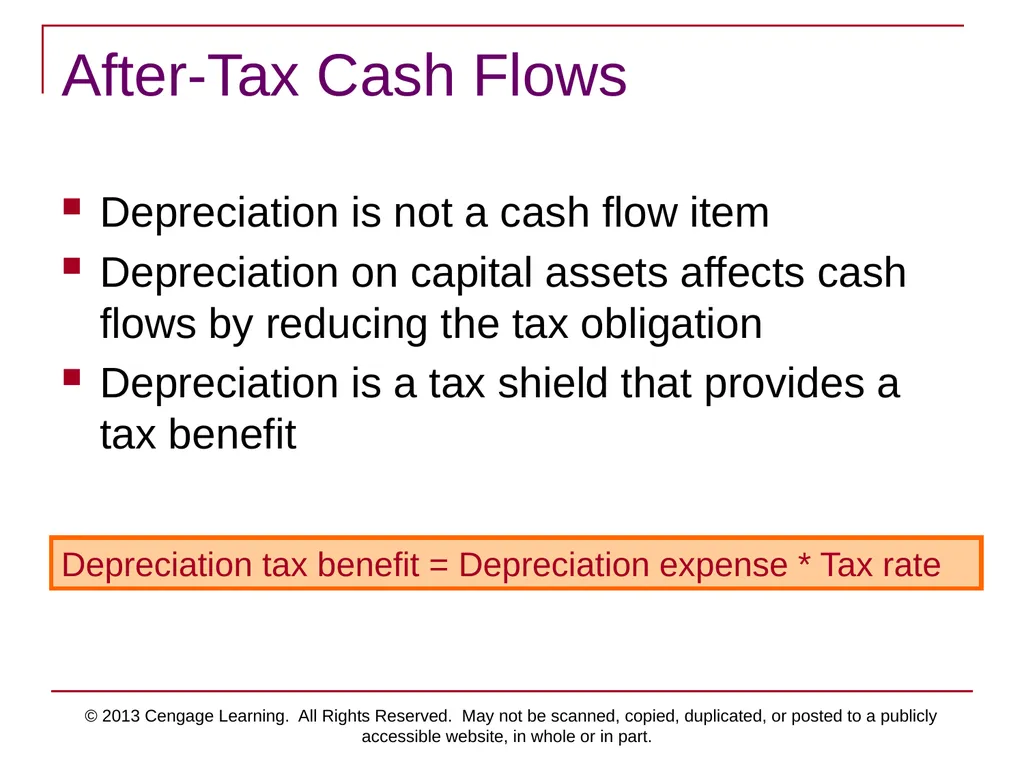
slide23. © 2013 Cengage Learning. All Rights Reserved. May not be scanned, copied, duplicated, or posted to a publicly accessible website, in whole or in part. After-Tax Cash Flows Depreciation is not a cash flow item
Depreciation on capital assets affects cash flows by reducing the tax obligation
Depreciation is a tax shield that provides a tax benefit Depreciation tax benefit = Depreciation expense * Tax rate<br>
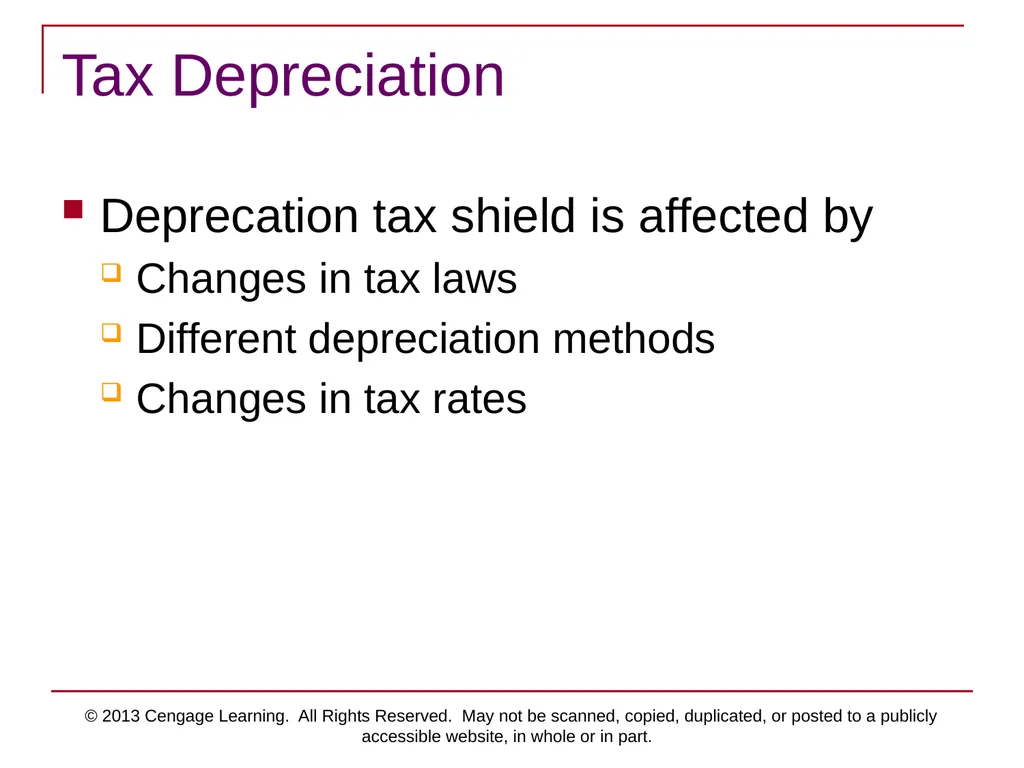
slide24. © 2013 Cengage Learning. All Rights Reserved. May not be scanned, copied, duplicated, or posted to a publicly accessible website, in whole or in part. Tax Depreciation Deprecation tax shield is affected by
Changes in tax laws
Different depreciation methods
Changes in tax rates<br>
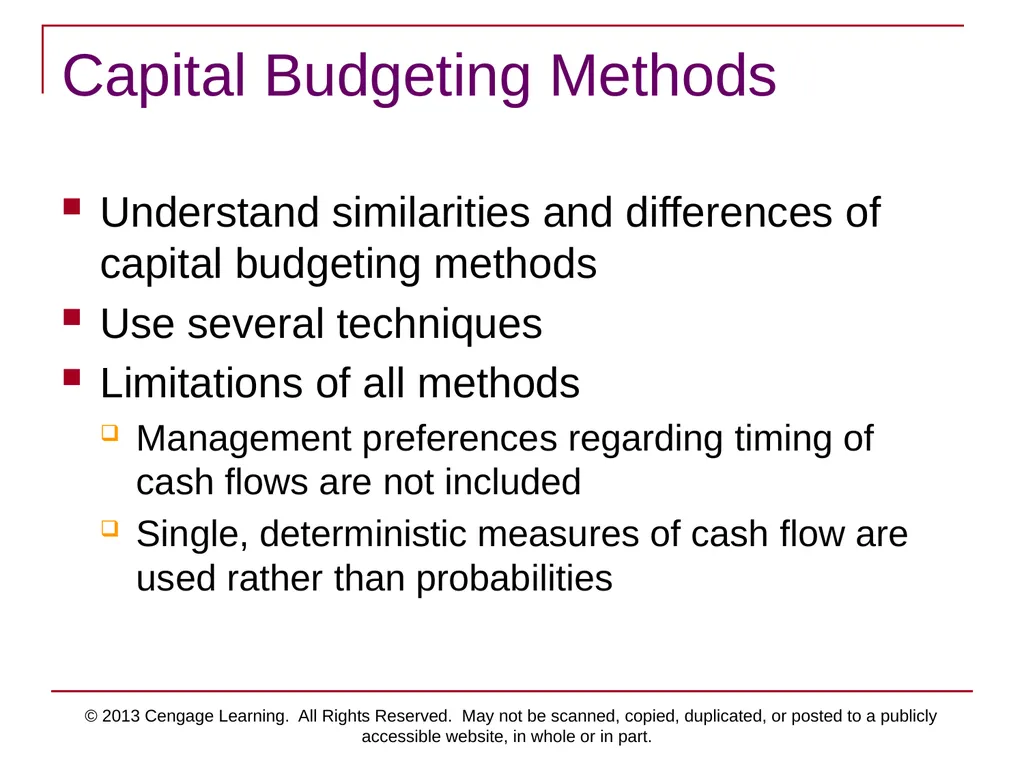
slide25. © 2013 Cengage Learning. All Rights Reserved. May not be scanned, copied, duplicated, or posted to a publicly accessible website, in whole or in part. Capital Budgeting Methods Understand similarities and differences of capital budgeting methods
Use several techniques
Limitations of all methods
Management preferences regarding timing of cash flows are not included
Single, deterministic measures of cash flow are used rather than probabilities<br>
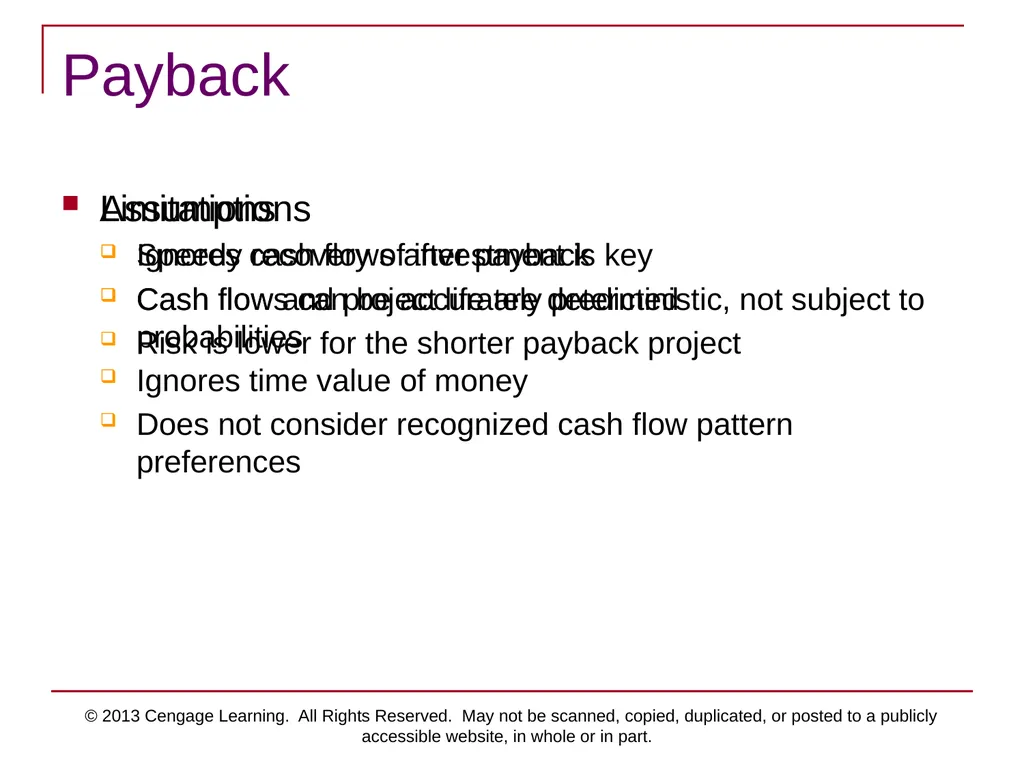
slide26. © 2013 Cengage Learning. All Rights Reserved. May not be scanned, copied, duplicated, or posted to a publicly accessible website, in whole or in part. Payback Assumptions
Speedy recovery of investment is key
Cash flows can be accurately predicted
Risk is lower for the shorter payback project Limitations
Ignores cash flows after payback
Cash flow and project life are deterministic, not subject to probabilities
Ignores time value of money
Does not consider recognized cash flow pattern preferences<br>
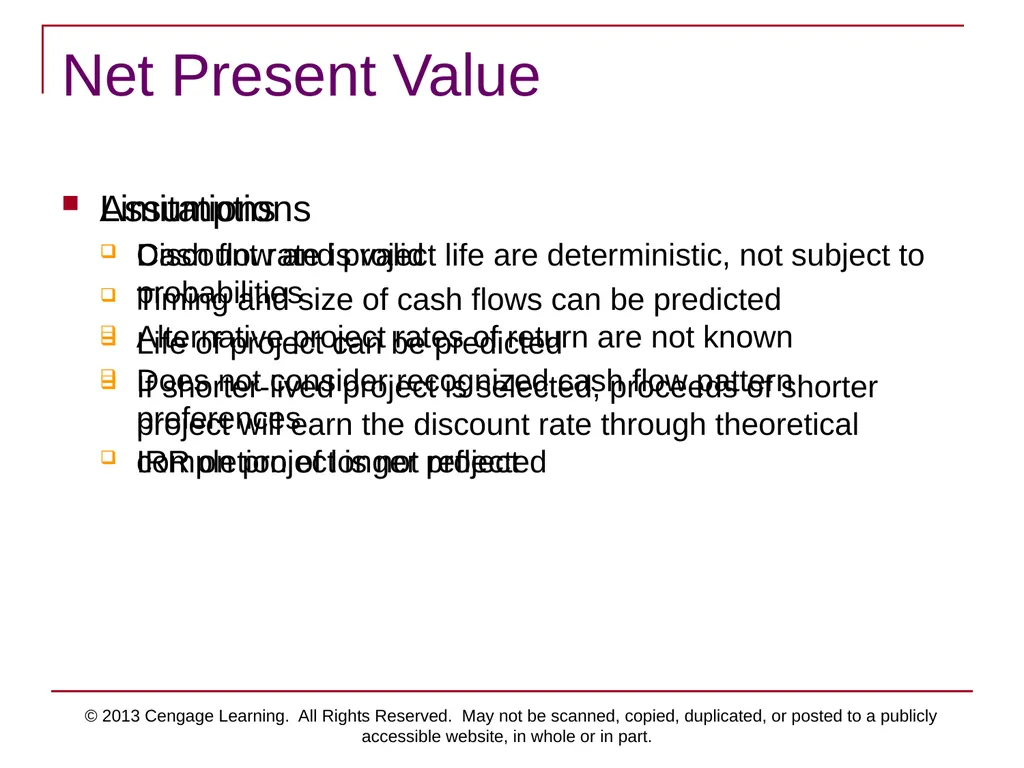
slide27. © 2013 Cengage Learning. All Rights Reserved. May not be scanned, copied, duplicated, or posted to a publicly accessible website, in whole or in part. Net Present Value Assumptions
Discount rate is valid
Timing and size of cash flows can be predicted
Life of project can be predicted
If shorter-lived project is selected, proceeds of shorter project will earn the discount rate through theoretical completion of longer project Limitations
Cash flow and project life are deterministic, not subject to probabilities
Alternative project rates of return are not known
Does not consider recognized cash flow pattern preferences
IRR on project is not reflected<br>
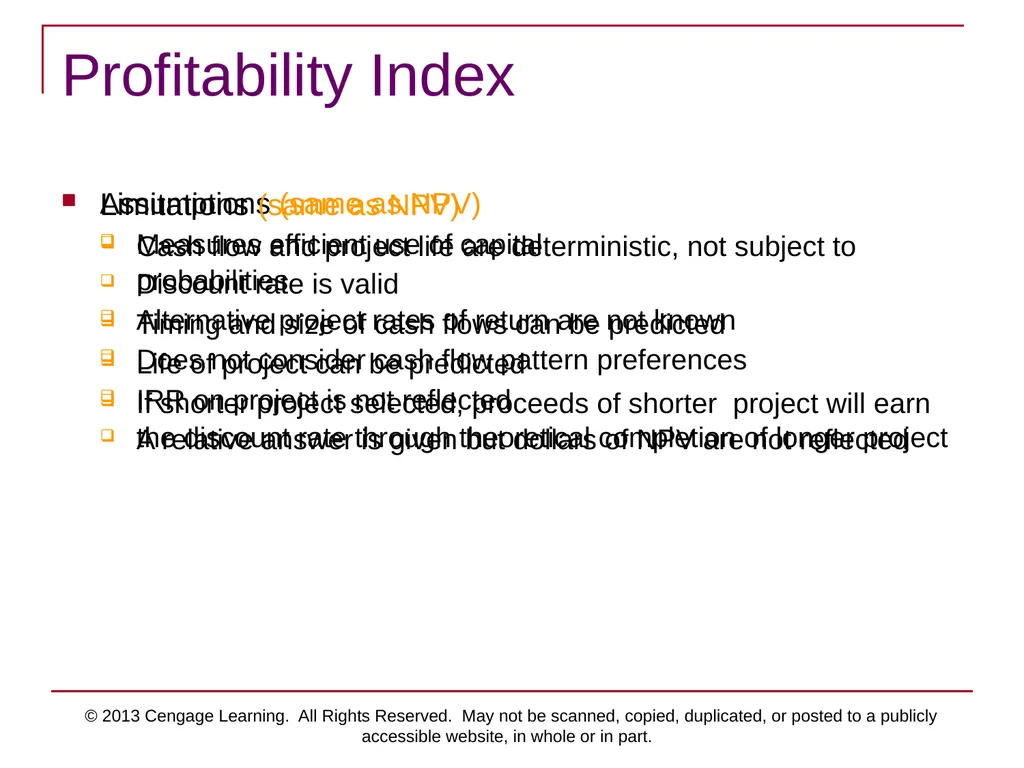
slide28. © 2013 Cengage Learning. All Rights Reserved. May not be scanned, copied, duplicated, or posted to a publicly accessible website, in whole or in part. Profitability Index Assumptions (same as NPV)
Measures efficient use of capital
Discount rate is valid
Timing and size of cash flows can be predicted
Life of project can be predicted
If shorter project selected, proceeds of shorter project will earn the discount rate through theoretical completion of longer project Limitations (same as NPV)
Cash flow and project life are deterministic, not subject to probabilities
Alternative project rates of return are not known
Does not consider cash flow pattern preferences
IRR on project is not reflected
A relative answer is given but dollars of NPV are not reflected<br>
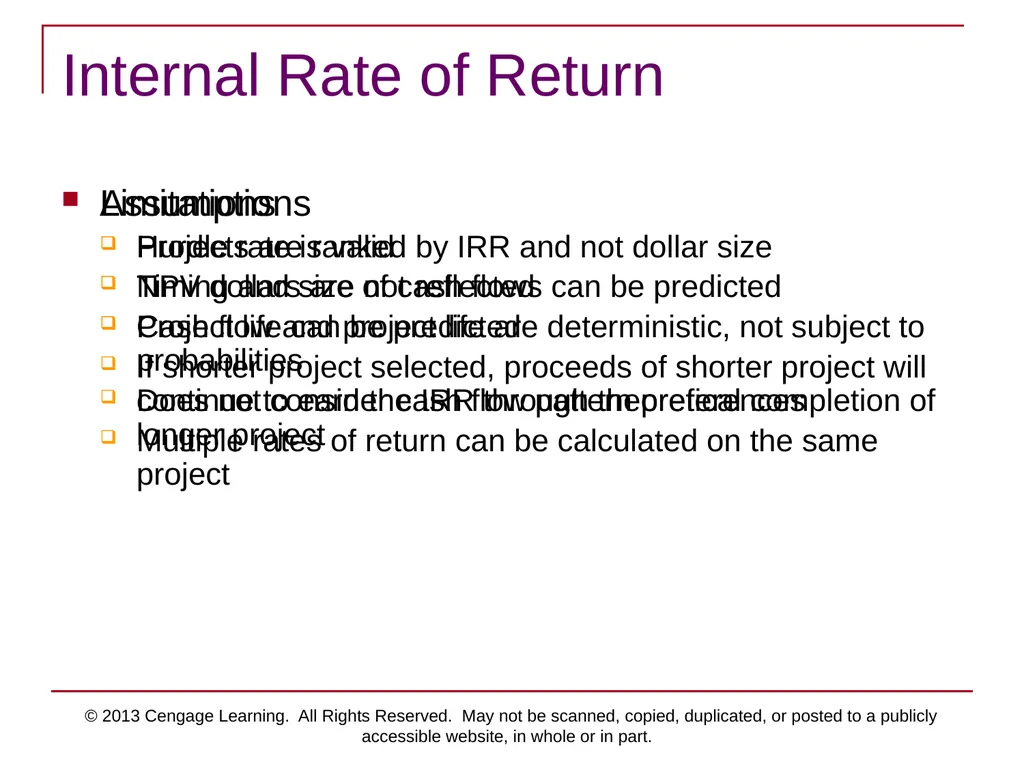
slide29. © 2013 Cengage Learning. All Rights Reserved. May not be scanned, copied, duplicated, or posted to a publicly accessible website, in whole or in part. Internal Rate of Return Assumptions
Hurdle rate is valid
Timing and size of cash flows can be predicted
Project life can be predicted
If shorter project selected, proceeds of shorter project will continue to earn the IRR through theoretical completion of longer project Limitations
Projects are ranked by IRR and not dollar size
NPV dollars are not reflected
Cash flow and project life are deterministic, not subject to probabilities
Does not consider cash flow pattern preferences
Multiple rates of return can be calculated on the same project<br>
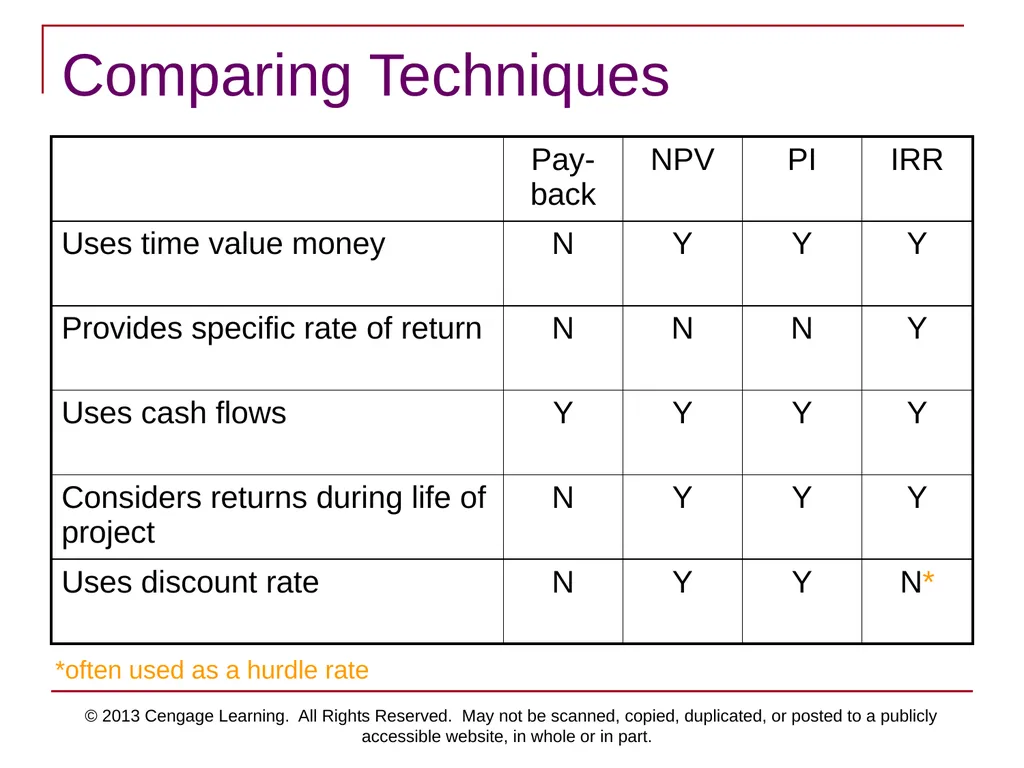
slide30. © 2013 Cengage Learning. All Rights Reserved. May not be scanned, copied, duplicated, or posted to a publicly accessible website, in whole or in part. Comparing Techniques *often used as a hurdle rate<br>
slide31. © 2013 Cengage Learning. All Rights Reserved. May not be scanned, copied, duplicated, or posted to a publicly accessible website, in whole or in part. The Investment Decision Is the activity worthy of an investment?
Which assets can be used for the activity?
Of the available assets for each activity, which is the best investment?
Of the “best investments” for all worthwhile activities, in which ones should the company invest? Consider Quantitative and Qualitative Factors<br>
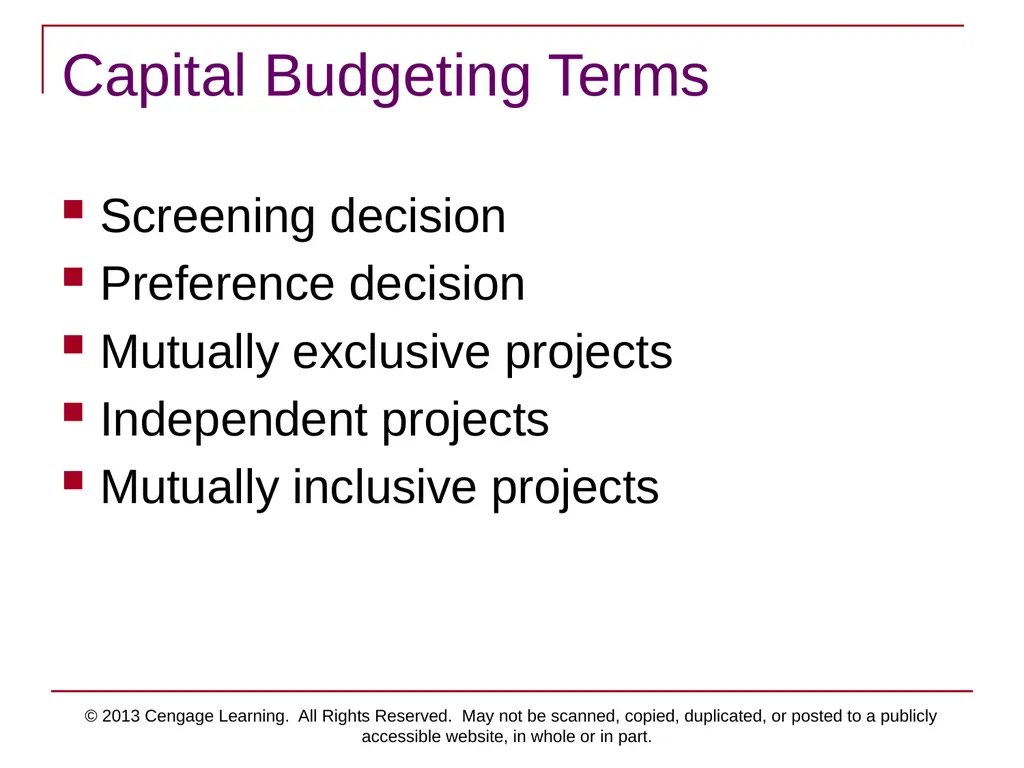
slide32. © 2013 Cengage Learning. All Rights Reserved. May not be scanned, copied, duplicated, or posted to a publicly accessible website, in whole or in part. Capital Budgeting Terms Screening decision
Preference decision
Mutually exclusive projects
Independent projects
Mutually inclusive projects<br>
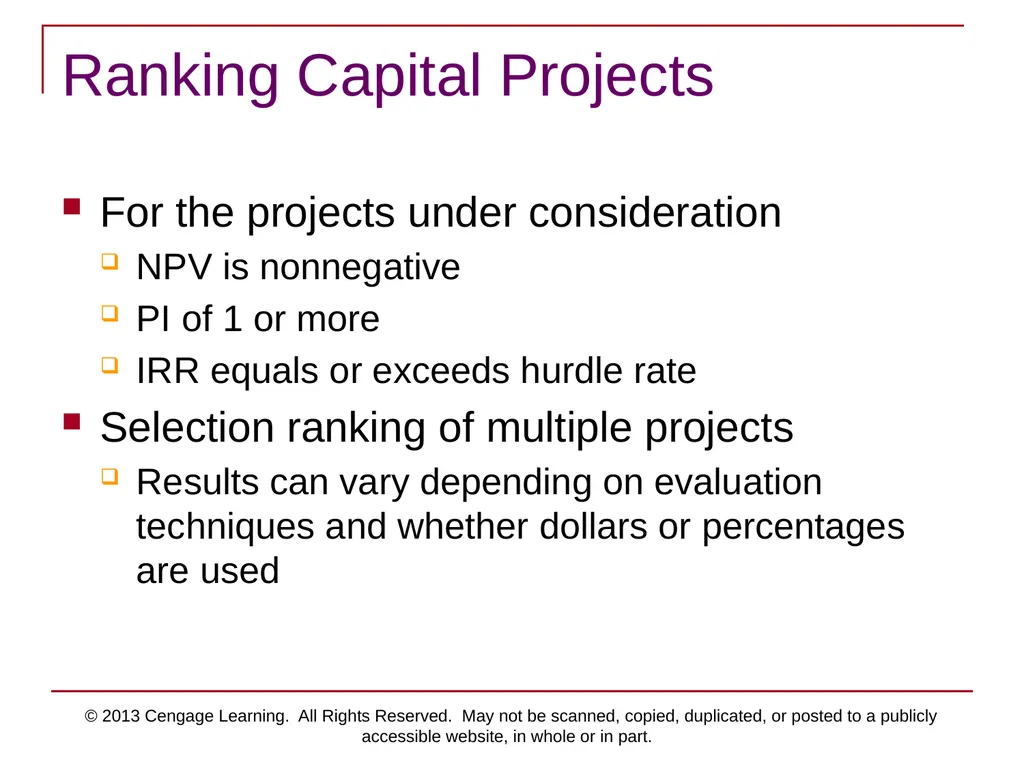
slide33. © 2013 Cengage Learning. All Rights Reserved. May not be scanned, copied, duplicated, or posted to a publicly accessible website, in whole or in part. Ranking Capital Projects For the projects under consideration
NPV is nonnegative
PI of 1 or more
IRR equals or exceeds hurdle rate
Selection ranking of multiple projects
Results can vary depending on evaluation techniques and whether dollars or percentages are used<br>
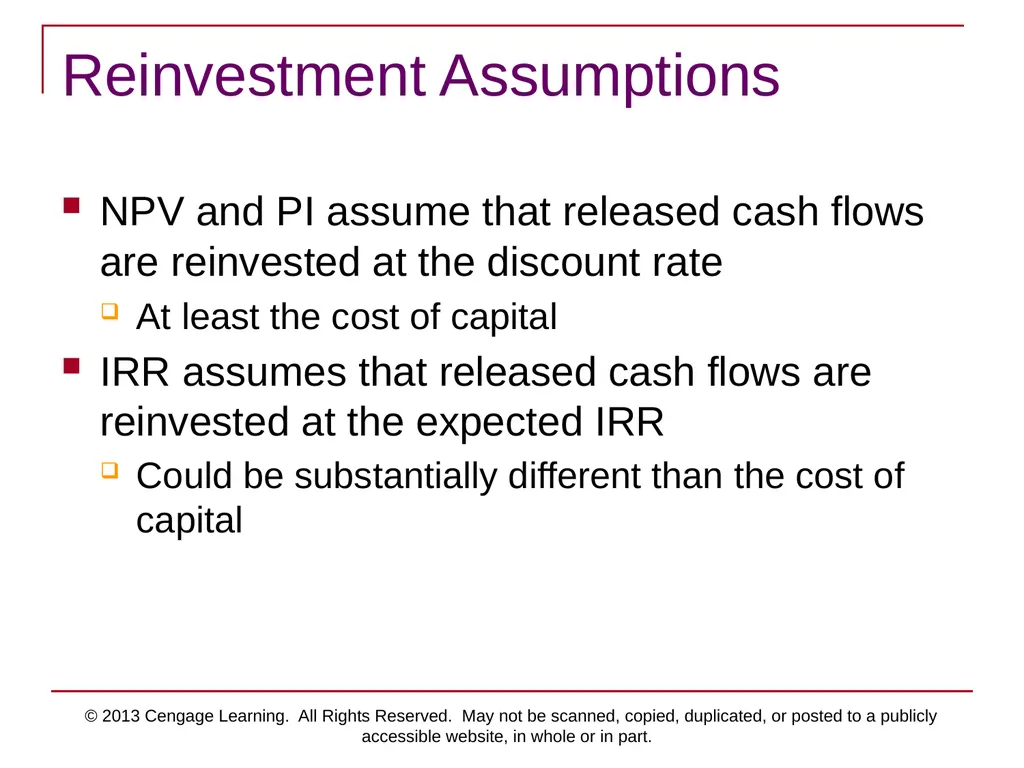
slide34. © 2013 Cengage Learning. All Rights Reserved. May not be scanned, copied, duplicated, or posted to a publicly accessible website, in whole or in part. Reinvestment Assumptions NPV and PI assume that released cash flows are reinvested at the discount rate
At least the cost of capital
IRR assumes that released cash flows are reinvested at the expected IRR
Could be substantially different than the cost of capital<br>
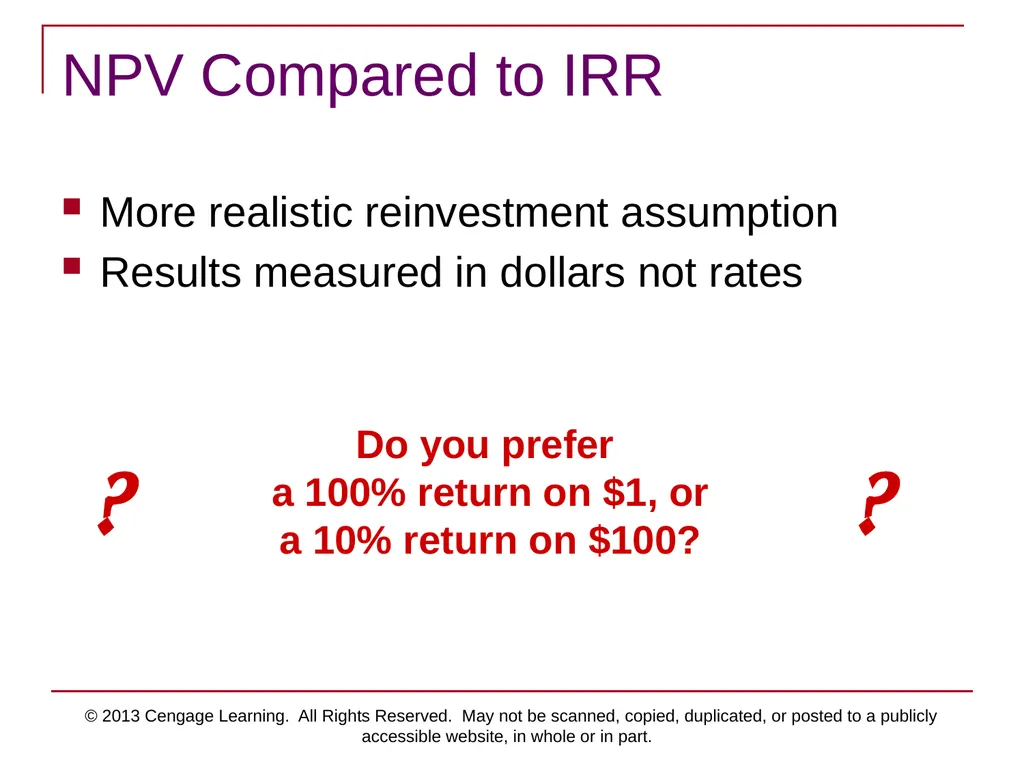
slide35. © 2013 Cengage Learning. All Rights Reserved. May not be scanned, copied, duplicated, or posted to a publicly accessible website, in whole or in part. NPV Compared to IRR More realistic reinvestment assumption
Results measured in dollars not rates<br>
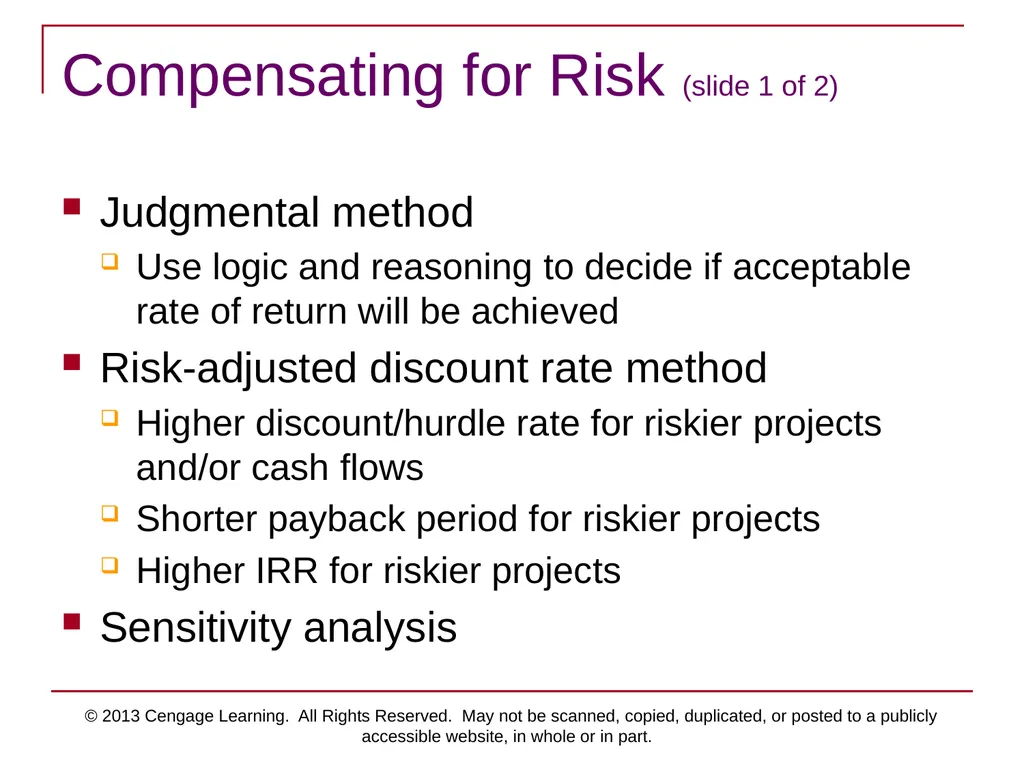
slide36. © 2013 Cengage Learning. All Rights Reserved. May not be scanned, copied, duplicated, or posted to a publicly accessible website, in whole or in part. Compensating for Risk (slide 1 of 2) Judgmental method
Use logic and reasoning to decide if acceptable rate of return will be achieved
Risk-adjusted discount rate method
Higher discount/hurdle rate for riskier projects and/or cash flows
Shorter payback period for riskier projects
Higher IRR for riskier projects
Sensitivity analysis<br>
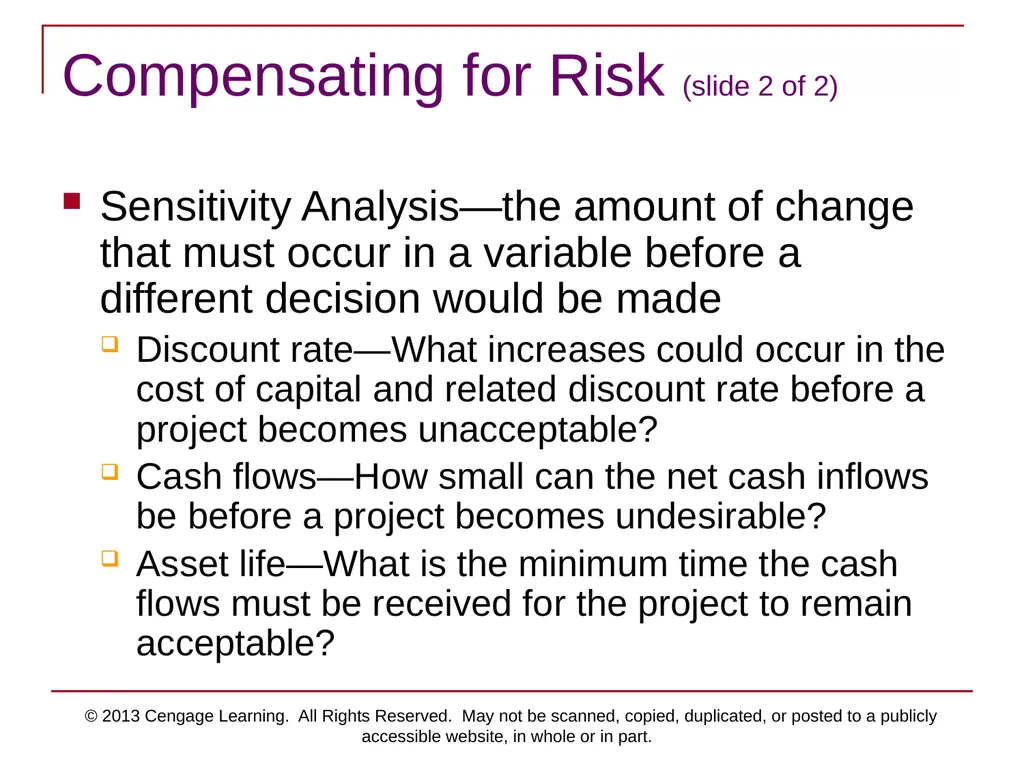
slide37. © 2013 Cengage Learning. All Rights Reserved. May not be scanned, copied, duplicated, or posted to a publicly accessible website, in whole or in part. Compensating for Risk (slide 2 of 2) Sensitivity Analysis—the amount of change that must occur in a variable before a different decision would be made
Discount rate—What increases could occur in the cost of capital and related discount rate before a project becomes unacceptable?
Cash flows—How small can the net cash inflows be before a project becomes undesirable?
Asset life—What is the minimum time the cash flows must be received for the project to remain acceptable?<br>
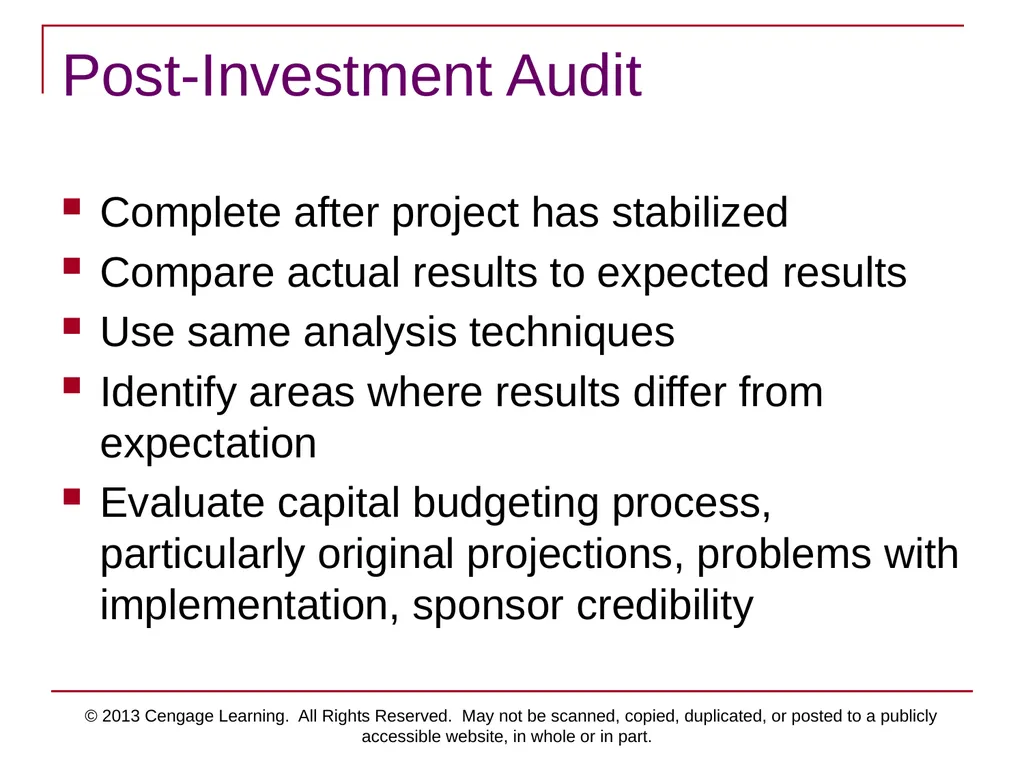
slide38. © 2013 Cengage Learning. All Rights Reserved. May not be scanned, copied, duplicated, or posted to a publicly accessible website, in whole or in part. Post-Investment Audit Complete after project has stabilized
Compare actual results to expected results
Use same analysis techniques
Identify areas where results differ from expectation
Evaluate capital budgeting process, particularly original projections, problems with implementation, sponsor credibility<br>
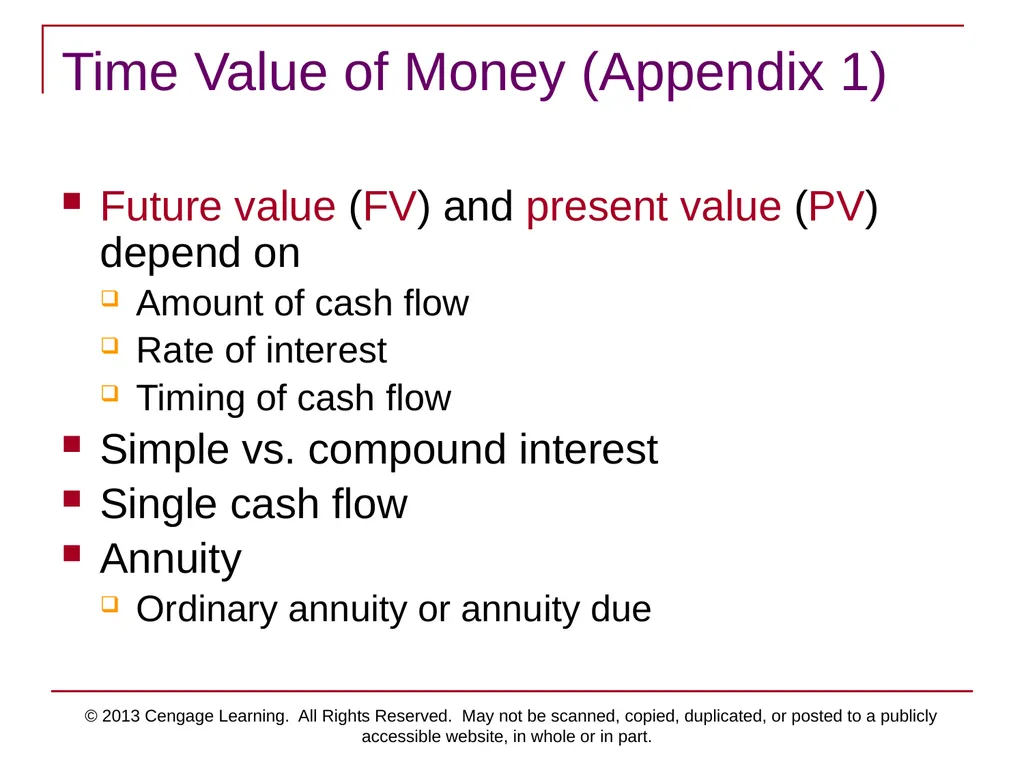
slide39. © 2013 Cengage Learning. All Rights Reserved. May not be scanned, copied, duplicated, or posted to a publicly accessible website, in whole or in part. Time Value of Money (Appendix 1) Future value (FV) and present value (PV) depend on
Amount of cash flow
Rate of interest
Timing of cash flow
Simple vs. compound interest
Single cash flow
Annuity
Ordinary annuity or annuity due<br>
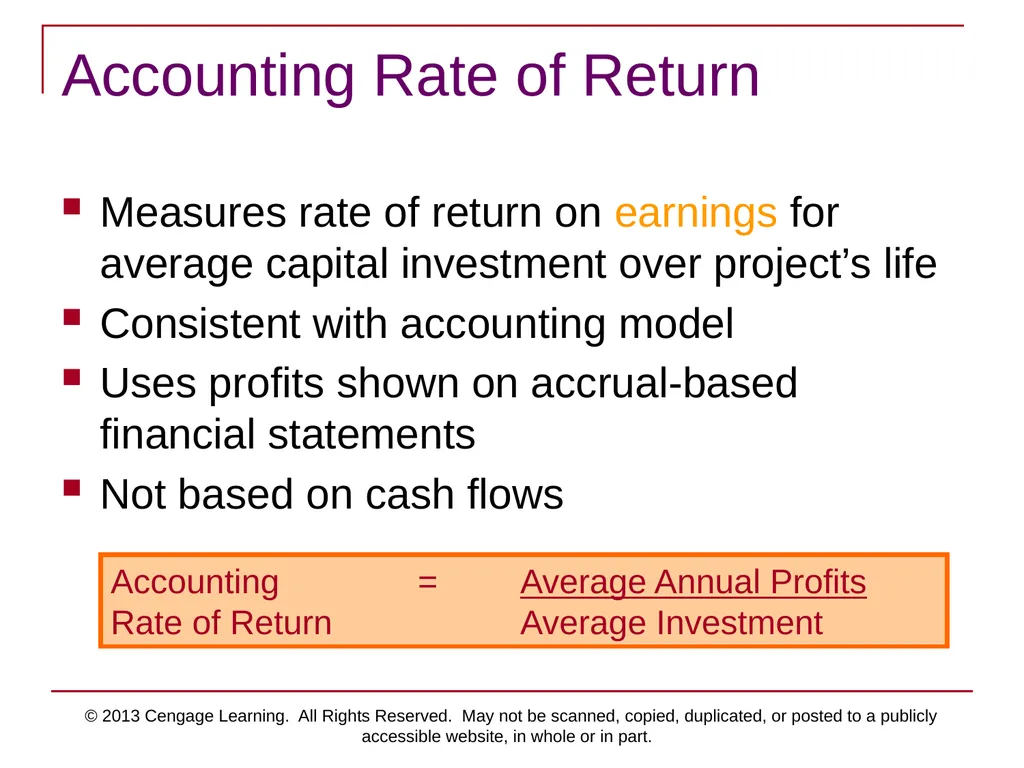
slide40. © 2013 Cengage Learning. All Rights Reserved. May not be scanned, copied, duplicated, or posted to a publicly accessible website, in whole or in part. Accounting Rate of Return Measures rate of return on earnings for average capital investment over project’s life
Consistent with accounting model
Uses profits shown on accrual-based financial statements
Not based on cash flows Accounting = Average Annual Profits
Rate of Return Average Investment<br>
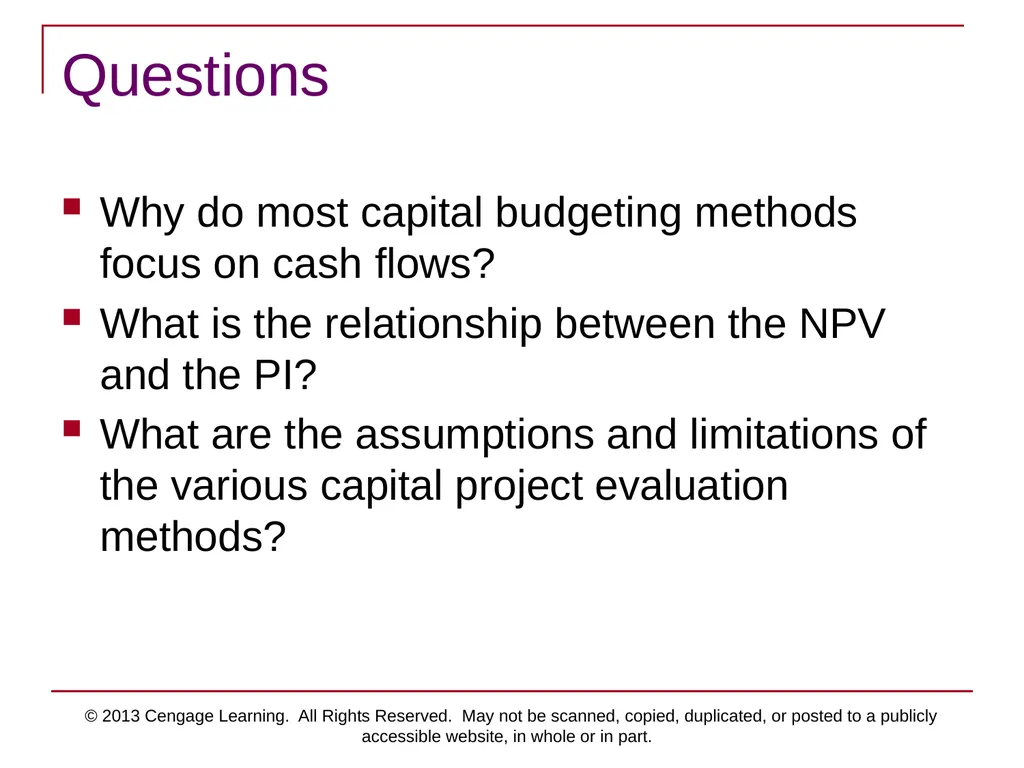
slide41. © 2013 Cengage Learning. All Rights Reserved. May not be scanned, copied, duplicated, or posted to a publicly accessible website, in whole or in part. Questions Why do most capital budgeting methods focus on cash flows?
What is the relationship between the NPV and the PI?
What are the assumptions and limitations of the various capital project evaluation methods?<br>
slide42. © 2013 Cengage Learning. All Rights Reserved. May not be scanned, copied, duplicated, or posted to a publicly accessible website, in whole or in part. Potential Ethical Issues Ignoring enhanced safety or detrimental environmental impact for project decisions
Changing assumptions or estimates to meet criteria for approval
Using a discount rate that is inappropriately low
Not conducting a post-investment audit to hold decision makers accountable
Choosing projects based on accounting earnings only rather than including discounted cash flow methods<br>
slide2. © 2013 Cengage Learning. All Rights Reserved. May not be scanned, copied, duplicated, or posted to a publicly accessible website, in whole or in part. Learning Objectives Why do most capital budgeting methods focus on cash flows?
How is payback period computed, and what does it measure?
How are the net present value (NPV) and profitability index (PI) of a project computed, and what do they measure?
How is the internal rate of return (IRR) on a project computed, and what does that rate measure?
How do taxation and depreciation affect cash flows? What are the underlying assumptions and limitations of each capital project evaluation method?
How do managers rank investment projects?
How is risk considered in capital budgeting analyses?
How and why should management conduct a post-investment audit of a capital project?
(Appendix 1) How are present values (PV) calculated?
(Appendix 2) What are the advantages and disadvantages of the accounting rate of return method?<br>
slide3. © 2013 Cengage Learning. All Rights Reserved. May not be scanned, copied, duplicated, or posted to a publicly accessible website, in whole or in part. Capital Assets Capital assets are long-term assets used to:
Generate future revenues or cost savings
Provide distribution, service, or production capacity
Tangible fixed assets
Land, building, machinery, etc.
Intangible assets
Capital lease, patent, etc.<br>
slide4. © 2013 Cengage Learning. All Rights Reserved. May not be scanned, copied, duplicated, or posted to a publicly accessible website, in whole or in part. Capital Budgeting Capital budgeting involves evaluating and ranking alternative future investments to effectively and efficiently allocate limited capital.
Plan and prepare the capital budget
Review past investments to assess success of past decisions and enhance the decision process in the future
Compare and evaluate alternative projects
Financial and nonfinancial criteria
Short- and long-term benefits
Usually multiple criteria
Consider all significant stakeholders<br>
slide5. © 2013 Cengage Learning. All Rights Reserved. May not be scanned, copied, duplicated, or posted to a publicly accessible website, in whole or in part. Capital Budgeting as Part of the Financial Budget Operating Budget Cash Budget Capital Budget Income
Statement Statement of
Retained Earnings Balance Sheet Statement of
Cash Flows<br>
slide6. © 2013 Cengage Learning. All Rights Reserved. May not be scanned, copied, duplicated, or posted to a publicly accessible website, in whole or in part.<br>
slide7. © 2013 Cengage Learning. All Rights Reserved. May not be scanned, copied, duplicated, or posted to a publicly accessible website, in whole or in part. Capital Budgeting: Quantitative versus Qualitative Quantitative
Accounting rate of return
Payback period
Discounted payback period
Net Present Value (NPV)
Internal Rate of Return (IRR)
Profitability Index (PI) Qualitative
Employee morale, safety, and responsibility
Corporate image
Social responsibility
Market share
Growth
Strategic planning
Sustainability<br>
slide8. © 2013 Cengage Learning. All Rights Reserved. May not be scanned, copied, duplicated, or posted to a publicly accessible website, in whole or in part. Capital Budgeting: Financial Analysis Payback period
NPV
PI
IRR
Accounting rate of return<br>
slide9. © 2013 Cengage Learning. All Rights Reserved. May not be scanned, copied, duplicated, or posted to a publicly accessible website, in whole or in part. Cash Flow Cash Receipts
Revenues earned and collected
Savings generated by reducing operating costs
Proceeds from sale of assets
Cash Disbursements
Expenditures for asset acquisition
Working capital investments
Costs for direct material, direct labor, and overhead<br>
slide10. © 2013 Cengage Learning. All Rights Reserved. May not be scanned, copied, duplicated, or posted to a publicly accessible website, in whole or in part. Investment vs. Financing Investment decision
Which assets to acquire
Made by divisional managers and top management Financing decision
How to raise capital (debt/equity) to fund an investment
Made by treasurer and top management
Interest is a financing decision
Interest cost
Cash flow associated with debt financing
Not part of the project selection process First justify the acquisition.
Then justify how to finance it.<br>
slide11. © 2013 Cengage Learning. All Rights Reserved. May not be scanned, copied, duplicated, or posted to a publicly accessible website, in whole or in part. Payback Period Time required for project’s cash inflows to equal the original investment
The longer it takes to recover the original investment, the greater the risk
The faster capital is returned, the more rapidly it can be invested in other projects
Management sets a maximum payback period
Ignores
Cash inflows that occur after payback has been reached
Desired rate of return
Time value of money<br>
slide12. © 2013 Cengage Learning. All Rights Reserved. May not be scanned, copied, duplicated, or posted to a publicly accessible website, in whole or in part. Payback Period Illustration Original Investment
Annual Cash Inflows (assuming equal cash flows) Payback Period Example:
Original Investment $25,000
Annual Cash Inflows $10,000
Payback Period 2.5 years =<br>
slide13. © 2013 Cengage Learning. All Rights Reserved. May not be scanned, copied, duplicated, or posted to a publicly accessible website, in whole or in part. Discounting Future Cash Flows Reduce the future value (FV) of cash flows by the portion that represents interest
Variables are
Length of time until the cash flow is received or paid
Required rate of return on capital—discount rate
PV is stated in a common base of current dollars<br>
slide14. © 2013 Cengage Learning. All Rights Reserved. May not be scanned, copied, duplicated, or posted to a publicly accessible website, in whole or in part. Discount Rate and Returns Discount rate
Discount rate should equal or exceed the cost of capital
Cost of Capital—weighted average cost for the debt and equity that comprise a firm’s financial structure Return OF Capital
Recovery of the initial investment
Return ON Capital
Represents income
Original investment multiplied by the discount rate $100,000 * 12% =
$12,000 return on capital<br>
slide15. © 2013 Cengage Learning. All Rights Reserved. May not be scanned, copied, duplicated, or posted to a publicly accessible website, in whole or in part. Discounted Cash Flow Methods Net Present Value (NPV)
Profitability Index (PI)
Internal Rate of Return (IRR)<br>
slide16. © 2013 Cengage Learning. All Rights Reserved. May not be scanned, copied, duplicated, or posted to a publicly accessible website, in whole or in part. Net Present Value Evaluates if project rate of return is greater than, equal to, or less than the desired rate of return
PV equals the cash flows discounted using the desired rate of return
NPV equals PV of cash inflows minus PV of cash outflows
Does not calculate the rate of return Minus Investment made currently
Plus PV of future cash inflows or cost savings
Minus PV of future cash outflows
Equals NPV<br>
slide17. © 2013 Cengage Learning. All Rights Reserved. May not be scanned, copied, duplicated, or posted to a publicly accessible website, in whole or in part. Interpreting NPV NPV = 0
Actual rate of return equals desired rate of return
NPV > 0
Actual rate of return is greater than desired
rate of return
NPV < 0
Actual rate of return is less than desired
rate of return<br>
slide18. © 2013 Cengage Learning. All Rights Reserved. May not be scanned, copied, duplicated, or posted to a publicly accessible website, in whole or in part. Net Present Value Function of two factors
Discount rate
Amount and timing of cash flows
Useful to select best project among investments that can perform the same task or achieve the same objective
When comparing independent projects requiring different initial investments, use the PI<br>
slide19. © 2013 Cengage Learning. All Rights Reserved. May not be scanned, copied, duplicated, or posted to a publicly accessible website, in whole or in part. Profitability Index Compares PV of net cash flows to net investment
Measures efficiency of the use of capital
Should be greater than or equal to 1
Does not calculate the rate of return Profitability = PV of Net Cash Flows
Index Net Investment<br>
slide20. © 2013 Cengage Learning. All Rights Reserved. May not be scanned, copied, duplicated, or posted to a publicly accessible website, in whole or in part. Profitability Index Illustration Project 1 2
PV of net cash flows $900,000 $580,000
Net investment $720,000 $425,000
NPV $180,000 $155,000
PI
$900,000/$720,000 1.25
$580,000/$425,000 1.36 Assuming limited funds, which project would you choose?<br>
slide21. © 2013 Cengage Learning. All Rights Reserved. May not be scanned, copied, duplicated, or posted to a publicly accessible website, in whole or in part. Internal Rate of Return Discount rate where
PV of cash inflows = PV of cash outflows
NPV = 0
Hurdle rate is the lowest acceptable return on investment (at least equal to the cost of capital)
If IRR = Hurdle Rate; Accept
If IRR > Hurdle Rate; Accept
If IRR < Hurdle Rate; Reject
Computed using
Financial calculators
Computers
Annuity tables (assuming equal cash flows)
Trial and error<br>
slide22. © 2013 Cengage Learning. All Rights Reserved. May not be scanned, copied, duplicated, or posted to a publicly accessible website, in whole or in part. Income Taxes An integral part of the business planning and decision-making process
Operating income is taxed, which reduces the cash inflows from projects
Depreciation reduces operating income, which reduces the taxes paid<br>
slide23. © 2013 Cengage Learning. All Rights Reserved. May not be scanned, copied, duplicated, or posted to a publicly accessible website, in whole or in part. After-Tax Cash Flows Depreciation is not a cash flow item
Depreciation on capital assets affects cash flows by reducing the tax obligation
Depreciation is a tax shield that provides a tax benefit Depreciation tax benefit = Depreciation expense * Tax rate<br>
slide24. © 2013 Cengage Learning. All Rights Reserved. May not be scanned, copied, duplicated, or posted to a publicly accessible website, in whole or in part. Tax Depreciation Deprecation tax shield is affected by
Changes in tax laws
Different depreciation methods
Changes in tax rates<br>
slide25. © 2013 Cengage Learning. All Rights Reserved. May not be scanned, copied, duplicated, or posted to a publicly accessible website, in whole or in part. Capital Budgeting Methods Understand similarities and differences of capital budgeting methods
Use several techniques
Limitations of all methods
Management preferences regarding timing of cash flows are not included
Single, deterministic measures of cash flow are used rather than probabilities<br>
slide26. © 2013 Cengage Learning. All Rights Reserved. May not be scanned, copied, duplicated, or posted to a publicly accessible website, in whole or in part. Payback Assumptions
Speedy recovery of investment is key
Cash flows can be accurately predicted
Risk is lower for the shorter payback project Limitations
Ignores cash flows after payback
Cash flow and project life are deterministic, not subject to probabilities
Ignores time value of money
Does not consider recognized cash flow pattern preferences<br>
slide27. © 2013 Cengage Learning. All Rights Reserved. May not be scanned, copied, duplicated, or posted to a publicly accessible website, in whole or in part. Net Present Value Assumptions
Discount rate is valid
Timing and size of cash flows can be predicted
Life of project can be predicted
If shorter-lived project is selected, proceeds of shorter project will earn the discount rate through theoretical completion of longer project Limitations
Cash flow and project life are deterministic, not subject to probabilities
Alternative project rates of return are not known
Does not consider recognized cash flow pattern preferences
IRR on project is not reflected<br>
slide28. © 2013 Cengage Learning. All Rights Reserved. May not be scanned, copied, duplicated, or posted to a publicly accessible website, in whole or in part. Profitability Index Assumptions (same as NPV)
Measures efficient use of capital
Discount rate is valid
Timing and size of cash flows can be predicted
Life of project can be predicted
If shorter project selected, proceeds of shorter project will earn the discount rate through theoretical completion of longer project Limitations (same as NPV)
Cash flow and project life are deterministic, not subject to probabilities
Alternative project rates of return are not known
Does not consider cash flow pattern preferences
IRR on project is not reflected
A relative answer is given but dollars of NPV are not reflected<br>
slide29. © 2013 Cengage Learning. All Rights Reserved. May not be scanned, copied, duplicated, or posted to a publicly accessible website, in whole or in part. Internal Rate of Return Assumptions
Hurdle rate is valid
Timing and size of cash flows can be predicted
Project life can be predicted
If shorter project selected, proceeds of shorter project will continue to earn the IRR through theoretical completion of longer project Limitations
Projects are ranked by IRR and not dollar size
NPV dollars are not reflected
Cash flow and project life are deterministic, not subject to probabilities
Does not consider cash flow pattern preferences
Multiple rates of return can be calculated on the same project<br>
slide30. © 2013 Cengage Learning. All Rights Reserved. May not be scanned, copied, duplicated, or posted to a publicly accessible website, in whole or in part. Comparing Techniques *often used as a hurdle rate<br>
slide31. © 2013 Cengage Learning. All Rights Reserved. May not be scanned, copied, duplicated, or posted to a publicly accessible website, in whole or in part. The Investment Decision Is the activity worthy of an investment?
Which assets can be used for the activity?
Of the available assets for each activity, which is the best investment?
Of the “best investments” for all worthwhile activities, in which ones should the company invest? Consider Quantitative and Qualitative Factors<br>
slide32. © 2013 Cengage Learning. All Rights Reserved. May not be scanned, copied, duplicated, or posted to a publicly accessible website, in whole or in part. Capital Budgeting Terms Screening decision
Preference decision
Mutually exclusive projects
Independent projects
Mutually inclusive projects<br>
slide33. © 2013 Cengage Learning. All Rights Reserved. May not be scanned, copied, duplicated, or posted to a publicly accessible website, in whole or in part. Ranking Capital Projects For the projects under consideration
NPV is nonnegative
PI of 1 or more
IRR equals or exceeds hurdle rate
Selection ranking of multiple projects
Results can vary depending on evaluation techniques and whether dollars or percentages are used<br>
slide34. © 2013 Cengage Learning. All Rights Reserved. May not be scanned, copied, duplicated, or posted to a publicly accessible website, in whole or in part. Reinvestment Assumptions NPV and PI assume that released cash flows are reinvested at the discount rate
At least the cost of capital
IRR assumes that released cash flows are reinvested at the expected IRR
Could be substantially different than the cost of capital<br>
slide35. © 2013 Cengage Learning. All Rights Reserved. May not be scanned, copied, duplicated, or posted to a publicly accessible website, in whole or in part. NPV Compared to IRR More realistic reinvestment assumption
Results measured in dollars not rates<br>
slide36. © 2013 Cengage Learning. All Rights Reserved. May not be scanned, copied, duplicated, or posted to a publicly accessible website, in whole or in part. Compensating for Risk (slide 1 of 2) Judgmental method
Use logic and reasoning to decide if acceptable rate of return will be achieved
Risk-adjusted discount rate method
Higher discount/hurdle rate for riskier projects and/or cash flows
Shorter payback period for riskier projects
Higher IRR for riskier projects
Sensitivity analysis<br>
slide37. © 2013 Cengage Learning. All Rights Reserved. May not be scanned, copied, duplicated, or posted to a publicly accessible website, in whole or in part. Compensating for Risk (slide 2 of 2) Sensitivity Analysis—the amount of change that must occur in a variable before a different decision would be made
Discount rate—What increases could occur in the cost of capital and related discount rate before a project becomes unacceptable?
Cash flows—How small can the net cash inflows be before a project becomes undesirable?
Asset life—What is the minimum time the cash flows must be received for the project to remain acceptable?<br>
slide38. © 2013 Cengage Learning. All Rights Reserved. May not be scanned, copied, duplicated, or posted to a publicly accessible website, in whole or in part. Post-Investment Audit Complete after project has stabilized
Compare actual results to expected results
Use same analysis techniques
Identify areas where results differ from expectation
Evaluate capital budgeting process, particularly original projections, problems with implementation, sponsor credibility<br>
slide39. © 2013 Cengage Learning. All Rights Reserved. May not be scanned, copied, duplicated, or posted to a publicly accessible website, in whole or in part. Time Value of Money (Appendix 1) Future value (FV) and present value (PV) depend on
Amount of cash flow
Rate of interest
Timing of cash flow
Simple vs. compound interest
Single cash flow
Annuity
Ordinary annuity or annuity due<br>
slide40. © 2013 Cengage Learning. All Rights Reserved. May not be scanned, copied, duplicated, or posted to a publicly accessible website, in whole or in part. Accounting Rate of Return Measures rate of return on earnings for average capital investment over project’s life
Consistent with accounting model
Uses profits shown on accrual-based financial statements
Not based on cash flows Accounting = Average Annual Profits
Rate of Return Average Investment<br>
slide41. © 2013 Cengage Learning. All Rights Reserved. May not be scanned, copied, duplicated, or posted to a publicly accessible website, in whole or in part. Questions Why do most capital budgeting methods focus on cash flows?
What is the relationship between the NPV and the PI?
What are the assumptions and limitations of the various capital project evaluation methods?<br>
slide42. © 2013 Cengage Learning. All Rights Reserved. May not be scanned, copied, duplicated, or posted to a publicly accessible website, in whole or in part. Potential Ethical Issues Ignoring enhanced safety or detrimental environmental impact for project decisions
Changing assumptions or estimates to meet criteria for approval
Using a discount rate that is inappropriately low
Not conducting a post-investment audit to hold decision makers accountable
Choosing projects based on accounting earnings only rather than including discounted cash flow methods<br>