
303.5: Ecological Modelling Theoretical Models


Description: 303.5: Ecological Modelling Theoretical Models (Predator-Prey Dymanics) The Lotka-Volterra model for predator-prey (or herbivore-plant, or parasitoid-host) dynamics deals with one predator population, one prey population in its simplest
Related Topics
Download Presentation
"303.5: Ecological Modelling Theoretical Models" is the property of its rightful owner. Permission is granted to download and print the materials on this website for personal, non-commercial use only, and to display it on your personal computer provided you do not modify the materials and that you retain all copyright notices contained in the materials. By downloading content from our website, you accept the terms of this agreement.
Presentation Transcript
slide1. 303.5: Ecological Modelling Theoretical Models (Predator-Prey Dymanics)<br>
slide2. The Lotka-Volterra model for predator-prey (or herbivore-plant, or parasitoid-host) dynamics deals with one predator population, one prey population in its simplest case
It was developed independently by Alfred Lotka and Vito Volterra in the 1920's
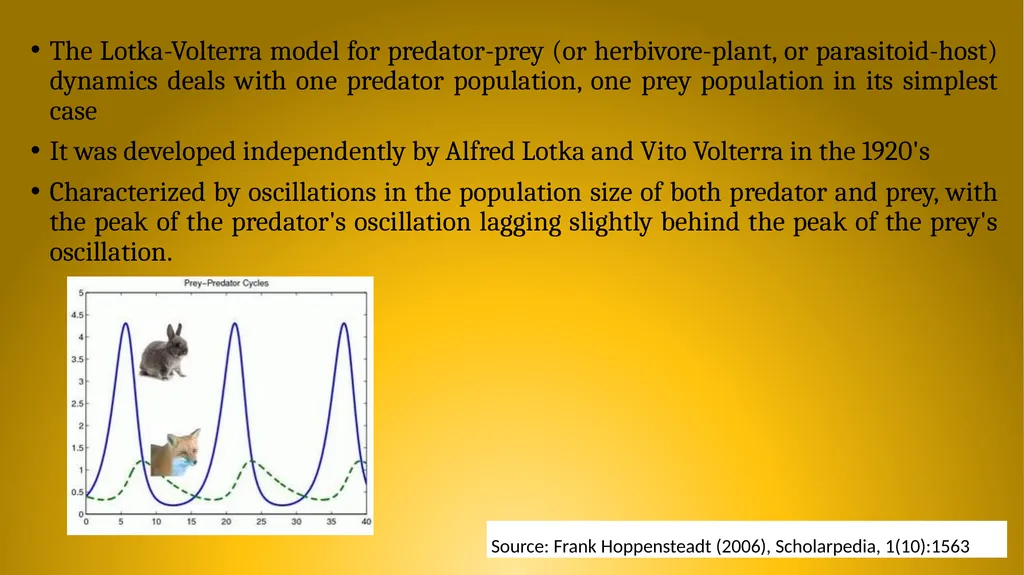
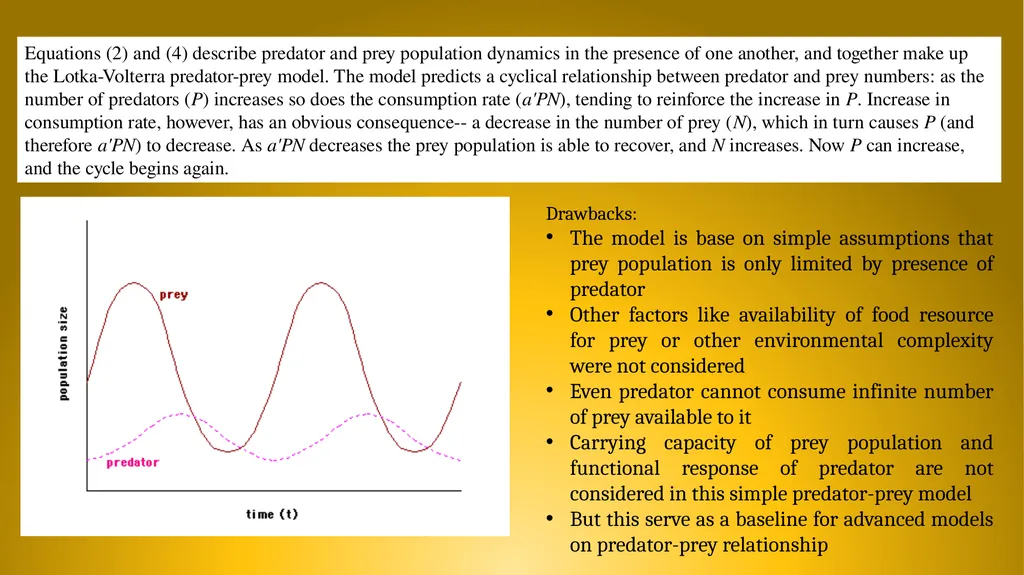
Characterized by oscillations in the population size of both predator and prey, with the peak of the predator's oscillation lagging slightly behind the peak of the prey's oscillation.<br>
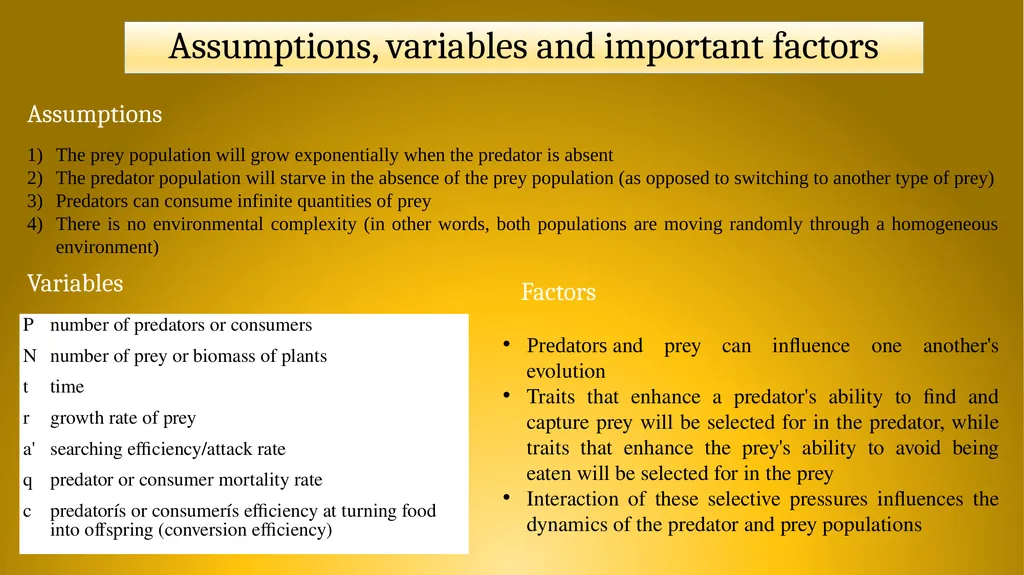
slide3. Assumptions, variables and important factors The prey population will grow exponentially when the predator is absent
The predator population will starve in the absence of the prey population (as opposed to switching to another type of prey)
Predators can consume infinite quantities of prey
There is no environmental complexity (in other words, both populations are moving randomly through a homogeneous environment) Variables Assumptions Predators and prey can influence one another's evolution
Traits that enhance a predator's ability to find and capture prey will be selected for in the predator, while traits that enhance the prey's ability to avoid being eaten will be selected for in the prey
Interaction of these selective pressures influences the dynamics of the predator and prey populations Factors<br>
slide4. In absence of prey, i.e. food resource the predator population is expected to decline exponentially. The dynamics of predator population can be mathematically expressed as: In the presence of prey, however, this decline is opposed by the predator birth rate, ca’PN, which is determined by the consumption rate (a’PN, which is the attack rate[a'] multiplied by the product of the number of predators [P] times the number of prey [N]) and by the predator’s ability to turn food into offspring (c). As predator and prey numbers (P and N, respectively) increase, their encounters become more frequent, but the actual rate of consumption will depend on the attack rate (aí). The equation describing the predator population dynamics becomes Equation 1 Equation 2 The product ca'P is the predator's numerical response, or the per capita increase as a function of prey abundance. The entire term, ca'PN, tells us that increases in the predator population are proportional to the product of predator and prey abundance.<br>
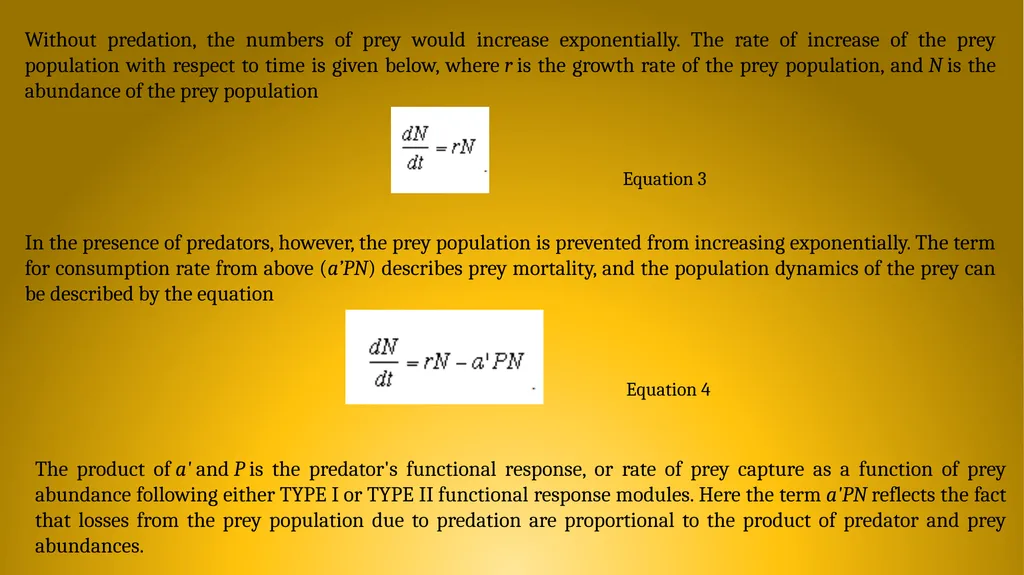
slide5. Without predation, the numbers of prey would increase exponentially. The rate of increase of the prey population with respect to time is given below, where r is the growth rate of the prey population, and N is the abundance of the prey population Equation 3 In the presence of predators, however, the prey population is prevented from increasing exponentially. The term for consumption rate from above (a’PN) describes prey mortality, and the population dynamics of the prey can be described by the equation Equation 4 The product of a' and P is the predator's functional response, or rate of prey capture as a function of prey abundance following either TYPE I or TYPE II functional response modules. Here the term a'PN reflects the fact that losses from the prey population due to predation are proportional to the product of predator and prey abundances.<br>
slide6. Equations (2) and (4) describe predator and prey population dynamics in the presence of one another, and together make up the Lotka-Volterra predator-prey model. The model predicts a cyclical relationship between predator and prey numbers: as the number of predators (P) increases so does the consumption rate (a'PN), tending to reinforce the increase in P. Increase in consumption rate, however, has an obvious consequence-- a decrease in the number of prey (N), which in turn causes P (and therefore a'PN) to decrease. As a'PN decreases the prey population is able to recover, and N increases. Now P can increase, and the cycle begins again. Drawbacks:
The model is base on simple assumptions that prey population is only limited by presence of predator
Other factors like availability of food resource for prey or other environmental complexity were not considered
Even predator cannot consume infinite number of prey available to it
Carrying capacity of prey population and functional response of predator are not considered in this simple predator-prey model
But this serve as a baseline for advanced models on predator-prey relationship<br>
slide7. Functional response of a predator Functional responses describe the relationship between an individual’s rate of consumption and food density
TYPE I:
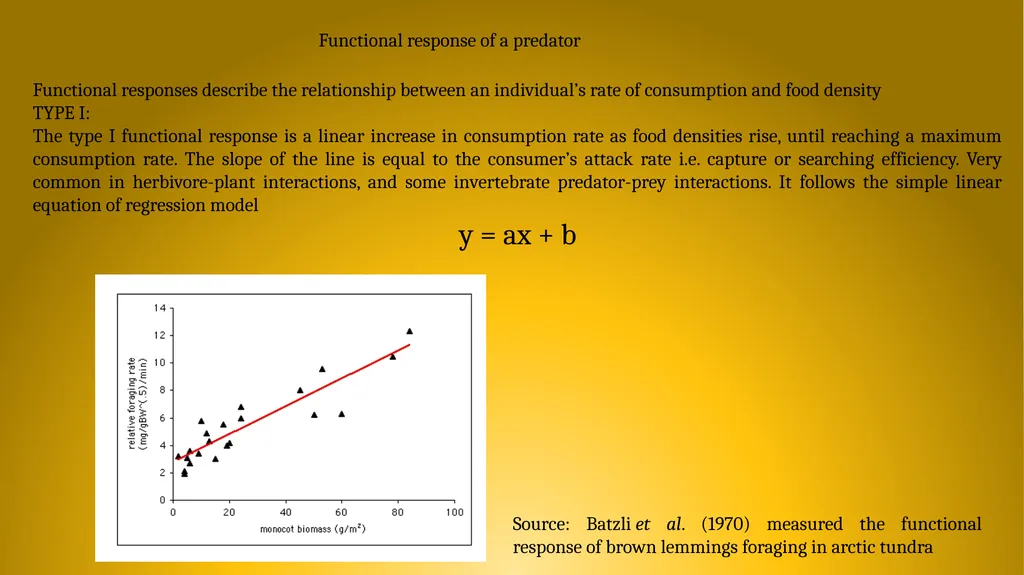
The type I functional response is a linear increase in consumption rate as food densities rise, until reaching a maximum consumption rate. The slope of the line is equal to the consumer’s attack rate i.e. capture or searching efficiency. Very common in herbivore-plant interactions, and some invertebrate predator-prey interactions. It follows the simple linear equation of regression model
y = ax + b Source: Batzli et al. (1970) measured the functional response of brown lemmings foraging in arctic tundra<br>
slide8. Functional response of a predator Functional responses describe the relationship between an individual’s rate of consumption and food density
TYPE II:
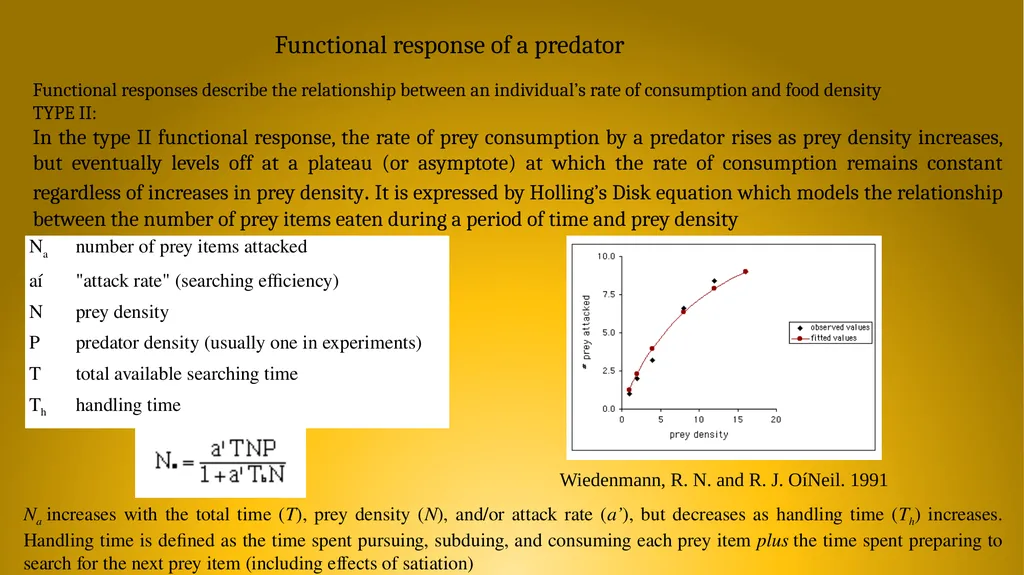
In the type II functional response, the rate of prey consumption by a predator rises as prey density increases, but eventually levels off at a plateau (or asymptote) at which the rate of consumption remains constant regardless of increases in prey density. It is expressed by Holling’s Disk equation which models the relationship between the number of prey items eaten during a period of time and prey density Na increases with the total time (T), prey density (N), and/or attack rate (a’), but decreases as handling time (Th) increases. Handling time is defined as the time spent pursuing, subduing, and consuming each prey item plus the time spent preparing to search for the next prey item (including effects of satiation) Wiedenmann, R. N. and R. J. OíNeil. 1991<br>
slide9. References http://www.nimbios.org/~gross/bioed/bealsmodules/holling.html
http://www.nimbios.org/~gross/bioed/bealsmodules/functional1.html
http://www.nimbios.org/~gross/bioed/bealsmodules/predator-prey.html
Wiedenmann, R. N. and R. J. OíNeil. 1991. Laboratory measurement of the functional response of Podisus maculiventris (Say) (Heteroptera: Pentatomidae). Environmental Entomology 20(2):610-614.
Holling, C. S. 1959. Some characteristics of simple types of predation and parasitism. Canadian Entomologist 91:385-398.
Begon, M., J. L. Harper, and C. R. Townsend. 1996. Ecology: Individuals, Populations, and Communities, 3rd edition. Blackwell Science Ltd., Cambridge, MA.
Batzli, G. O., H.-J. G. Jung, and G. Guntenspergen. 1981. Nutritional ecology of microtine rodents: linear foraging-rate curves for brown lemmings. Oikos 37:112-116.<br>
slide2. The Lotka-Volterra model for predator-prey (or herbivore-plant, or parasitoid-host) dynamics deals with one predator population, one prey population in its simplest case
It was developed independently by Alfred Lotka and Vito Volterra in the 1920's
Characterized by oscillations in the population size of both predator and prey, with the peak of the predator's oscillation lagging slightly behind the peak of the prey's oscillation.<br>
slide3. Assumptions, variables and important factors The prey population will grow exponentially when the predator is absent
The predator population will starve in the absence of the prey population (as opposed to switching to another type of prey)
Predators can consume infinite quantities of prey
There is no environmental complexity (in other words, both populations are moving randomly through a homogeneous environment) Variables Assumptions Predators and prey can influence one another's evolution
Traits that enhance a predator's ability to find and capture prey will be selected for in the predator, while traits that enhance the prey's ability to avoid being eaten will be selected for in the prey
Interaction of these selective pressures influences the dynamics of the predator and prey populations Factors<br>
slide4. In absence of prey, i.e. food resource the predator population is expected to decline exponentially. The dynamics of predator population can be mathematically expressed as: In the presence of prey, however, this decline is opposed by the predator birth rate, ca’PN, which is determined by the consumption rate (a’PN, which is the attack rate[a'] multiplied by the product of the number of predators [P] times the number of prey [N]) and by the predator’s ability to turn food into offspring (c). As predator and prey numbers (P and N, respectively) increase, their encounters become more frequent, but the actual rate of consumption will depend on the attack rate (aí). The equation describing the predator population dynamics becomes Equation 1 Equation 2 The product ca'P is the predator's numerical response, or the per capita increase as a function of prey abundance. The entire term, ca'PN, tells us that increases in the predator population are proportional to the product of predator and prey abundance.<br>
slide5. Without predation, the numbers of prey would increase exponentially. The rate of increase of the prey population with respect to time is given below, where r is the growth rate of the prey population, and N is the abundance of the prey population Equation 3 In the presence of predators, however, the prey population is prevented from increasing exponentially. The term for consumption rate from above (a’PN) describes prey mortality, and the population dynamics of the prey can be described by the equation Equation 4 The product of a' and P is the predator's functional response, or rate of prey capture as a function of prey abundance following either TYPE I or TYPE II functional response modules. Here the term a'PN reflects the fact that losses from the prey population due to predation are proportional to the product of predator and prey abundances.<br>
slide6. Equations (2) and (4) describe predator and prey population dynamics in the presence of one another, and together make up the Lotka-Volterra predator-prey model. The model predicts a cyclical relationship between predator and prey numbers: as the number of predators (P) increases so does the consumption rate (a'PN), tending to reinforce the increase in P. Increase in consumption rate, however, has an obvious consequence-- a decrease in the number of prey (N), which in turn causes P (and therefore a'PN) to decrease. As a'PN decreases the prey population is able to recover, and N increases. Now P can increase, and the cycle begins again. Drawbacks:
The model is base on simple assumptions that prey population is only limited by presence of predator
Other factors like availability of food resource for prey or other environmental complexity were not considered
Even predator cannot consume infinite number of prey available to it
Carrying capacity of prey population and functional response of predator are not considered in this simple predator-prey model
But this serve as a baseline for advanced models on predator-prey relationship<br>
slide7. Functional response of a predator Functional responses describe the relationship between an individual’s rate of consumption and food density
TYPE I:
The type I functional response is a linear increase in consumption rate as food densities rise, until reaching a maximum consumption rate. The slope of the line is equal to the consumer’s attack rate i.e. capture or searching efficiency. Very common in herbivore-plant interactions, and some invertebrate predator-prey interactions. It follows the simple linear equation of regression model
y = ax + b Source: Batzli et al. (1970) measured the functional response of brown lemmings foraging in arctic tundra<br>
slide8. Functional response of a predator Functional responses describe the relationship between an individual’s rate of consumption and food density
TYPE II:
In the type II functional response, the rate of prey consumption by a predator rises as prey density increases, but eventually levels off at a plateau (or asymptote) at which the rate of consumption remains constant regardless of increases in prey density. It is expressed by Holling’s Disk equation which models the relationship between the number of prey items eaten during a period of time and prey density Na increases with the total time (T), prey density (N), and/or attack rate (a’), but decreases as handling time (Th) increases. Handling time is defined as the time spent pursuing, subduing, and consuming each prey item plus the time spent preparing to search for the next prey item (including effects of satiation) Wiedenmann, R. N. and R. J. OíNeil. 1991<br>
slide9. References http://www.nimbios.org/~gross/bioed/bealsmodules/holling.html
http://www.nimbios.org/~gross/bioed/bealsmodules/functional1.html
http://www.nimbios.org/~gross/bioed/bealsmodules/predator-prey.html
Wiedenmann, R. N. and R. J. OíNeil. 1991. Laboratory measurement of the functional response of Podisus maculiventris (Say) (Heteroptera: Pentatomidae). Environmental Entomology 20(2):610-614.
Holling, C. S. 1959. Some characteristics of simple types of predation and parasitism. Canadian Entomologist 91:385-398.
Begon, M., J. L. Harper, and C. R. Townsend. 1996. Ecology: Individuals, Populations, and Communities, 3rd edition. Blackwell Science Ltd., Cambridge, MA.
Batzli, G. O., H.-J. G. Jung, and G. Guntenspergen. 1981. Nutritional ecology of microtine rodents: linear foraging-rate curves for brown lemmings. Oikos 37:112-116.<br>