
AIDC Working Session June 2016 1 Agenda Session
Description: AIDC Working Session June 2016 1 Agenda Session Purpose Steps Towards Implementation Identify challenges Discovery Phase Processes People Technology Capturing Value (ROI) Tangible Intangible 2 Operational Inefficiencies Challenges Manual
Related Topics
Download Presentation
"AIDC Working Session June 2016 1 Agenda Session" is the property of its rightful owner. Permission is granted to download and print the materials on this website for personal, non-commercial use only, and to display it on your personal computer provided you do not modify the materials and that you retain all copyright notices contained in the materials. By downloading content from our website, you accept the terms of this agreement.
Presentation Transcript
slide1. AIDC Working Session June 2016 1<br>
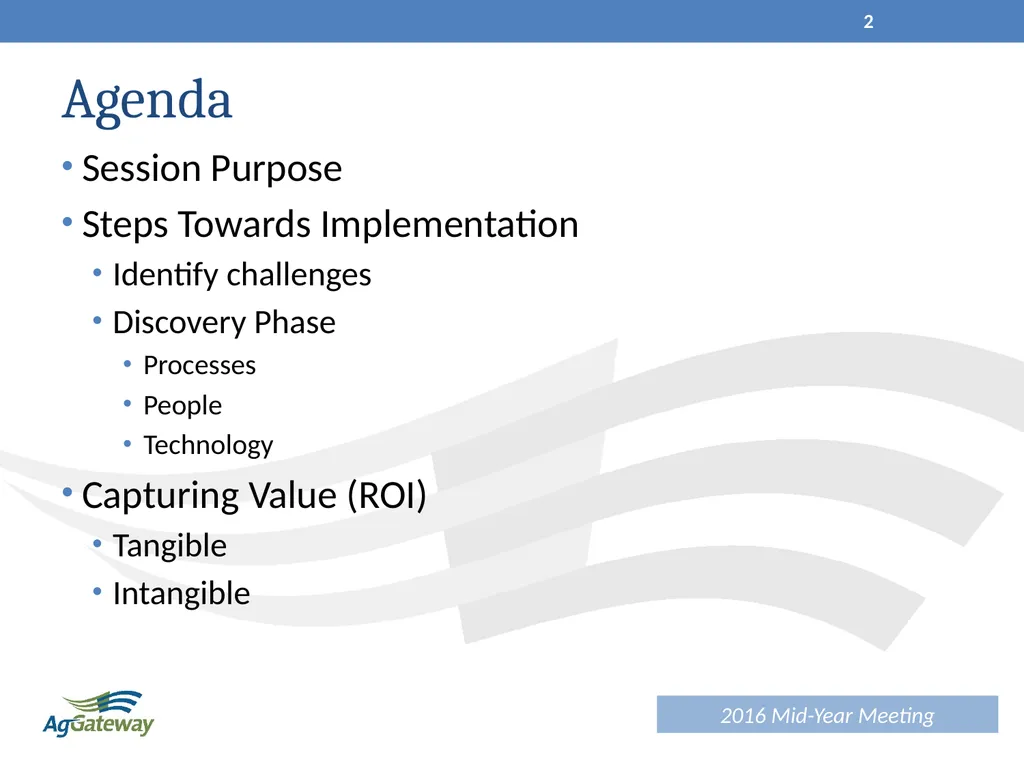
slide2. Agenda Session Purpose
Steps Towards Implementation
Identify challenges
Discovery Phase
Processes
People
Technology
Capturing Value (ROI)
Tangible
Intangible 2<br>
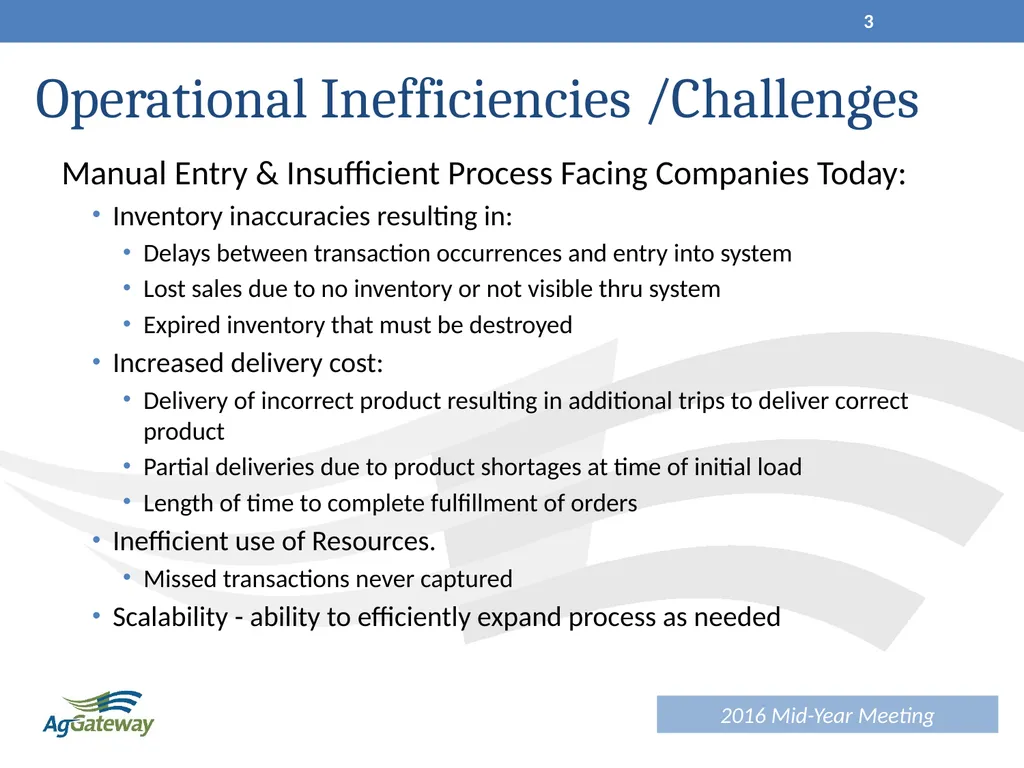
slide3. Operational Inefficiencies /Challenges Manual Entry & Insufficient Process Facing Companies Today:
Inventory inaccuracies resulting in:
Delays between transaction occurrences and entry into system
Lost sales due to no inventory or not visible thru system
Expired inventory that must be destroyed
Increased delivery cost:
Delivery of incorrect product resulting in additional trips to deliver correct product
Partial deliveries due to product shortages at time of initial load
Length of time to complete fulfillment of orders
Inefficient use of Resources.
Missed transactions never captured
Scalability - ability to efficiently expand process as needed 3<br>
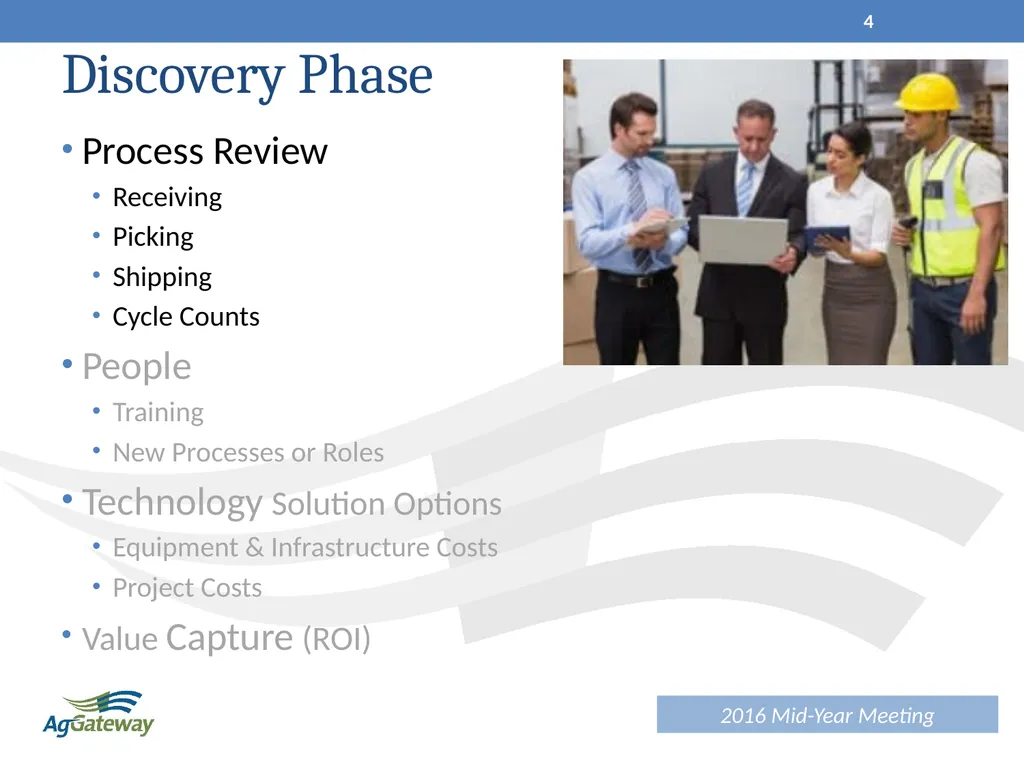
slide4. Discovery Phase Process Review
Receiving
Picking
Shipping
Cycle Counts
People
Training
New Processes or Roles
Technology Solution Options
Equipment & Infrastructure Costs
Project Costs
Value Capture (ROI) 4<br>
slide5. Interactive Group Activity 5<br>
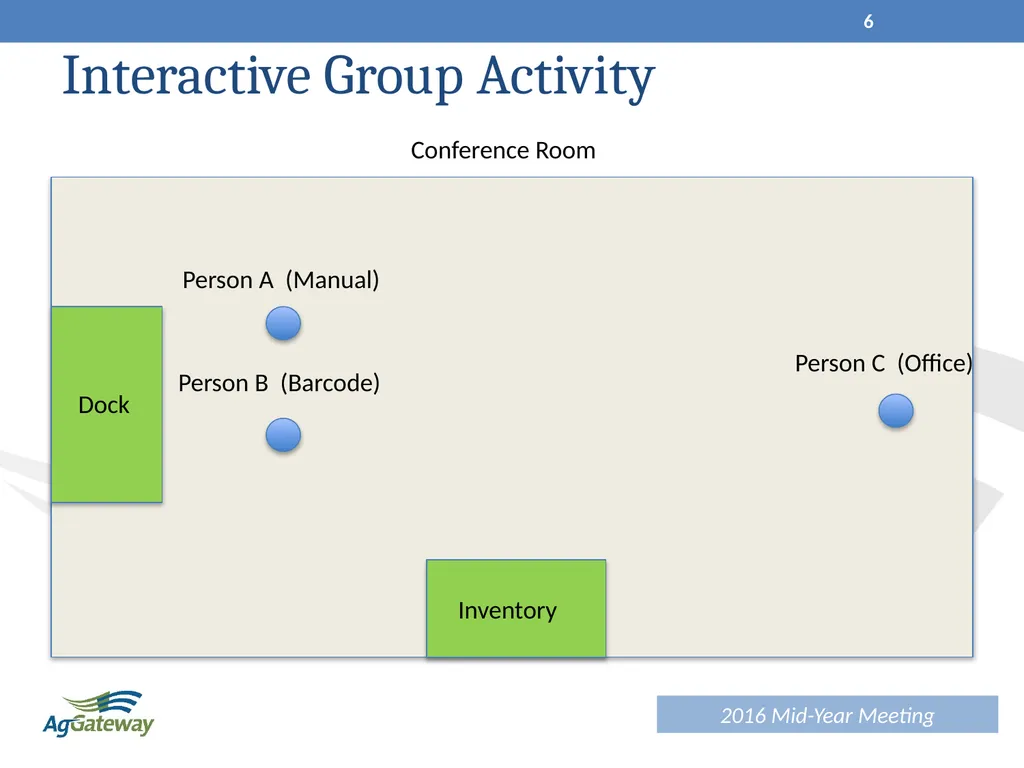
slide6. Interactive Group Activity Person A (Manual) Conference Room Person C (Office) Inventory Dock Person B (Barcode) 6<br>
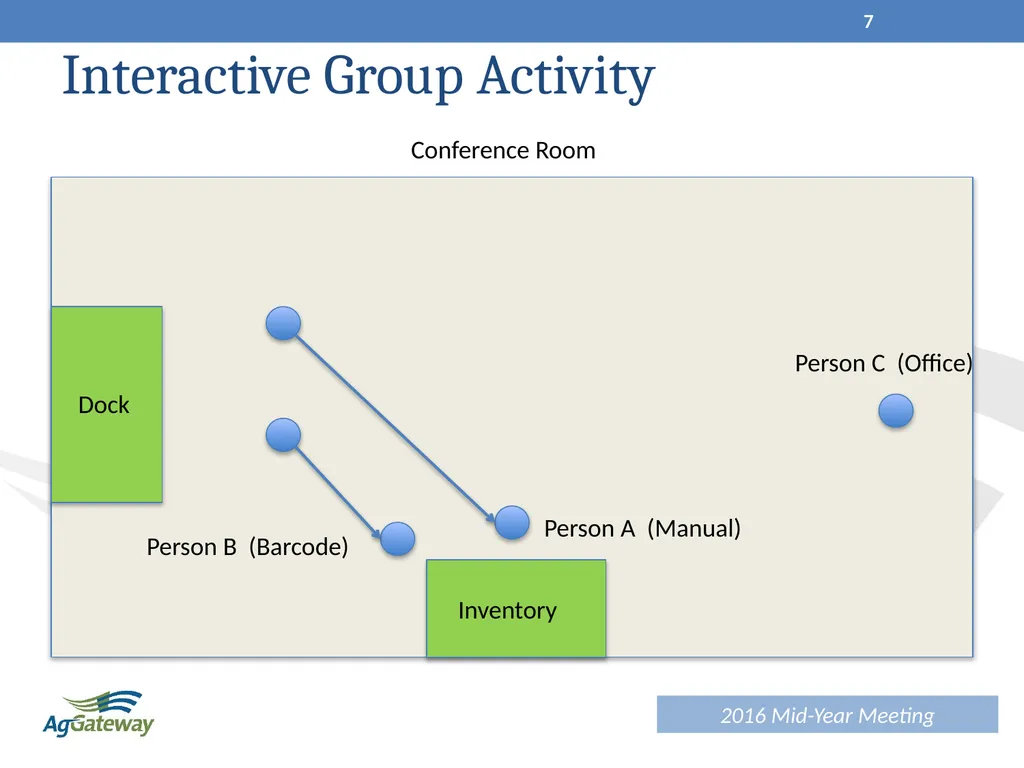
slide7. Interactive Group Activity Conference Room Person C (Office) Inventory Dock Person A (Manual) Person B (Barcode) 7<br>
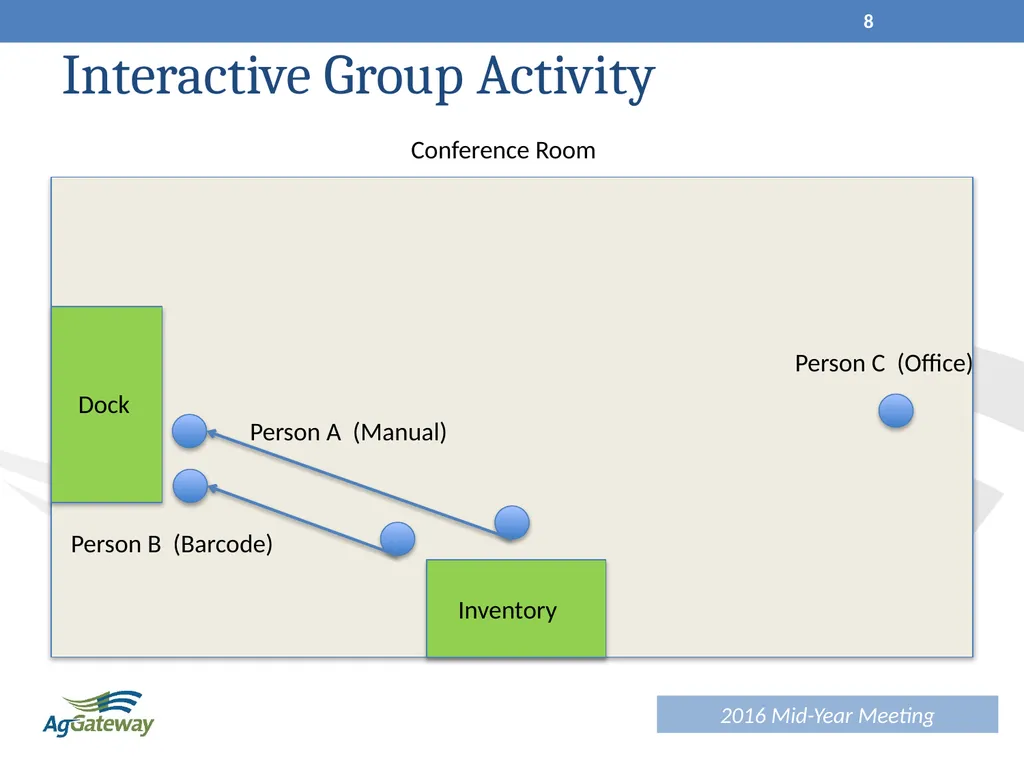
slide8. Interactive Group Activity Conference Room Person C (Office) Inventory Dock Person B (Barcode) Person A (Manual) 8<br>
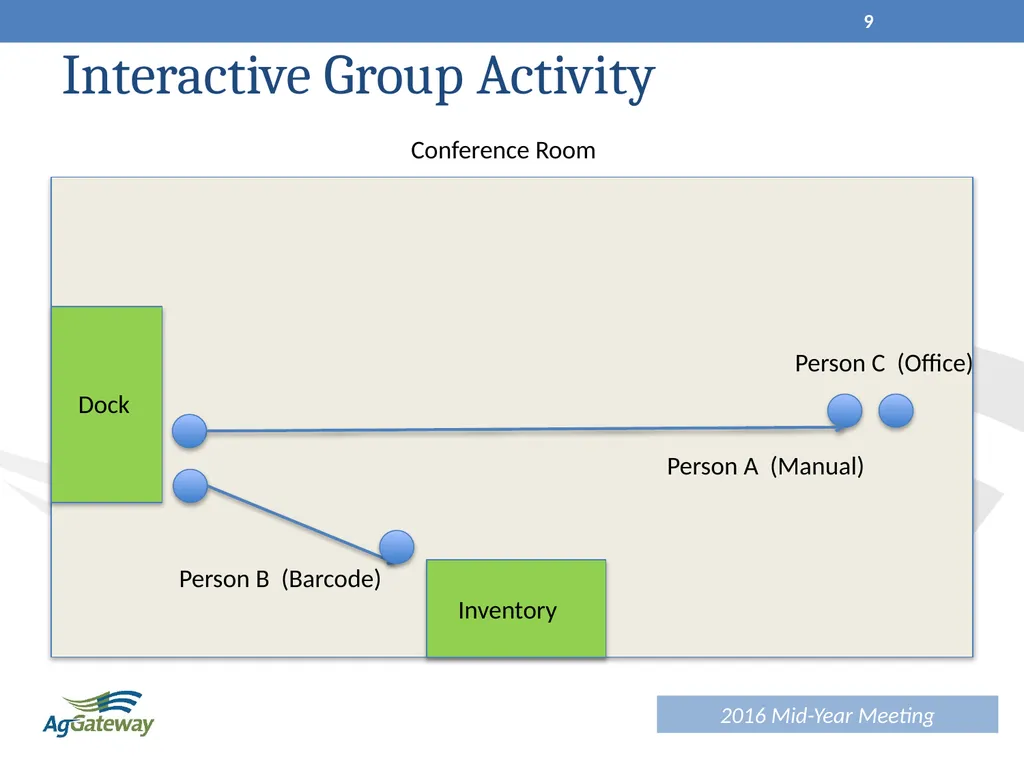
slide9. Interactive Group Activity Conference Room Person C (Office) Inventory Dock Person B (Barcode) Person A (Manual) 9<br>
slide10. Scenario Set Up Warehouse XYZ is experiencing an increase in delivery costs. Looking into the root cause, they realize they are often out of stock on many popular items, and also sometimes load incorrect products onto shipments causing additional deliveries to complete orders with the customer. They believe implementing a bar coding solution can reduce their delivery cost and improve the efficiency of their inventory processes.
Details to Consider:
Ship out of 1 warehouse that is approximately 80,000 sq. ft. with 6 dock doors
They have 20 full time floor employees and 2 back office employees that do data entry for the inventory movements.
They currently average 10 deliveries per day, and work approximately 250 days out of the year for a total of 2500 deliveries annually. 10<br>
slide11. Metrics Collection Warehouse XYZ, in coordination with their chosen Bar-Code vendor, begin to evaluate their current manual process KPI’s. Order and delivery process metrics are summarized by the warehouse manager.
Details to Consider:
Daily salable unit turnover through the warehouse is 1000 units.
Average annual orders shipped is 5000 per year, and 1% cannot be fulfilled due to inventory shortages.
Orders average a salable value of $2,000 each.
The warehouse’s amount of incorrect deliveries averages 3% of total deliveries annually. 11<br>
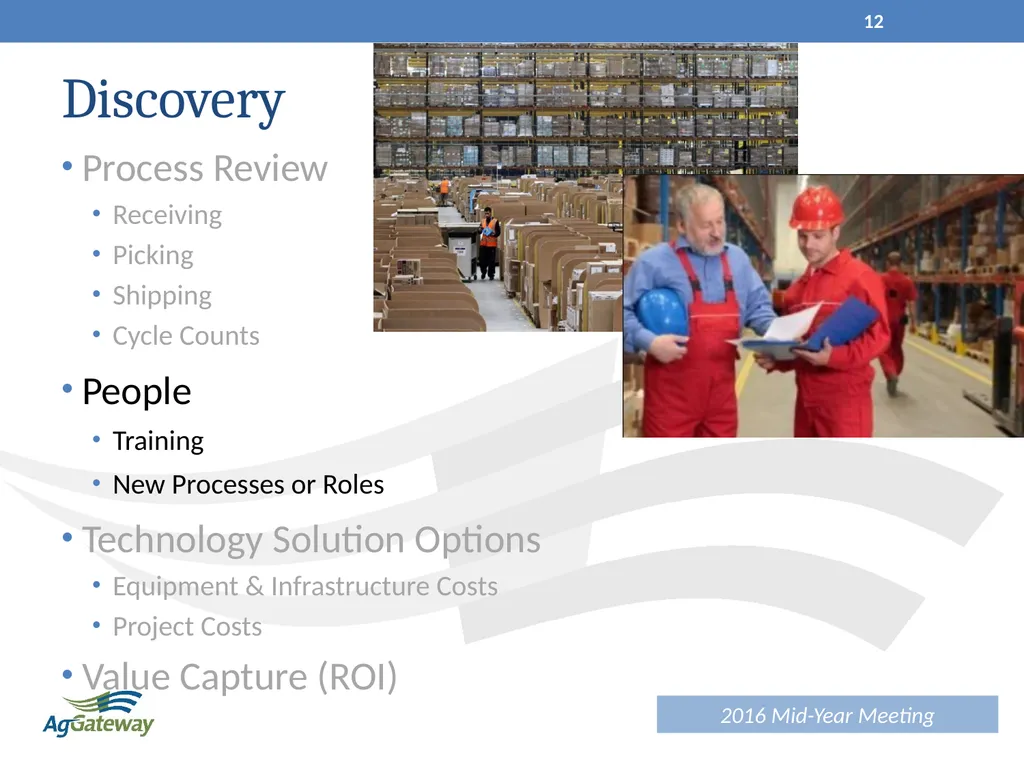
slide12. Discovery Process Review
Receiving
Picking
Shipping
Cycle Counts
People
Training
New Processes or Roles
Technology Solution Options
Equipment & Infrastructure Costs
Project Costs
Value Capture (ROI) 12<br>
slide13. Training XYZ and the vendor estimate that training the work force will take 8 hours to provide for the scanner process being considered. They will need to conduct training prior to the warehouse shifts in order to not disrupt daily business activities. Floor employee training will be done by the warehouse managers.
Estimated Cost for Training:
($3,000) – Vendor installation and warehouse manager training
($1,000) – Handout materials for floor employees
($4,089) - Overtime Pay for warehouse floor staff ( Back end staff can be trained during regular office hours)
_____________________________
Total: ($8,089) 13<br>
slide14. Material Tagging The way in which materials will be bar-coded depends on the methodology chosen:
Internally Tagged – The warehouse completes tagging of materials as they are received.
Vendor Printed Labels – A vendor is contracted to print the bar-codes directly on labels. More applicable for manufacturers.
Warehouse XYZ needs to tag incoming materials themselves, since none of their current suppliers bar-code their products.
Estimated cost for tagging materials:
($28,333) – One warehouse employee will need to perform this function for 70% of his/her time.
($5,000) – Annual cost of printing bar-codes for XYZ’s volume.
_____________________________
Total: ($33,333)
Note: This cost is mitigated for products that are already bar-coded from suppliers. 14<br>
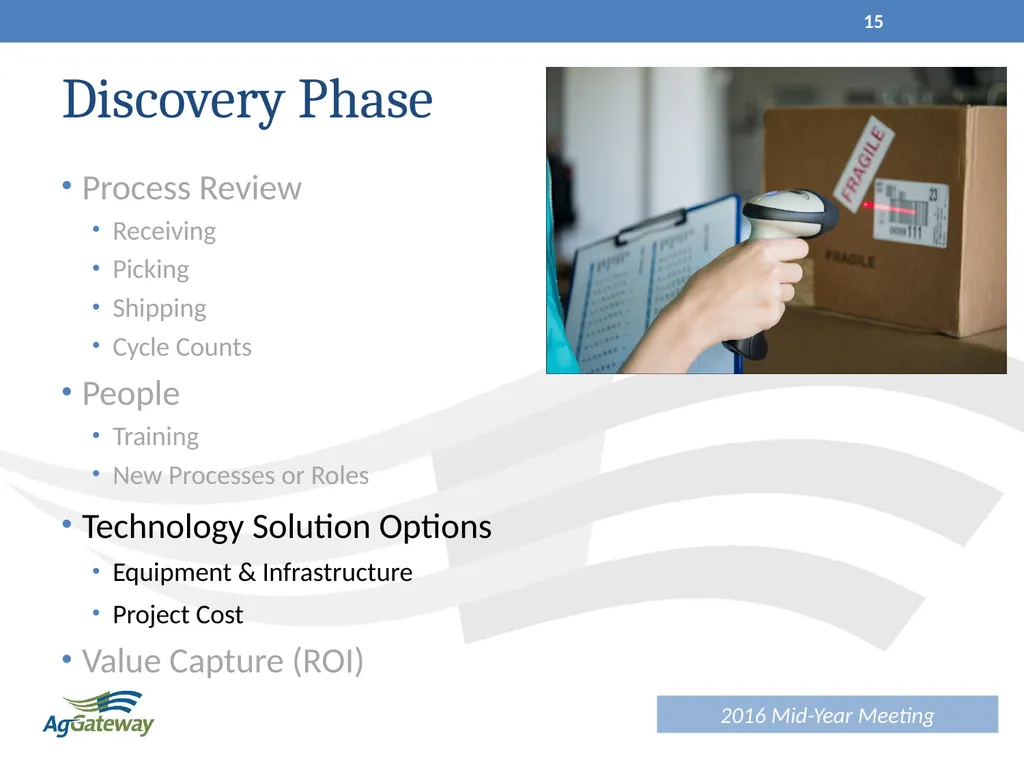
slide15. Discovery Phase Process Review
Receiving
Picking
Shipping
Cycle Counts
People
Training
New Processes or Roles
Technology Solution Options
Equipment & Infrastructure
Project Cost
Value Capture (ROI) 15<br>
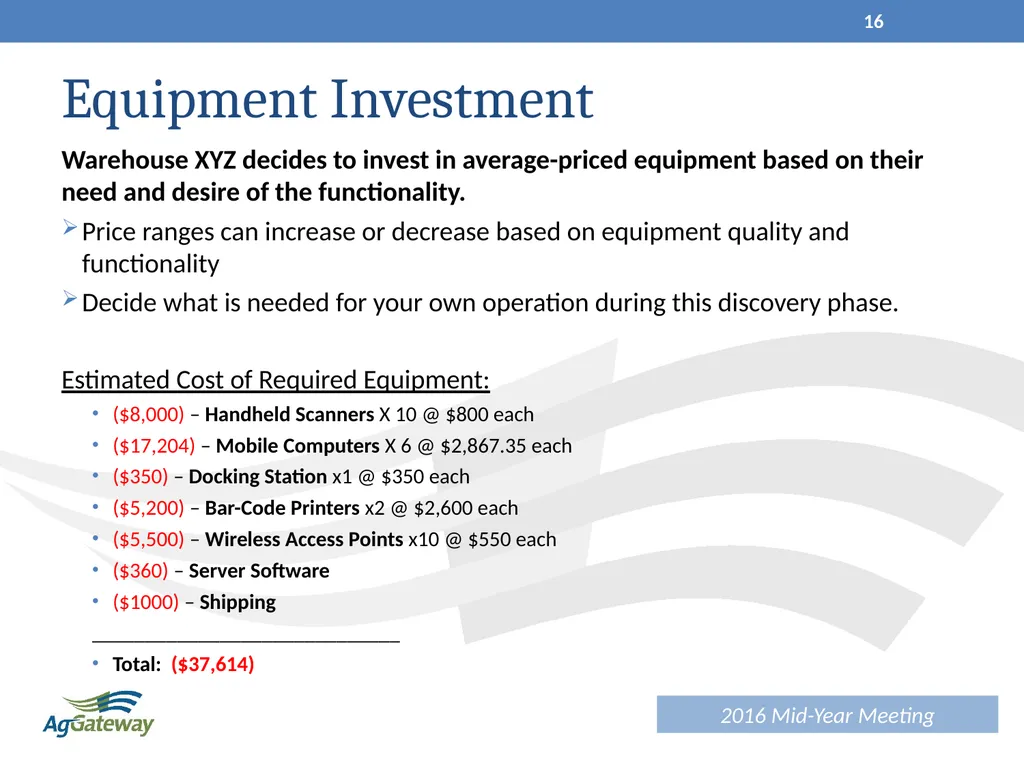
slide16. Equipment Investment Warehouse XYZ decides to invest in average-priced equipment based on their need and desire of the functionality.
Price ranges can increase or decrease based on equipment quality and functionality
Decide what is needed for your own operation during this discovery phase.
Estimated Cost of Required Equipment:
($8,000) – Handheld Scanners X 10 @ $800 each
($17,204) – Mobile Computers X 6 @ $2,867.35 each
($350) – Docking Station x1 @ $350 each
($5,200) – Bar-Code Printers x2 @ $2,600 each
($5,500) – Wireless Access Points x10 @ $550 each
($360) – Server Software
($1000) – Shipping
_____________________________
Total: ($37,614) 16<br>
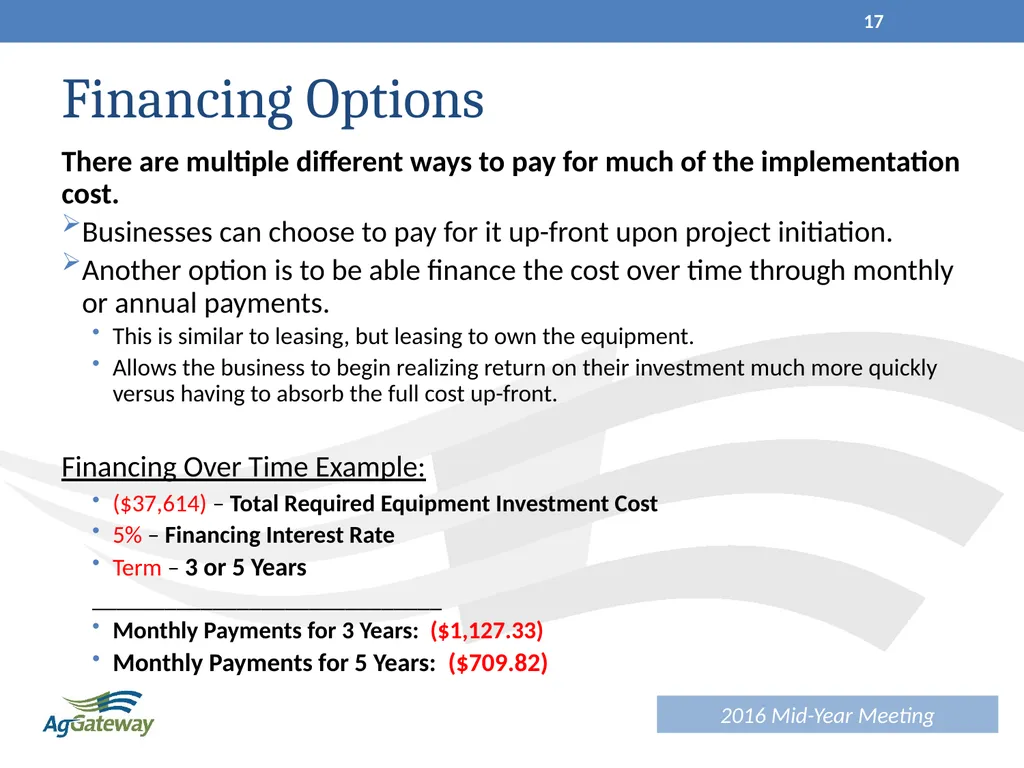
slide17. Financing Options There are multiple different ways to pay for much of the implementation cost.
Businesses can choose to pay for it up-front upon project initiation.
Another option is to be able finance the cost over time through monthly or annual payments.
This is similar to leasing, but leasing to own the equipment.
Allows the business to begin realizing return on their investment much more quickly versus having to absorb the full cost up-front.
Financing Over Time Example:
($37,614) – Total Required Equipment Investment Cost
5% – Financing Interest Rate
Term – 3 or 5 Years
_____________________________
Monthly Payments for 3 Years: ($1,127.33)
Monthly Payments for 5 Years: ($709.82) 17<br>
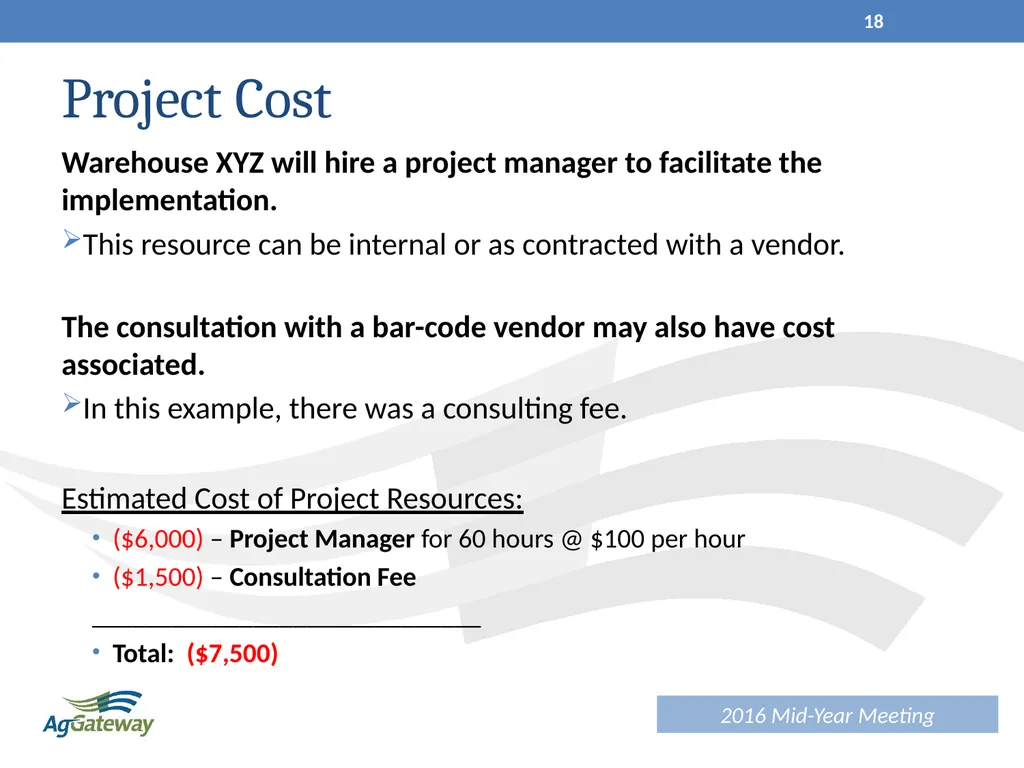
slide18. Project Cost Warehouse XYZ will hire a project manager to facilitate the implementation.
This resource can be internal or as contracted with a vendor.
The consultation with a bar-code vendor may also have cost associated.
In this example, there was a consulting fee.
Estimated Cost of Project Resources:
($6,000) – Project Manager for 60 hours @ $100 per hour
($1,500) – Consultation Fee
_____________________________
Total: ($7,500) 18<br>
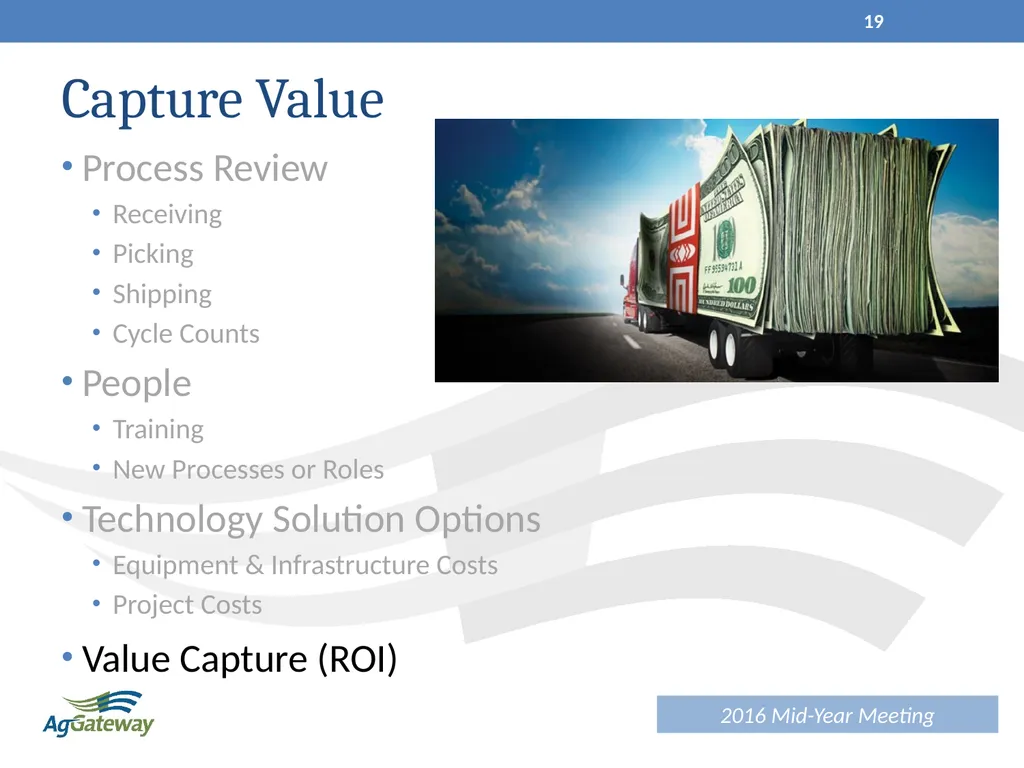
slide19. Capture Value Process Review
Receiving
Picking
Shipping
Cycle Counts
People
Training
New Processes or Roles
Technology Solution Options
Equipment & Infrastructure Costs
Project Costs
Value Capture (ROI) 19<br>
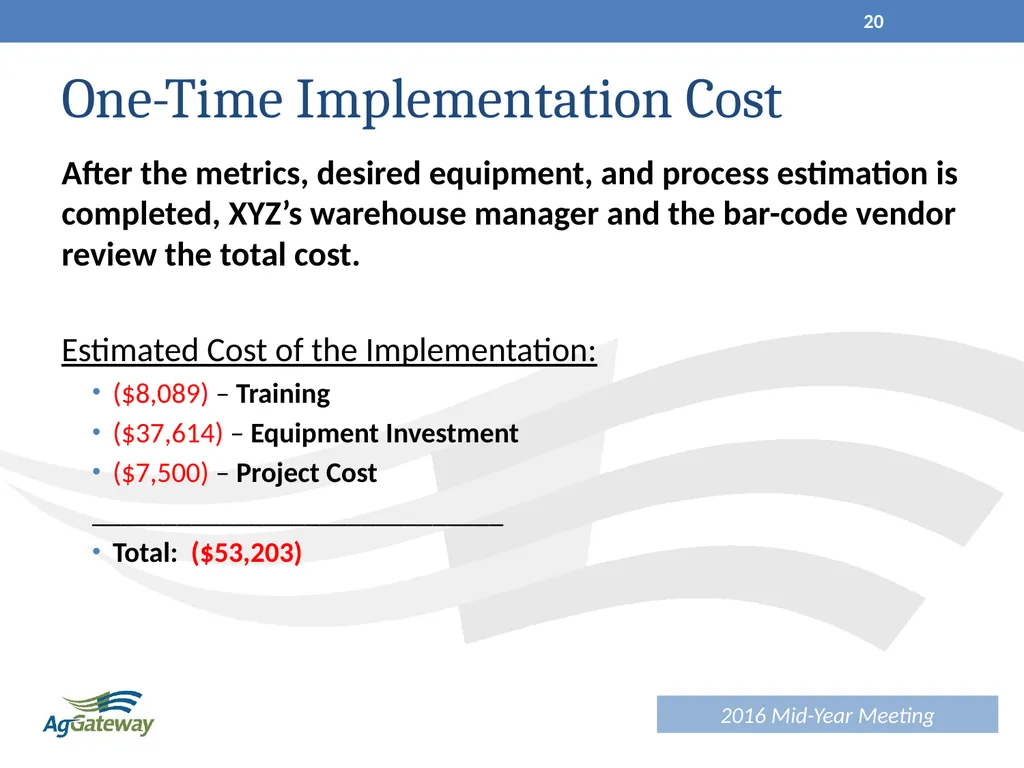
slide20. One-Time Implementation Cost After the metrics, desired equipment, and process estimation is completed, XYZ’s warehouse manager and the bar-code vendor review the total cost.
Estimated Cost of the Implementation:
($8,089) – Training
($37,614) – Equipment Investment
($7,500) – Project Cost
_____________________________
Total: ($53,203) 20<br>
slide21. WHY Implement? 21<br>
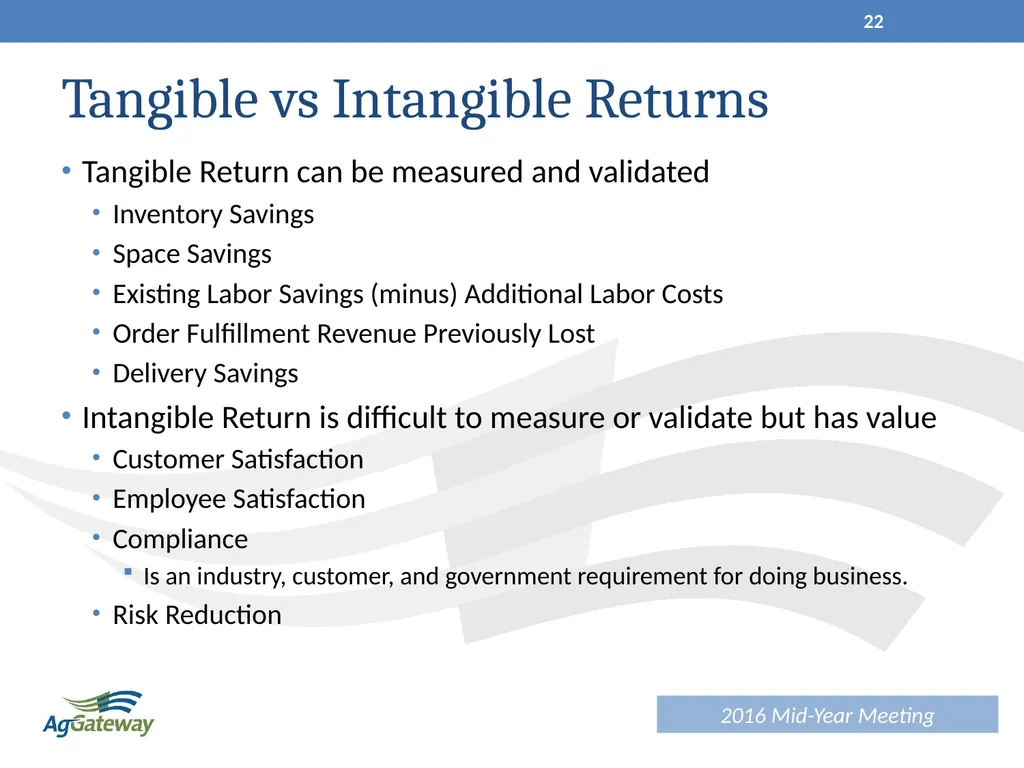
slide22. Tangible vs Intangible Returns Tangible Return can be measured and validated
Inventory Savings
Space Savings
Existing Labor Savings (minus) Additional Labor Costs
Order Fulfillment Revenue Previously Lost
Delivery Savings
Intangible Return is difficult to measure or validate but has value
Customer Satisfaction
Employee Satisfaction
Compliance
Is an industry, customer, and government requirement for doing business.
Risk Reduction 22<br>
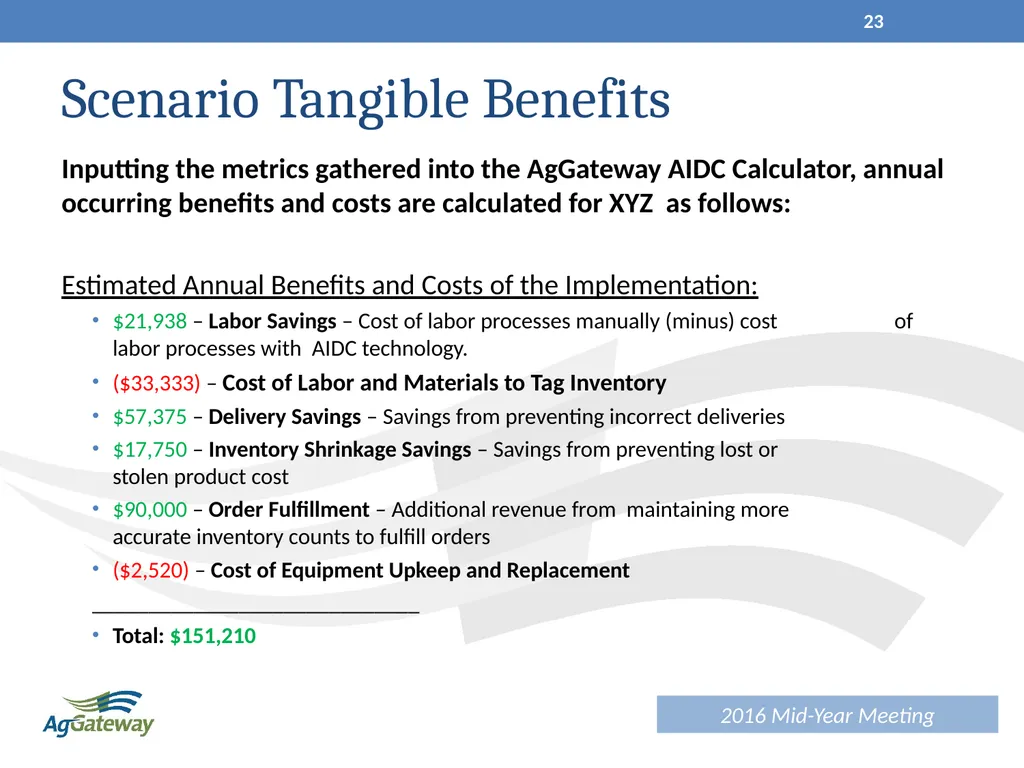
slide23. Scenario Tangible Benefits Inputting the metrics gathered into the AgGateway AIDC Calculator, annual occurring benefits and costs are calculated for XYZ as follows:
Estimated Annual Benefits and Costs of the Implementation:
$21,938 – Labor Savings – Cost of labor processes manually (minus) cost of labor processes with AIDC technology.
($33,333) – Cost of Labor and Materials to Tag Inventory
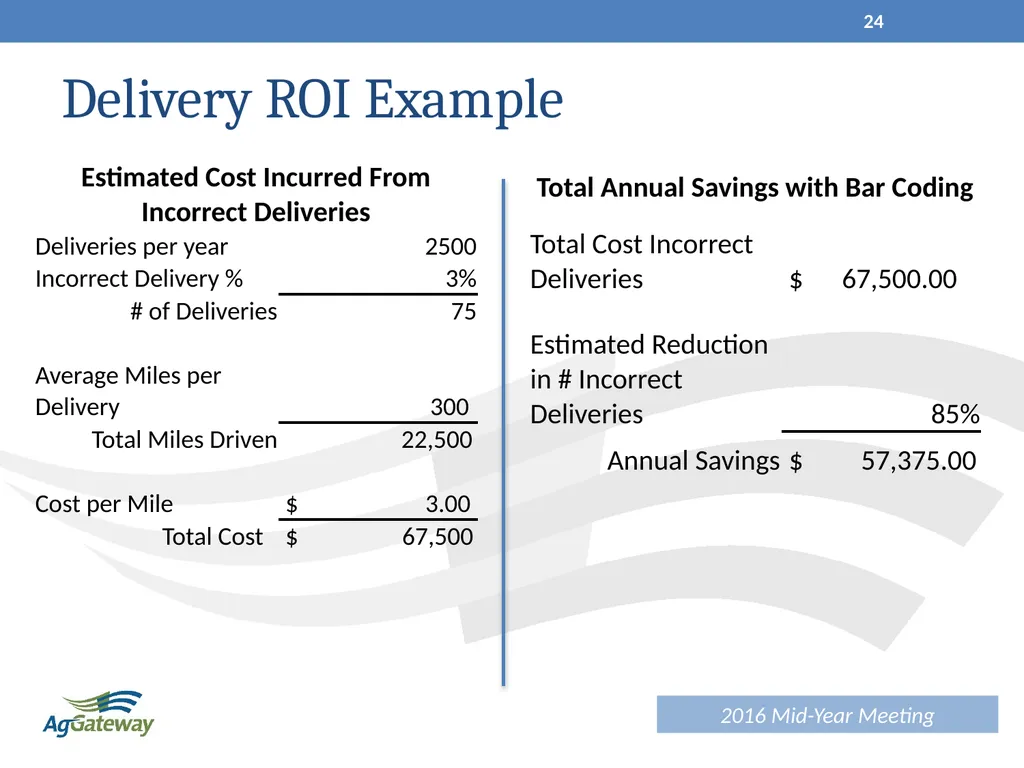
$57,375 – Delivery Savings – Savings from preventing incorrect deliveries
$17,750 – Inventory Shrinkage Savings – Savings from preventing lost or stolen product cost
$90,000 – Order Fulfillment – Additional revenue from maintaining more accurate inventory counts to fulfill orders
($2,520) – Cost of Equipment Upkeep and Replacement
_____________________________
Total: $151,210 23<br>
slide24. Delivery ROI Example 24<br>
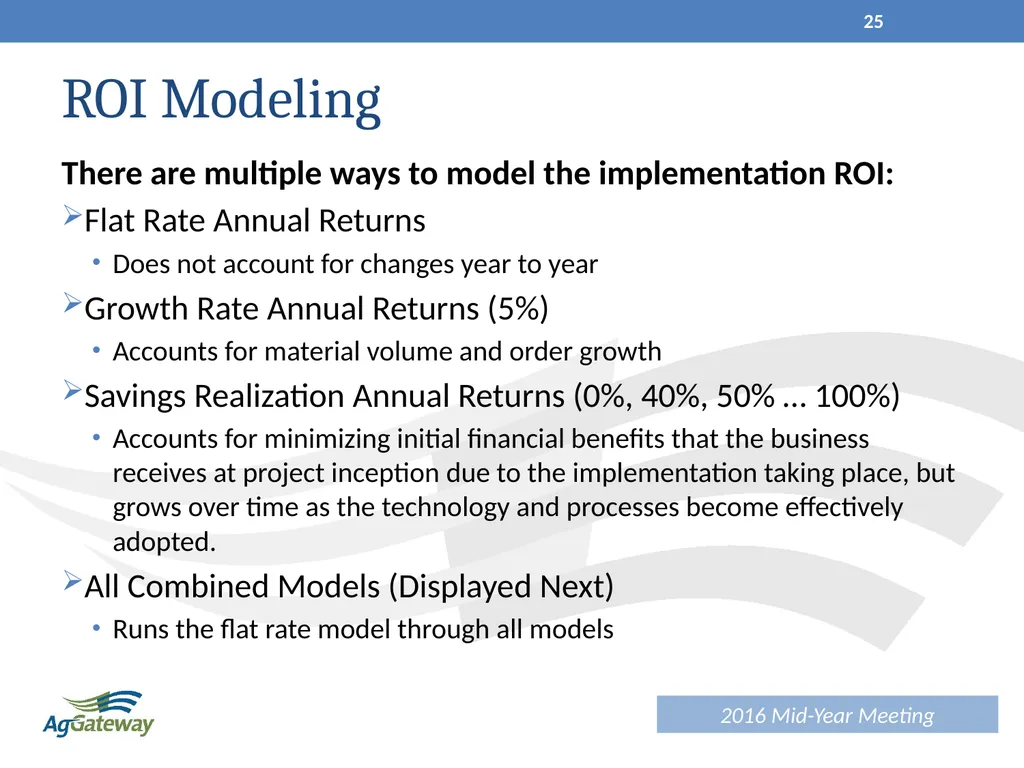
slide25. ROI Modeling There are multiple ways to model the implementation ROI:
Flat Rate Annual Returns
Does not account for changes year to year
Growth Rate Annual Returns (5%)
Accounts for material volume and order growth
Savings Realization Annual Returns (0%, 40%, 50% … 100%)
Accounts for minimizing initial financial benefits that the business receives at project inception due to the implementation taking place, but grows over time as the technology and processes become effectively adopted.
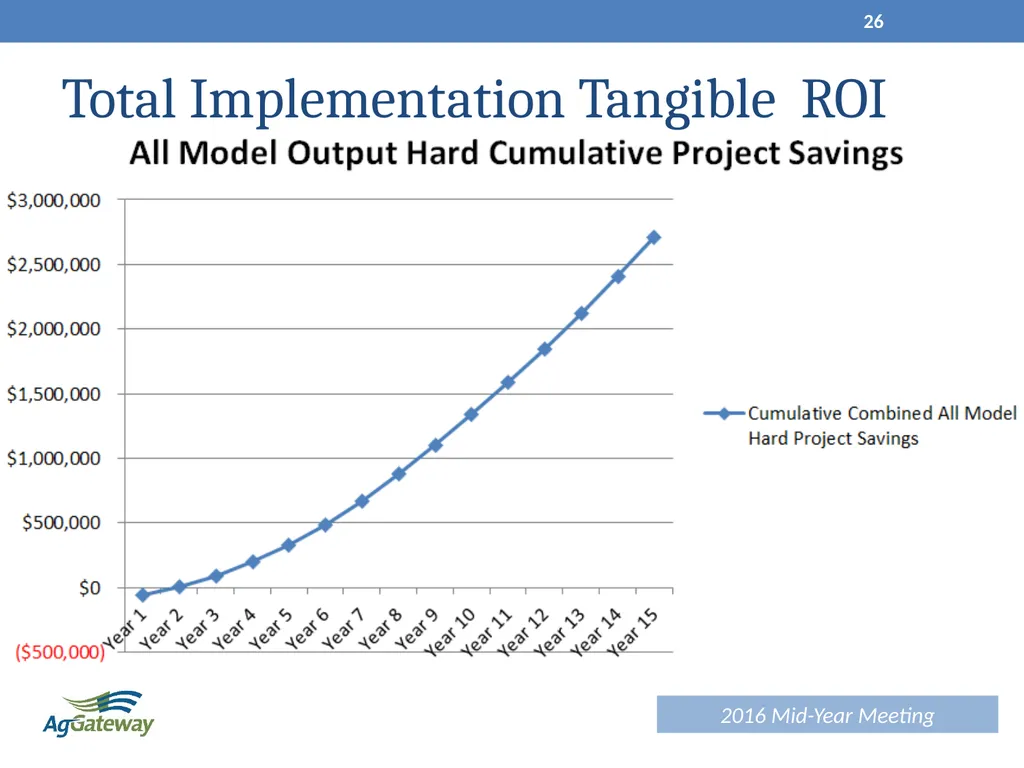
All Combined Models (Displayed Next)
Runs the flat rate model through all models 25<br>
slide26. Total Implementation Tangible ROI 26<br>
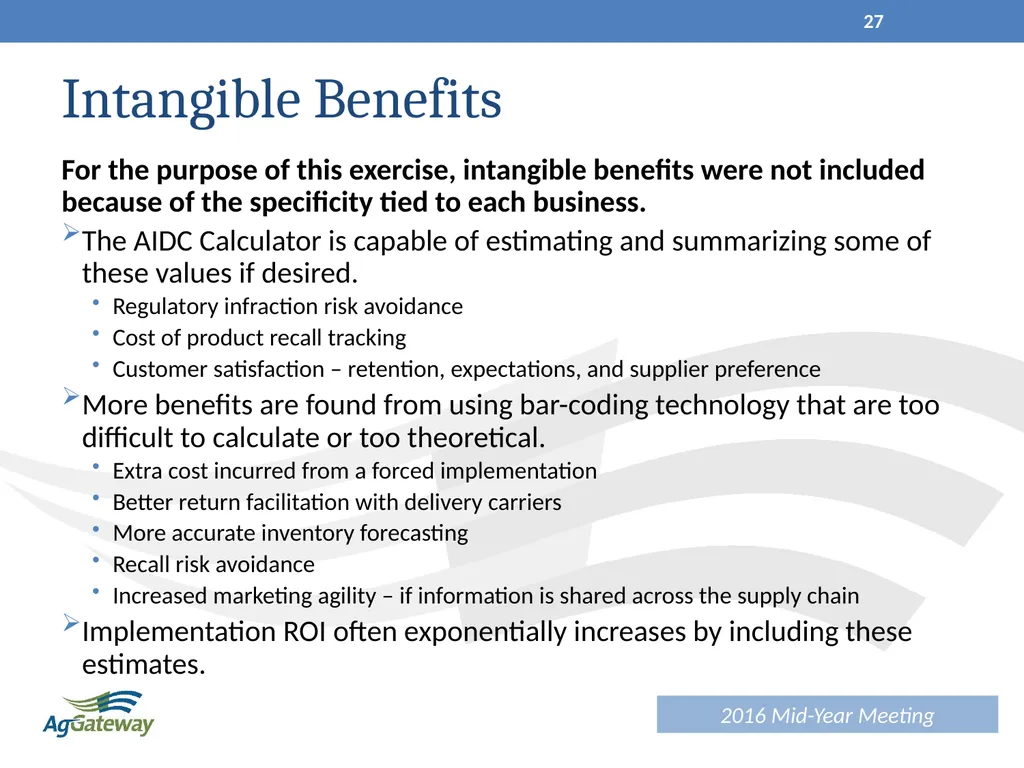
slide27. Intangible Benefits For the purpose of this exercise, intangible benefits were not included because of the specificity tied to each business.
The AIDC Calculator is capable of estimating and summarizing some of these values if desired.
Regulatory infraction risk avoidance
Cost of product recall tracking
Customer satisfaction – retention, expectations, and supplier preference
More benefits are found from using bar-coding technology that are too difficult to calculate or too theoretical.
Extra cost incurred from a forced implementation
Better return facilitation with delivery carriers
More accurate inventory forecasting
Recall risk avoidance
Increased marketing agility – if information is shared across the supply chain
Implementation ROI often exponentially increases by including these estimates. 27<br>
slide28. Industry Adoption and Future Vision As more of the industry adopts bar-coding technology, even more benefits are delivered to those implemented.
Costs are diminished for downstream package handling.
Full product track-and-trace becomes available down to and for the end-user.
Inventory movement information becomes near real-time (Automate PMR and marketing data transmission and consumption).
Future projects are better enabled for implementation
Automated farm equipment can have products scanned and loaded into mechanical automation processes for product application or planting specifications.
Precision agriculture – farmers can scan products directly into their Farm Management Systems for error-free product data utilization 28<br>
slide29. What is Needed from You? IMPLEMENT!!
Or at least let us help you discover why you should implement.
Review your manual processes and metrics for performance without the technology
Process documentation for both manual and bar-code technology is also available through the AIDC Working Group.
Use the calculator to build the financial reasons why it makes sense for your business
Can be used to estimate across all locations in your business or..
Can be used on a location-by-location basis for more exact estimates
Can be manipulated to fit your specific business and implementation scale
Request your supply chain partners to also investigate! 29<br>
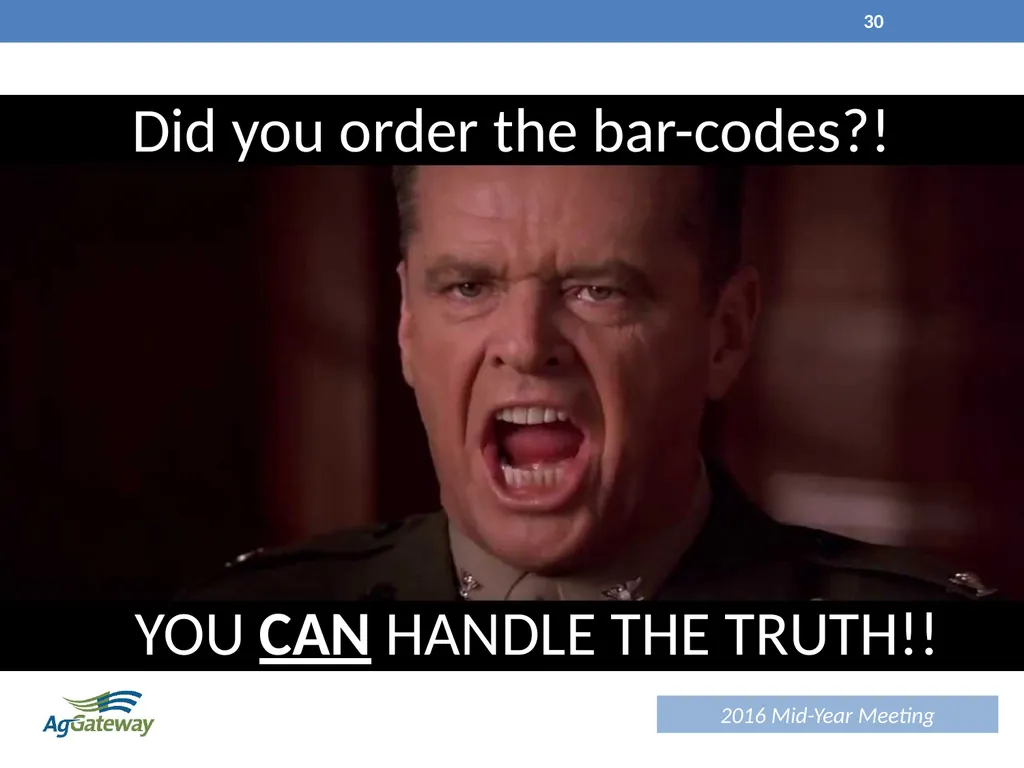
slide30. 30 YOU CAN HANDLE THE TRUTH!! Did you order the bar-codes?!<br>
slide31. 31 Questions & Discussion<br>
slide32. 32 Thank you!<br>
slide2. Agenda Session Purpose
Steps Towards Implementation
Identify challenges
Discovery Phase
Processes
People
Technology
Capturing Value (ROI)
Tangible
Intangible 2<br>
slide3. Operational Inefficiencies /Challenges Manual Entry & Insufficient Process Facing Companies Today:
Inventory inaccuracies resulting in:
Delays between transaction occurrences and entry into system
Lost sales due to no inventory or not visible thru system
Expired inventory that must be destroyed
Increased delivery cost:
Delivery of incorrect product resulting in additional trips to deliver correct product
Partial deliveries due to product shortages at time of initial load
Length of time to complete fulfillment of orders
Inefficient use of Resources.
Missed transactions never captured
Scalability - ability to efficiently expand process as needed 3<br>
slide4. Discovery Phase Process Review
Receiving
Picking
Shipping
Cycle Counts
People
Training
New Processes or Roles
Technology Solution Options
Equipment & Infrastructure Costs
Project Costs
Value Capture (ROI) 4<br>
slide5. Interactive Group Activity 5<br>
slide6. Interactive Group Activity Person A (Manual) Conference Room Person C (Office) Inventory Dock Person B (Barcode) 6<br>
slide7. Interactive Group Activity Conference Room Person C (Office) Inventory Dock Person A (Manual) Person B (Barcode) 7<br>
slide8. Interactive Group Activity Conference Room Person C (Office) Inventory Dock Person B (Barcode) Person A (Manual) 8<br>
slide9. Interactive Group Activity Conference Room Person C (Office) Inventory Dock Person B (Barcode) Person A (Manual) 9<br>
slide10. Scenario Set Up Warehouse XYZ is experiencing an increase in delivery costs. Looking into the root cause, they realize they are often out of stock on many popular items, and also sometimes load incorrect products onto shipments causing additional deliveries to complete orders with the customer. They believe implementing a bar coding solution can reduce their delivery cost and improve the efficiency of their inventory processes.
Details to Consider:
Ship out of 1 warehouse that is approximately 80,000 sq. ft. with 6 dock doors
They have 20 full time floor employees and 2 back office employees that do data entry for the inventory movements.
They currently average 10 deliveries per day, and work approximately 250 days out of the year for a total of 2500 deliveries annually. 10<br>
slide11. Metrics Collection Warehouse XYZ, in coordination with their chosen Bar-Code vendor, begin to evaluate their current manual process KPI’s. Order and delivery process metrics are summarized by the warehouse manager.
Details to Consider:
Daily salable unit turnover through the warehouse is 1000 units.
Average annual orders shipped is 5000 per year, and 1% cannot be fulfilled due to inventory shortages.
Orders average a salable value of $2,000 each.
The warehouse’s amount of incorrect deliveries averages 3% of total deliveries annually. 11<br>
slide12. Discovery Process Review
Receiving
Picking
Shipping
Cycle Counts
People
Training
New Processes or Roles
Technology Solution Options
Equipment & Infrastructure Costs
Project Costs
Value Capture (ROI) 12<br>
slide13. Training XYZ and the vendor estimate that training the work force will take 8 hours to provide for the scanner process being considered. They will need to conduct training prior to the warehouse shifts in order to not disrupt daily business activities. Floor employee training will be done by the warehouse managers.
Estimated Cost for Training:
($3,000) – Vendor installation and warehouse manager training
($1,000) – Handout materials for floor employees
($4,089) - Overtime Pay for warehouse floor staff ( Back end staff can be trained during regular office hours)
_____________________________
Total: ($8,089) 13<br>
slide14. Material Tagging The way in which materials will be bar-coded depends on the methodology chosen:
Internally Tagged – The warehouse completes tagging of materials as they are received.
Vendor Printed Labels – A vendor is contracted to print the bar-codes directly on labels. More applicable for manufacturers.
Warehouse XYZ needs to tag incoming materials themselves, since none of their current suppliers bar-code their products.
Estimated cost for tagging materials:
($28,333) – One warehouse employee will need to perform this function for 70% of his/her time.
($5,000) – Annual cost of printing bar-codes for XYZ’s volume.
_____________________________
Total: ($33,333)
Note: This cost is mitigated for products that are already bar-coded from suppliers. 14<br>
slide15. Discovery Phase Process Review
Receiving
Picking
Shipping
Cycle Counts
People
Training
New Processes or Roles
Technology Solution Options
Equipment & Infrastructure
Project Cost
Value Capture (ROI) 15<br>
slide16. Equipment Investment Warehouse XYZ decides to invest in average-priced equipment based on their need and desire of the functionality.
Price ranges can increase or decrease based on equipment quality and functionality
Decide what is needed for your own operation during this discovery phase.
Estimated Cost of Required Equipment:
($8,000) – Handheld Scanners X 10 @ $800 each
($17,204) – Mobile Computers X 6 @ $2,867.35 each
($350) – Docking Station x1 @ $350 each
($5,200) – Bar-Code Printers x2 @ $2,600 each
($5,500) – Wireless Access Points x10 @ $550 each
($360) – Server Software
($1000) – Shipping
_____________________________
Total: ($37,614) 16<br>
slide17. Financing Options There are multiple different ways to pay for much of the implementation cost.
Businesses can choose to pay for it up-front upon project initiation.
Another option is to be able finance the cost over time through monthly or annual payments.
This is similar to leasing, but leasing to own the equipment.
Allows the business to begin realizing return on their investment much more quickly versus having to absorb the full cost up-front.
Financing Over Time Example:
($37,614) – Total Required Equipment Investment Cost
5% – Financing Interest Rate
Term – 3 or 5 Years
_____________________________
Monthly Payments for 3 Years: ($1,127.33)
Monthly Payments for 5 Years: ($709.82) 17<br>
slide18. Project Cost Warehouse XYZ will hire a project manager to facilitate the implementation.
This resource can be internal or as contracted with a vendor.
The consultation with a bar-code vendor may also have cost associated.
In this example, there was a consulting fee.
Estimated Cost of Project Resources:
($6,000) – Project Manager for 60 hours @ $100 per hour
($1,500) – Consultation Fee
_____________________________
Total: ($7,500) 18<br>
slide19. Capture Value Process Review
Receiving
Picking
Shipping
Cycle Counts
People
Training
New Processes or Roles
Technology Solution Options
Equipment & Infrastructure Costs
Project Costs
Value Capture (ROI) 19<br>
slide20. One-Time Implementation Cost After the metrics, desired equipment, and process estimation is completed, XYZ’s warehouse manager and the bar-code vendor review the total cost.
Estimated Cost of the Implementation:
($8,089) – Training
($37,614) – Equipment Investment
($7,500) – Project Cost
_____________________________
Total: ($53,203) 20<br>
slide21. WHY Implement? 21<br>
slide22. Tangible vs Intangible Returns Tangible Return can be measured and validated
Inventory Savings
Space Savings
Existing Labor Savings (minus) Additional Labor Costs
Order Fulfillment Revenue Previously Lost
Delivery Savings
Intangible Return is difficult to measure or validate but has value
Customer Satisfaction
Employee Satisfaction
Compliance
Is an industry, customer, and government requirement for doing business.
Risk Reduction 22<br>
slide23. Scenario Tangible Benefits Inputting the metrics gathered into the AgGateway AIDC Calculator, annual occurring benefits and costs are calculated for XYZ as follows:
Estimated Annual Benefits and Costs of the Implementation:
$21,938 – Labor Savings – Cost of labor processes manually (minus) cost of labor processes with AIDC technology.
($33,333) – Cost of Labor and Materials to Tag Inventory
$57,375 – Delivery Savings – Savings from preventing incorrect deliveries
$17,750 – Inventory Shrinkage Savings – Savings from preventing lost or stolen product cost
$90,000 – Order Fulfillment – Additional revenue from maintaining more accurate inventory counts to fulfill orders
($2,520) – Cost of Equipment Upkeep and Replacement
_____________________________
Total: $151,210 23<br>
slide24. Delivery ROI Example 24<br>
slide25. ROI Modeling There are multiple ways to model the implementation ROI:
Flat Rate Annual Returns
Does not account for changes year to year
Growth Rate Annual Returns (5%)
Accounts for material volume and order growth
Savings Realization Annual Returns (0%, 40%, 50% … 100%)
Accounts for minimizing initial financial benefits that the business receives at project inception due to the implementation taking place, but grows over time as the technology and processes become effectively adopted.
All Combined Models (Displayed Next)
Runs the flat rate model through all models 25<br>
slide26. Total Implementation Tangible ROI 26<br>
slide27. Intangible Benefits For the purpose of this exercise, intangible benefits were not included because of the specificity tied to each business.
The AIDC Calculator is capable of estimating and summarizing some of these values if desired.
Regulatory infraction risk avoidance
Cost of product recall tracking
Customer satisfaction – retention, expectations, and supplier preference
More benefits are found from using bar-coding technology that are too difficult to calculate or too theoretical.
Extra cost incurred from a forced implementation
Better return facilitation with delivery carriers
More accurate inventory forecasting
Recall risk avoidance
Increased marketing agility – if information is shared across the supply chain
Implementation ROI often exponentially increases by including these estimates. 27<br>
slide28. Industry Adoption and Future Vision As more of the industry adopts bar-coding technology, even more benefits are delivered to those implemented.
Costs are diminished for downstream package handling.
Full product track-and-trace becomes available down to and for the end-user.
Inventory movement information becomes near real-time (Automate PMR and marketing data transmission and consumption).
Future projects are better enabled for implementation
Automated farm equipment can have products scanned and loaded into mechanical automation processes for product application or planting specifications.
Precision agriculture – farmers can scan products directly into their Farm Management Systems for error-free product data utilization 28<br>
slide29. What is Needed from You? IMPLEMENT!!
Or at least let us help you discover why you should implement.
Review your manual processes and metrics for performance without the technology
Process documentation for both manual and bar-code technology is also available through the AIDC Working Group.
Use the calculator to build the financial reasons why it makes sense for your business
Can be used to estimate across all locations in your business or..
Can be used on a location-by-location basis for more exact estimates
Can be manipulated to fit your specific business and implementation scale
Request your supply chain partners to also investigate! 29<br>
slide30. 30 YOU CAN HANDLE THE TRUTH!! Did you order the bar-codes?!<br>
slide31. 31 Questions & Discussion<br>
slide32. 32 Thank you!<br>