Analysis of Flow-through Entities Using Social
Description: Analysis of Flow-through Entities Using Social Network Analysis Techniques Ashish Agarwal Shannon Chen The University of Texas at Austin Rahul Tikekar Ririko Horvath Larry May IRS, RAS Advisory Roles: Robert Hanneman ( UC Riverside),
Related Topics
Download Presentation
"Analysis of Flow-through Entities Using Social" is the property of its rightful owner. Permission is granted to download and print the materials on this website for personal, non-commercial use only, and to display it on your personal computer provided you do not modify the materials and that you retain all copyright notices contained in the materials. By downloading content from our website, you accept the terms of this agreement.
Presentation Transcript
slide1. Analysis of Flow-through Entities Using Social Network Analysis Techniques Ashish Agarwal
Shannon Chen
The University of Texas
at Austin Rahul Tikekar
Ririko Horvath
Larry May
IRS, RAS Advisory Roles: Robert Hanneman ( UC Riverside), Lillian Mills (UT Austin)<br>
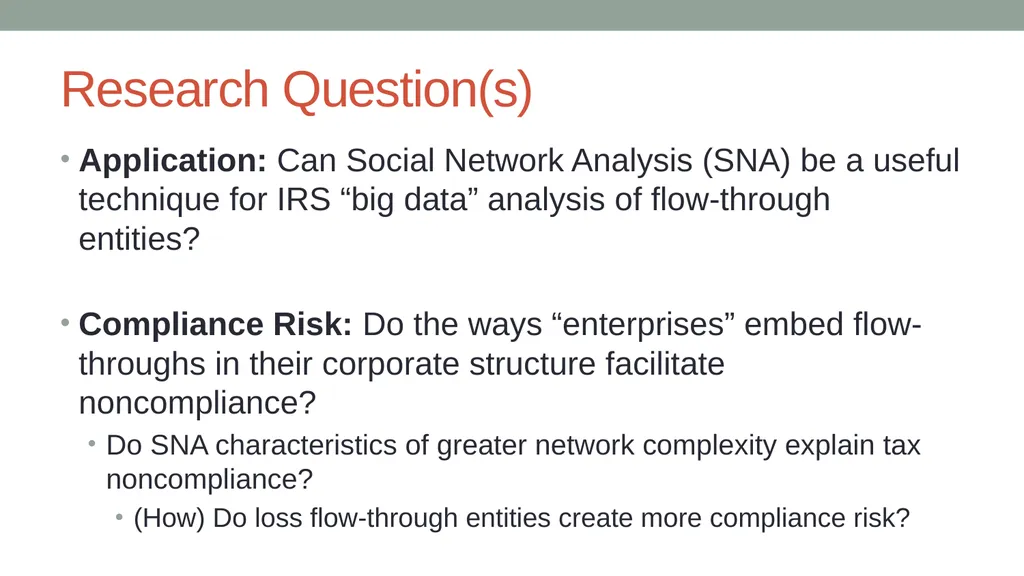
slide2. Research Question(s) Application: Can Social Network Analysis (SNA) be a useful technique for IRS “big data” analysis of flow-through entities?
Compliance Risk: Do the ways “enterprises” embed flow-throughs in their corporate structure facilitate noncompliance?
Do SNA characteristics of greater network complexity explain tax noncompliance?
(How) Do loss flow-through entities create more compliance risk?<br>
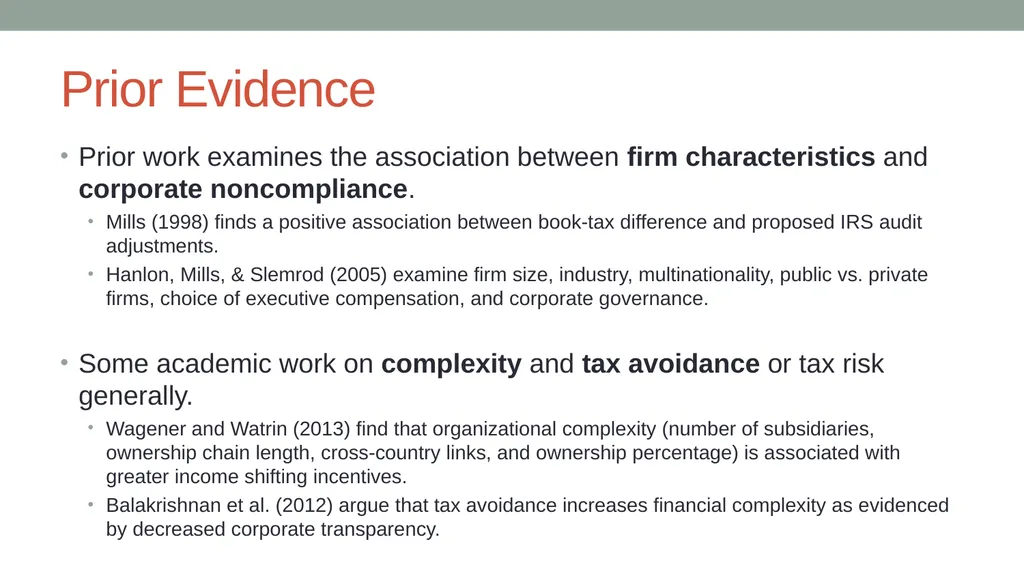
slide3. Prior Evidence Prior work examines the association between firm characteristics and corporate noncompliance.
Mills (1998) finds a positive association between book-tax difference and proposed IRS audit adjustments.
Hanlon, Mills, & Slemrod (2005) examine firm size, industry, multinationality, public vs. private firms, choice of executive compensation, and corporate governance.
Some academic work on complexity and tax avoidance or tax risk generally.
Wagener and Watrin (2013) find that organizational complexity (number of subsidiaries, ownership chain length, cross-country links, and ownership percentage) is associated with greater income shifting incentives.
Balakrishnan et al. (2012) argue that tax avoidance increases financial complexity as evidenced by decreased corporate transparency.<br>
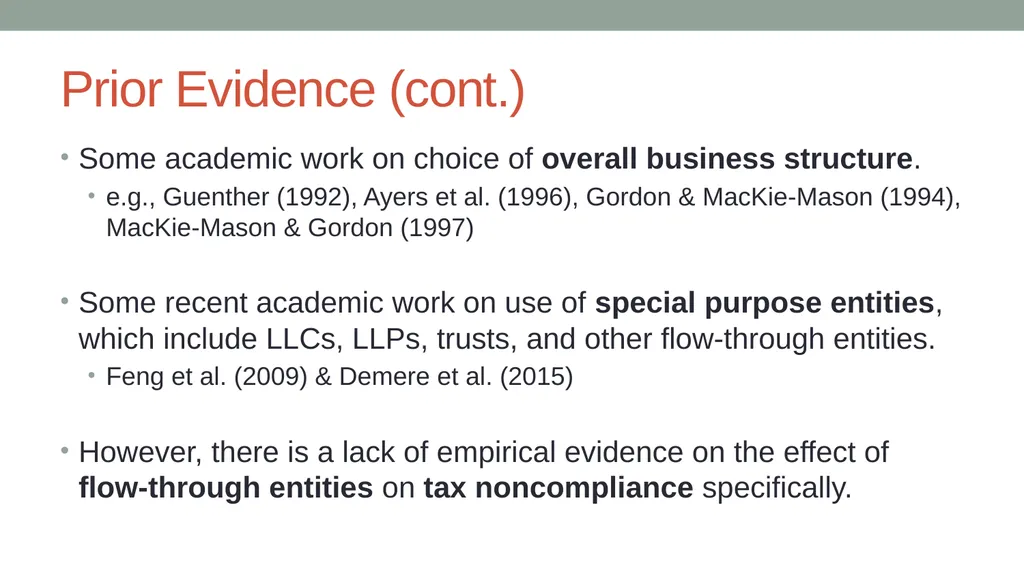
slide4. Prior Evidence (cont.) Some academic work on choice of overall business structure.
e.g., Guenther (1992), Ayers et al. (1996), Gordon & MacKie-Mason (1994), MacKie-Mason & Gordon (1997)
Some recent academic work on use of special purpose entities, which include LLCs, LLPs, trusts, and other flow-through entities.
Feng et al. (2009) & Demere et al. (2015)
However, there is a lack of empirical evidence on the effect of flow-through entities on tax noncompliance specifically.<br>
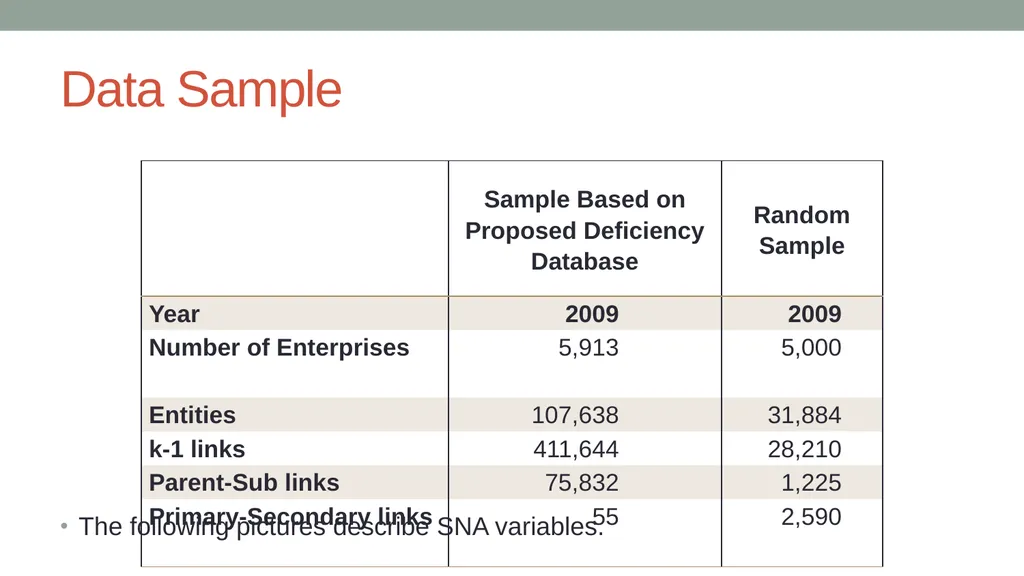
slide5. Data Sample The following pictures describe SNA variables.<br>
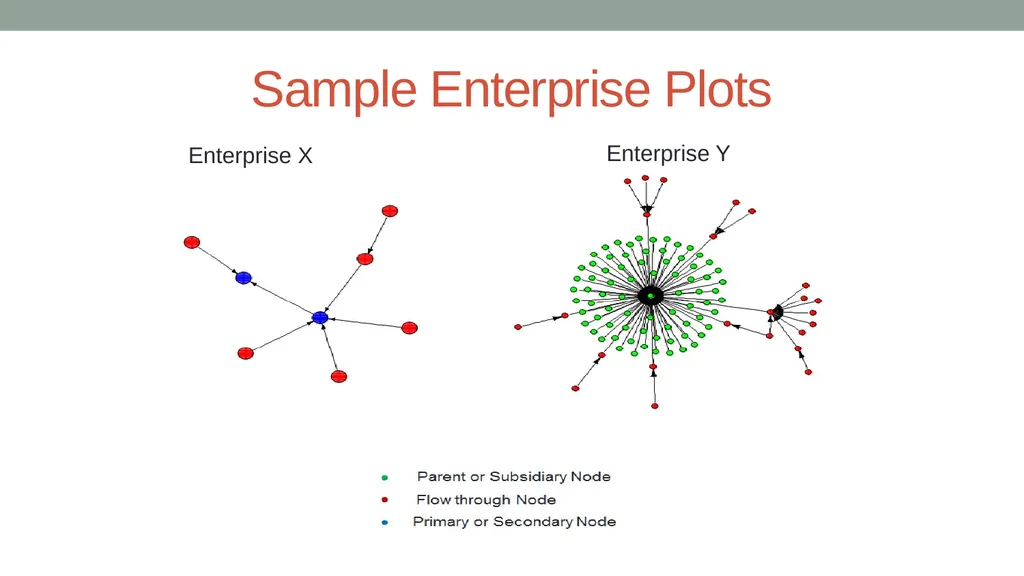
slide6. Sample Enterprise Plots Enterprise X Enterprise Y<br>
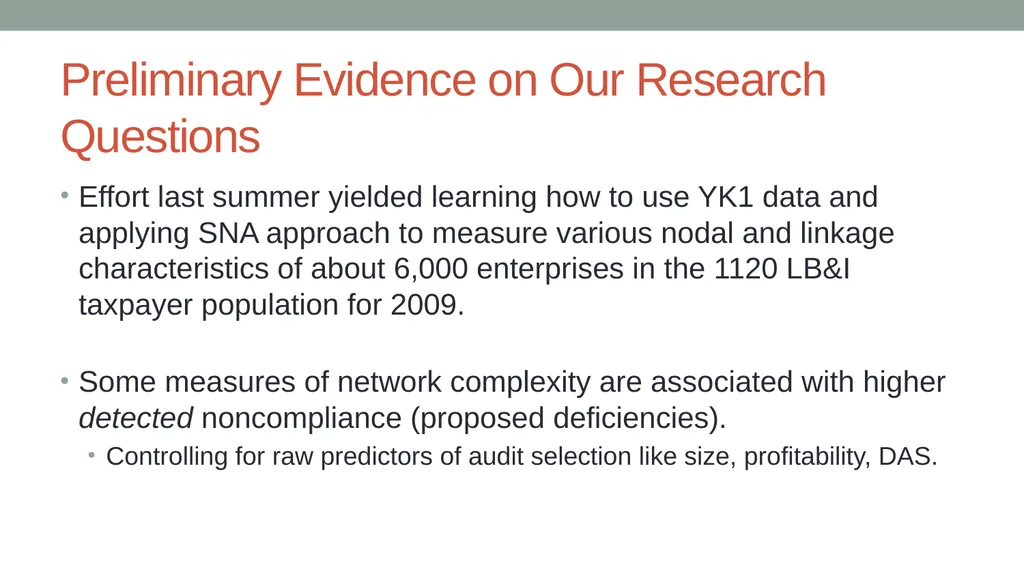
slide7. Preliminary Evidence on Our Research Questions Effort last summer yielded learning how to use YK1 data and applying SNA approach to measure various nodal and linkage characteristics of about 6,000 enterprises in the 1120 LB&I taxpayer population for 2009.
Some measures of network complexity are associated with higher detected noncompliance (proposed deficiencies).
Controlling for raw predictors of audit selection like size, profitability, DAS.<br>
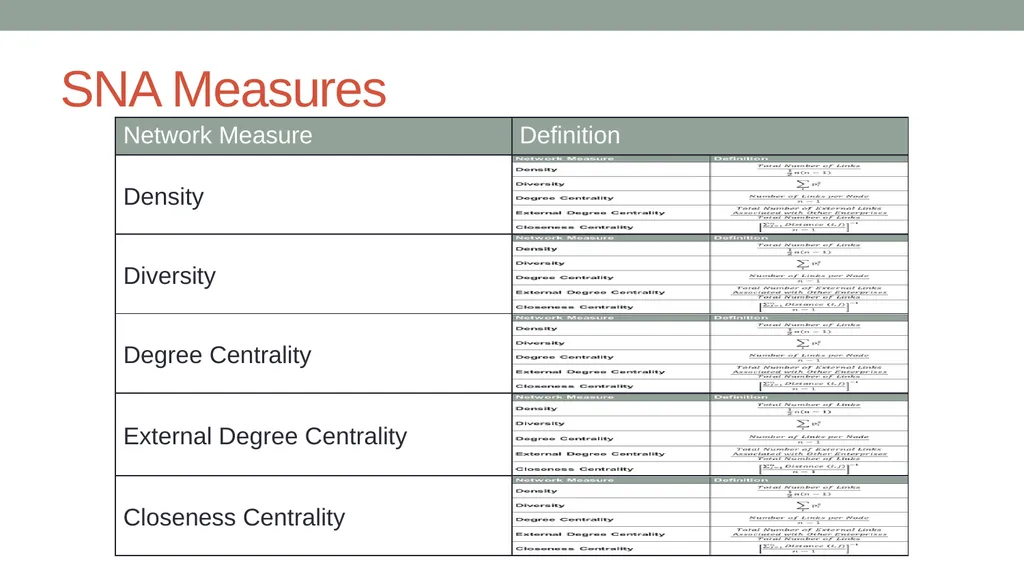
slide8. SNA Measures<br>
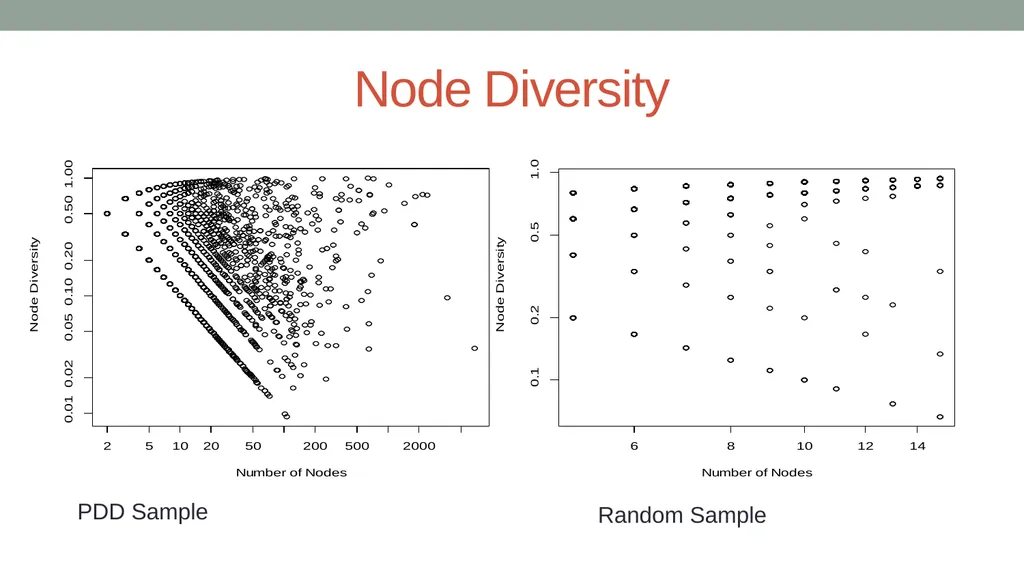
slide9. Node Diversity PDD Sample Random Sample<br>
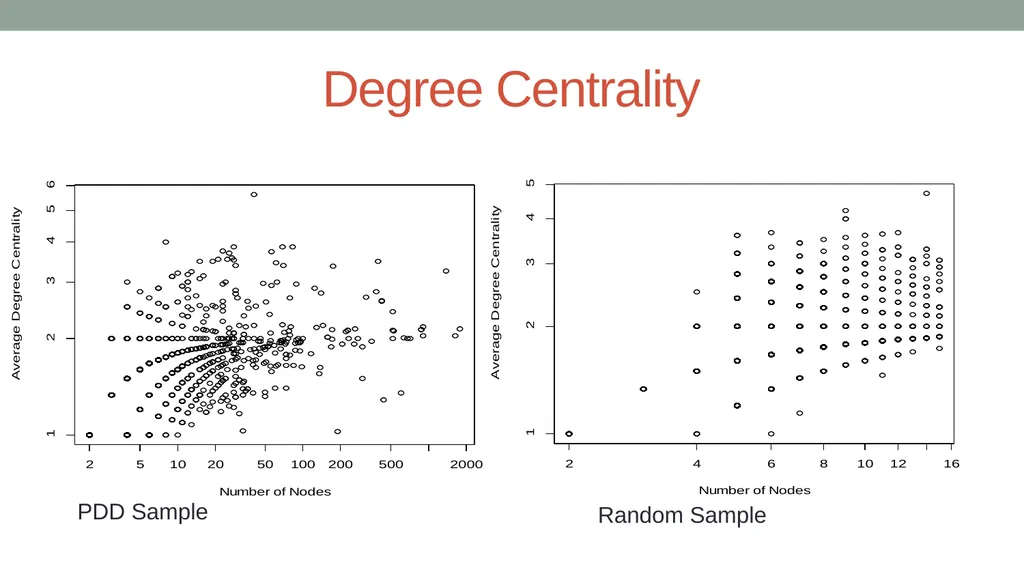
slide10. Degree Centrality PDD Sample Random Sample<br>
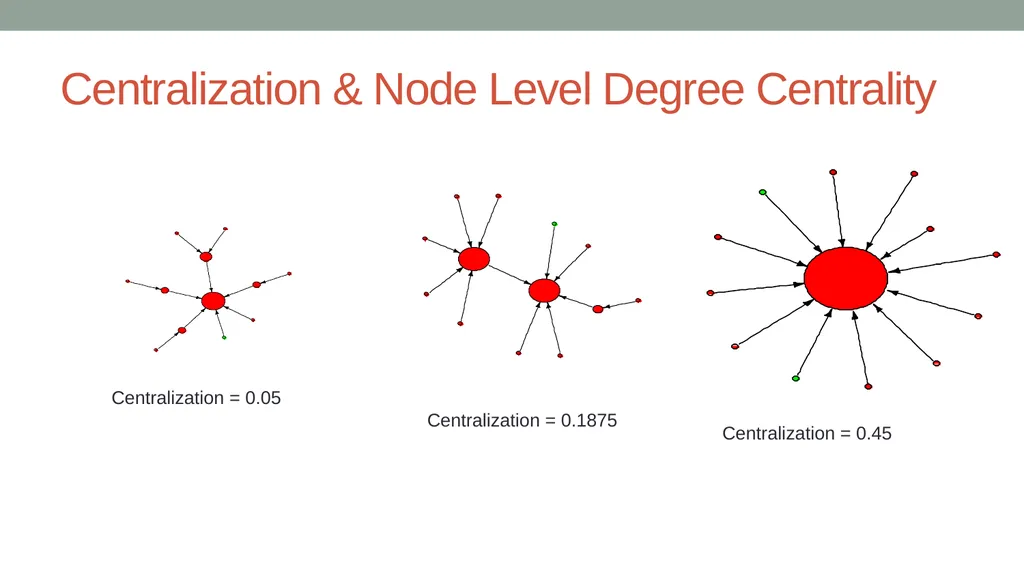
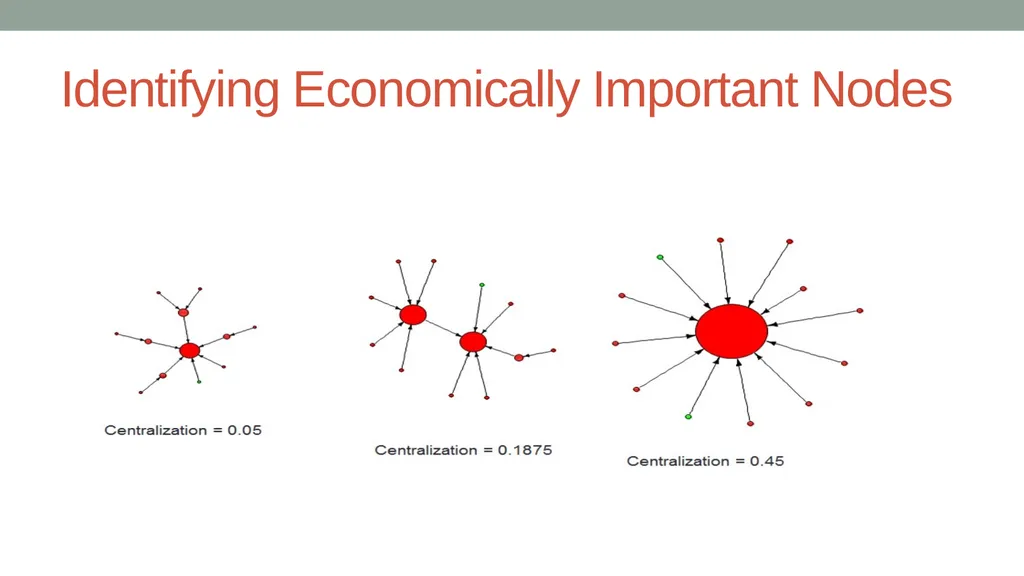
slide11. Centralization & Node Level Degree Centrality Centralization = 0.1875 Centralization = 0.05 Centralization = 0.45<br>
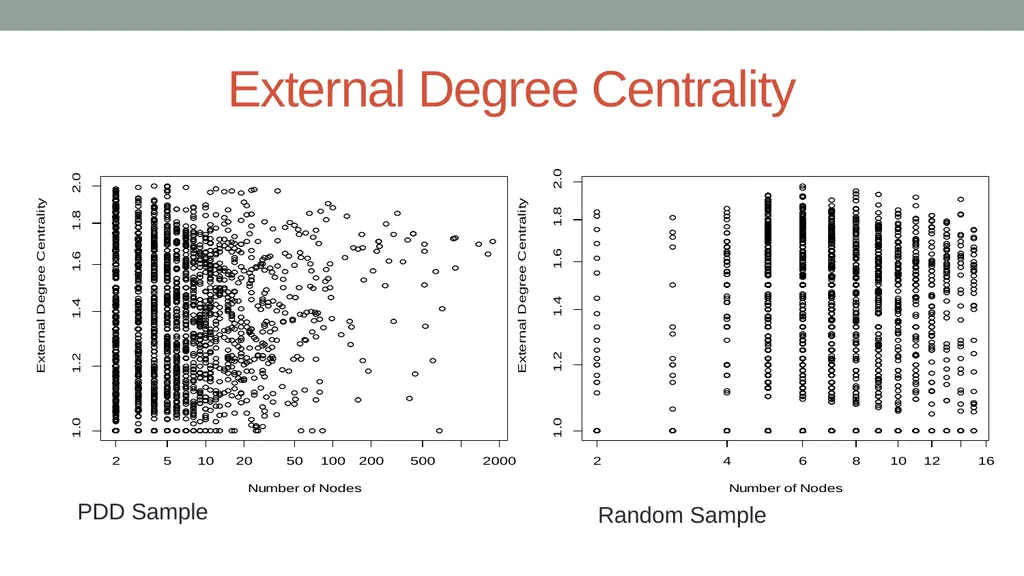
slide12. External Degree Centrality PDD Sample Random Sample<br>
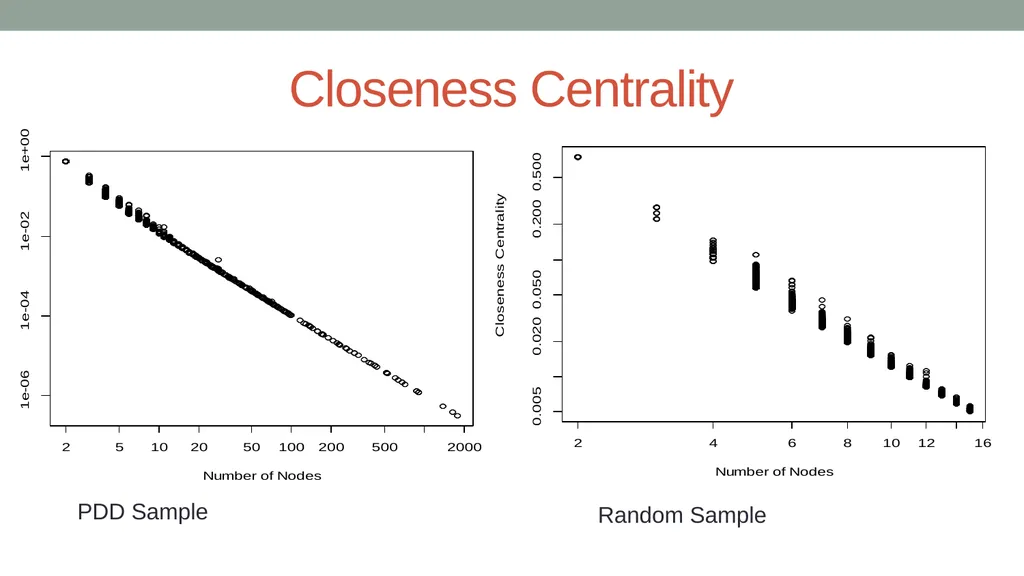
slide13. Closeness Centrality PDD Sample Random Sample<br>
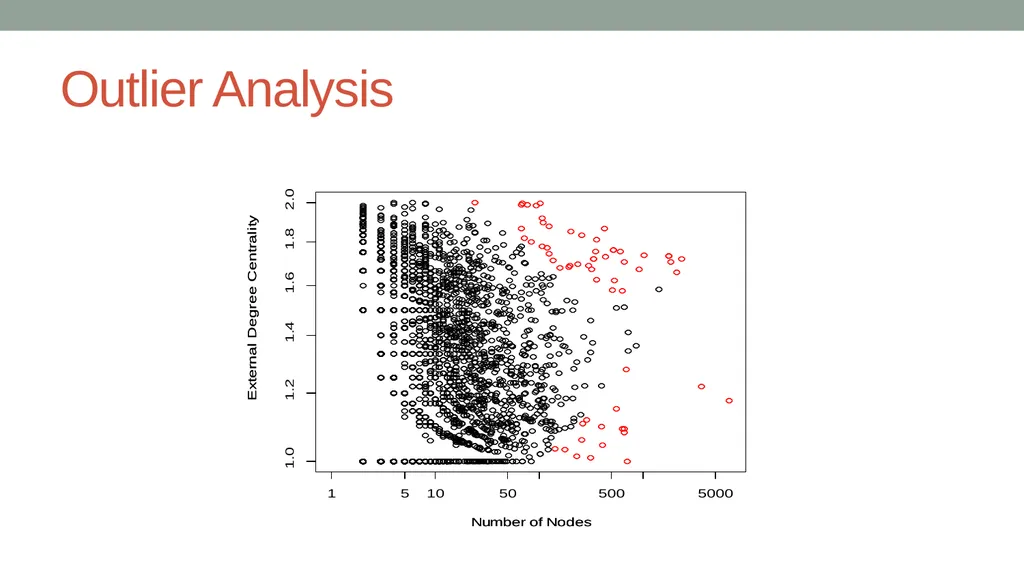
slide14. Outlier Analysis<br>
slide15. Identifying Economically Important Nodes<br>
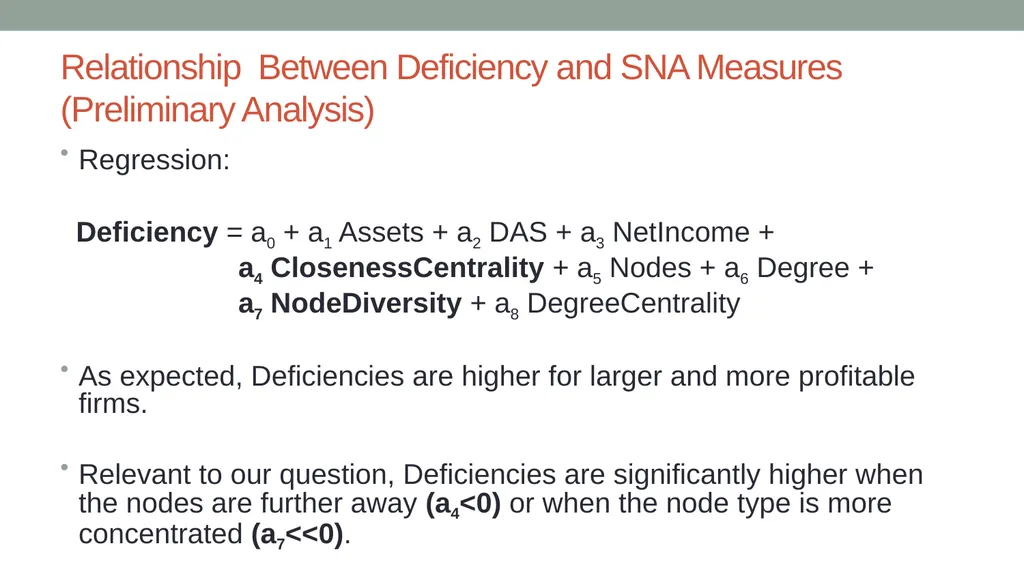
slide16. Relationship Between Deficiency and SNA Measures (Preliminary Analysis) Regression:
Deficiency = a0 + a1 Assets + a2 DAS + a3 NetIncome +
a4 ClosenessCentrality + a5 Nodes + a6 Degree +
a7 NodeDiversity + a8 DegreeCentrality
As expected, Deficiencies are higher for larger and more profitable firms.
Relevant to our question, Deficiencies are significantly higher when the nodes are further away (a4<0) or when the node type is more concentrated (a7<<0).<br>
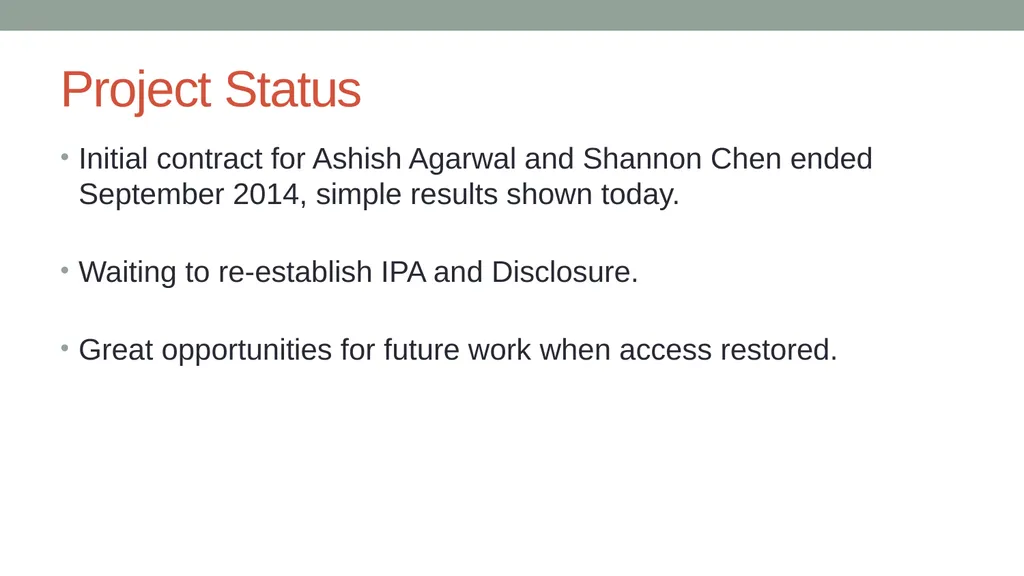
slide17. Project Status Initial contract for Ashish Agarwal and Shannon Chen ended September 2014, simple results shown today.
Waiting to re-establish IPA and Disclosure.
Great opportunities for future work when access restored.<br>
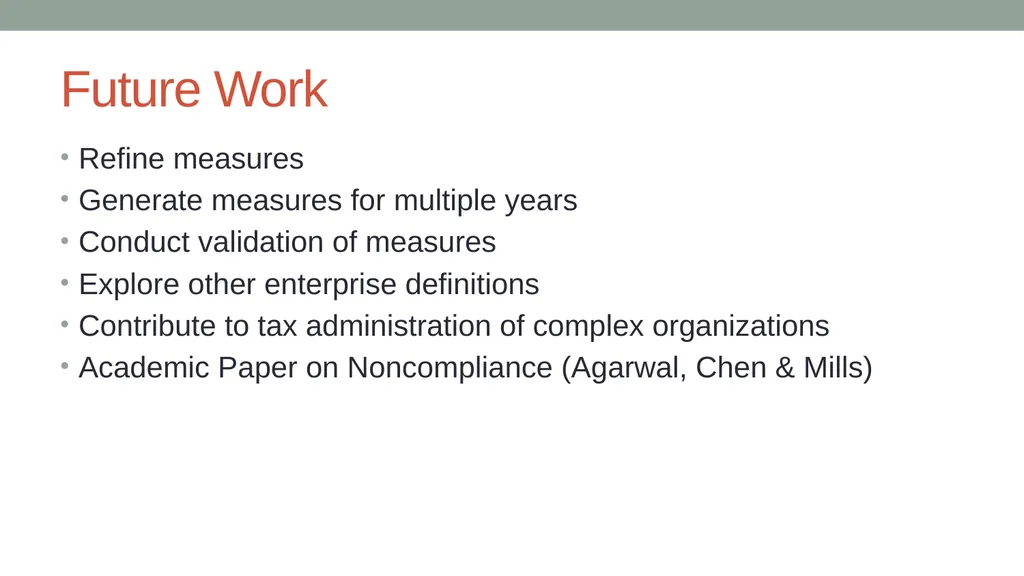
slide18. Future Work Refine measures
Generate measures for multiple years
Conduct validation of measures
Explore other enterprise definitions
Contribute to tax administration of complex organizations
Academic Paper on Noncompliance (Agarwal, Chen & Mills)<br>

Shannon Chen
The University of Texas
at Austin Rahul Tikekar
Ririko Horvath
Larry May
IRS, RAS Advisory Roles: Robert Hanneman ( UC Riverside), Lillian Mills (UT Austin)<br>
slide2. Research Question(s) Application: Can Social Network Analysis (SNA) be a useful technique for IRS “big data” analysis of flow-through entities?
Compliance Risk: Do the ways “enterprises” embed flow-throughs in their corporate structure facilitate noncompliance?
Do SNA characteristics of greater network complexity explain tax noncompliance?
(How) Do loss flow-through entities create more compliance risk?<br>
slide3. Prior Evidence Prior work examines the association between firm characteristics and corporate noncompliance.
Mills (1998) finds a positive association between book-tax difference and proposed IRS audit adjustments.
Hanlon, Mills, & Slemrod (2005) examine firm size, industry, multinationality, public vs. private firms, choice of executive compensation, and corporate governance.
Some academic work on complexity and tax avoidance or tax risk generally.
Wagener and Watrin (2013) find that organizational complexity (number of subsidiaries, ownership chain length, cross-country links, and ownership percentage) is associated with greater income shifting incentives.
Balakrishnan et al. (2012) argue that tax avoidance increases financial complexity as evidenced by decreased corporate transparency.<br>
slide4. Prior Evidence (cont.) Some academic work on choice of overall business structure.
e.g., Guenther (1992), Ayers et al. (1996), Gordon & MacKie-Mason (1994), MacKie-Mason & Gordon (1997)
Some recent academic work on use of special purpose entities, which include LLCs, LLPs, trusts, and other flow-through entities.
Feng et al. (2009) & Demere et al. (2015)
However, there is a lack of empirical evidence on the effect of flow-through entities on tax noncompliance specifically.<br>
slide5. Data Sample The following pictures describe SNA variables.<br>
slide6. Sample Enterprise Plots Enterprise X Enterprise Y<br>
slide7. Preliminary Evidence on Our Research Questions Effort last summer yielded learning how to use YK1 data and applying SNA approach to measure various nodal and linkage characteristics of about 6,000 enterprises in the 1120 LB&I taxpayer population for 2009.
Some measures of network complexity are associated with higher detected noncompliance (proposed deficiencies).
Controlling for raw predictors of audit selection like size, profitability, DAS.<br>
slide8. SNA Measures<br>
slide9. Node Diversity PDD Sample Random Sample<br>
slide10. Degree Centrality PDD Sample Random Sample<br>
slide11. Centralization & Node Level Degree Centrality Centralization = 0.1875 Centralization = 0.05 Centralization = 0.45<br>
slide12. External Degree Centrality PDD Sample Random Sample<br>
slide13. Closeness Centrality PDD Sample Random Sample<br>
slide14. Outlier Analysis<br>
slide15. Identifying Economically Important Nodes<br>
slide16. Relationship Between Deficiency and SNA Measures (Preliminary Analysis) Regression:
Deficiency = a0 + a1 Assets + a2 DAS + a3 NetIncome +
a4 ClosenessCentrality + a5 Nodes + a6 Degree +
a7 NodeDiversity + a8 DegreeCentrality
As expected, Deficiencies are higher for larger and more profitable firms.
Relevant to our question, Deficiencies are significantly higher when the nodes are further away (a4<0) or when the node type is more concentrated (a7<<0).<br>
slide17. Project Status Initial contract for Ashish Agarwal and Shannon Chen ended September 2014, simple results shown today.
Waiting to re-establish IPA and Disclosure.
Great opportunities for future work when access restored.<br>
slide18. Future Work Refine measures
Generate measures for multiple years
Conduct validation of measures
Explore other enterprise definitions
Contribute to tax administration of complex organizations
Academic Paper on Noncompliance (Agarwal, Chen & Mills)<br>