
Analysis of Vital Statistics Data These materials
OM
Published · 159 slides · 0 views

1 / 1


Description
Analysis of Vital Statistics Data These materials have been developed by the National Center for Health Statistics, International Statistics Program, Hyattsville, Md., as part of the CDC Global Program for Civil Registration and Vital
Related Topics
Share
Embed code
Download this presentation From Below
"Analysis of Vital Statistics Data These materials" is the property of its rightful owner. Permission is granted to download and print the materials on this website for personal, non-commercial use only, and to display it on your personal computer provided you do not modify the materials and that you retain all copyright notices contained in the materials. By downloading content from our website, you accept the terms of this agreement.
Presentation Transcript
01
Analysis of Vital Statistics Data These materials have been developed by the National Center for Health Statistics, International Statistics Program, Hyattsville, Md., as part of the CDC Global Program for Civil Registration and Vital Statistics Improvement.<br>
02
Outline Uses, general principles, & standardization of VS data
Types of vital statistics measures
Visualizing data (general)
Natality
Mortality
Linking data<br>
Types of vital statistics measures
Visualizing data (general)
Natality
Mortality
Linking data<br>
03
Uses of Vital Statistics Planning human development
Dynamics of reproduction
Life-tables
Risks of dying
Population growth dynamics
Population projections
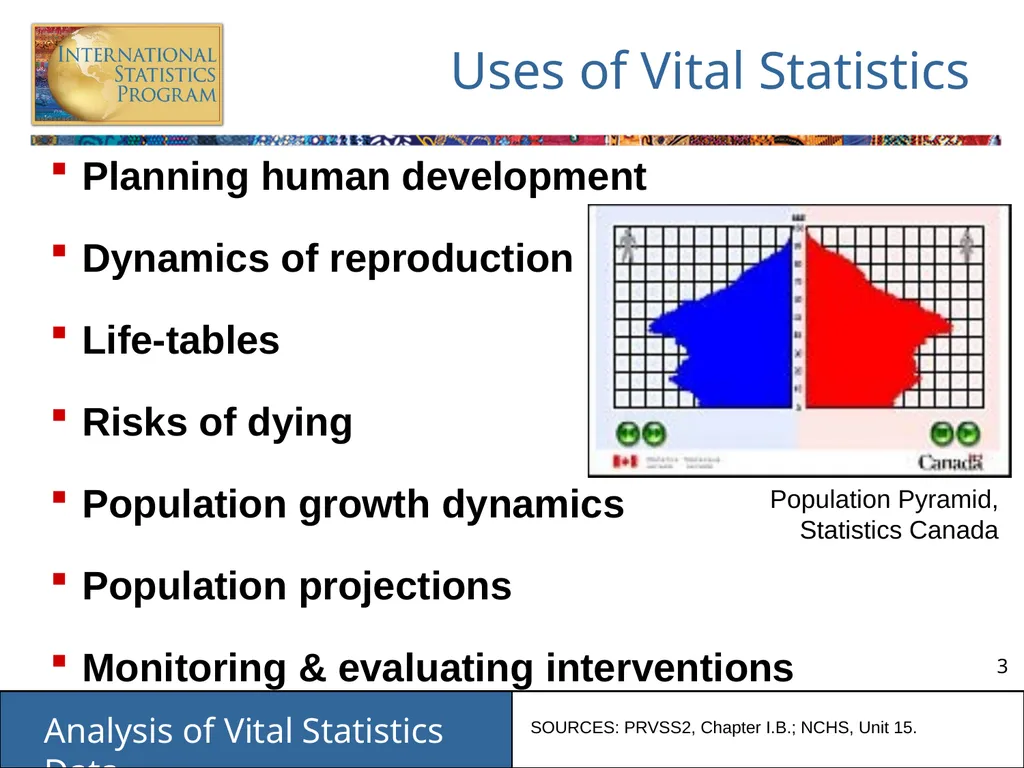
Monitoring & evaluating interventions Population Pyramid, Statistics Canada SOURCES: PRVSS2, Chapter I.B.; NCHS, Unit 15.<br>
Dynamics of reproduction
Life-tables
Risks of dying
Population growth dynamics
Population projections
Monitoring & evaluating interventions Population Pyramid, Statistics Canada SOURCES: PRVSS2, Chapter I.B.; NCHS, Unit 15.<br>
04
Uses of Vital Statistics Can facilitate information for:
Provision of services for vulnerable populations (i.e. single mothers & children)
Regional & urban/rural comparisons
Allocation of resources (i.e. health care, education, & social security) SOURCES: PRVSS2, Chapter I.B.<br>
Provision of services for vulnerable populations (i.e. single mothers & children)
Regional & urban/rural comparisons
Allocation of resources (i.e. health care, education, & social security) SOURCES: PRVSS2, Chapter I.B.<br>
05
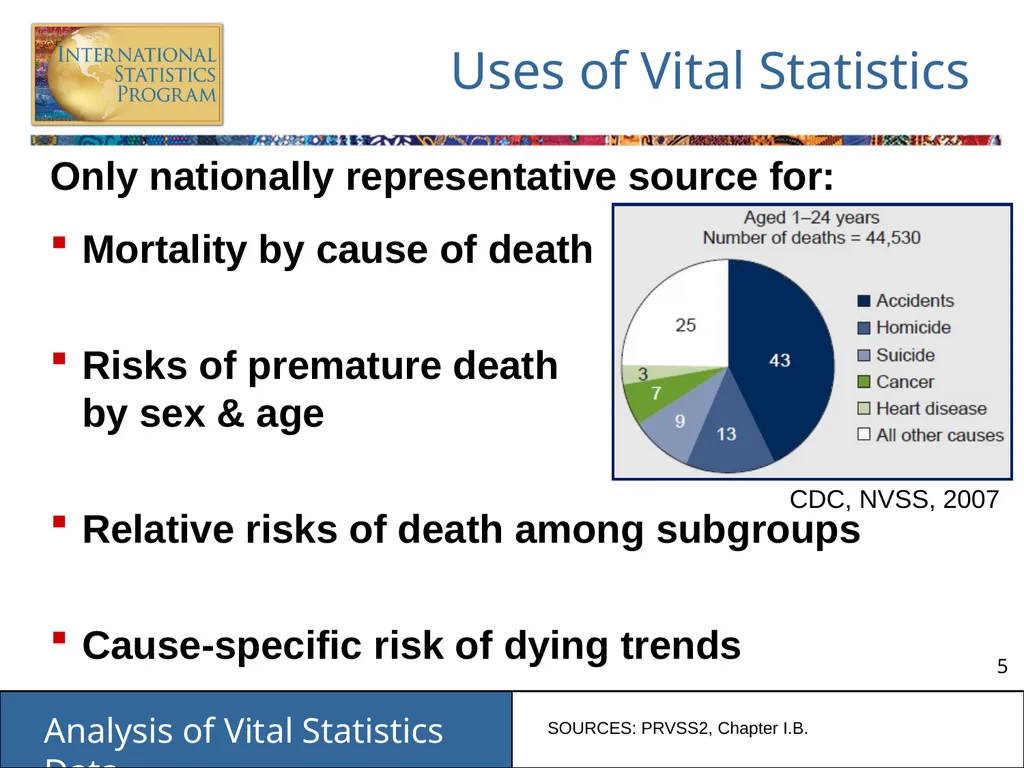
Uses of Vital Statistics Only nationally representative source for:
Mortality by cause of death
Risks of premature death by sex & age
Relative risks of death among subgroups
Cause-specific risk of dying trends CDC, NVSS, 2007 SOURCES: PRVSS2, Chapter I.B.<br>
Mortality by cause of death
Risks of premature death by sex & age
Relative risks of death among subgroups
Cause-specific risk of dying trends CDC, NVSS, 2007 SOURCES: PRVSS2, Chapter I.B.<br>
06
General Principles:
Useable Statistics Clear, explicit, & simple definitions
Universal acceptance / international standards
Comparability (geographically & over time)
Continuity
Setting targets
Evaluating social & economic plans
Flexibility to adapt
New methods / requirements
Computing technology
Changes described in reporting (titles, footnotes) SOURCES: PRVSS2, Chapter I.B.; Chapter II.G.3.; NCHS, Unit 15.<br>
Universal acceptance / international standards
Comparability (geographically & over time)
Continuity
Setting targets
Evaluating social & economic plans
Flexibility to adapt
New methods / requirements
Computing technology
Changes described in reporting (titles, footnotes) SOURCES: PRVSS2, Chapter I.B.; Chapter II.G.3.; NCHS, Unit 15.<br>
07
Standardization of VS Data:
ICD & International Comparison WHO: International Statistical Classification of Diseases and Related Health Problems
Revisions
Currently in 10th Revision (1993)
Recommended every 10 years; getting longer
Countries are slower to adopt
Ideal source for international comparison
Universal morbidity & mortality coding
Only cases seen by physician SOURCES: WHO ICD-10, Volume 2, Chapter 5; NAPHSIS.<br>
Revisions
Currently in 10th Revision (1993)
Recommended every 10 years; getting longer
Countries are slower to adopt
Ideal source for international comparison
Universal morbidity & mortality coding
Only cases seen by physician SOURCES: WHO ICD-10, Volume 2, Chapter 5; NAPHSIS.<br>
08
Standardization of VS Data:
ICD & International Comparison ICD in (country):
(current status)
(future steps) SOURCES: WHO ICD-10, Volume 2, Chapter 5; NAPHSIS.<br>
(current status)
(future steps) SOURCES: WHO ICD-10, Volume 2, Chapter 5; NAPHSIS.<br>
09
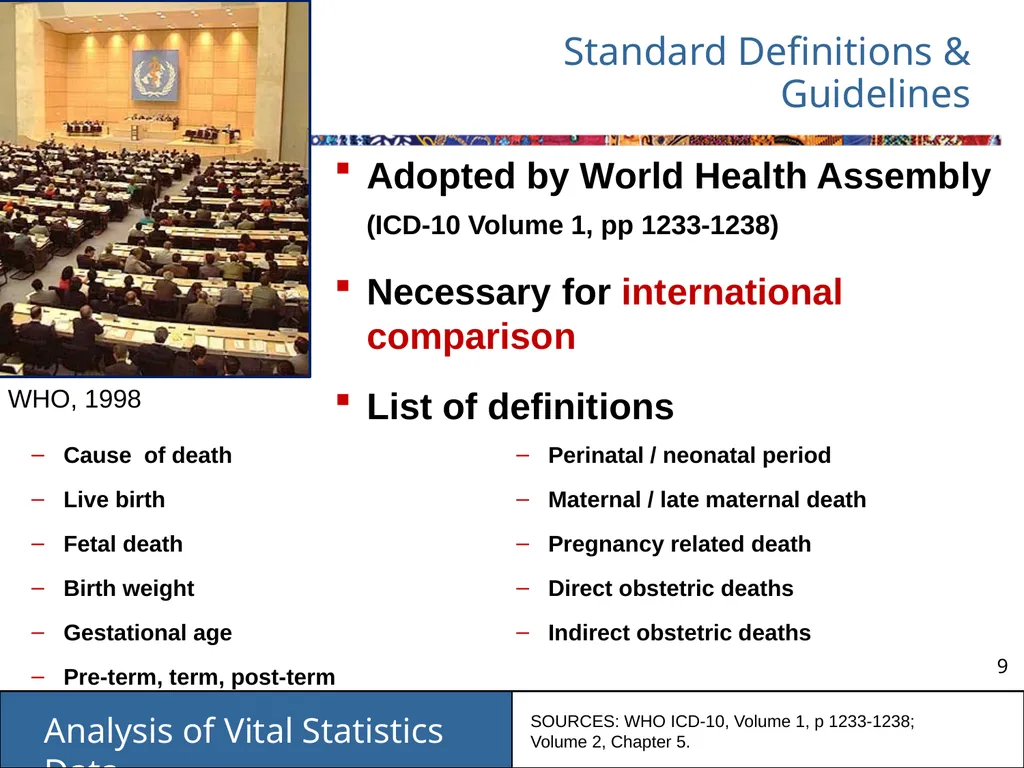
Standard Definitions & Guidelines Adopted by World Health Assembly
(ICD-10 Volume 1, pp 1233-1238)
Necessary for international comparison
List of definitions Cause of death
Live birth
Fetal death
Birth weight
Gestational age
Pre-term, term, post-term
Perinatal / neonatal period
Maternal / late maternal death
Pregnancy related death
Direct obstetric deaths
Indirect obstetric deaths WHO, 1998 SOURCES: WHO ICD-10, Volume 1, p 1233-1238; Volume 2, Chapter 5.<br>
(ICD-10 Volume 1, pp 1233-1238)
Necessary for international comparison
List of definitions Cause of death
Live birth
Fetal death
Birth weight
Gestational age
Pre-term, term, post-term
Perinatal / neonatal period
Maternal / late maternal death
Pregnancy related death
Direct obstetric deaths
Indirect obstetric deaths WHO, 1998 SOURCES: WHO ICD-10, Volume 1, p 1233-1238; Volume 2, Chapter 5.<br>
10
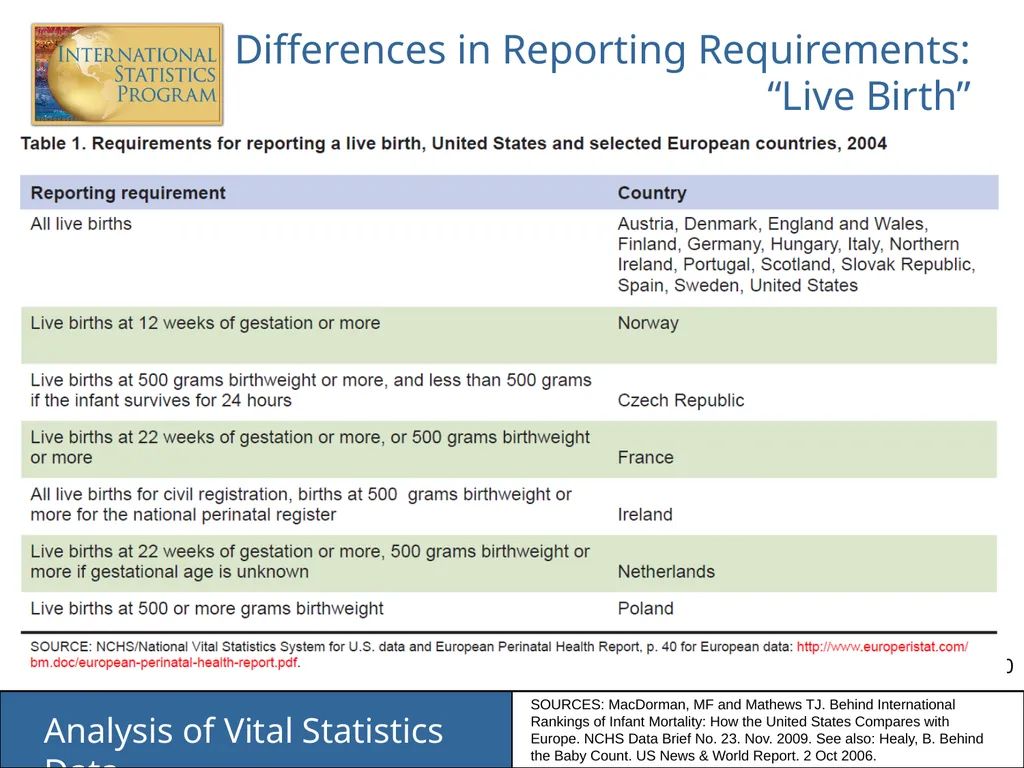
Differences in Reporting Requirements:
“Live Birth” SOURCES: MacDorman, MF and Mathews TJ. Behind International Rankings of Infant Mortality: How the United States Compares with Europe. NCHS Data Brief No. 23. Nov. 2009. See also: Healy, B. Behind the Baby Count. US News & World Report. 2 Oct 2006.<br>
11
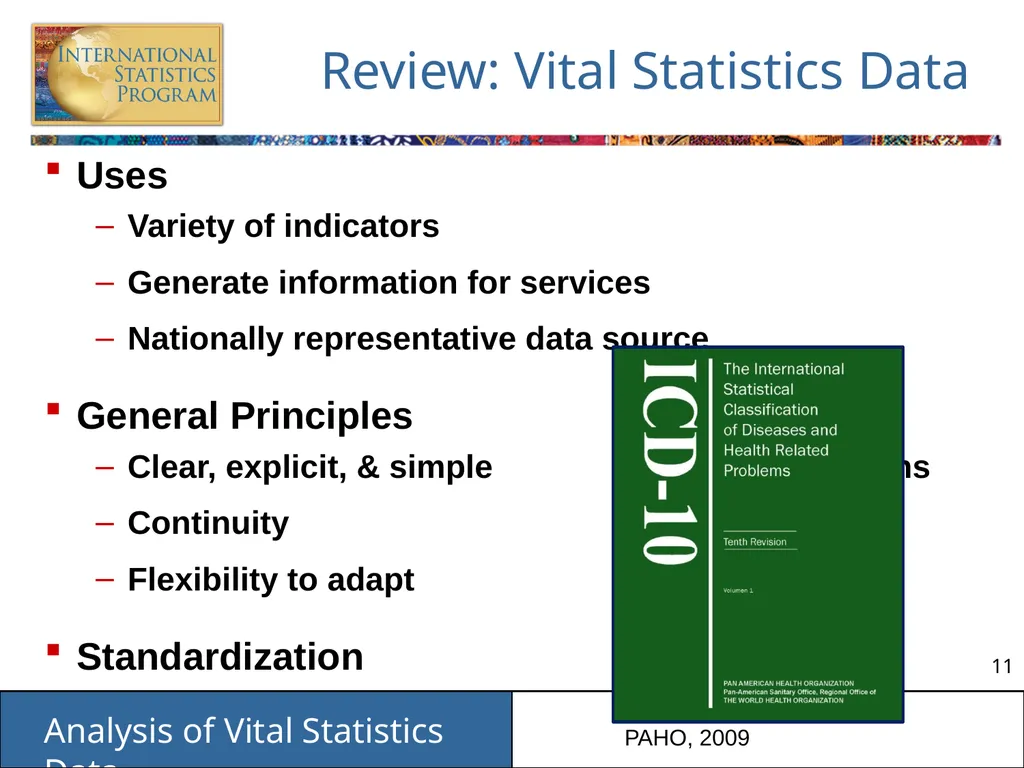
Review: Vital Statistics Data Uses
Variety of indicators
Generate information for services
Nationally representative data source
General Principles
Clear, explicit, & simple definitions
Continuity
Flexibility to adapt
Standardization PAHO, 2009<br>
Variety of indicators
Generate information for services
Nationally representative data source
General Principles
Clear, explicit, & simple definitions
Continuity
Flexibility to adapt
Standardization PAHO, 2009<br>
12
Discuss How are causes of death classified in your country?
How often are the ICD codes revised? What version is currently used in your country?
If ICD10 is in use, what edition of that revision is being used in your country?<br>
How often are the ICD codes revised? What version is currently used in your country?
If ICD10 is in use, what edition of that revision is being used in your country?<br>
13
Types of Vital Statistics Measures:
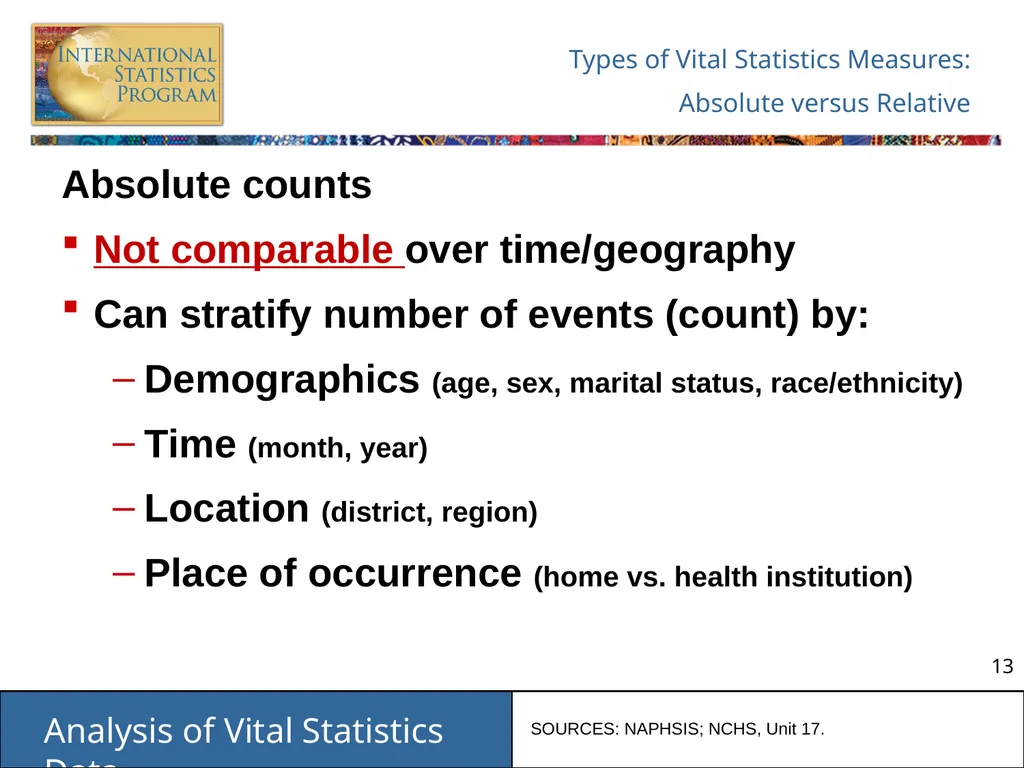
Absolute versus Relative Absolute counts
Not comparable over time/geography
Can stratify number of events (count) by:
Demographics (age, sex, marital status, race/ethnicity)
Time (month, year)
Location (district, region)
Place of occurrence (home vs. health institution) SOURCES: NAPHSIS; NCHS, Unit 17.<br>
Not comparable over time/geography
Can stratify number of events (count) by:
Demographics (age, sex, marital status, race/ethnicity)
Time (month, year)
Location (district, region)
Place of occurrence (home vs. health institution) SOURCES: NAPHSIS; NCHS, Unit 17.<br>
14
Types of Vital Statistics Measures:
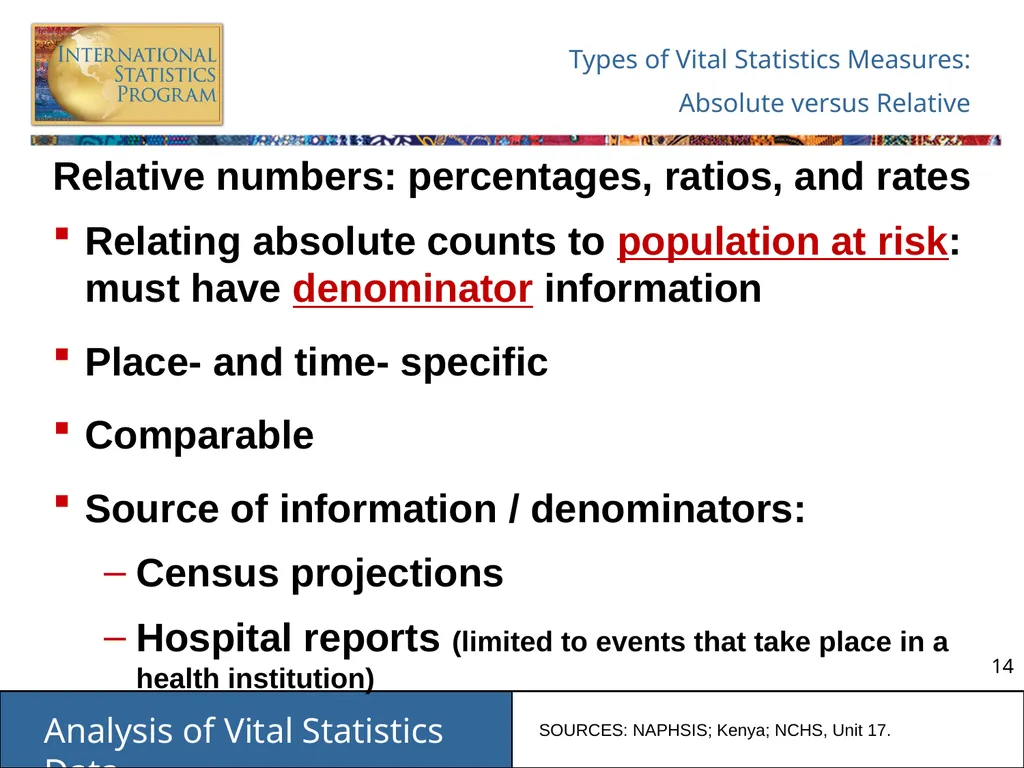
Absolute versus Relative Relative numbers: percentages, ratios, and rates
Relating absolute counts to population at risk: must have denominator information
Place- and time- specific
Comparable
Source of information / denominators:
Census projections
Hospital reports (limited to events that take place in a health institution) SOURCES: NAPHSIS; Kenya; NCHS, Unit 17.<br>
Relating absolute counts to population at risk: must have denominator information
Place- and time- specific
Comparable
Source of information / denominators:
Census projections
Hospital reports (limited to events that take place in a health institution) SOURCES: NAPHSIS; Kenya; NCHS, Unit 17.<br>
15
Types of Vital Statistics Measures:
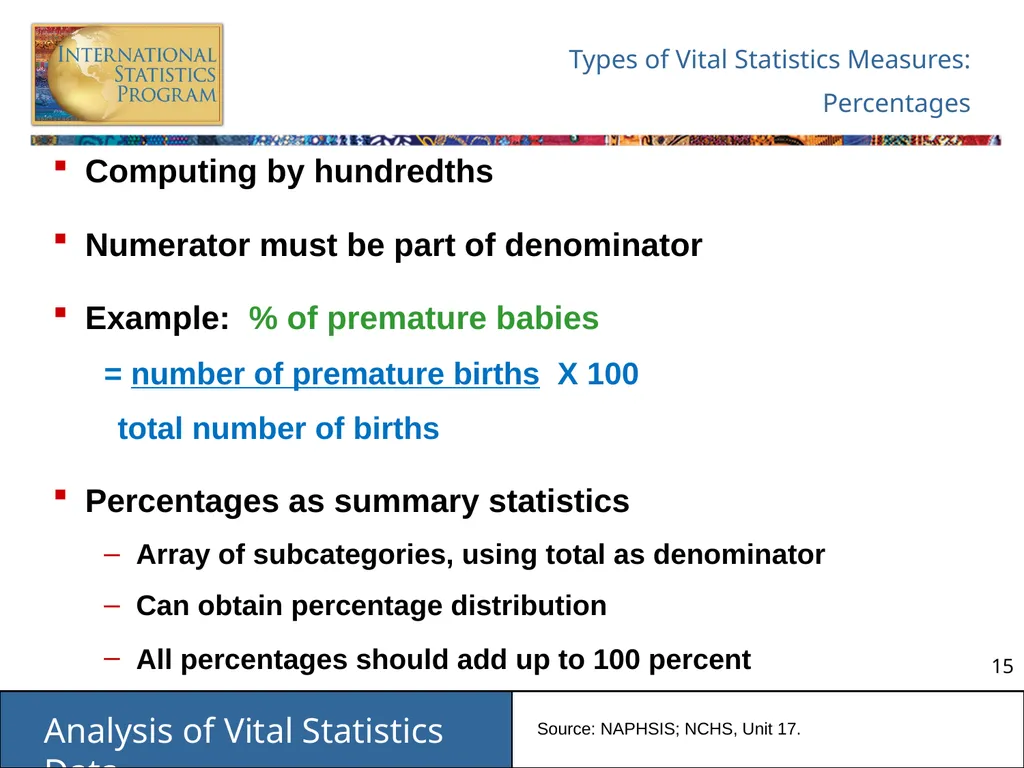
Percentages Computing by hundredths
Numerator must be part of denominator
Example: % of premature babies
= number of premature births X 100
total number of births
Percentages as summary statistics
Array of subcategories, using total as denominator
Can obtain percentage distribution
All percentages should add up to 100 percent Source: NAPHSIS; NCHS, Unit 17.<br>
Numerator must be part of denominator
Example: % of premature babies
= number of premature births X 100
total number of births
Percentages as summary statistics
Array of subcategories, using total as denominator
Can obtain percentage distribution
All percentages should add up to 100 percent Source: NAPHSIS; NCHS, Unit 17.<br>
16
Types of Vital Statistics Measures:
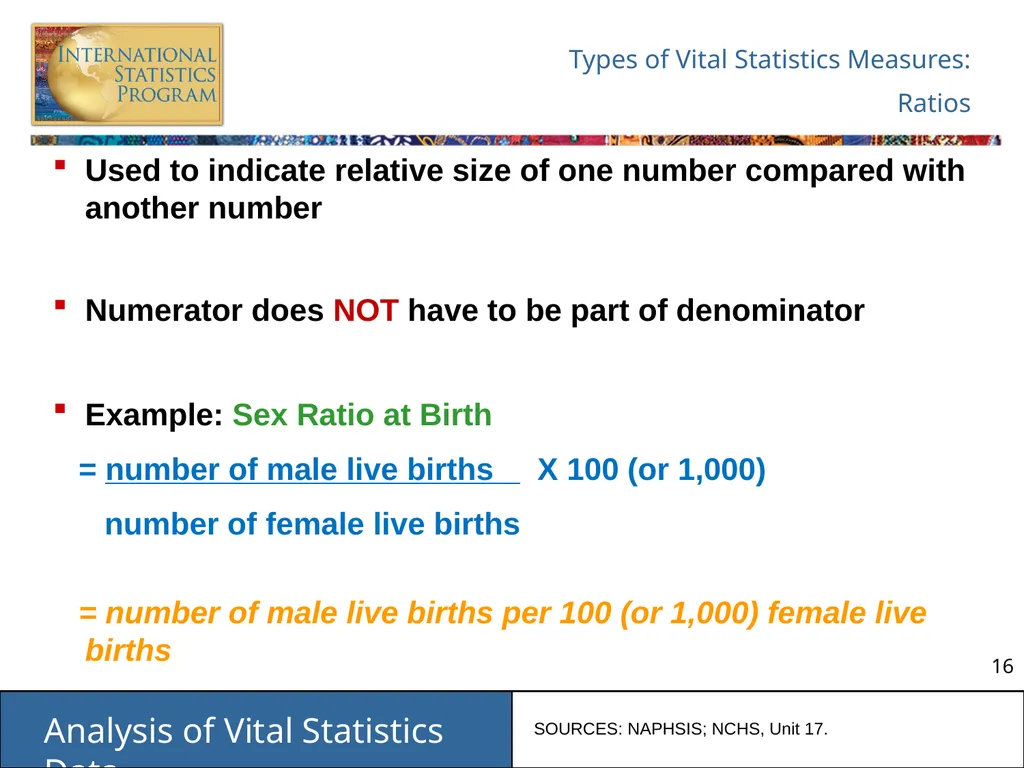
Ratios Used to indicate relative size of one number compared with another number
Numerator does NOT have to be part of denominator
Example: Sex Ratio at Birth
= number of male live births X 100 (or 1,000)
number of female live births
= number of male live births per 100 (or 1,000) female live births SOURCES: NAPHSIS; NCHS, Unit 17.<br>
Numerator does NOT have to be part of denominator
Example: Sex Ratio at Birth
= number of male live births X 100 (or 1,000)
number of female live births
= number of male live births per 100 (or 1,000) female live births SOURCES: NAPHSIS; NCHS, Unit 17.<br>
17
Types of Vital Statistics Measures:
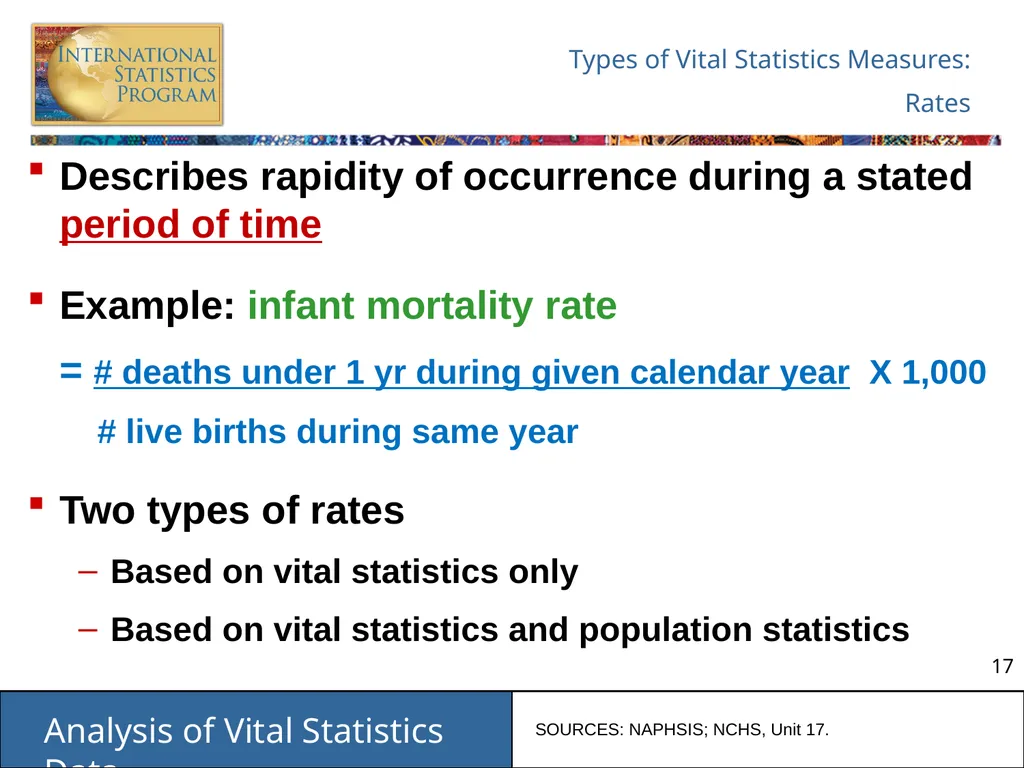
Rates Describes rapidity of occurrence during a stated period of time
Example: infant mortality rate
= # deaths under 1 yr during given calendar year X 1,000
# live births during same year
Two types of rates
Based on vital statistics only
Based on vital statistics and population statistics SOURCES: NAPHSIS; NCHS, Unit 17.<br>
Example: infant mortality rate
= # deaths under 1 yr during given calendar year X 1,000
# live births during same year
Two types of rates
Based on vital statistics only
Based on vital statistics and population statistics SOURCES: NAPHSIS; NCHS, Unit 17.<br>
18
Types of Vital Statistics Measures:
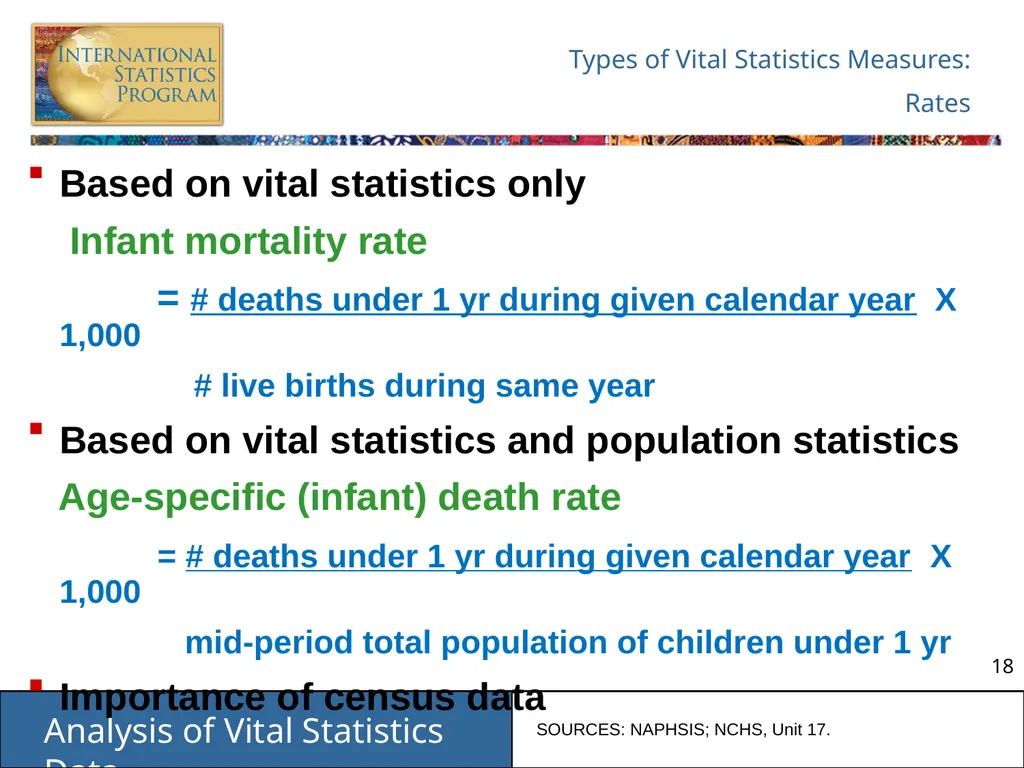
Rates Based on vital statistics only
Infant mortality rate
= # deaths under 1 yr during given calendar year X 1,000
# live births during same year
Based on vital statistics and population statistics
Age-specific (infant) death rate
= # deaths under 1 yr during given calendar year X 1,000
mid-period total population of children under 1 yr
Importance of census data SOURCES: NAPHSIS; NCHS, Unit 17.<br>
Infant mortality rate
= # deaths under 1 yr during given calendar year X 1,000
# live births during same year
Based on vital statistics and population statistics
Age-specific (infant) death rate
= # deaths under 1 yr during given calendar year X 1,000
mid-period total population of children under 1 yr
Importance of census data SOURCES: NAPHSIS; NCHS, Unit 17.<br>
19
Discuss How will percentages help you to summarize statistical data?<br>
20
Review: Types of Vital Statistics Measures Absolute versus relative
Percentages
Ratios
Rates<br>
Percentages
Ratios
Rates<br>
21
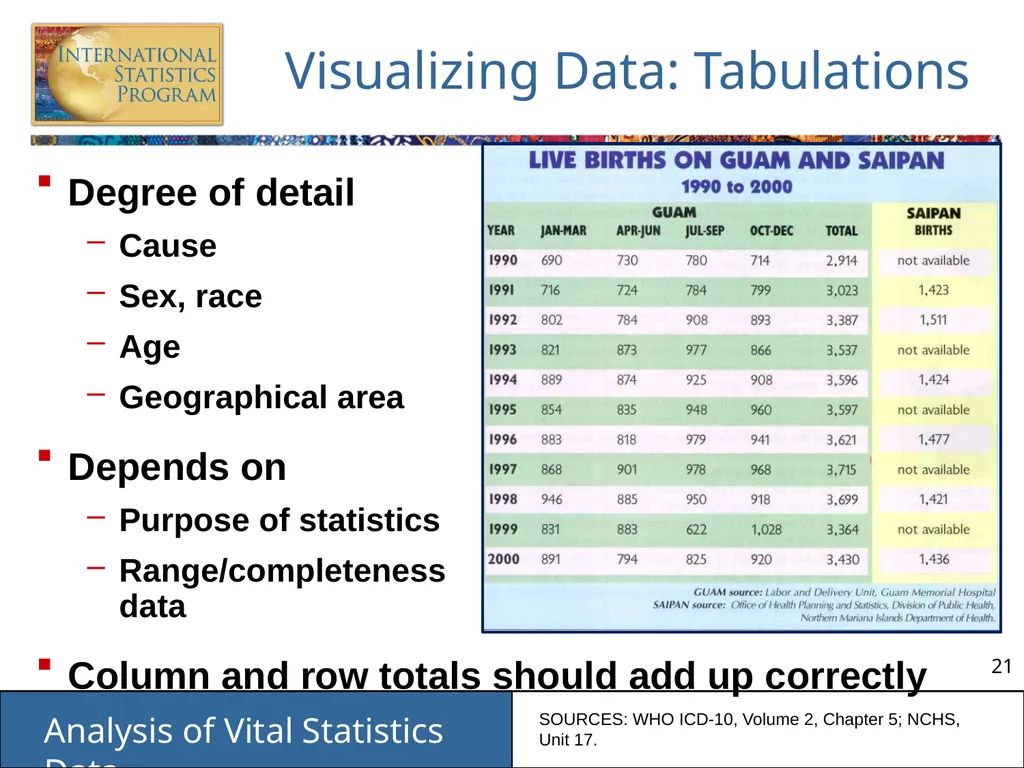
Visualizing Data: Tabulations Degree of detail
Cause
Sex, race
Age
Geographical area
Depends on
Purpose of statistics
Range/completeness of data
Column and row totals should add up correctly SOURCES: WHO ICD-10, Volume 2, Chapter 5; NCHS, Unit 17.<br>
Cause
Sex, race
Age
Geographical area
Depends on
Purpose of statistics
Range/completeness of data
Column and row totals should add up correctly SOURCES: WHO ICD-10, Volume 2, Chapter 5; NCHS, Unit 17.<br>
22
Tabulations:
Specify Time Reference By date of registration
For provisional tabulations only
Need to evaluate differences expected
May be quicker for weekly, monthly, or quarterly summaries
By date of occurrence of event
Recommended for final tabulations
Must define “cut-off” date for reporting events
Legislation
Organizational structure SOURCES: WHO ICD-10, Volume 2, Chapter 5; UN Handbook, Module 18, A1.<br>
For provisional tabulations only
Need to evaluate differences expected
May be quicker for weekly, monthly, or quarterly summaries
By date of occurrence of event
Recommended for final tabulations
Must define “cut-off” date for reporting events
Legislation
Organizational structure SOURCES: WHO ICD-10, Volume 2, Chapter 5; UN Handbook, Module 18, A1.<br>
23
Tabulations:
Specify Geographic Reference Goal: complete coverage of country’s total population
May focus on areas of known coverage
Incentive for lower-quality areas to improve
Interim measure
Data not nationally representative; supplement data:
Statistical adjustment for under-reporting
Collecting supplementary data by field surveys SOURCES: WHO ICD-10, Volume 2, Chapter 5; UN Handbook, Module 18, A2.<br>
May focus on areas of known coverage
Incentive for lower-quality areas to improve
Interim measure
Data not nationally representative; supplement data:
Statistical adjustment for under-reporting
Collecting supplementary data by field surveys SOURCES: WHO ICD-10, Volume 2, Chapter 5; UN Handbook, Module 18, A2.<br>
24
Tabulations:
Specify Geographic Reference Normal assumption: little difference between resident population & population present
By place of usual residence
Use for final tabulations for civil divisions & large cities
Can present by events of residents versus non-residents
Must consider legal definition of “residence”
By place of occurrence:
Recommended for subnational areas SOURCES: WHO ICD-10, Volume 2, Chapter 5; UN Handbook, Module 18, A2.<br>
By place of usual residence
Use for final tabulations for civil divisions & large cities
Can present by events of residents versus non-residents
Must consider legal definition of “residence”
By place of occurrence:
Recommended for subnational areas SOURCES: WHO ICD-10, Volume 2, Chapter 5; UN Handbook, Module 18, A2.<br>
25
Visualizing Data:
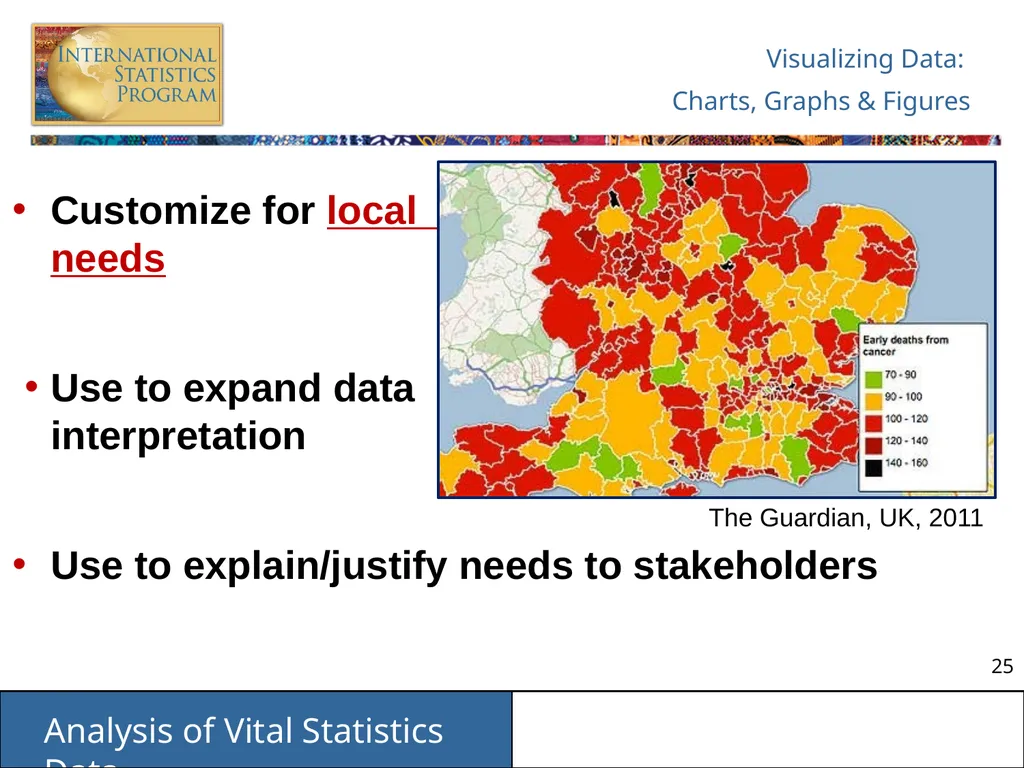
Charts, Graphs & Figures Customize for local needs
Use to expand data interpretation
Use to explain/justify needs to stakeholders The Guardian, UK, 2011<br>
Use to expand data interpretation
Use to explain/justify needs to stakeholders The Guardian, UK, 2011<br>
26
Review: Visualizing Data Tabulations
Time reference
Geographic reference
Charts, graphs, & figures<br>
Time reference
Geographic reference
Charts, graphs, & figures<br>
27
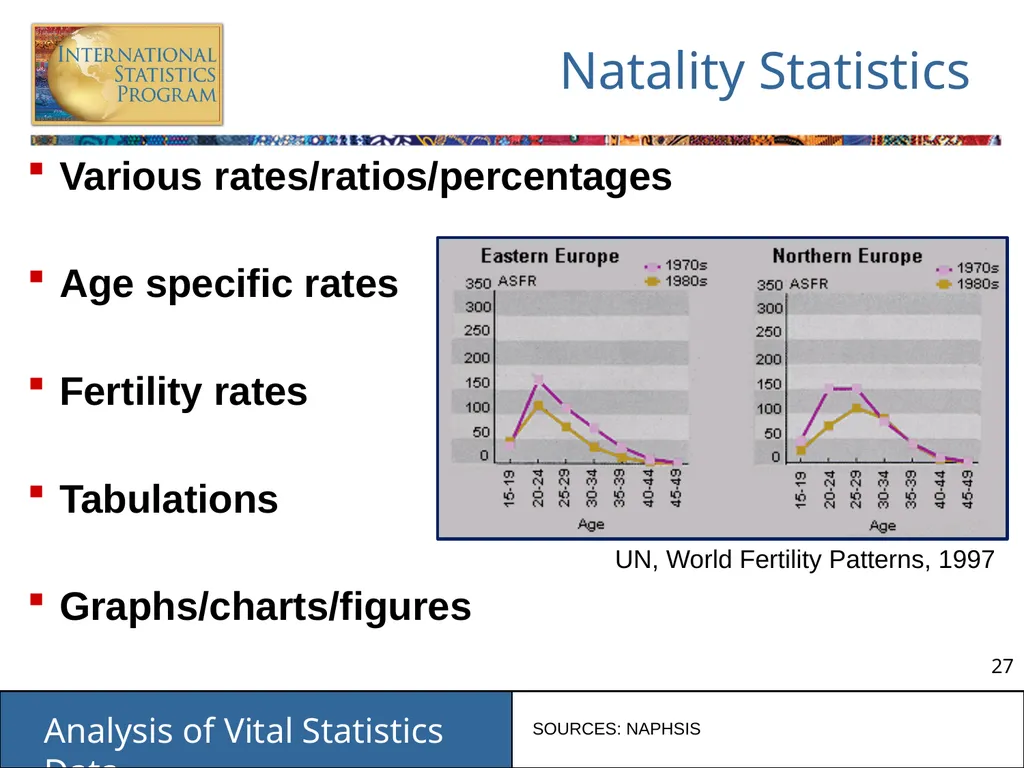
Natality Statistics Various rates/ratios/percentages
Age specific rates
Fertility rates
Tabulations
Graphs/charts/figures UN, World Fertility Patterns, 1997 SOURCES: NAPHSIS<br>
Age specific rates
Fertility rates
Tabulations
Graphs/charts/figures UN, World Fertility Patterns, 1997 SOURCES: NAPHSIS<br>
28
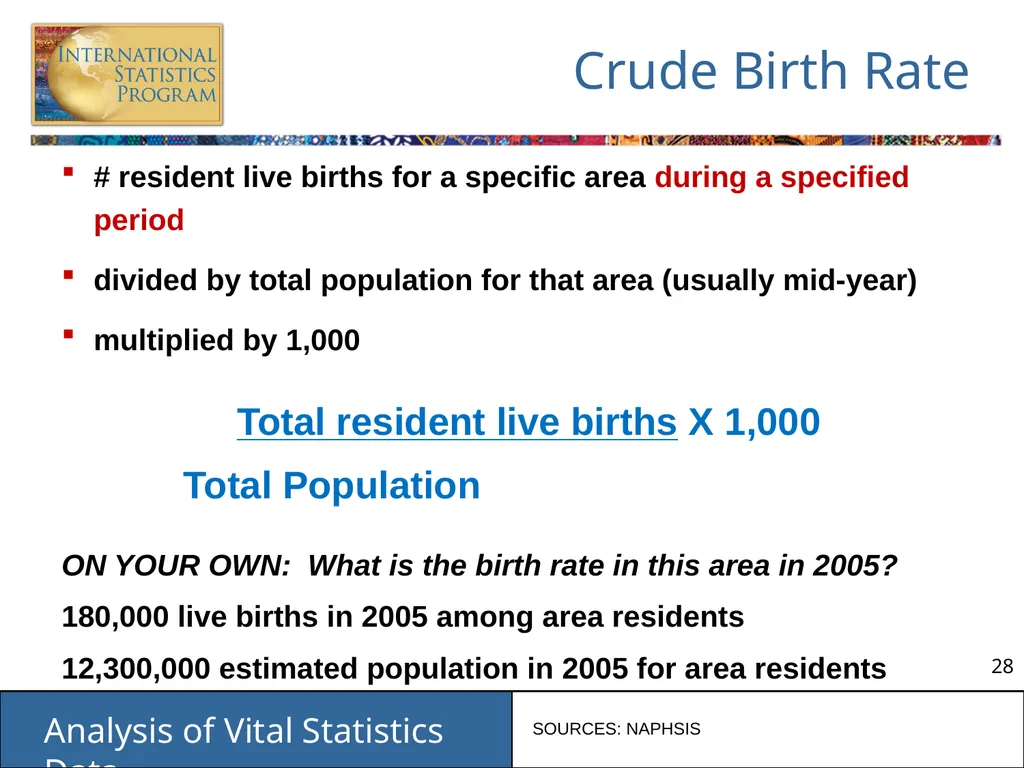
Crude Birth Rate # resident live births for a specific area during a specified period
divided by total population for that area (usually mid-year)
multiplied by 1,000
Total resident live births X 1,000
Total Population
ON YOUR OWN: What is the birth rate in this area in 2005?
180,000 live births in 2005 among area residents
12,300,000 estimated population in 2005 for area residents SOURCES: NAPHSIS<br>
divided by total population for that area (usually mid-year)
multiplied by 1,000
Total resident live births X 1,000
Total Population
ON YOUR OWN: What is the birth rate in this area in 2005?
180,000 live births in 2005 among area residents
12,300,000 estimated population in 2005 for area residents SOURCES: NAPHSIS<br>
29
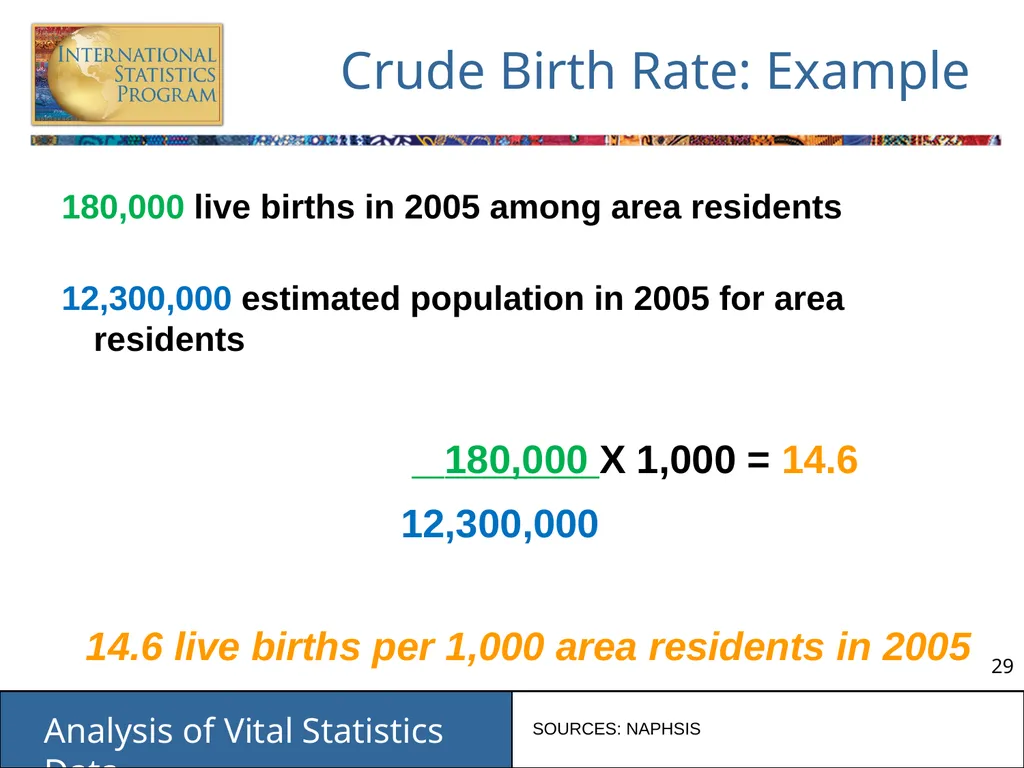
Crude Birth Rate: Example 180,000 live births in 2005 among area residents
12,300,000 estimated population in 2005 for area residents
180,000 X 1,000 = 14.6
12,300,000
14.6 live births per 1,000 area residents in 2005 SOURCES: NAPHSIS<br>
12,300,000 estimated population in 2005 for area residents
180,000 X 1,000 = 14.6
12,300,000
14.6 live births per 1,000 area residents in 2005 SOURCES: NAPHSIS<br>
30
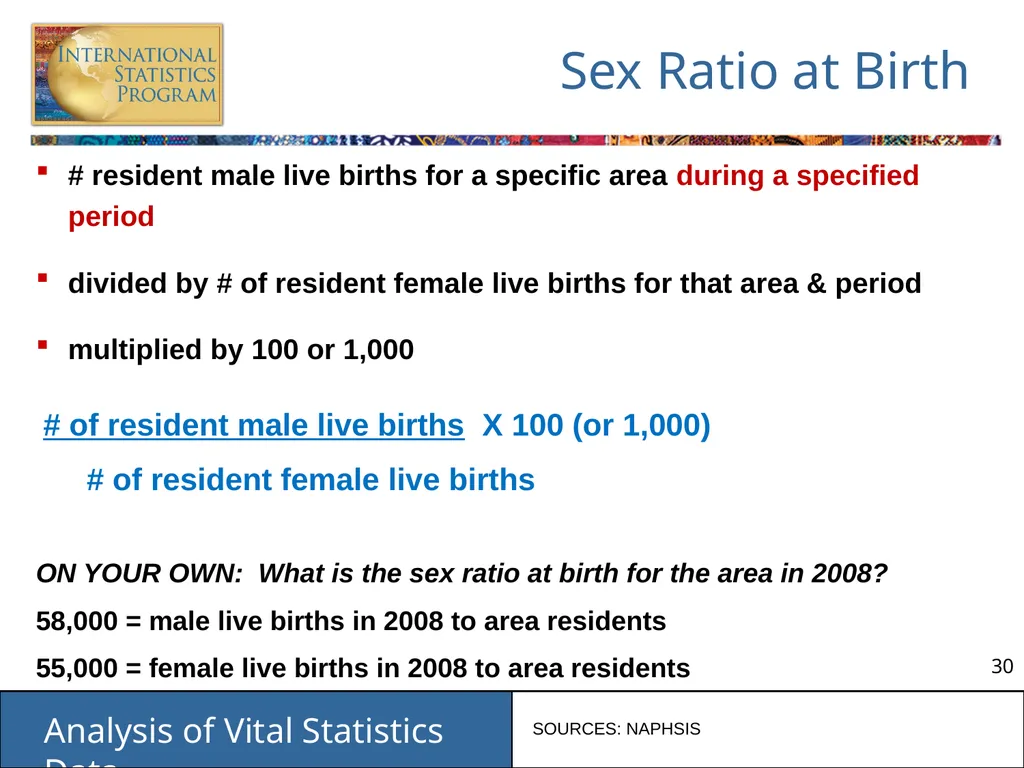
Sex Ratio at Birth # resident male live births for a specific area during a specified period
divided by # of resident female live births for that area & period
multiplied by 100 or 1,000
# of resident male live births X 100 (or 1,000)
# of resident female live births
ON YOUR OWN: What is the sex ratio at birth for the area in 2008?
58,000 = male live births in 2008 to area residents
55,000 = female live births in 2008 to area residents SOURCES: NAPHSIS<br>
divided by # of resident female live births for that area & period
multiplied by 100 or 1,000
# of resident male live births X 100 (or 1,000)
# of resident female live births
ON YOUR OWN: What is the sex ratio at birth for the area in 2008?
58,000 = male live births in 2008 to area residents
55,000 = female live births in 2008 to area residents SOURCES: NAPHSIS<br>
31
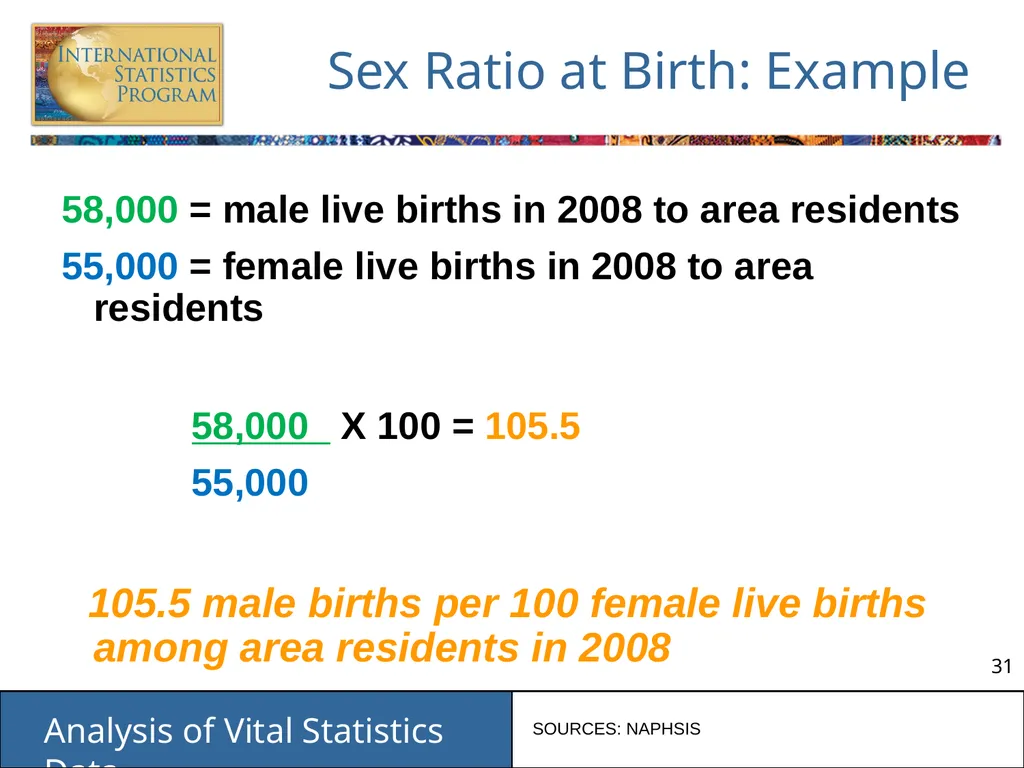
Sex Ratio at Birth: Example 58,000 = male live births in 2008 to area residents
55,000 = female live births in 2008 to area residents
58,000 X 100 = 105.5
55,000
105.5 male births per 100 female live births among area residents in 2008 SOURCES: NAPHSIS<br>
55,000 = female live births in 2008 to area residents
58,000 X 100 = 105.5
55,000
105.5 male births per 100 female live births among area residents in 2008 SOURCES: NAPHSIS<br>
32
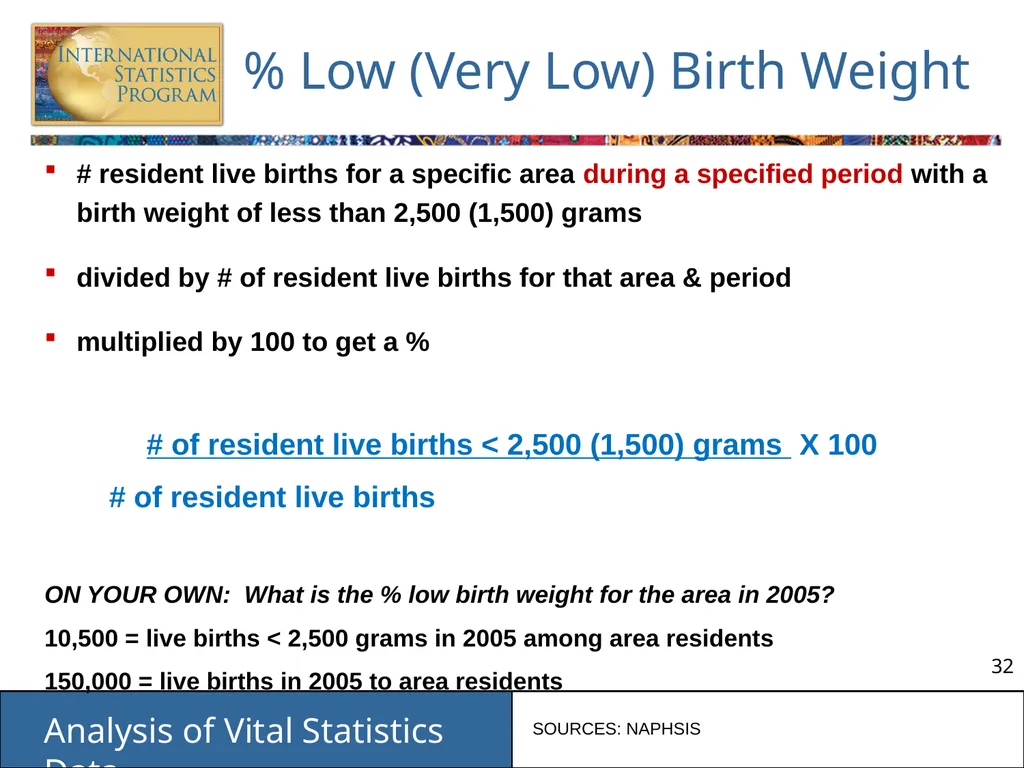
% Low (Very Low) Birth Weight # resident live births for a specific area during a specified period with a birth weight of less than 2,500 (1,500) grams
divided by # of resident live births for that area & period
multiplied by 100 to get a %
# of resident live births < 2,500 (1,500) grams X 100
# of resident live births
ON YOUR OWN: What is the % low birth weight for the area in 2005?
10,500 = live births < 2,500 grams in 2005 among area residents
150,000 = live births in 2005 to area residents SOURCES: NAPHSIS<br>
divided by # of resident live births for that area & period
multiplied by 100 to get a %
# of resident live births < 2,500 (1,500) grams X 100
# of resident live births
ON YOUR OWN: What is the % low birth weight for the area in 2005?
10,500 = live births < 2,500 grams in 2005 among area residents
150,000 = live births in 2005 to area residents SOURCES: NAPHSIS<br>
33
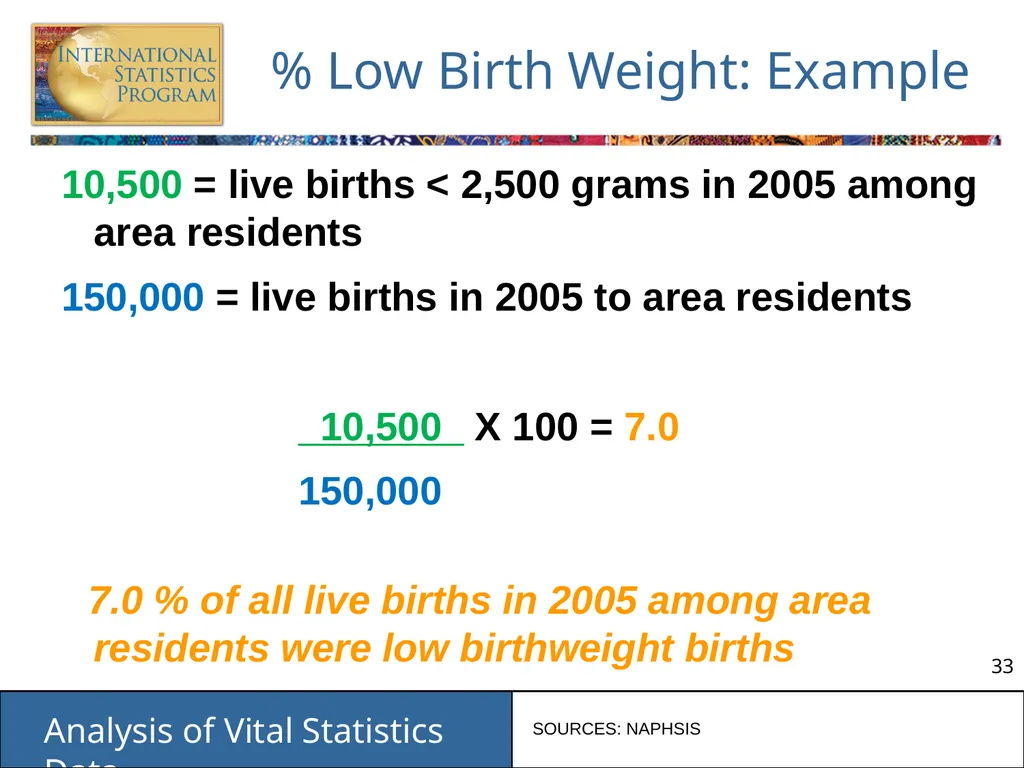
% Low Birth Weight: Example 10,500 = live births < 2,500 grams in 2005 among area residents
150,000 = live births in 2005 to area residents
_10,500_ X 100 = 7.0
150,000
7.0 % of all live births in 2005 among area residents were low birthweight births SOURCES: NAPHSIS<br>
150,000 = live births in 2005 to area residents
_10,500_ X 100 = 7.0
150,000
7.0 % of all live births in 2005 among area residents were low birthweight births SOURCES: NAPHSIS<br>
34
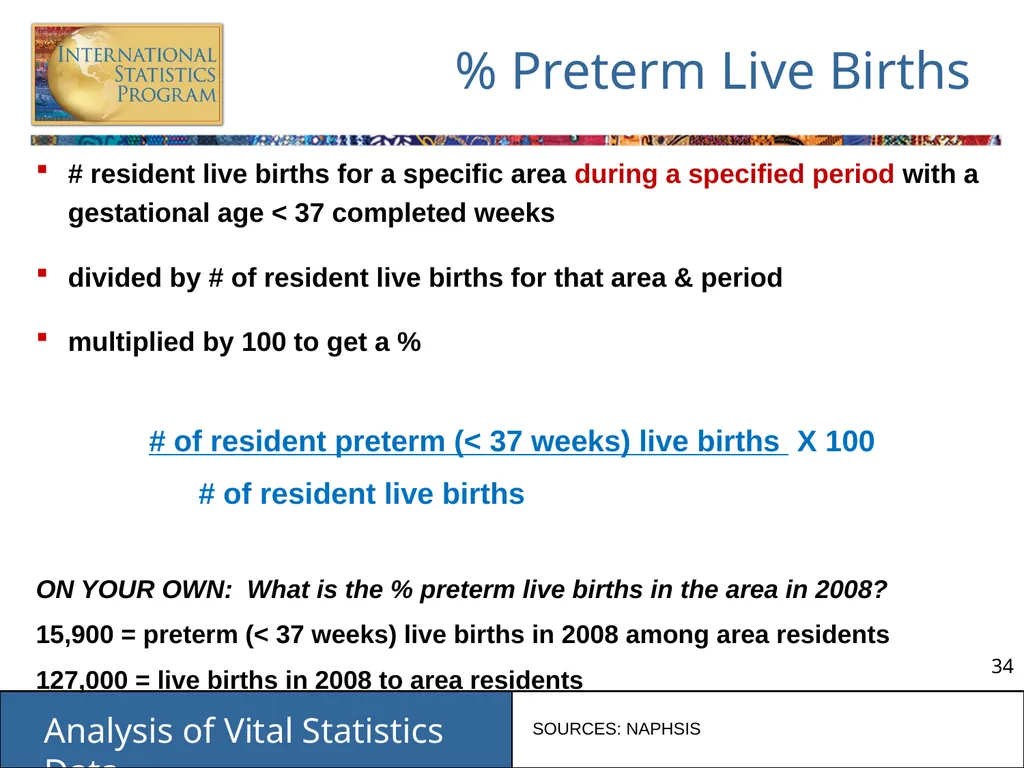
% Preterm Live Births # resident live births for a specific area during a specified period with a gestational age < 37 completed weeks
divided by # of resident live births for that area & period
multiplied by 100 to get a %
# of resident preterm (< 37 weeks) live births X 100
# of resident live births
ON YOUR OWN: What is the % preterm live births in the area in 2008?
15,900 = preterm (< 37 weeks) live births in 2008 among area residents
127,000 = live births in 2008 to area residents SOURCES: NAPHSIS<br>
divided by # of resident live births for that area & period
multiplied by 100 to get a %
# of resident preterm (< 37 weeks) live births X 100
# of resident live births
ON YOUR OWN: What is the % preterm live births in the area in 2008?
15,900 = preterm (< 37 weeks) live births in 2008 among area residents
127,000 = live births in 2008 to area residents SOURCES: NAPHSIS<br>
35
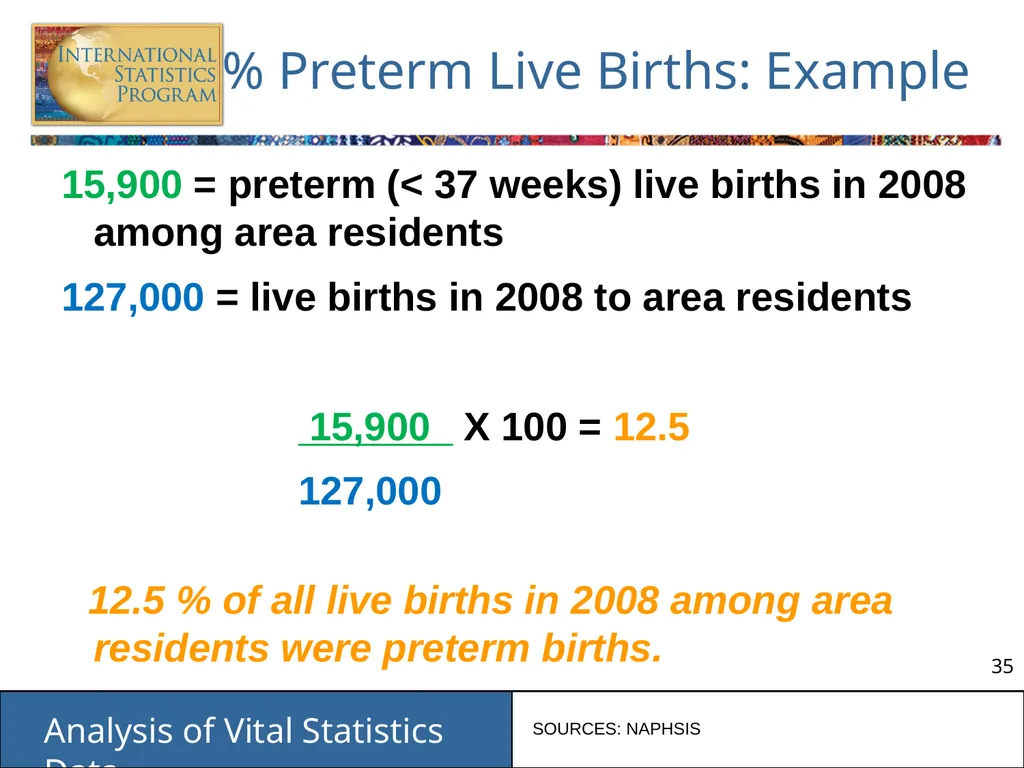
% Preterm Live Births: Example 15,900 = preterm (< 37 weeks) live births in 2008 among area residents
127,000 = live births in 2008 to area residents
15,900 X 100 = 12.5
127,000
12.5 % of all live births in 2008 among area residents were preterm births. SOURCES: NAPHSIS<br>
127,000 = live births in 2008 to area residents
15,900 X 100 = 12.5
127,000
12.5 % of all live births in 2008 among area residents were preterm births. SOURCES: NAPHSIS<br>
36
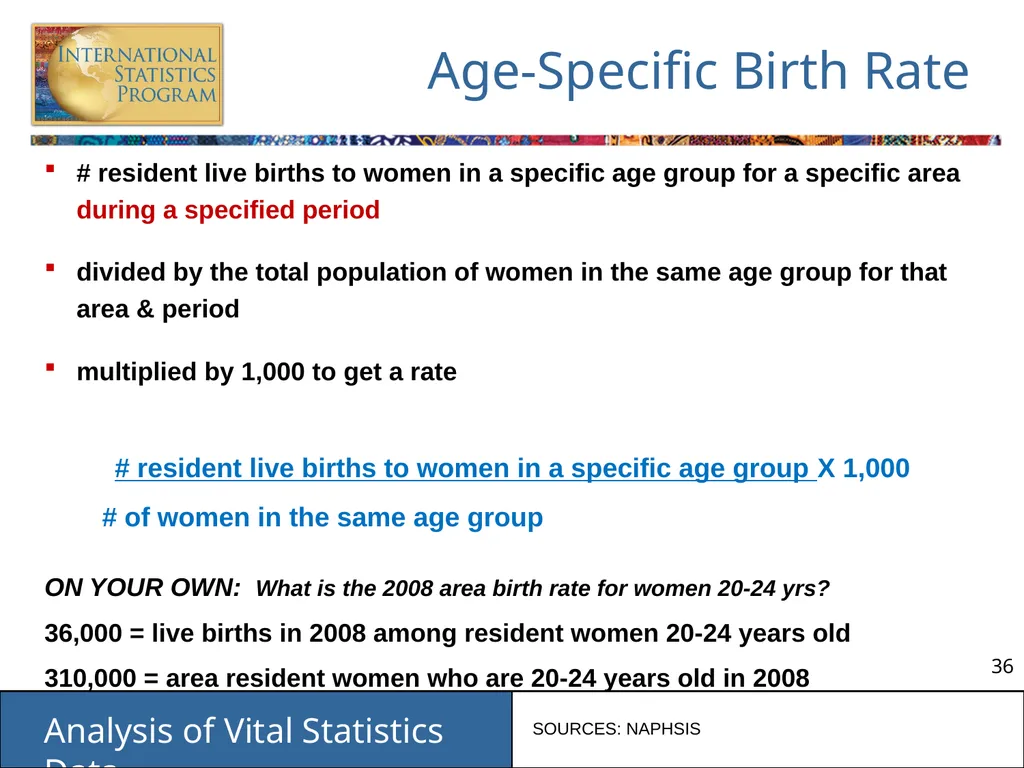
Age-Specific Birth Rate # resident live births to women in a specific age group for a specific area during a specified period
divided by the total population of women in the same age group for that area & period
multiplied by 1,000 to get a rate
# resident live births to women in a specific age group X 1,000
# of women in the same age group
ON YOUR OWN: What is the 2008 area birth rate for women 20-24 yrs?
36,000 = live births in 2008 among resident women 20-24 years old
310,000 = area resident women who are 20-24 years old in 2008 SOURCES: NAPHSIS<br>
divided by the total population of women in the same age group for that area & period
multiplied by 1,000 to get a rate
# resident live births to women in a specific age group X 1,000
# of women in the same age group
ON YOUR OWN: What is the 2008 area birth rate for women 20-24 yrs?
36,000 = live births in 2008 among resident women 20-24 years old
310,000 = area resident women who are 20-24 years old in 2008 SOURCES: NAPHSIS<br>
37
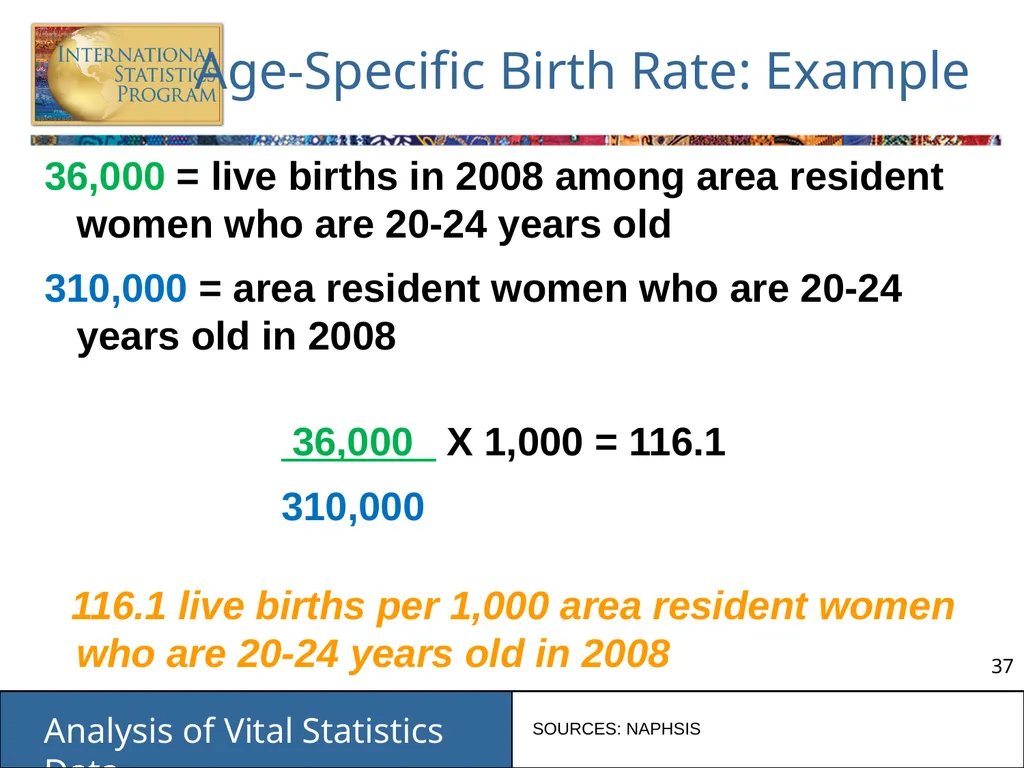
Age-Specific Birth Rate: Example 36,000 = live births in 2008 among area resident women who are 20-24 years old
310,000 = area resident women who are 20-24 years old in 2008
36,000 X 1,000 = 116.1
310,000
116.1 live births per 1,000 area resident women who are 20-24 years old in 2008 SOURCES: NAPHSIS<br>
310,000 = area resident women who are 20-24 years old in 2008
36,000 X 1,000 = 116.1
310,000
116.1 live births per 1,000 area resident women who are 20-24 years old in 2008 SOURCES: NAPHSIS<br>
38
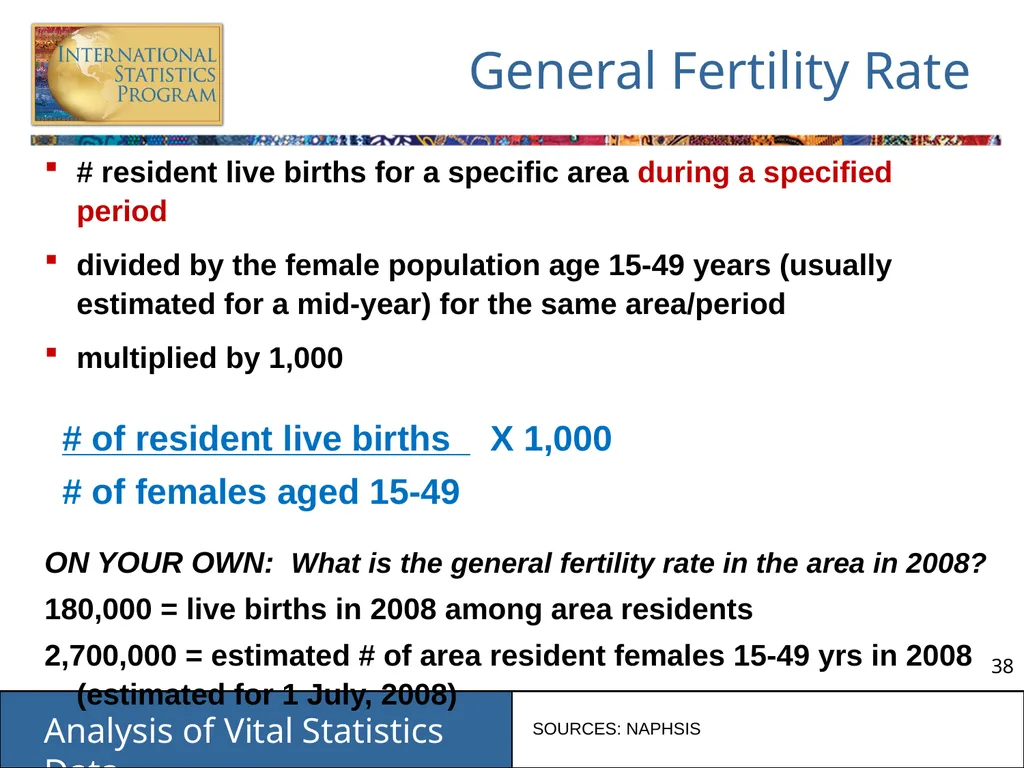
General Fertility Rate # resident live births for a specific area during a specified period
divided by the female population age 15-49 years (usually estimated for a mid-year) for the same area/period
multiplied by 1,000
# of resident live births X 1,000
# of females aged 15-49
ON YOUR OWN: What is the general fertility rate in the area in 2008?
180,000 = live births in 2008 among area residents
2,700,000 = estimated # of area resident females 15-49 yrs in 2008 (estimated for 1 July, 2008) SOURCES: NAPHSIS<br>
divided by the female population age 15-49 years (usually estimated for a mid-year) for the same area/period
multiplied by 1,000
# of resident live births X 1,000
# of females aged 15-49
ON YOUR OWN: What is the general fertility rate in the area in 2008?
180,000 = live births in 2008 among area residents
2,700,000 = estimated # of area resident females 15-49 yrs in 2008 (estimated for 1 July, 2008) SOURCES: NAPHSIS<br>
39
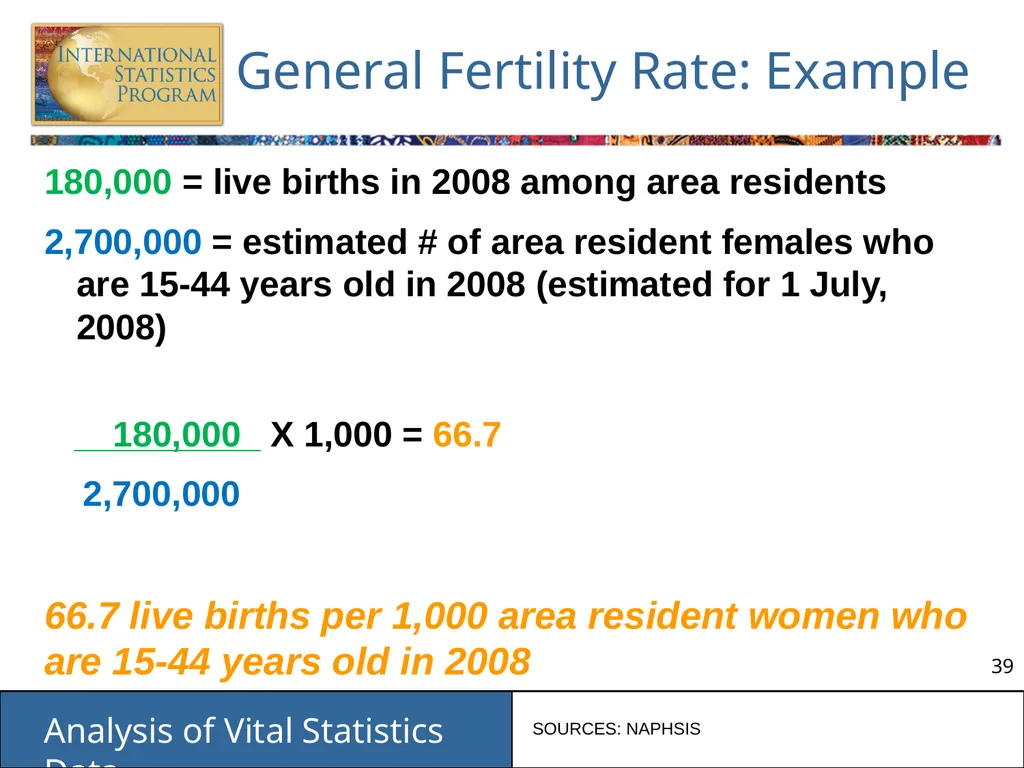
General Fertility Rate: Example 180,000 = live births in 2008 among area residents
2,700,000 = estimated # of area resident females who are 15-44 years old in 2008 (estimated for 1 July, 2008)
180,000 X 1,000 = 66.7
2,700,000
66.7 live births per 1,000 area resident women who are 15-44 years old in 2008 SOURCES: NAPHSIS<br>
2,700,000 = estimated # of area resident females who are 15-44 years old in 2008 (estimated for 1 July, 2008)
180,000 X 1,000 = 66.7
2,700,000
66.7 live births per 1,000 area resident women who are 15-44 years old in 2008 SOURCES: NAPHSIS<br>
40
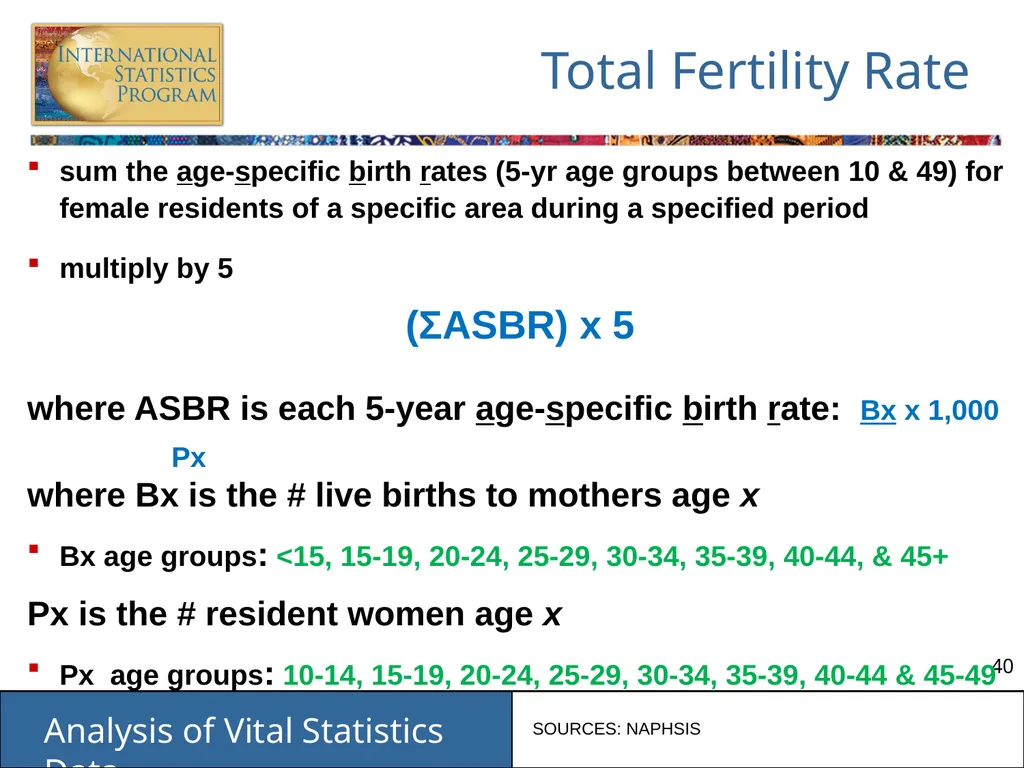
Total Fertility Rate sum the age-specific birth rates (5-yr age groups between 10 & 49) for female residents of a specific area during a specified period
multiply by 5
(ΣASBR) x 5
where ASBR is each 5-year age-specific birth rate: Bx x 1,000
Px
where Bx is the # live births to mothers age x
Bx age groups: <15, 15-19, 20-24, 25-29, 30-34, 35-39, 40-44, & 45+
Px is the # resident women age x
Px age groups: 10-14, 15-19, 20-24, 25-29, 30-34, 35-39, 40-44 & 45-49 SOURCES: NAPHSIS<br>
multiply by 5
(ΣASBR) x 5
where ASBR is each 5-year age-specific birth rate: Bx x 1,000
Px
where Bx is the # live births to mothers age x
Bx age groups: <15, 15-19, 20-24, 25-29, 30-34, 35-39, 40-44, & 45+
Px is the # resident women age x
Px age groups: 10-14, 15-19, 20-24, 25-29, 30-34, 35-39, 40-44 & 45-49 SOURCES: NAPHSIS<br>
41
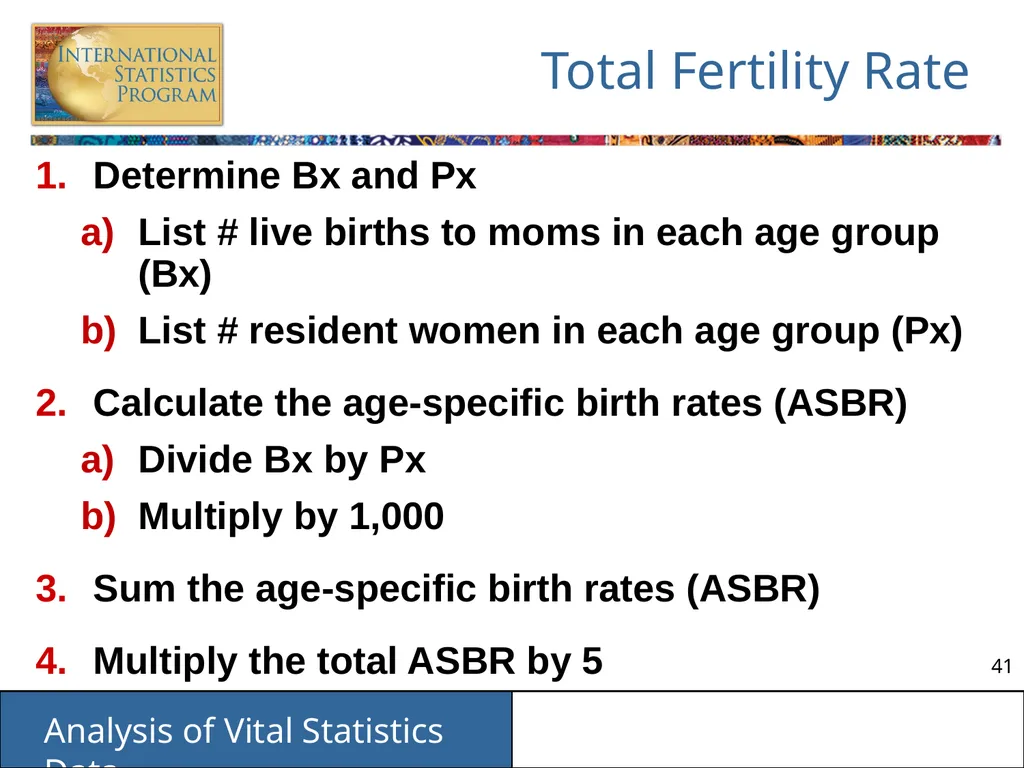
Total Fertility Rate Determine Bx and Px
List # live births to moms in each age group (Bx)
List # resident women in each age group (Px)
Calculate the age-specific birth rates (ASBR)
Divide Bx by Px
Multiply by 1,000
Sum the age-specific birth rates (ASBR)
Multiply the total ASBR by 5<br>
List # live births to moms in each age group (Bx)
List # resident women in each age group (Px)
Calculate the age-specific birth rates (ASBR)
Divide Bx by Px
Multiply by 1,000
Sum the age-specific birth rates (ASBR)
Multiply the total ASBR by 5<br>
42
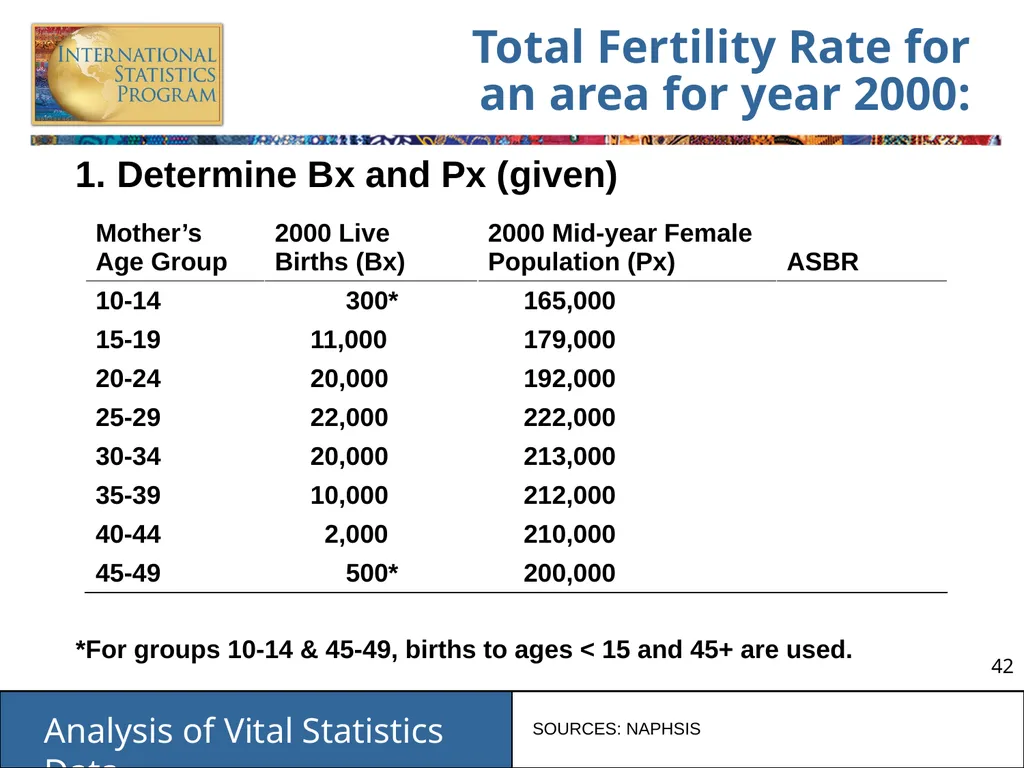
Total Fertility Rate for
an area for year 2000: 1. Determine Bx and Px (given)
*For groups 10-14 & 45-49, births to ages < 15 and 45+ are used. SOURCES: NAPHSIS<br>
*For groups 10-14 & 45-49, births to ages < 15 and 45+ are used. SOURCES: NAPHSIS<br>
43
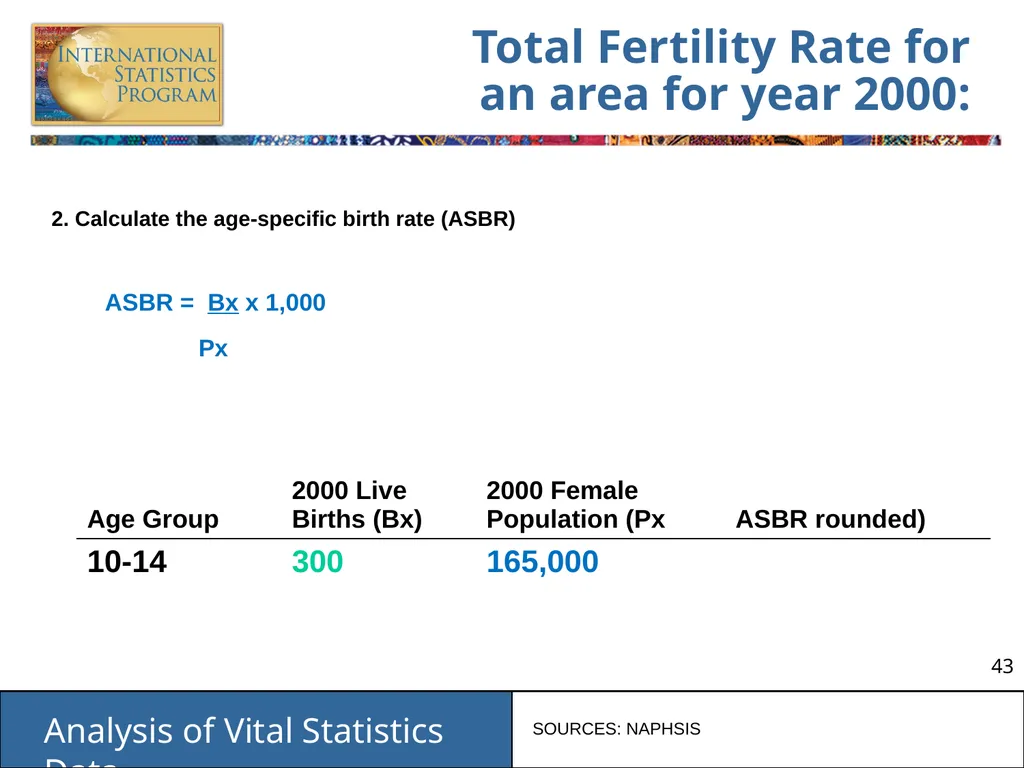
Total Fertility Rate for
an area for year 2000: 2. Calculate the age-specific birth rate (ASBR)
ASBR = Bx x 1,000
Px SOURCES: NAPHSIS<br>
ASBR = Bx x 1,000
Px SOURCES: NAPHSIS<br>
44
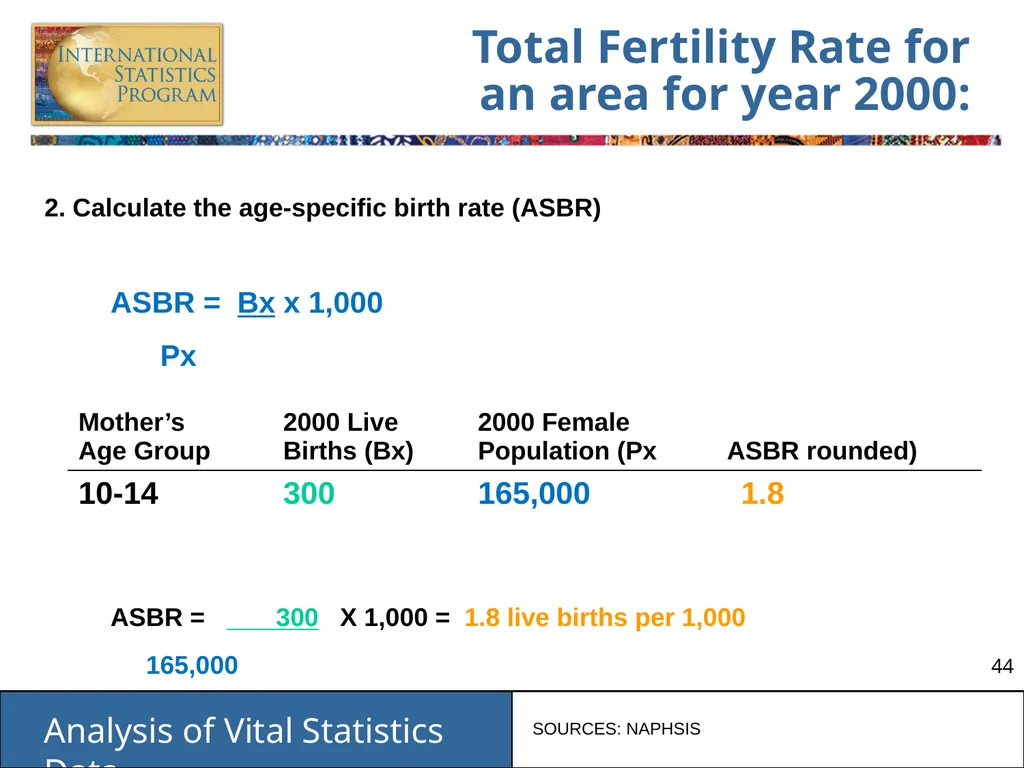
2. Calculate the age-specific birth rate (ASBR)
ASBR = Bx x 1,000
Px
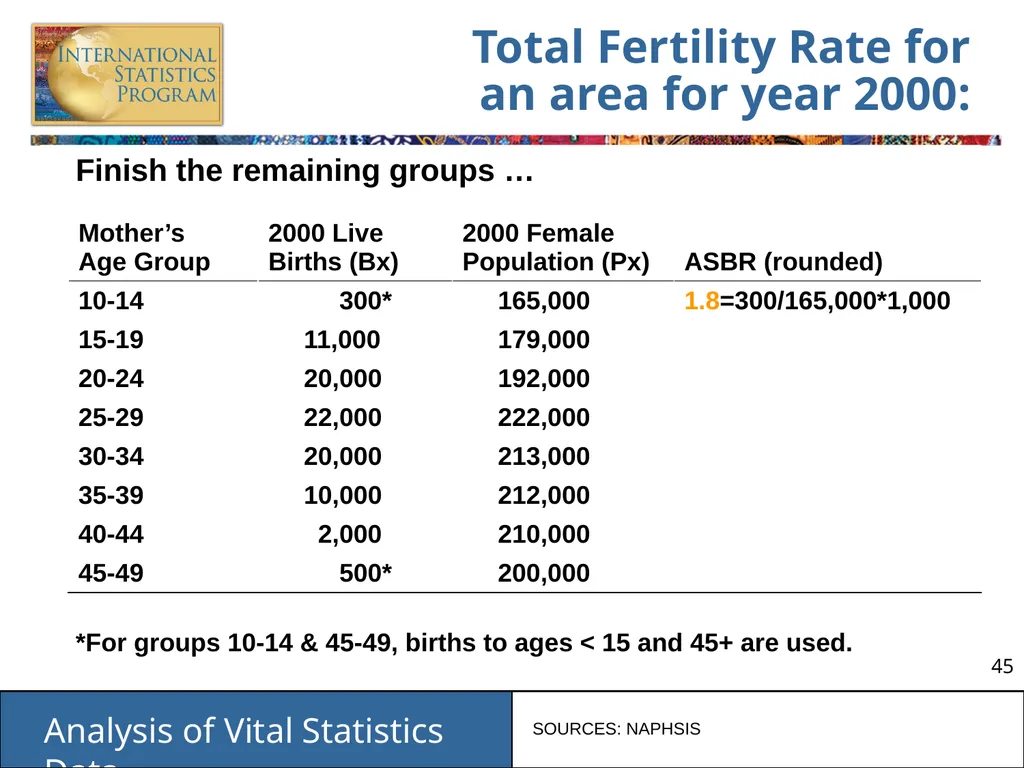
ASBR = 300 X 1,000 = 1.8 live births per 1,000
165,000 SOURCES: NAPHSIS Total Fertility Rate for an area for year 2000:<br>
ASBR = Bx x 1,000
Px
ASBR = 300 X 1,000 = 1.8 live births per 1,000
165,000 SOURCES: NAPHSIS Total Fertility Rate for an area for year 2000:<br>
45
Finish the remaining groups …
*For groups 10-14 & 45-49, births to ages < 15 and 45+ are used. SOURCES: NAPHSIS Total Fertility Rate for an area for year 2000:<br>
*For groups 10-14 & 45-49, births to ages < 15 and 45+ are used. SOURCES: NAPHSIS Total Fertility Rate for an area for year 2000:<br>
46
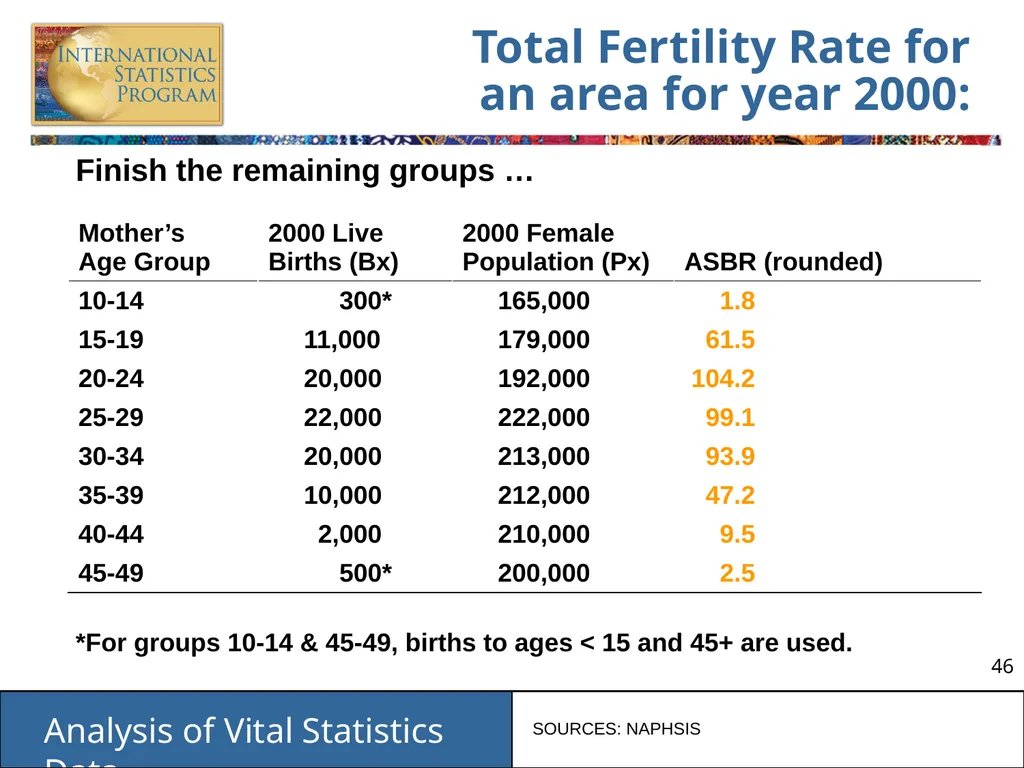
Finish the remaining groups …
*For groups 10-14 & 45-49, births to ages < 15 and 45+ are used. SOURCES: NAPHSIS Total Fertility Rate for an area for year 2000:<br>
*For groups 10-14 & 45-49, births to ages < 15 and 45+ are used. SOURCES: NAPHSIS Total Fertility Rate for an area for year 2000:<br>
47
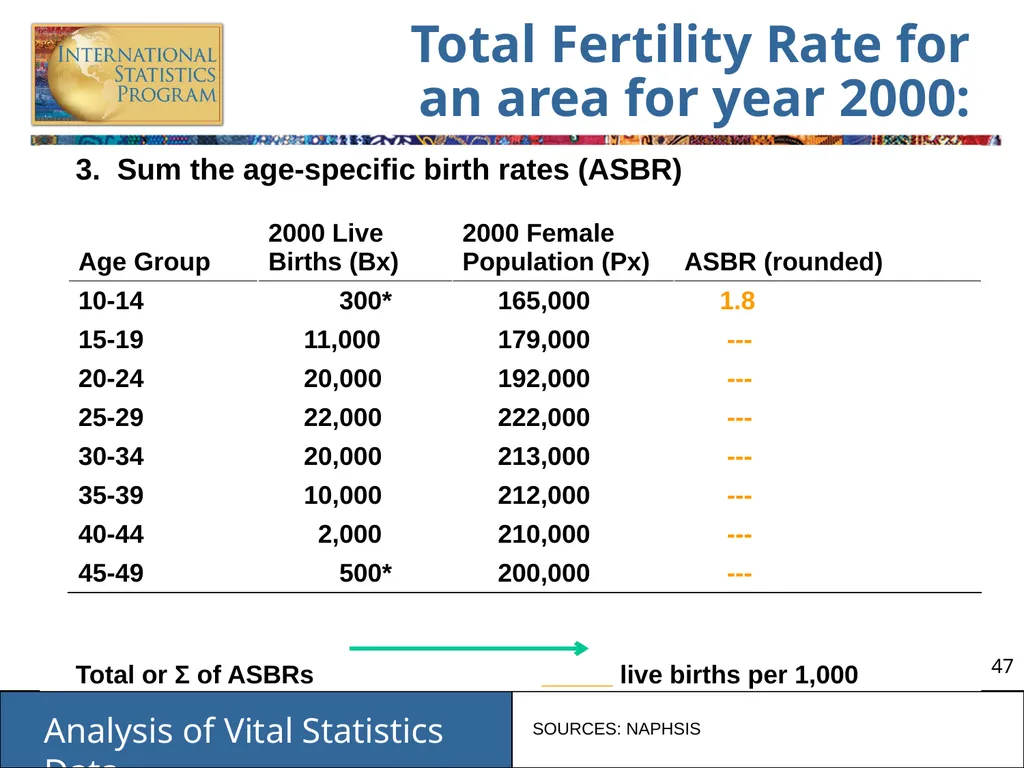
3. Sum the age-specific birth rates (ASBR)
Total or Σ of ASBRs _____ live births per 1,000 SOURCES: NAPHSIS Total Fertility Rate for an area for year 2000:<br>
Total or Σ of ASBRs _____ live births per 1,000 SOURCES: NAPHSIS Total Fertility Rate for an area for year 2000:<br>
48
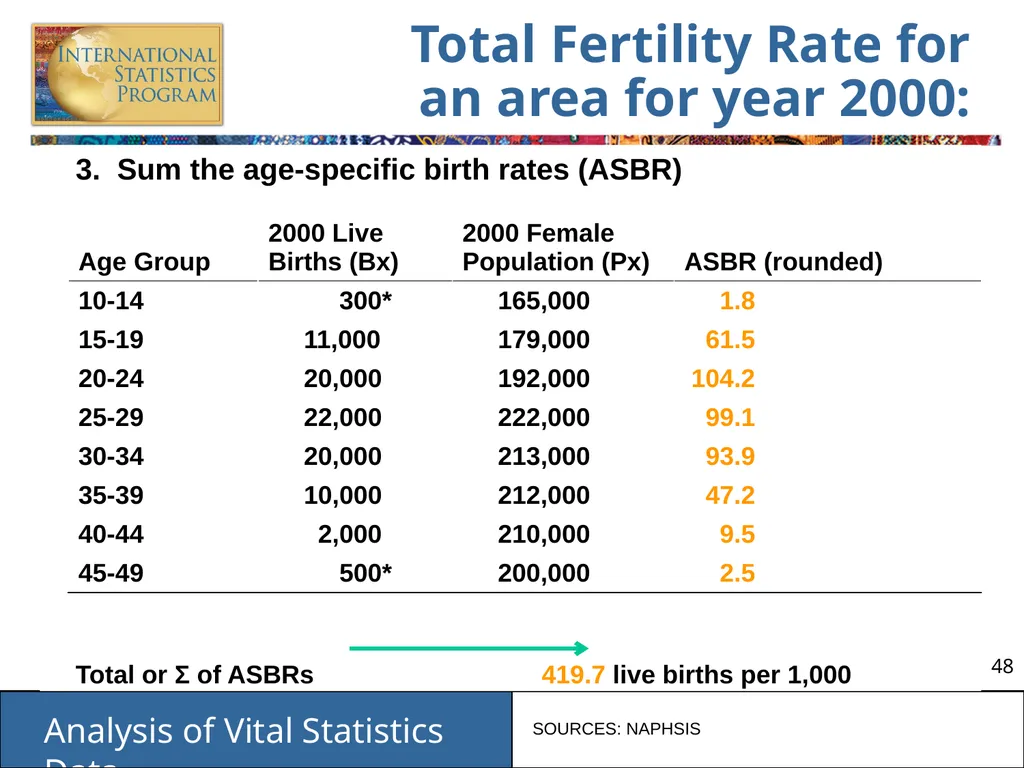
3. Sum the age-specific birth rates (ASBR)
Total or Σ of ASBRs 419.7 live births per 1,000 SOURCES: NAPHSIS Total Fertility Rate for an area for year 2000:<br>
Total or Σ of ASBRs 419.7 live births per 1,000 SOURCES: NAPHSIS Total Fertility Rate for an area for year 2000:<br>
49
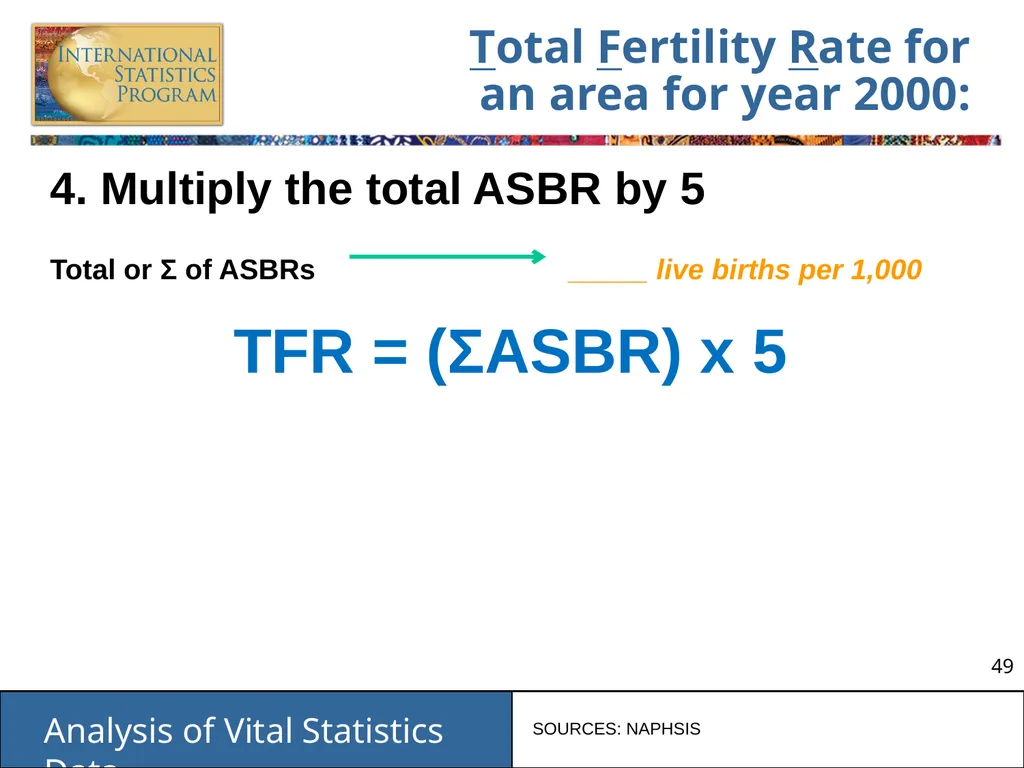
Total Fertility Rate for
an area for year 2000: 4. Multiply the total ASBR by 5
Total or Σ of ASBRs _____ live births per 1,000
TFR = (ΣASBR) x 5 SOURCES: NAPHSIS<br>
Total or Σ of ASBRs _____ live births per 1,000
TFR = (ΣASBR) x 5 SOURCES: NAPHSIS<br>
50
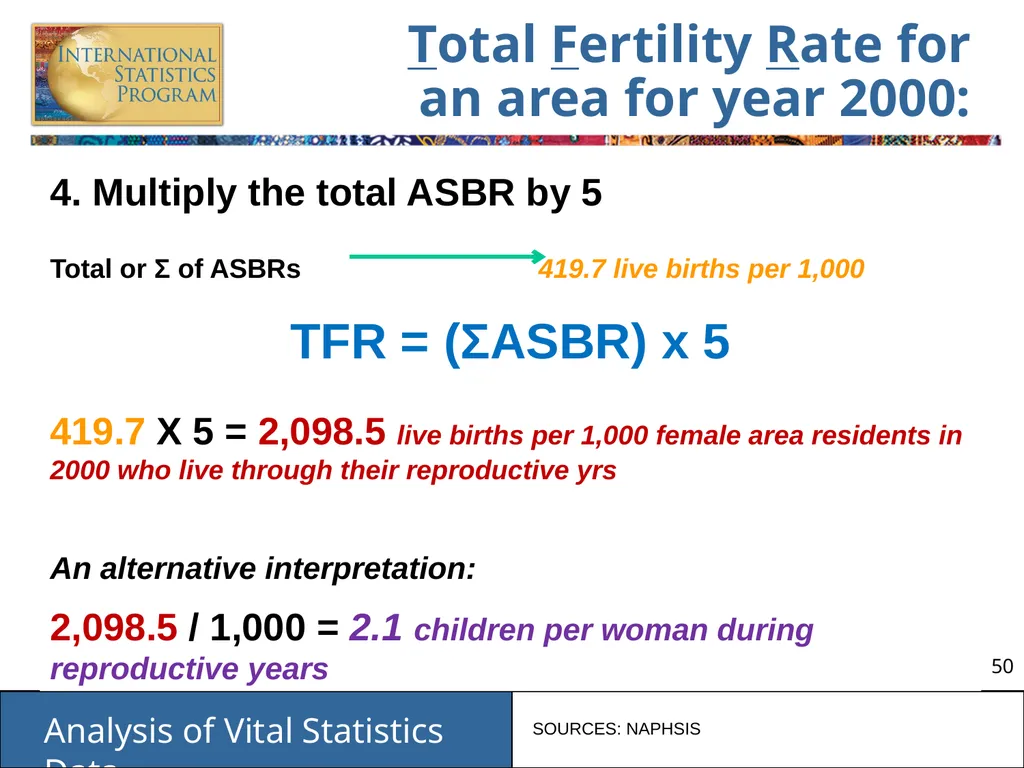
4. Multiply the total ASBR by 5
Total or Σ of ASBRs 419.7 live births per 1,000
TFR = (ΣASBR) x 5
419.7 X 5 = 2,098.5 live births per 1,000 female area residents in 2000 who live through their reproductive yrs
An alternative interpretation:
2,098.5 / 1,000 = 2.1 children per woman during reproductive years SOURCES: NAPHSIS Total Fertility Rate for an area for year 2000:<br>
Total or Σ of ASBRs 419.7 live births per 1,000
TFR = (ΣASBR) x 5
419.7 X 5 = 2,098.5 live births per 1,000 female area residents in 2000 who live through their reproductive yrs
An alternative interpretation:
2,098.5 / 1,000 = 2.1 children per woman during reproductive years SOURCES: NAPHSIS Total Fertility Rate for an area for year 2000:<br>
51
Natality Statistics What types of natality statistics are produced/used in your country?<br>
52
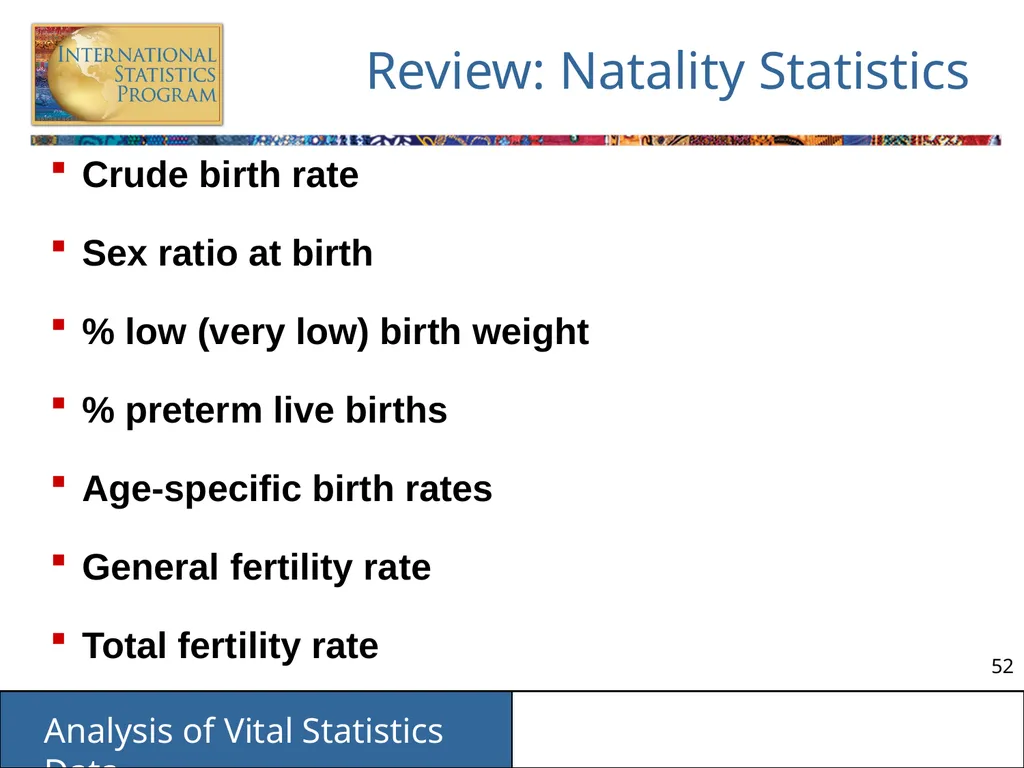
Review: Natality Statistics Crude birth rate
Sex ratio at birth
% low (very low) birth weight
% preterm live births
Age-specific birth rates
General fertility rate
Total fertility rate<br>
Sex ratio at birth
% low (very low) birth weight
% preterm live births
Age-specific birth rates
General fertility rate
Total fertility rate<br>
53
Natality Statistics:
Tabulations & Figures Data based on information recorded on birth certificate/registration
Where necessary, use census/projections for denominators
Uses: identify population group with highest # or % of births<br>
Where necessary, use census/projections for denominators
Uses: identify population group with highest # or % of births<br>
54
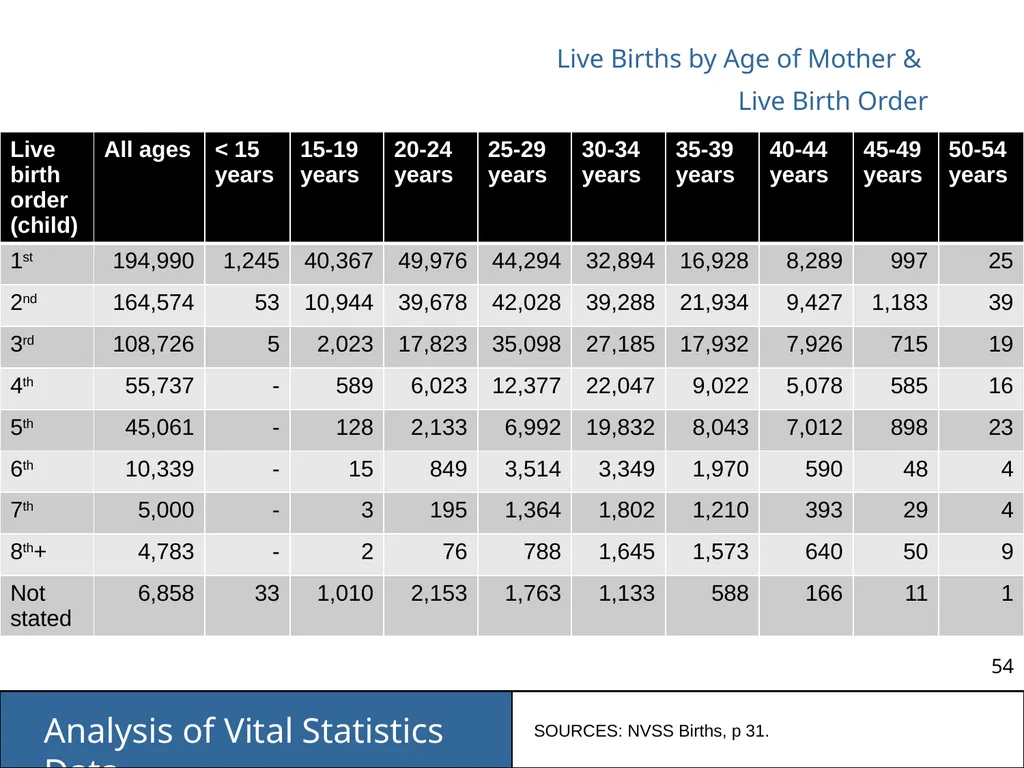
Live Births by Age of Mother &
Live Birth Order SOURCES: NVSS Births, p 31.<br>
55
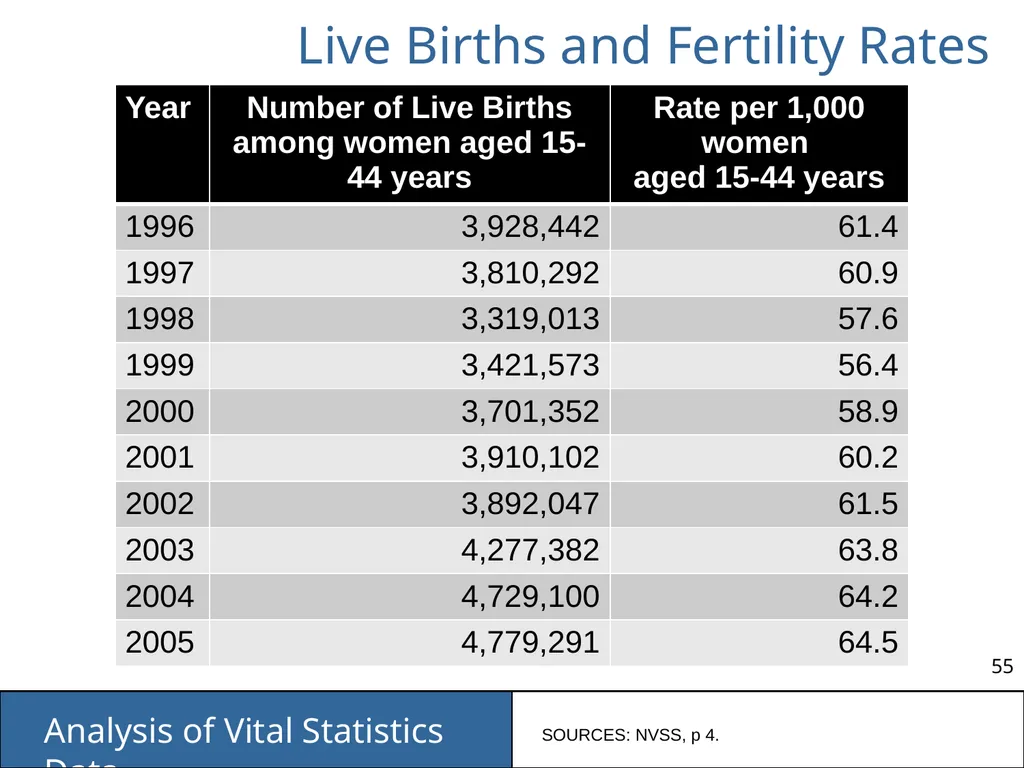
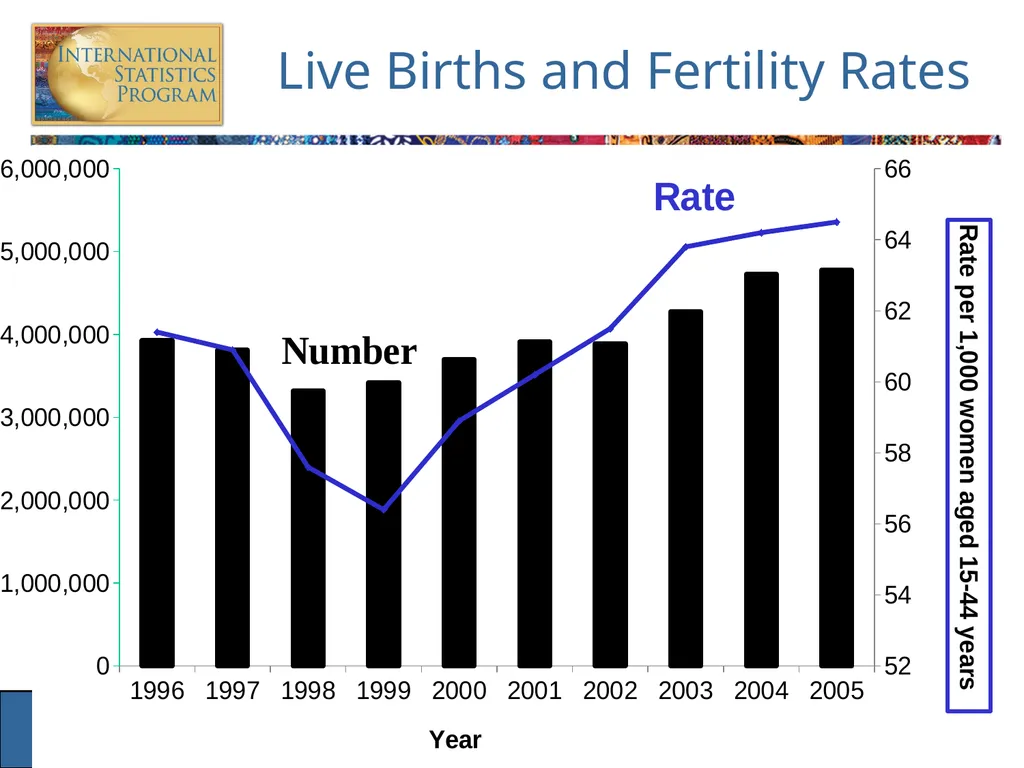
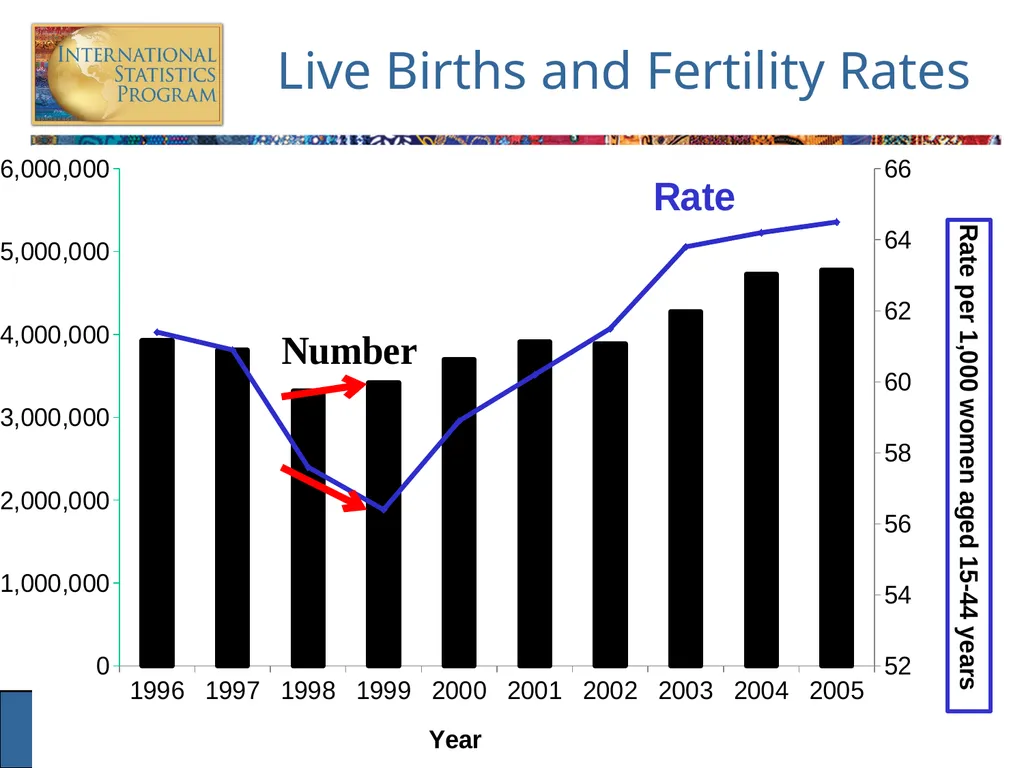
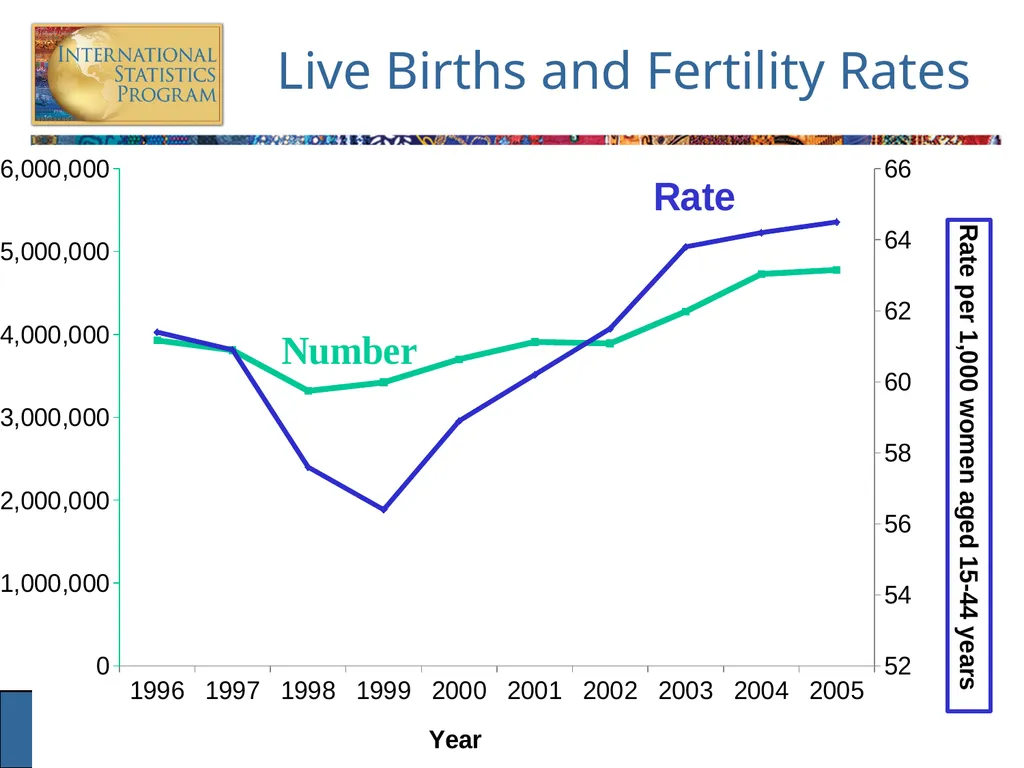
Live Births and Fertility Rates SOURCES: NVSS, p 4.<br>
56
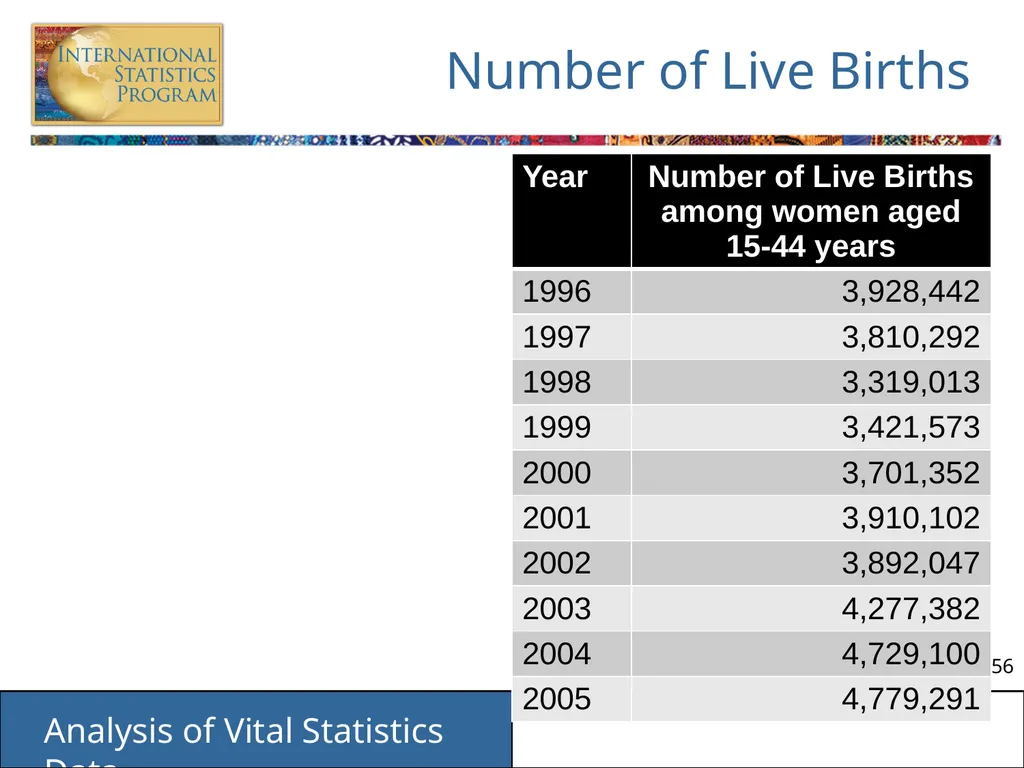
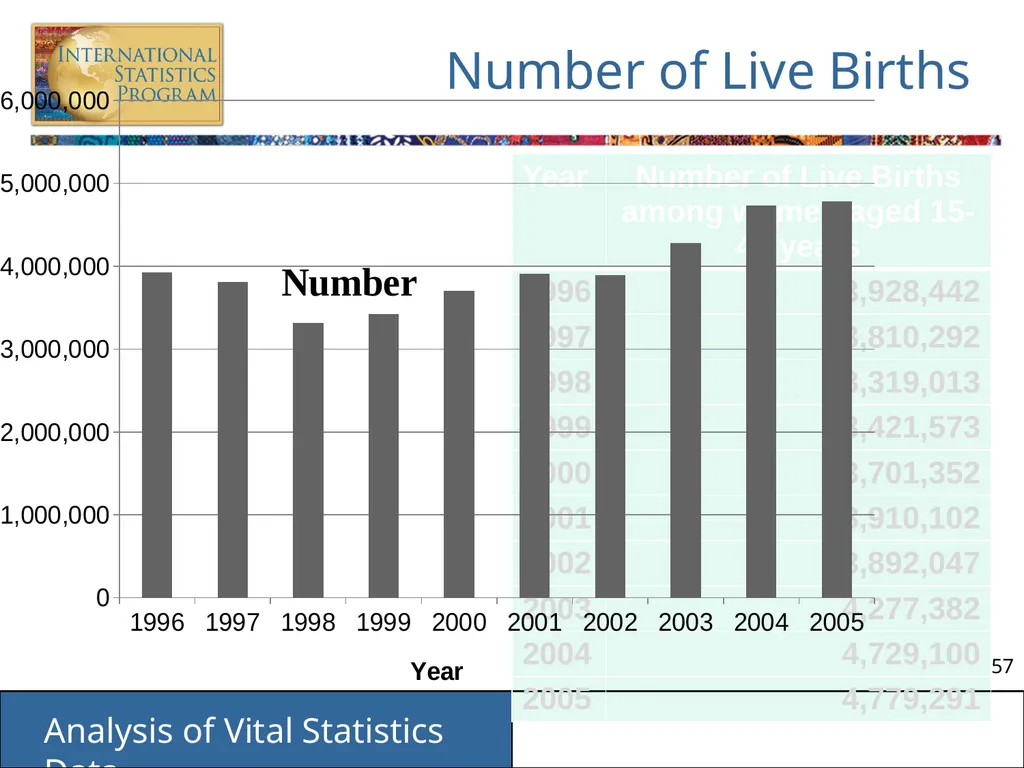
Number of Live Births<br>
57
Number of Live Births<br>
58
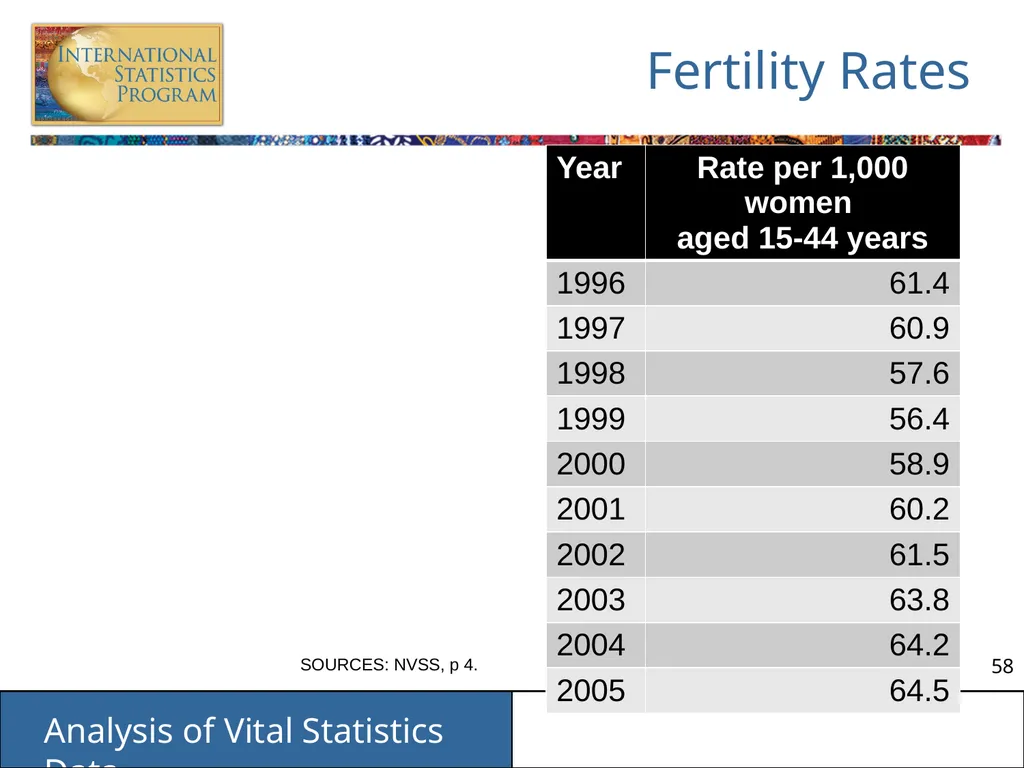
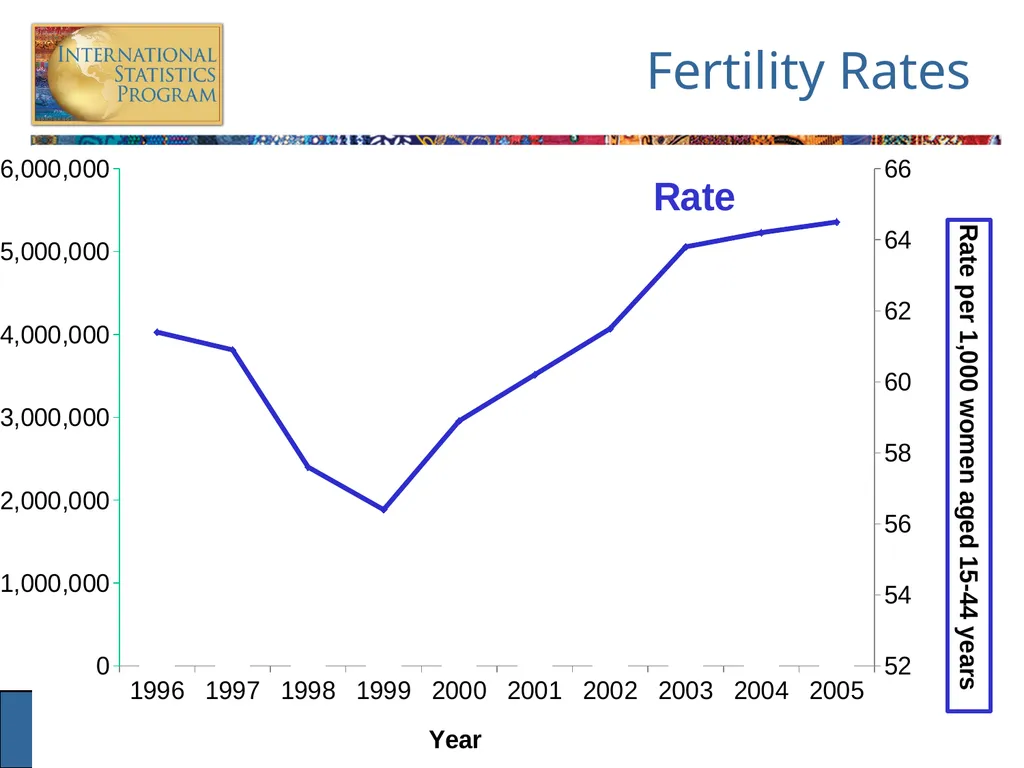
Fertility Rates SOURCES: NVSS, p 4.<br>
59
Fertility Rates<br>
60
Live Births and Fertility Rates<br>
61
Live Births and Fertility Rates<br>
62
Live Births and Fertility Rates<br>
63
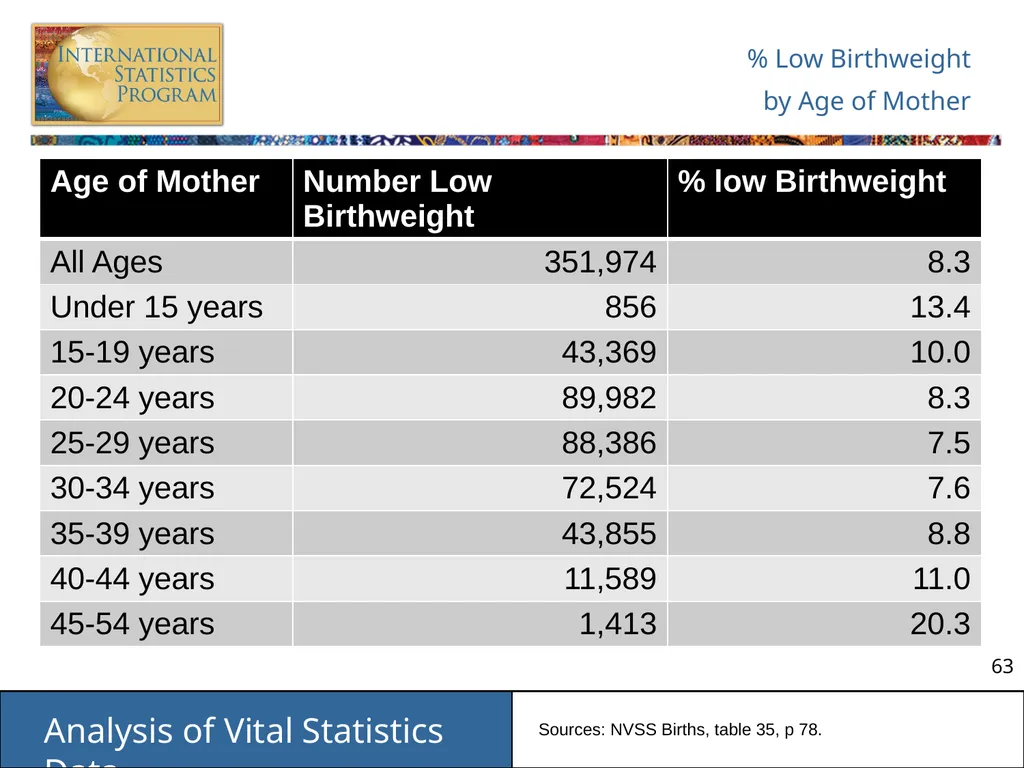
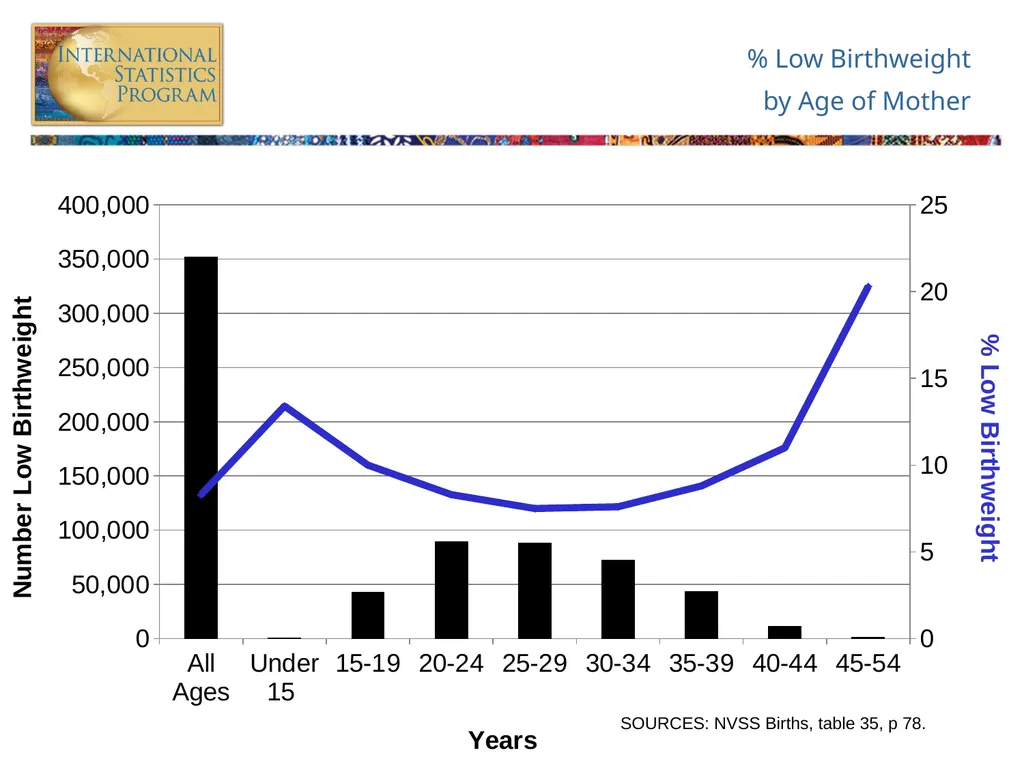
% Low Birthweight
by Age of Mother Sources: NVSS Births, table 35, p 78.<br>
64
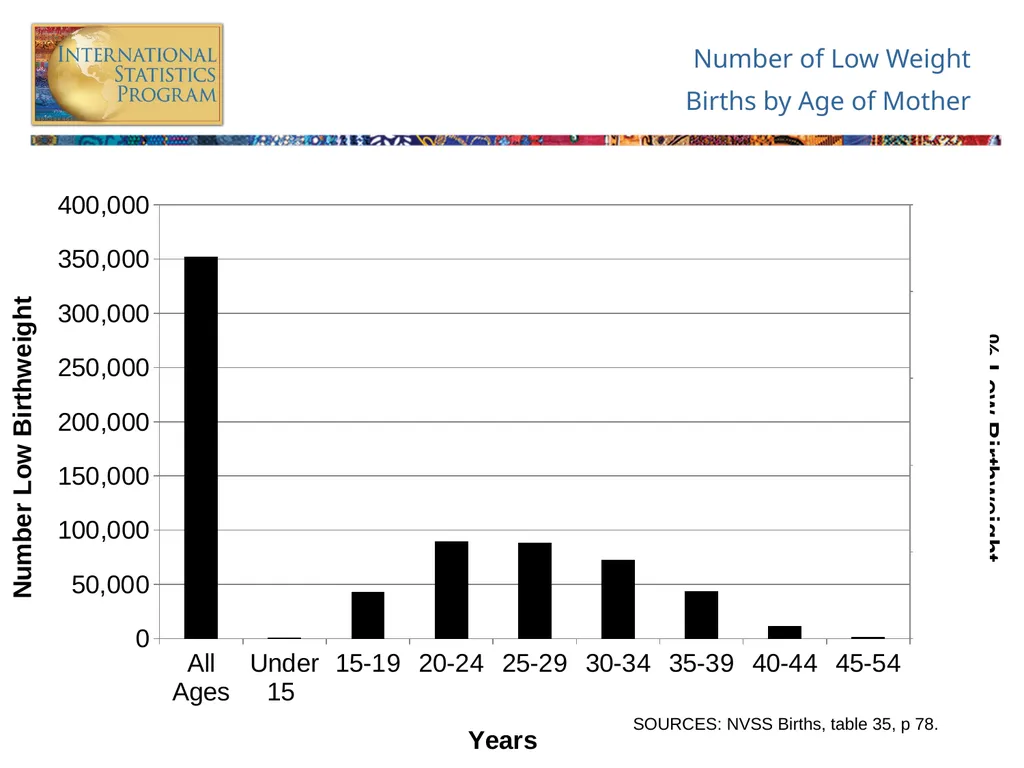
Number of Low Weight
Births by Age of Mother SOURCES: NVSS Births, table 35, p 78.<br>
65
% Low Birthweight
by Age of Mother SOURCES: NVSS Births, table 35, p 78.<br>
66
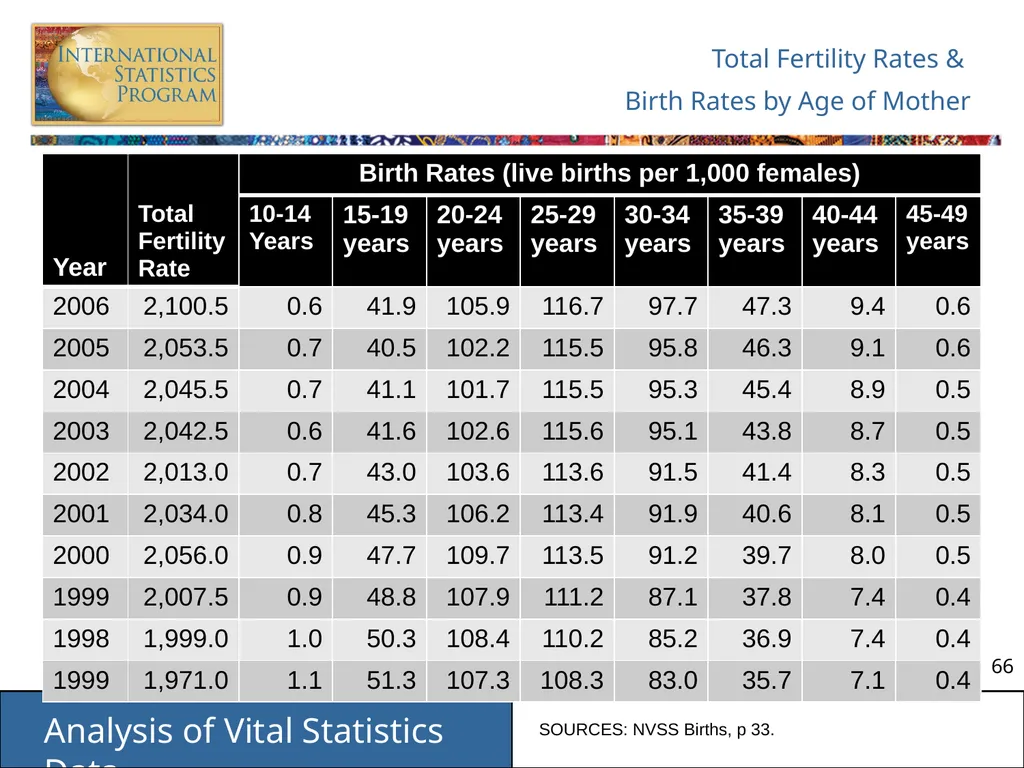
Total Fertility Rates &
Birth Rates by Age of Mother SOURCES: NVSS Births, p 33.<br>
67
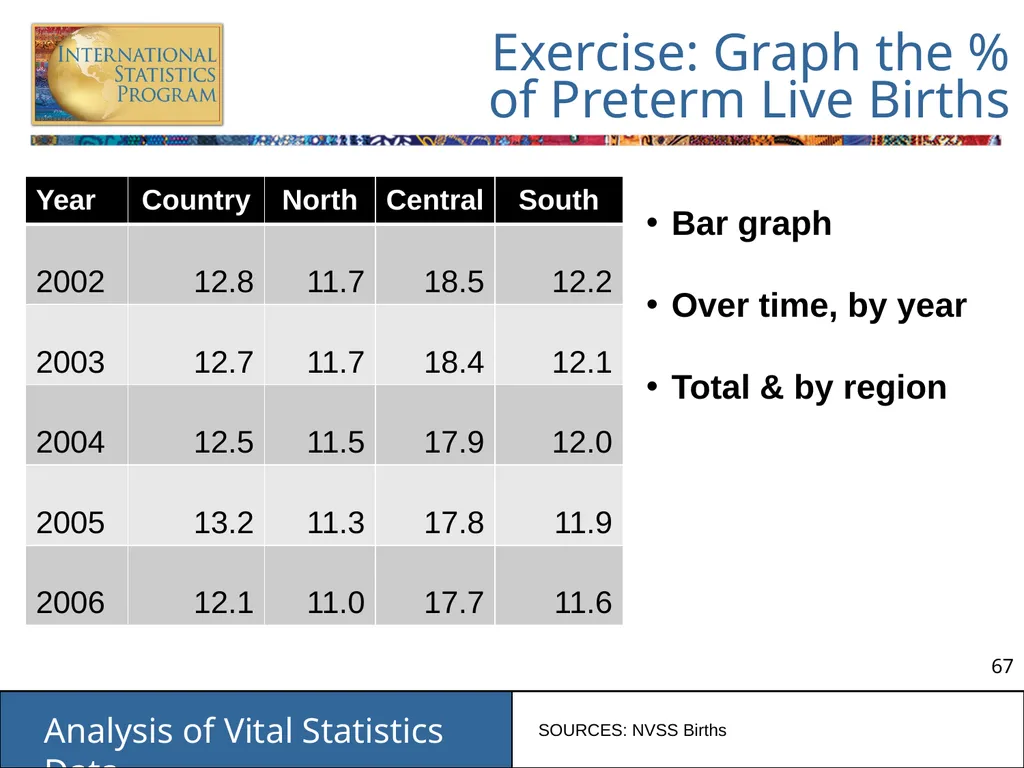
Exercise: Graph the %
of Preterm Live Births Bar graph
Over time, by year
Total & by region SOURCES: NVSS Births<br>
Over time, by year
Total & by region SOURCES: NVSS Births<br>
68
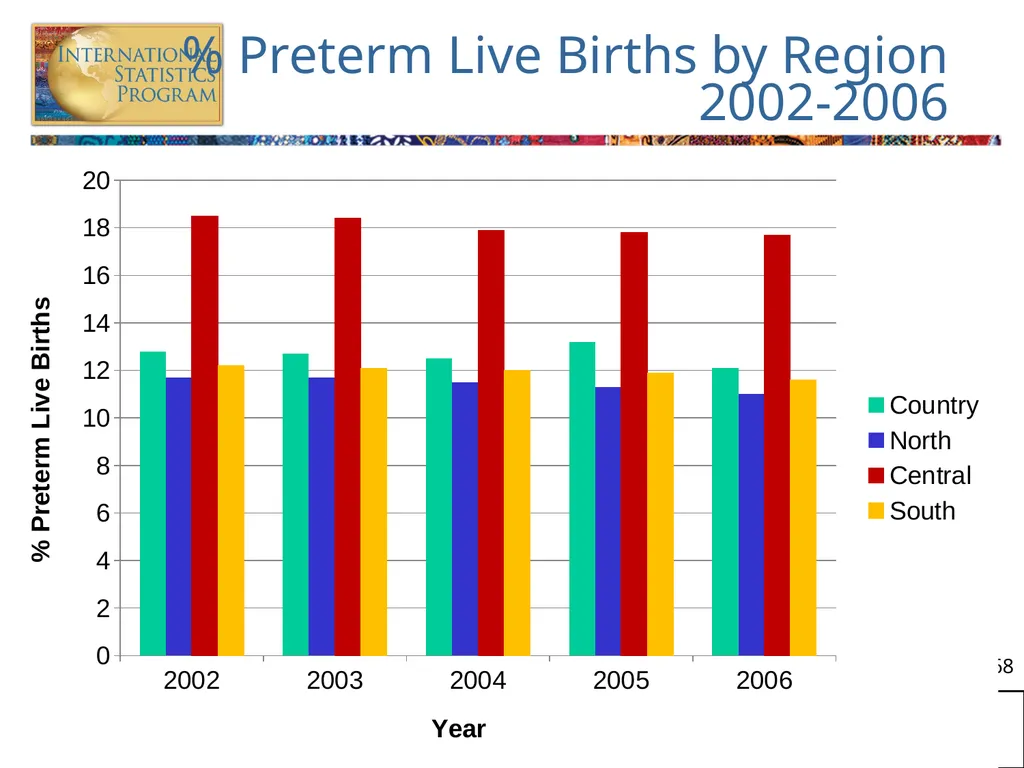
% Preterm Live Births by Region
2002-2006<br>
69
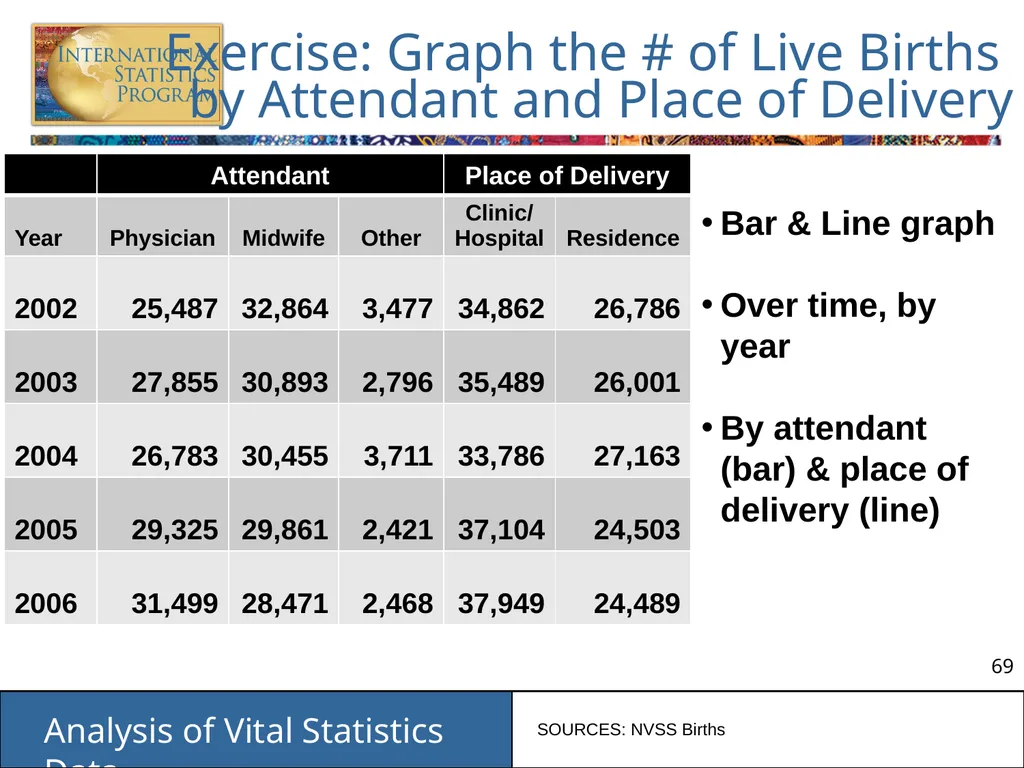
Exercise: Graph the # of Live Births
by Attendant and Place of Delivery Bar & Line graph
Over time, by year
By attendant (bar) & place of delivery (line) SOURCES: NVSS Births<br>
Over time, by year
By attendant (bar) & place of delivery (line) SOURCES: NVSS Births<br>
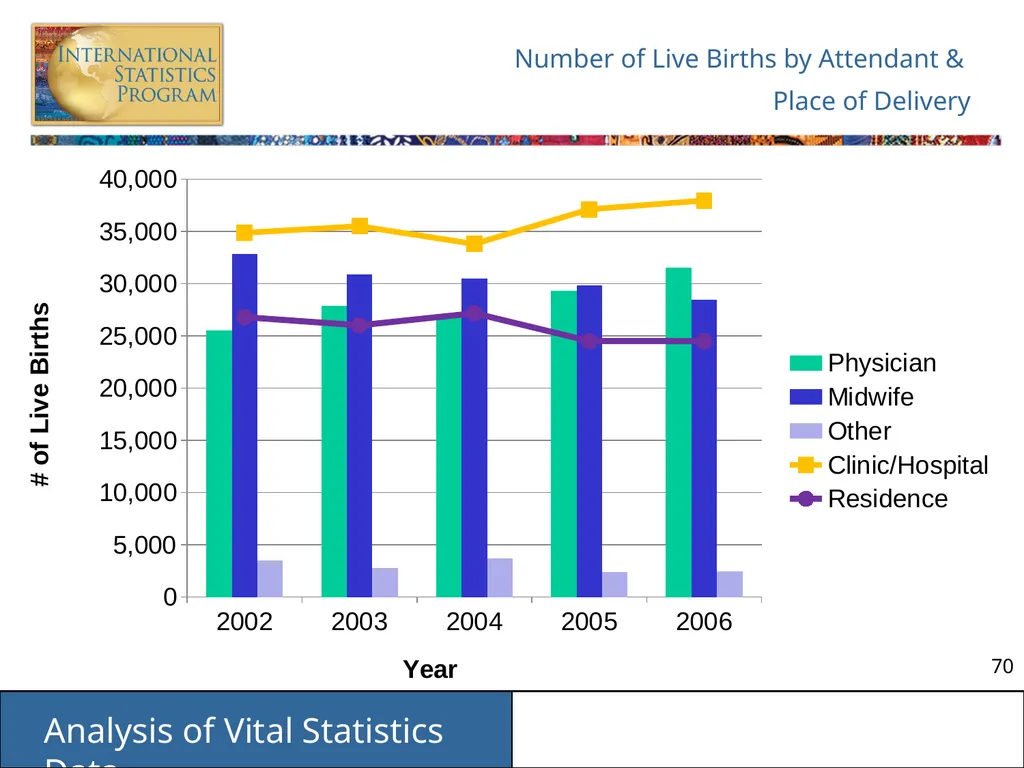
70
Number of Live Births by Attendant &
Place of Delivery<br>
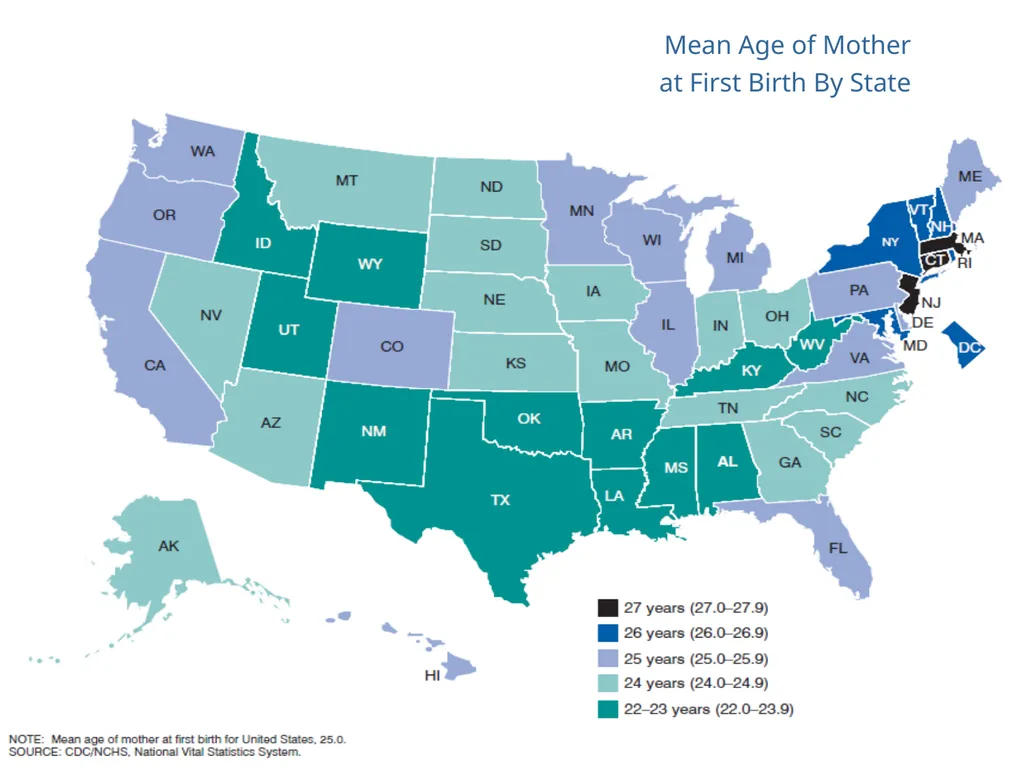
71
Mean Age of Mother
at First Birth By State<br>
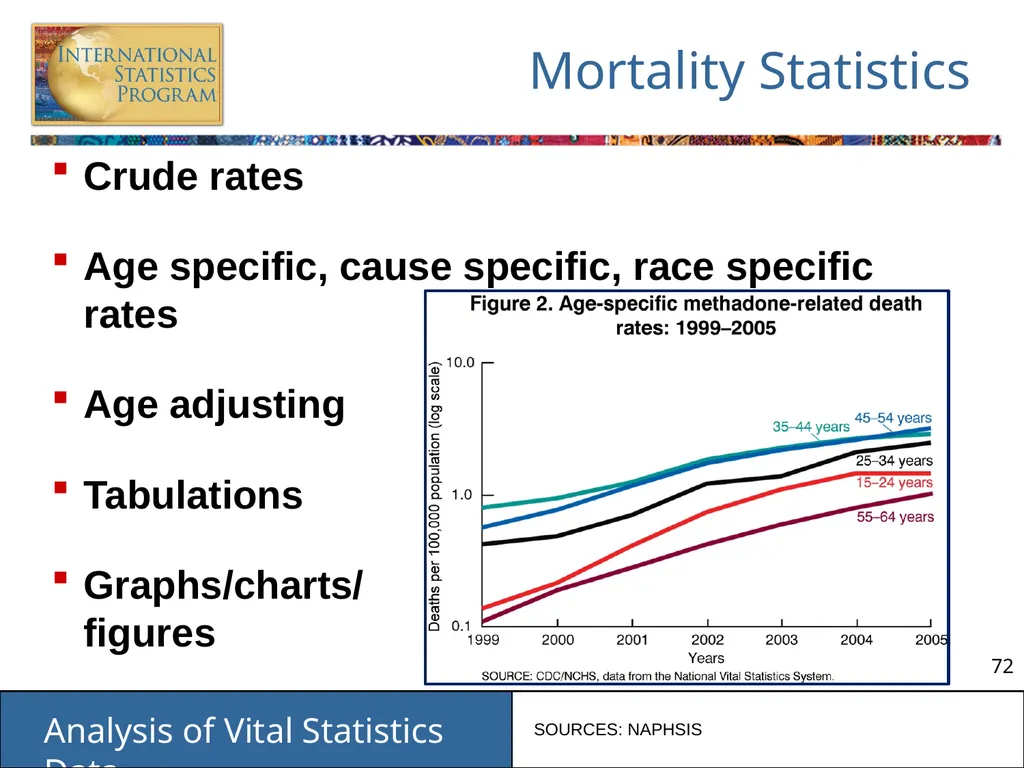
72
Mortality Statistics Crude rates
Age specific, cause specific, race specific rates
Age adjusting
Tabulations
Graphs/charts/ figures SOURCES: NAPHSIS<br>
Age specific, cause specific, race specific rates
Age adjusting
Tabulations
Graphs/charts/ figures SOURCES: NAPHSIS<br>
73
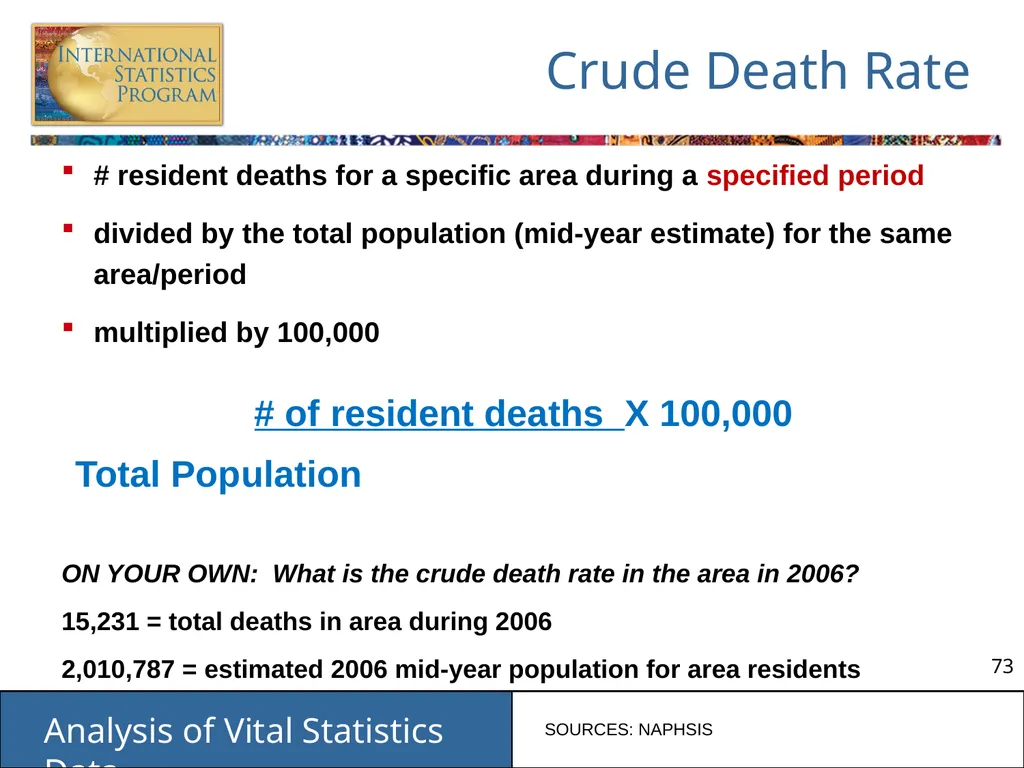
Crude Death Rate # resident deaths for a specific area during a specified period
divided by the total population (mid-year estimate) for the same area/period
multiplied by 100,000
# of resident deaths X 100,000
Total Population
ON YOUR OWN: What is the crude death rate in the area in 2006?
15,231 = total deaths in area during 2006
2,010,787 = estimated 2006 mid-year population for area residents SOURCES: NAPHSIS<br>
divided by the total population (mid-year estimate) for the same area/period
multiplied by 100,000
# of resident deaths X 100,000
Total Population
ON YOUR OWN: What is the crude death rate in the area in 2006?
15,231 = total deaths in area during 2006
2,010,787 = estimated 2006 mid-year population for area residents SOURCES: NAPHSIS<br>
74
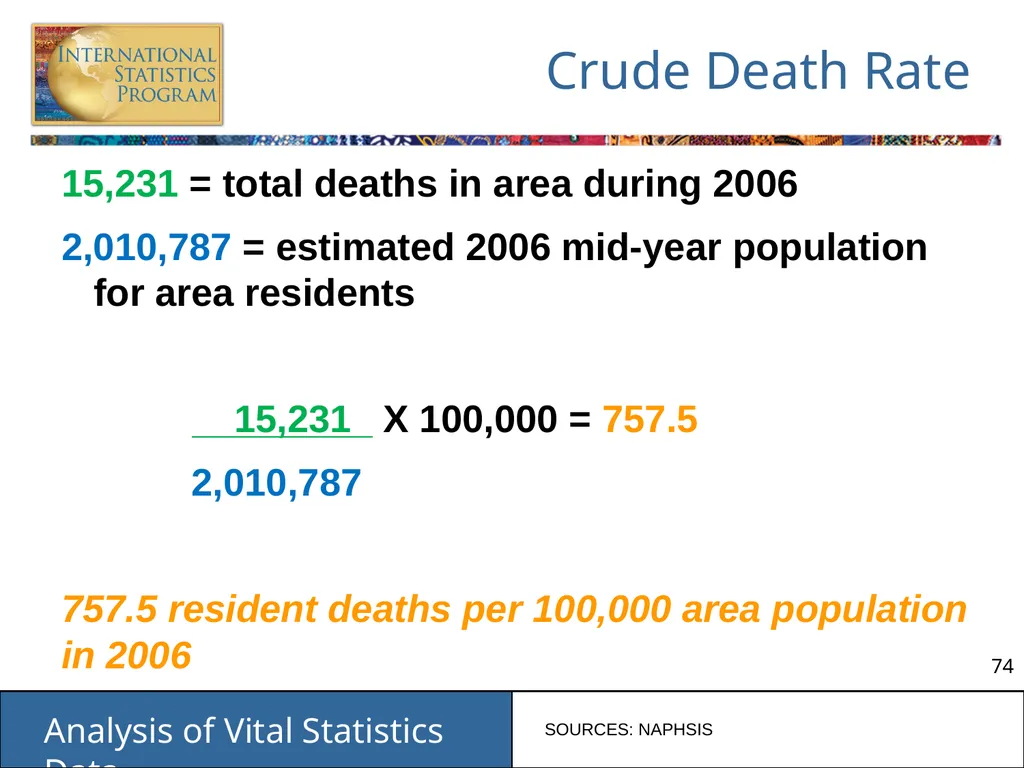
Crude Death Rate 15,231 = total deaths in area during 2006
2,010,787 = estimated 2006 mid-year population for area residents
15,231 X 100,000 = 757.5
2,010,787
757.5 resident deaths per 100,000 area population in 2006 SOURCES: NAPHSIS<br>
2,010,787 = estimated 2006 mid-year population for area residents
15,231 X 100,000 = 757.5
2,010,787
757.5 resident deaths per 100,000 area population in 2006 SOURCES: NAPHSIS<br>
75
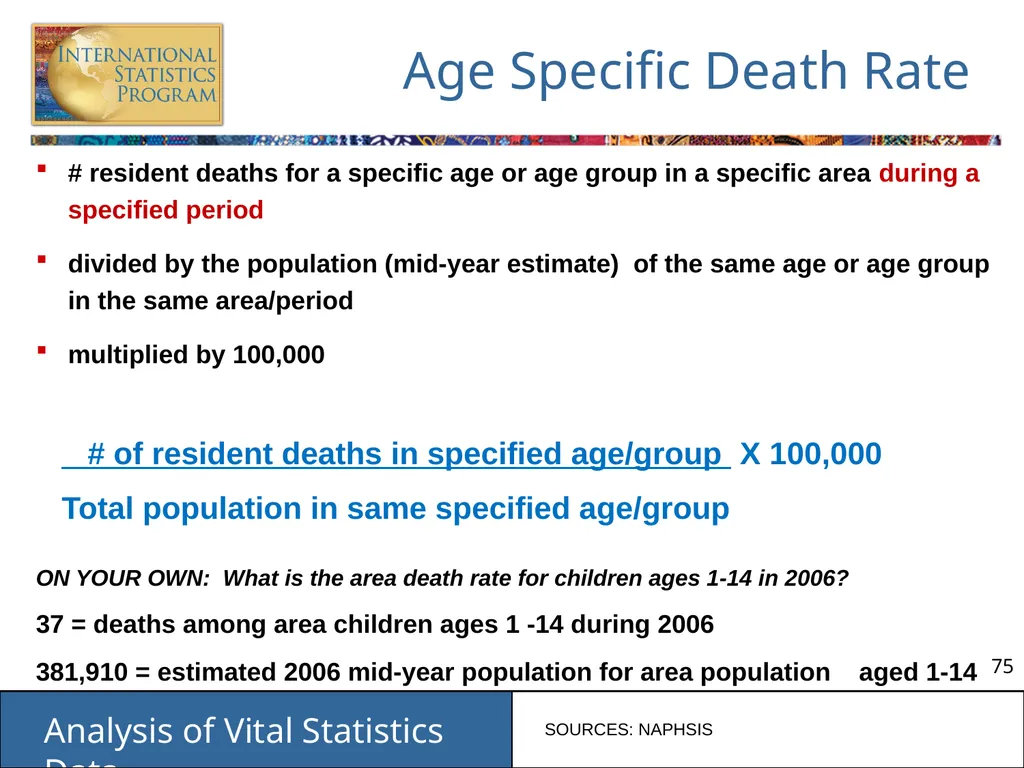
Age Specific Death Rate # resident deaths for a specific age or age group in a specific area during a specified period
divided by the population (mid-year estimate) of the same age or age group in the same area/period
multiplied by 100,000
# of resident deaths in specified age/group X 100,000
Total population in same specified age/group
ON YOUR OWN: What is the area death rate for children ages 1-14 in 2006?
37 = deaths among area children ages 1 -14 during 2006
381,910 = estimated 2006 mid-year population for area population aged 1-14 SOURCES: NAPHSIS<br>
divided by the population (mid-year estimate) of the same age or age group in the same area/period
multiplied by 100,000
# of resident deaths in specified age/group X 100,000
Total population in same specified age/group
ON YOUR OWN: What is the area death rate for children ages 1-14 in 2006?
37 = deaths among area children ages 1 -14 during 2006
381,910 = estimated 2006 mid-year population for area population aged 1-14 SOURCES: NAPHSIS<br>
76
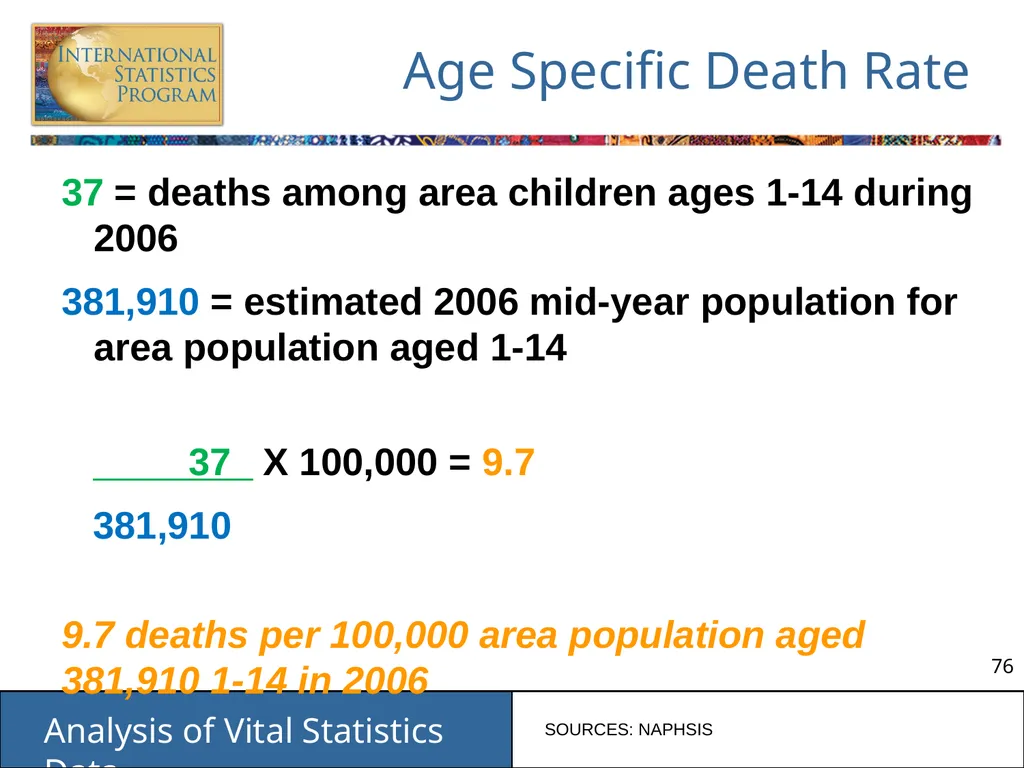
Age Specific Death Rate 37 = deaths among area children ages 1-14 during 2006
381,910 = estimated 2006 mid-year population for area population aged 1-14
37 X 100,000 = 9.7
381,910
9.7 deaths per 100,000 area population aged 381,910 1-14 in 2006 SOURCES: NAPHSIS<br>
381,910 = estimated 2006 mid-year population for area population aged 1-14
37 X 100,000 = 9.7
381,910
9.7 deaths per 100,000 area population aged 381,910 1-14 in 2006 SOURCES: NAPHSIS<br>
77
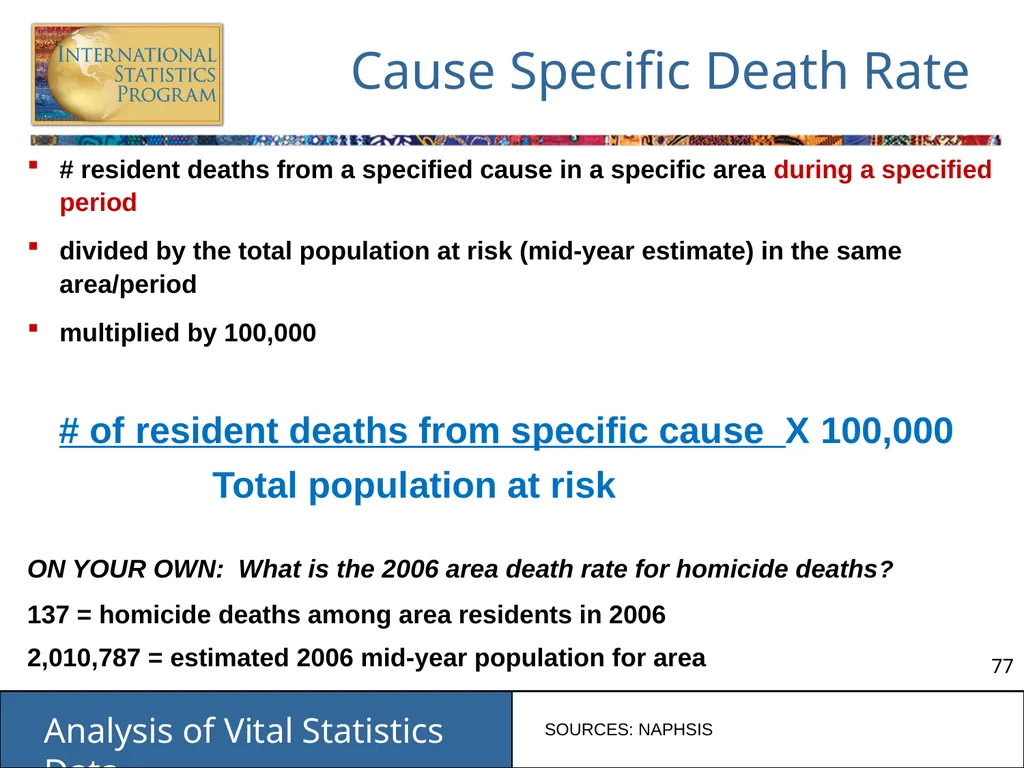
Cause Specific Death Rate # resident deaths from a specified cause in a specific area during a specified period
divided by the total population at risk (mid-year estimate) in the same area/period
multiplied by 100,000
# of resident deaths from specific cause X 100,000
Total population at risk
ON YOUR OWN: What is the 2006 area death rate for homicide deaths?
137 = homicide deaths among area residents in 2006
2,010,787 = estimated 2006 mid-year population for area SOURCES: NAPHSIS<br>
divided by the total population at risk (mid-year estimate) in the same area/period
multiplied by 100,000
# of resident deaths from specific cause X 100,000
Total population at risk
ON YOUR OWN: What is the 2006 area death rate for homicide deaths?
137 = homicide deaths among area residents in 2006
2,010,787 = estimated 2006 mid-year population for area SOURCES: NAPHSIS<br>
78
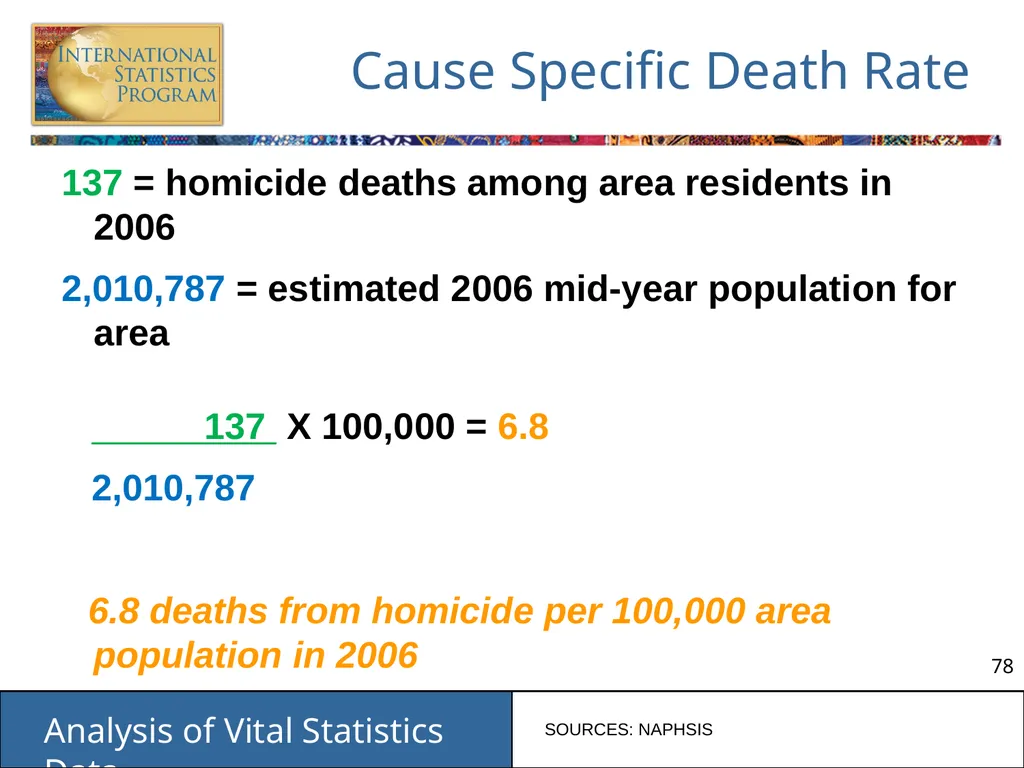
Cause Specific Death Rate 137 = homicide deaths among area residents in 2006
2,010,787 = estimated 2006 mid-year population for area
137 X 100,000 = 6.8
2,010,787
6.8 deaths from homicide per 100,000 area population in 2006 SOURCES: NAPHSIS<br>
2,010,787 = estimated 2006 mid-year population for area
137 X 100,000 = 6.8
2,010,787
6.8 deaths from homicide per 100,000 area population in 2006 SOURCES: NAPHSIS<br>
79
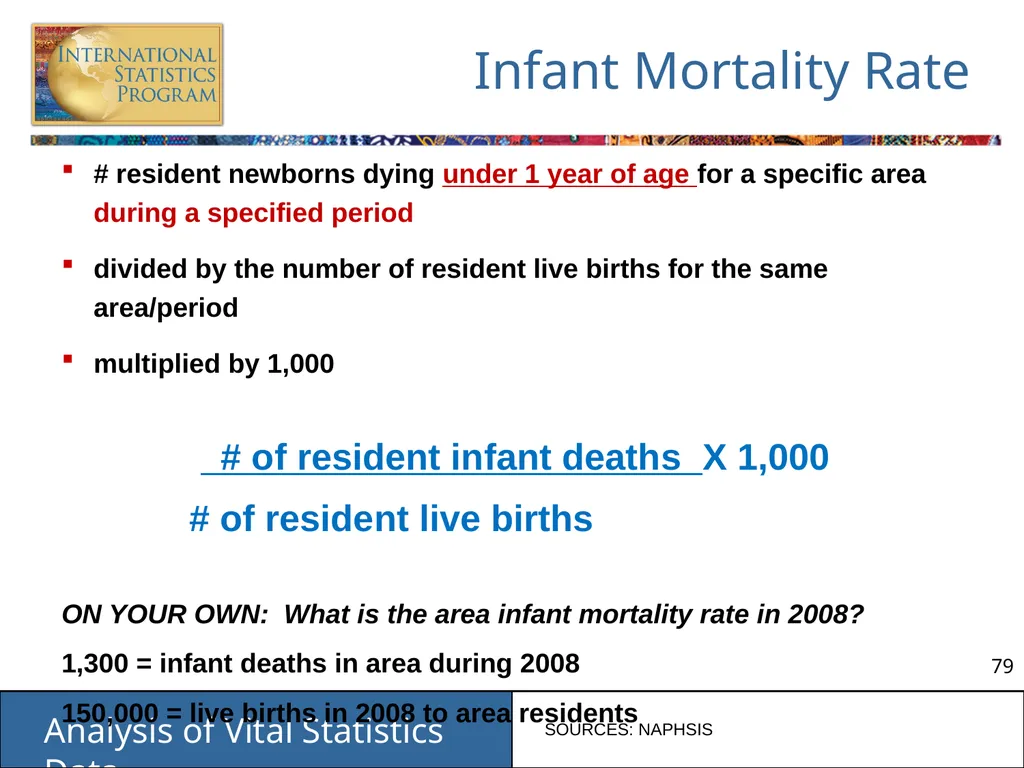
Infant Mortality Rate # resident newborns dying under 1 year of age for a specific area during a specified period
divided by the number of resident live births for the same area/period
multiplied by 1,000
# of resident infant deaths X 1,000
# of resident live births
ON YOUR OWN: What is the area infant mortality rate in 2008?
1,300 = infant deaths in area during 2008
150,000 = live births in 2008 to area residents SOURCES: NAPHSIS<br>
divided by the number of resident live births for the same area/period
multiplied by 1,000
# of resident infant deaths X 1,000
# of resident live births
ON YOUR OWN: What is the area infant mortality rate in 2008?
1,300 = infant deaths in area during 2008
150,000 = live births in 2008 to area residents SOURCES: NAPHSIS<br>
80
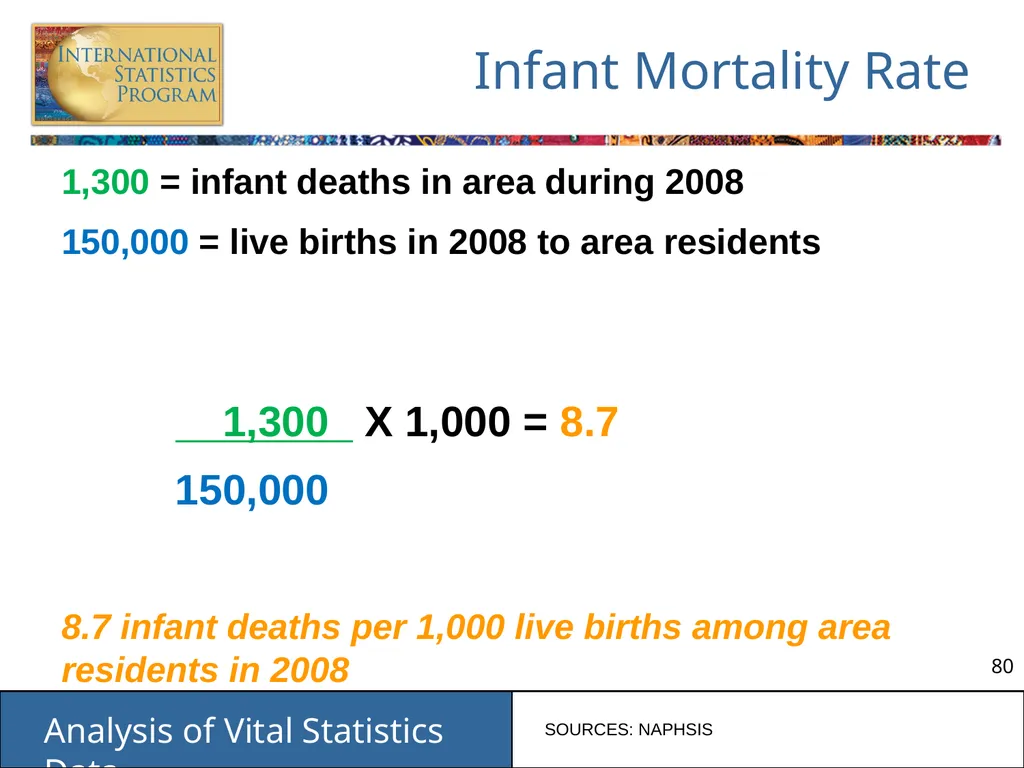
Infant Mortality Rate 1,300 = infant deaths in area during 2008
150,000 = live births in 2008 to area residents
1,300 X 1,000 = 8.7
150,000
8.7 infant deaths per 1,000 live births among area residents in 2008 SOURCES: NAPHSIS<br>
150,000 = live births in 2008 to area residents
1,300 X 1,000 = 8.7
150,000
8.7 infant deaths per 1,000 live births among area residents in 2008 SOURCES: NAPHSIS<br>
81
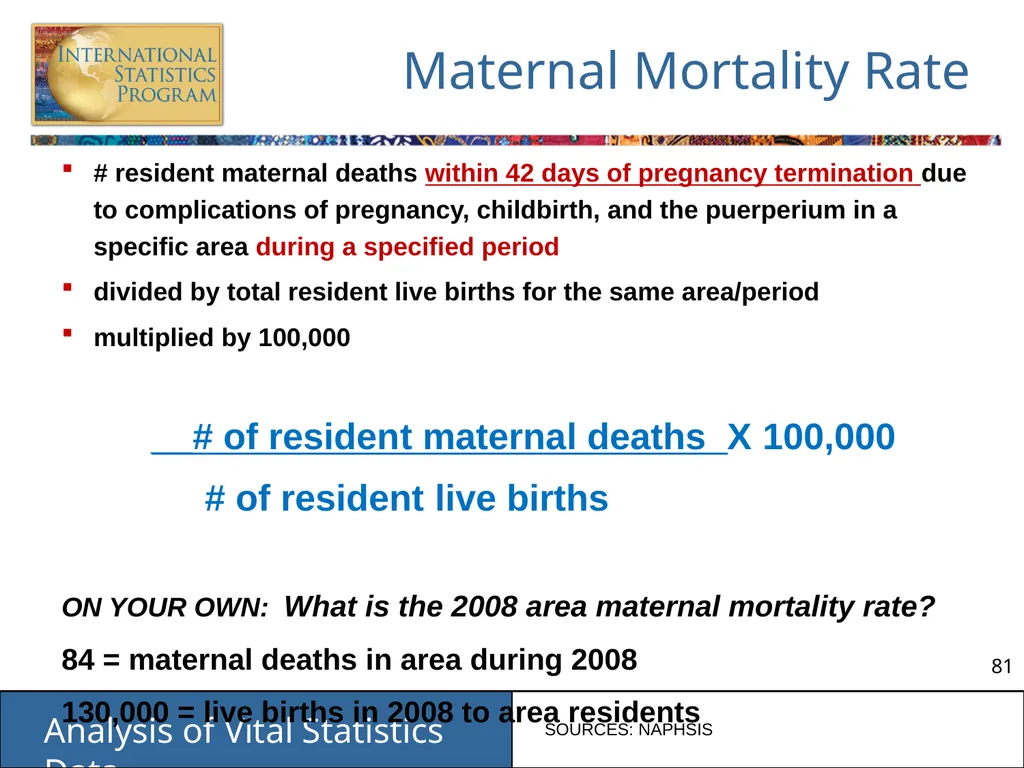
Maternal Mortality Rate # resident maternal deaths within 42 days of pregnancy termination due to complications of pregnancy, childbirth, and the puerperium in a specific area during a specified period
divided by total resident live births for the same area/period
multiplied by 100,000
__# of resident maternal deaths X 100,000
# of resident live births
ON YOUR OWN: What is the 2008 area maternal mortality rate?
84 = maternal deaths in area during 2008
130,000 = live births in 2008 to area residents SOURCES: NAPHSIS<br>
divided by total resident live births for the same area/period
multiplied by 100,000
__# of resident maternal deaths X 100,000
# of resident live births
ON YOUR OWN: What is the 2008 area maternal mortality rate?
84 = maternal deaths in area during 2008
130,000 = live births in 2008 to area residents SOURCES: NAPHSIS<br>
82
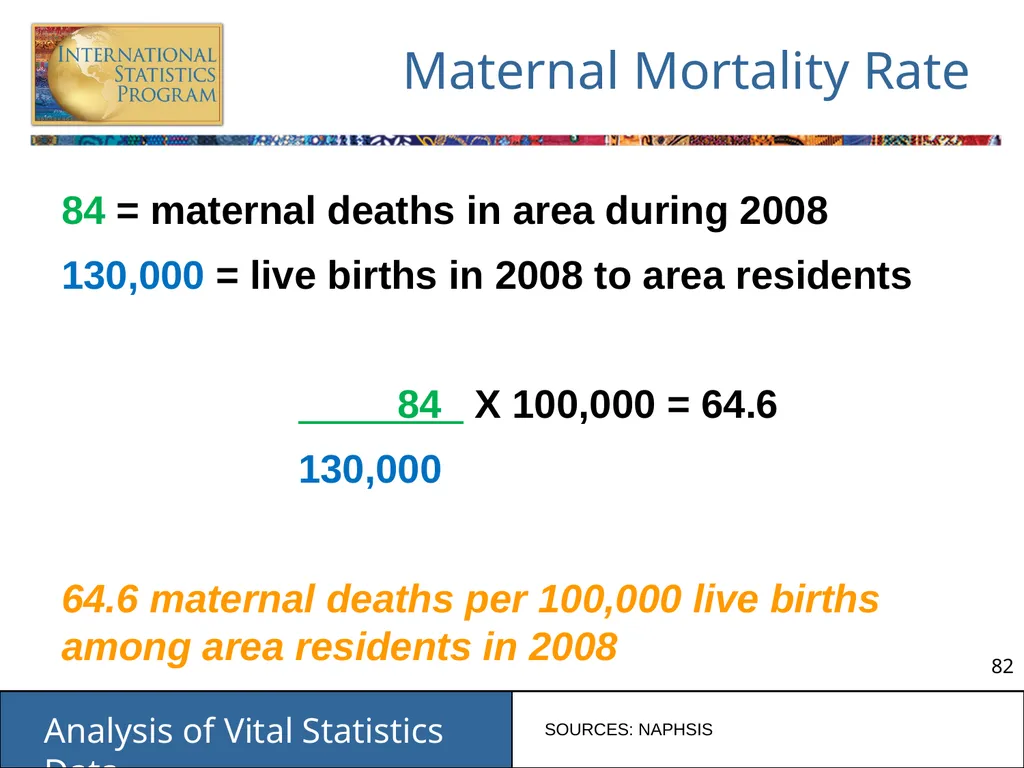
Maternal Mortality Rate 84 = maternal deaths in area during 2008
130,000 = live births in 2008 to area residents
84 X 100,000 = 64.6
130,000
64.6 maternal deaths per 100,000 live births among area residents in 2008 SOURCES: NAPHSIS<br>
130,000 = live births in 2008 to area residents
84 X 100,000 = 64.6
130,000
64.6 maternal deaths per 100,000 live births among area residents in 2008 SOURCES: NAPHSIS<br>
83
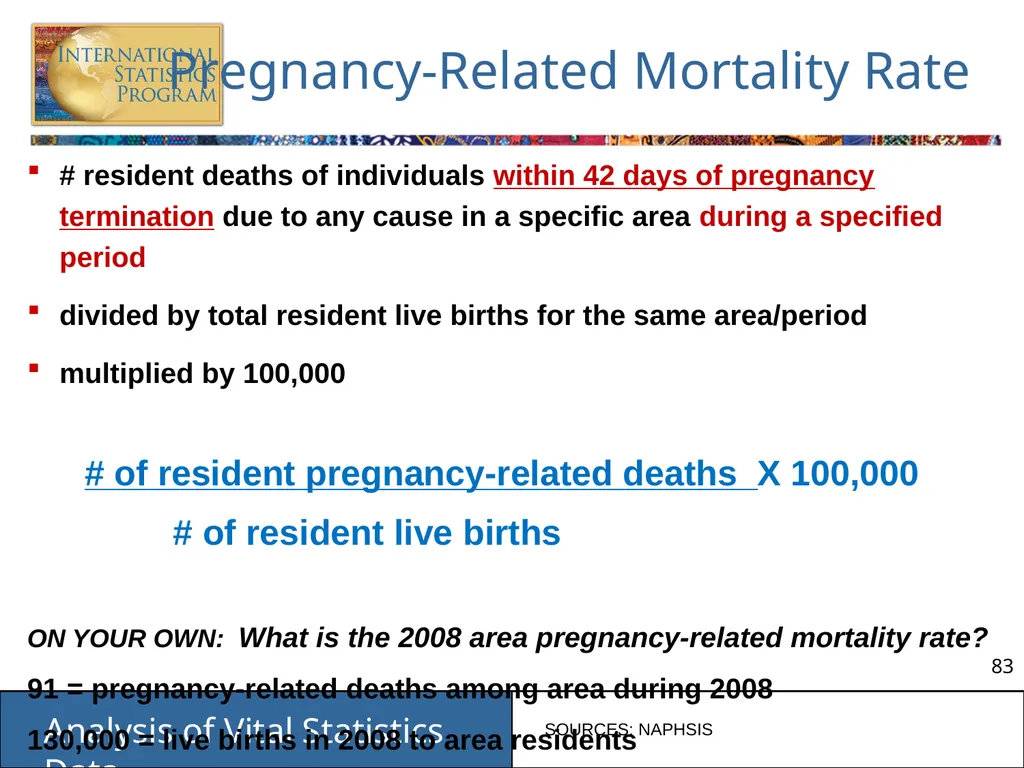
Pregnancy-Related Mortality Rate # resident deaths of individuals within 42 days of pregnancy termination due to any cause in a specific area during a specified period
divided by total resident live births for the same area/period
multiplied by 100,000
# of resident pregnancy-related deaths X 100,000
# of resident live births
ON YOUR OWN: What is the 2008 area pregnancy-related mortality rate?
91 = pregnancy-related deaths among area during 2008
130,000 = live births in 2008 to area residents SOURCES: NAPHSIS<br>
divided by total resident live births for the same area/period
multiplied by 100,000
# of resident pregnancy-related deaths X 100,000
# of resident live births
ON YOUR OWN: What is the 2008 area pregnancy-related mortality rate?
91 = pregnancy-related deaths among area during 2008
130,000 = live births in 2008 to area residents SOURCES: NAPHSIS<br>
84
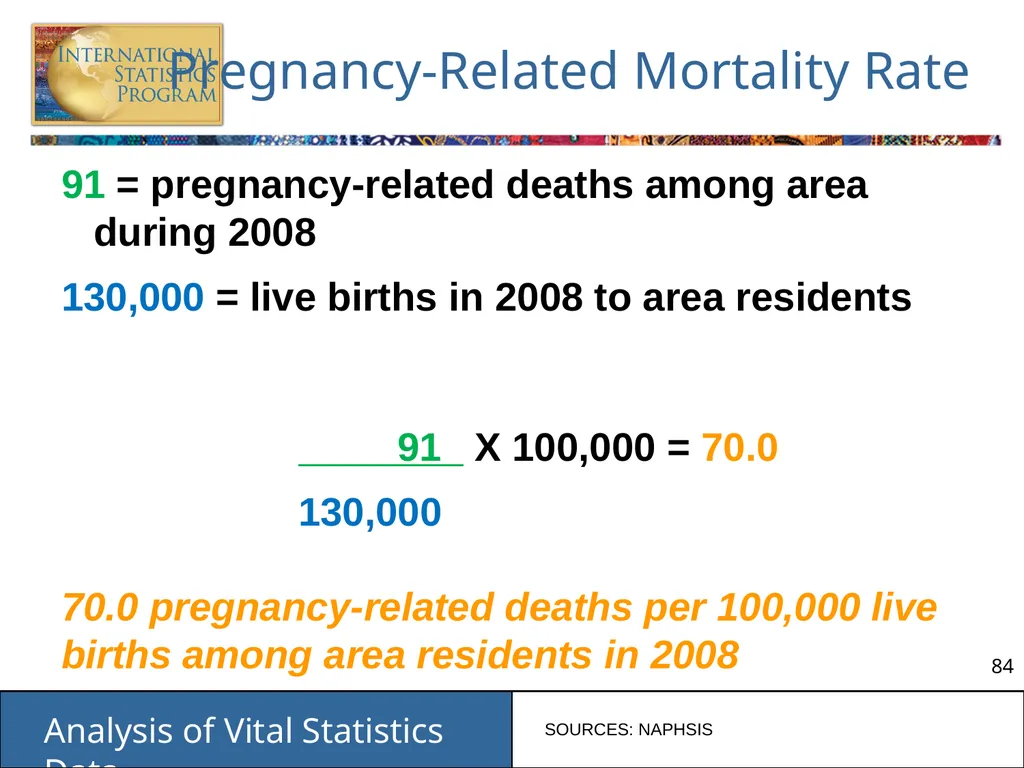
Pregnancy-Related Mortality Rate 91 = pregnancy-related deaths among area during 2008
130,000 = live births in 2008 to area residents
91 X 100,000 = 70.0
130,000
70.0 pregnancy-related deaths per 100,000 live births among area residents in 2008 SOURCES: NAPHSIS<br>
130,000 = live births in 2008 to area residents
91 X 100,000 = 70.0
130,000
70.0 pregnancy-related deaths per 100,000 live births among area residents in 2008 SOURCES: NAPHSIS<br>
85
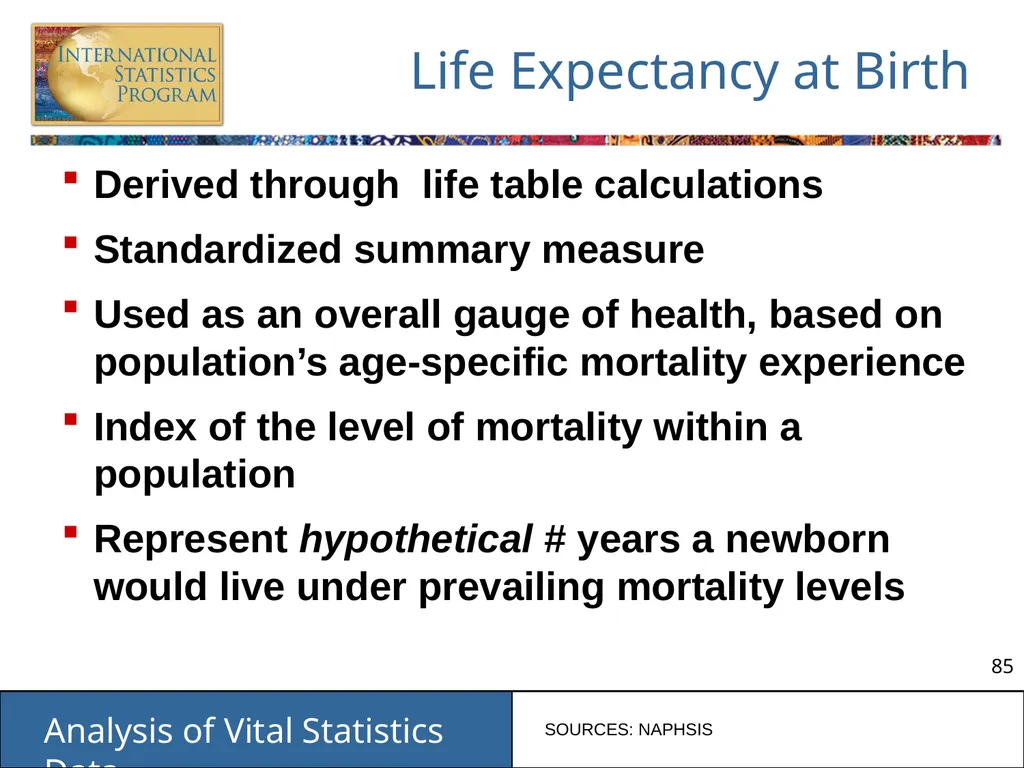
Life Expectancy at Birth Derived through life table calculations
Standardized summary measure
Used as an overall gauge of health, based on population’s age-specific mortality experience
Index of the level of mortality within a population
Represent hypothetical # years a newborn would live under prevailing mortality levels SOURCES: NAPHSIS<br>
Standardized summary measure
Used as an overall gauge of health, based on population’s age-specific mortality experience
Index of the level of mortality within a population
Represent hypothetical # years a newborn would live under prevailing mortality levels SOURCES: NAPHSIS<br>
86
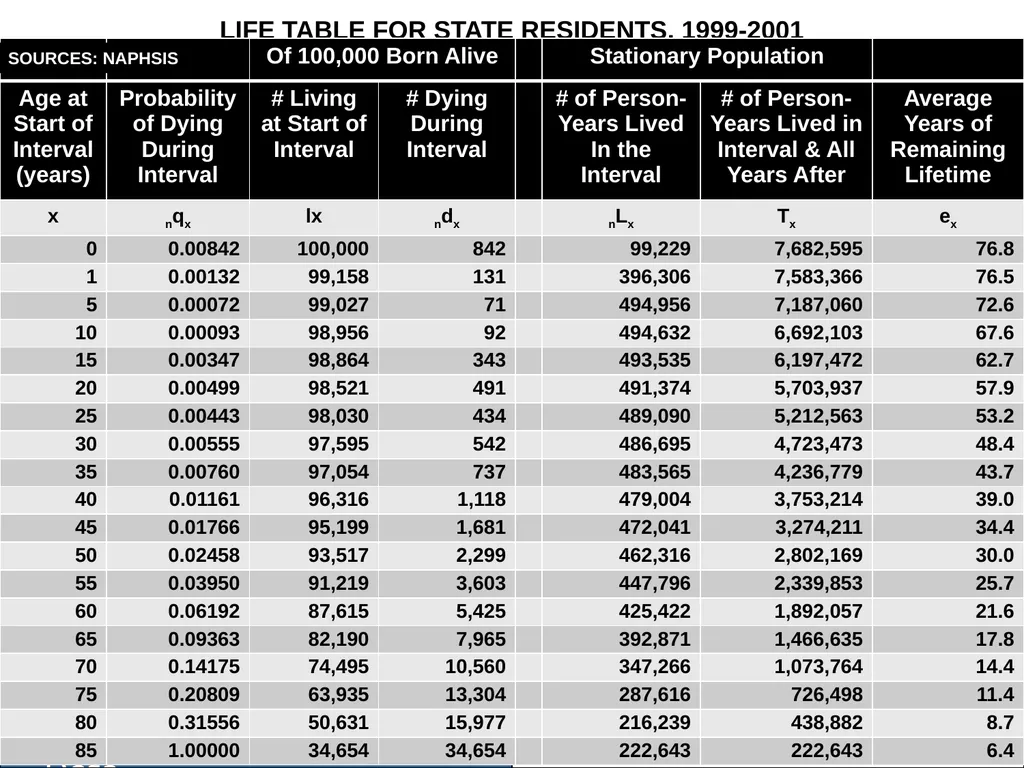
LIFE TABLE FOR STATE RESIDENTS, 1999-2001 SOURCES: NAPHSIS<br>
87
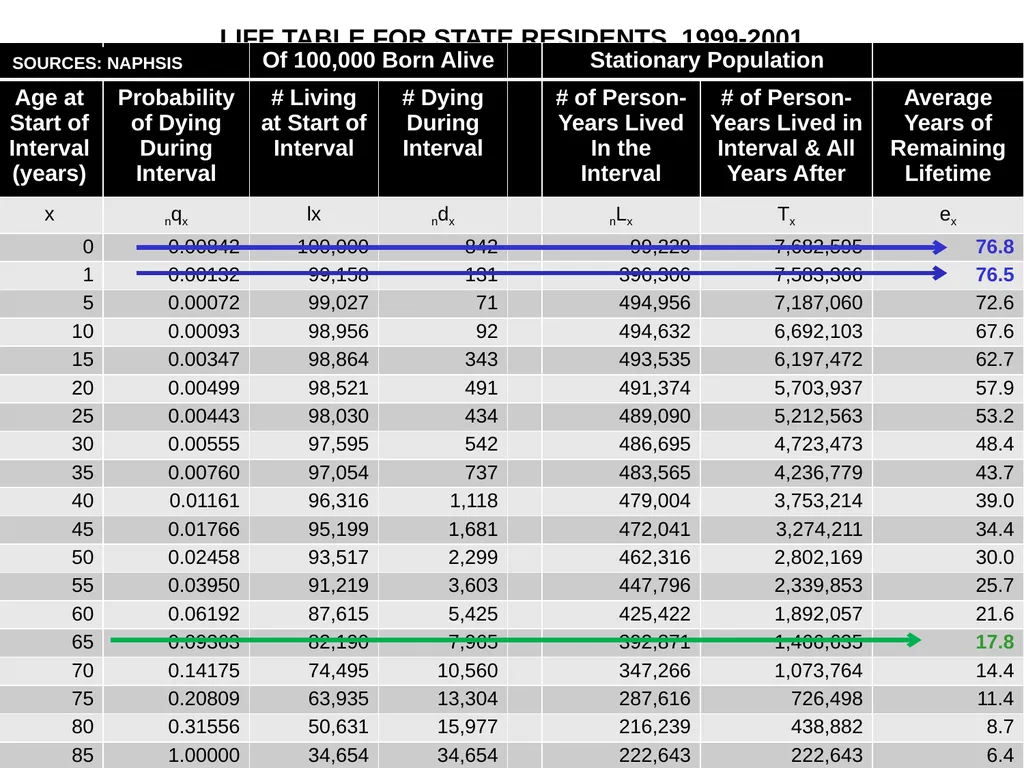
LIFE TABLE FOR STATE RESIDENTS, 1999-2001 SOURCES: NAPHSIS<br>
88
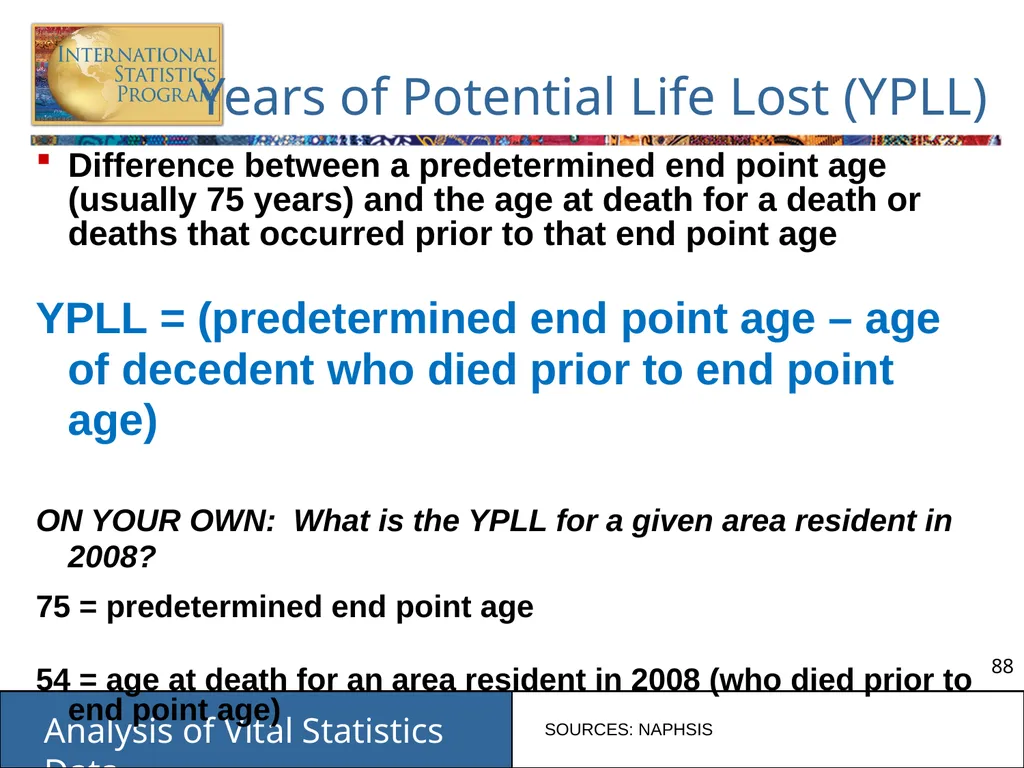
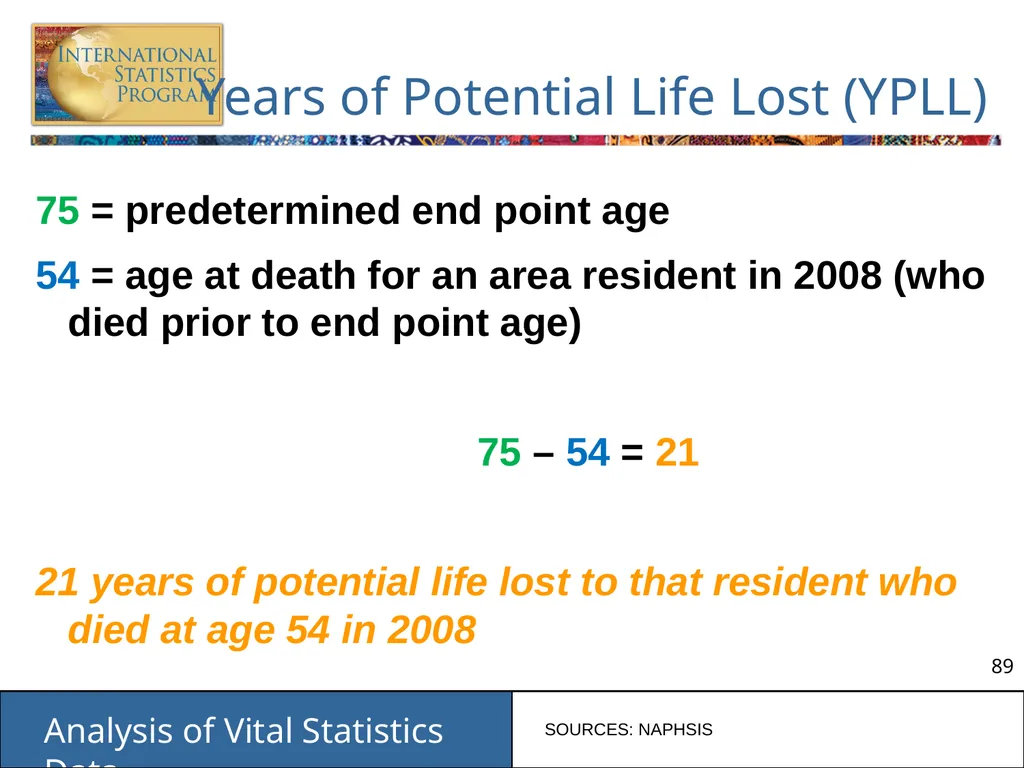
Years of Potential Life Lost (YPLL) Difference between a predetermined end point age (usually 75 years) and the age at death for a death or deaths that occurred prior to that end point age
YPLL = (predetermined end point age – age of decedent who died prior to end point age)
ON YOUR OWN: What is the YPLL for a given area resident in 2008?
75 = predetermined end point age
54 = age at death for an area resident in 2008 (who died prior to end point age) SOURCES: NAPHSIS<br>
YPLL = (predetermined end point age – age of decedent who died prior to end point age)
ON YOUR OWN: What is the YPLL for a given area resident in 2008?
75 = predetermined end point age
54 = age at death for an area resident in 2008 (who died prior to end point age) SOURCES: NAPHSIS<br>
89
Years of Potential Life Lost (YPLL) 75 = predetermined end point age
54 = age at death for an area resident in 2008 (who died prior to end point age)
75 – 54 = 21
21 years of potential life lost to that resident who died at age 54 in 2008 SOURCES: NAPHSIS<br>
54 = age at death for an area resident in 2008 (who died prior to end point age)
75 – 54 = 21
21 years of potential life lost to that resident who died at age 54 in 2008 SOURCES: NAPHSIS<br>
90
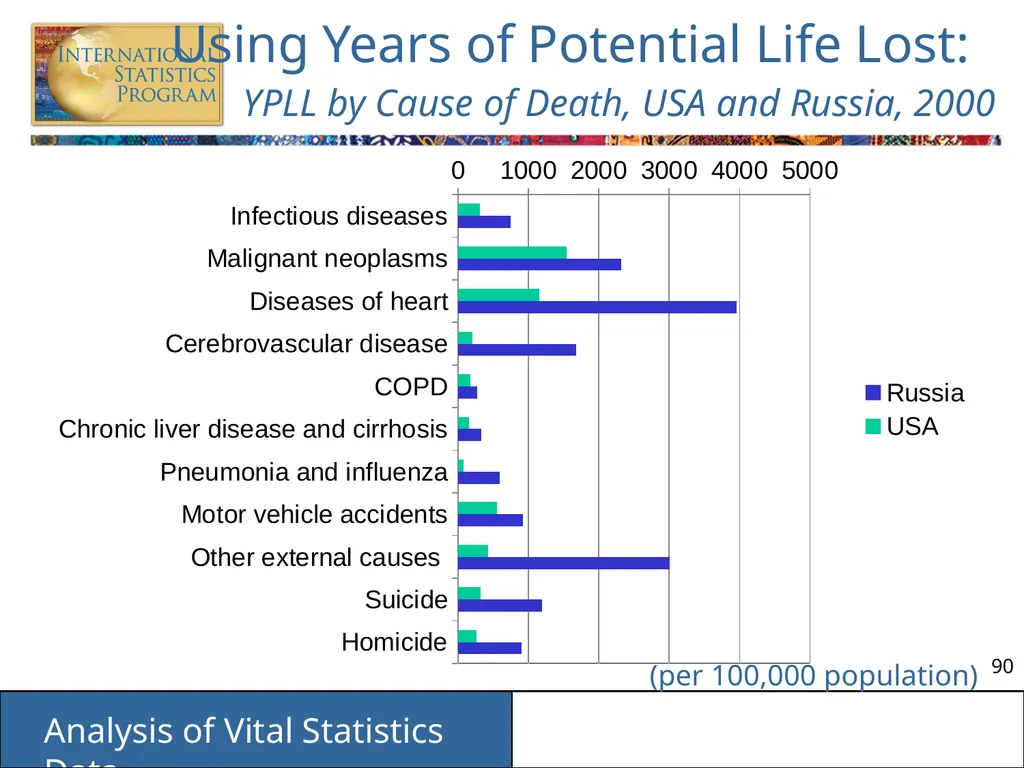
Using Years of Potential Life Lost:
YPLL by Cause of Death, USA and Russia, 2000 (per 100,000 population)<br>
91
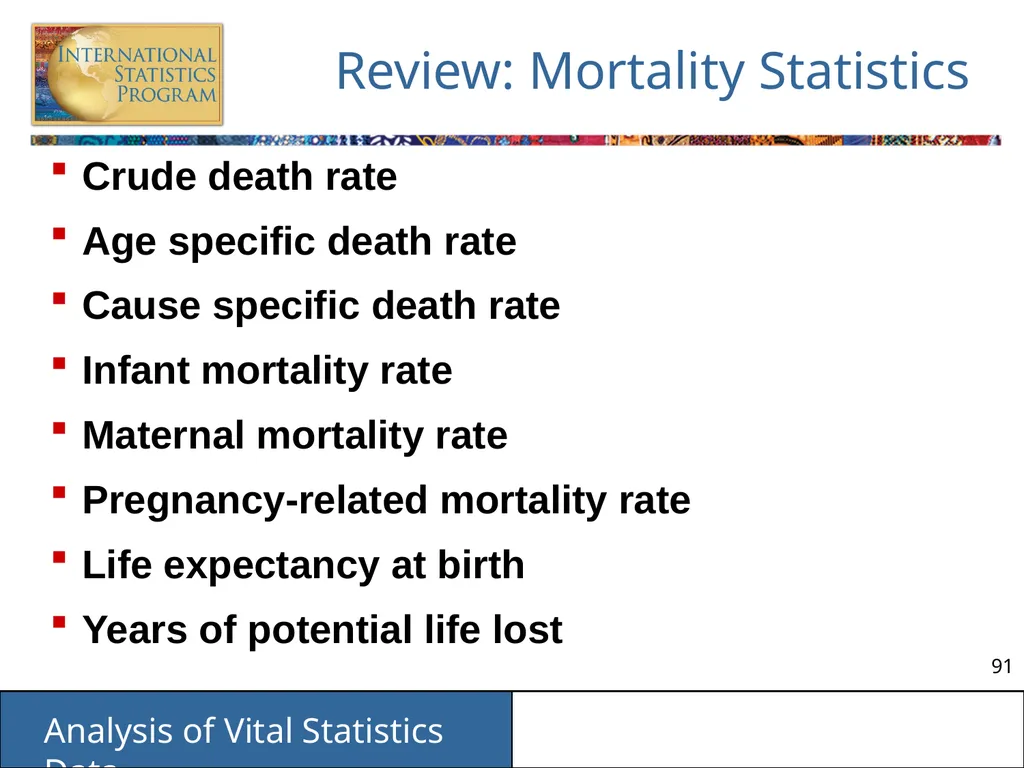
Review: Mortality Statistics Crude death rate
Age specific death rate
Cause specific death rate
Infant mortality rate
Maternal mortality rate
Pregnancy-related mortality rate
Life expectancy at birth
Years of potential life lost<br>
Age specific death rate
Cause specific death rate
Infant mortality rate
Maternal mortality rate
Pregnancy-related mortality rate
Life expectancy at birth
Years of potential life lost<br>
92
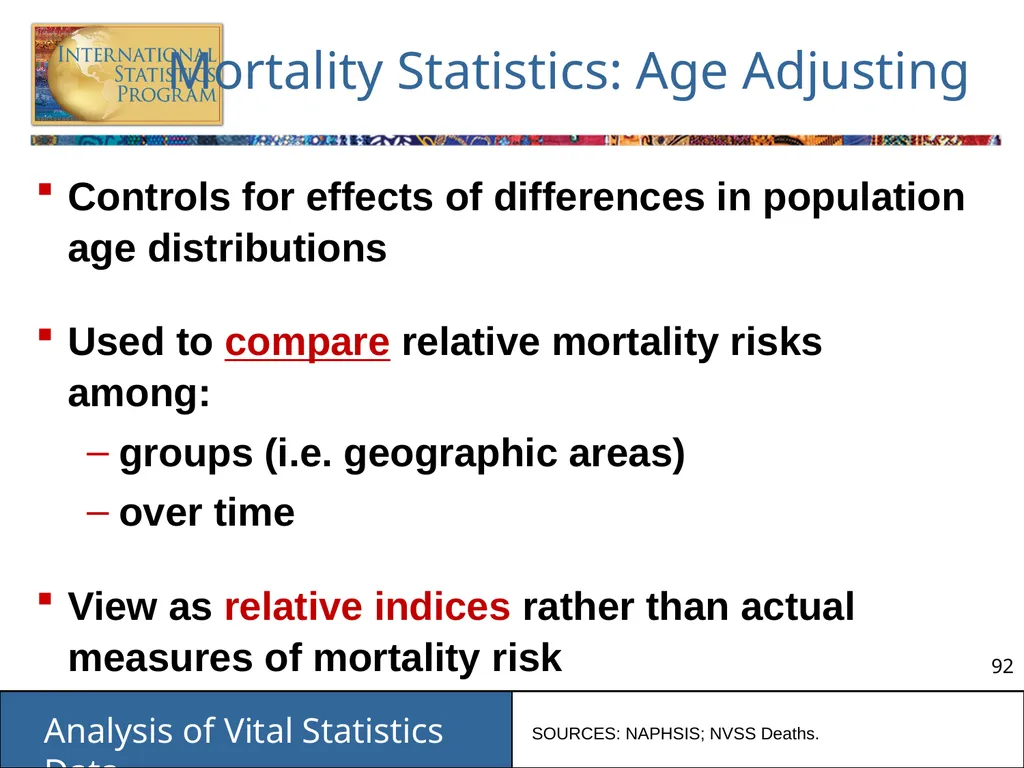
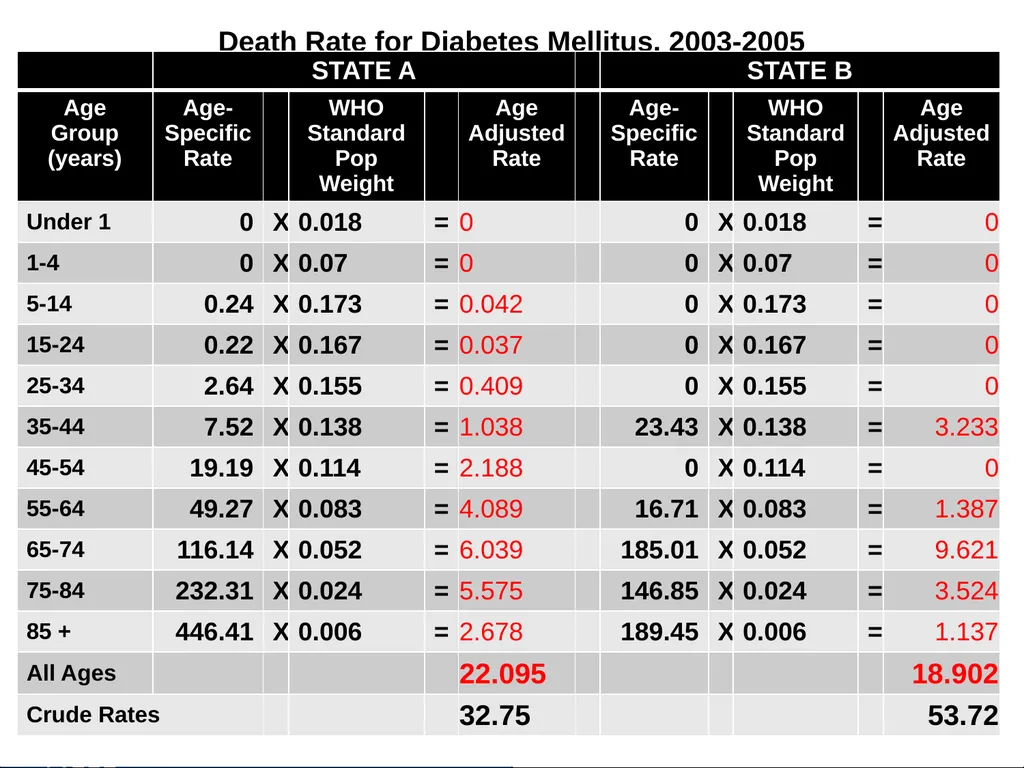
Mortality Statistics: Age Adjusting Controls for effects of differences in population age distributions
Used to compare relative mortality risks among:
groups (i.e. geographic areas)
over time
View as relative indices rather than actual measures of mortality risk SOURCES: NAPHSIS; NVSS Deaths.<br>
Used to compare relative mortality risks among:
groups (i.e. geographic areas)
over time
View as relative indices rather than actual measures of mortality risk SOURCES: NAPHSIS; NVSS Deaths.<br>
93
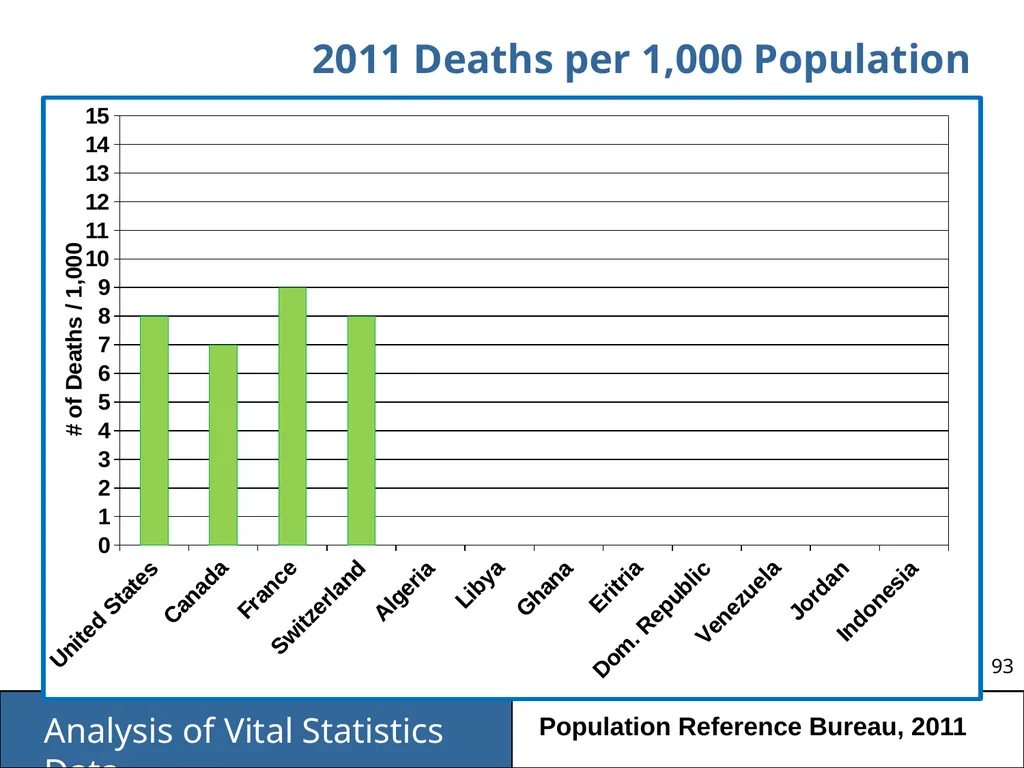
2011 Deaths per 1,000 Population Population Reference Bureau, 2011<br>
94
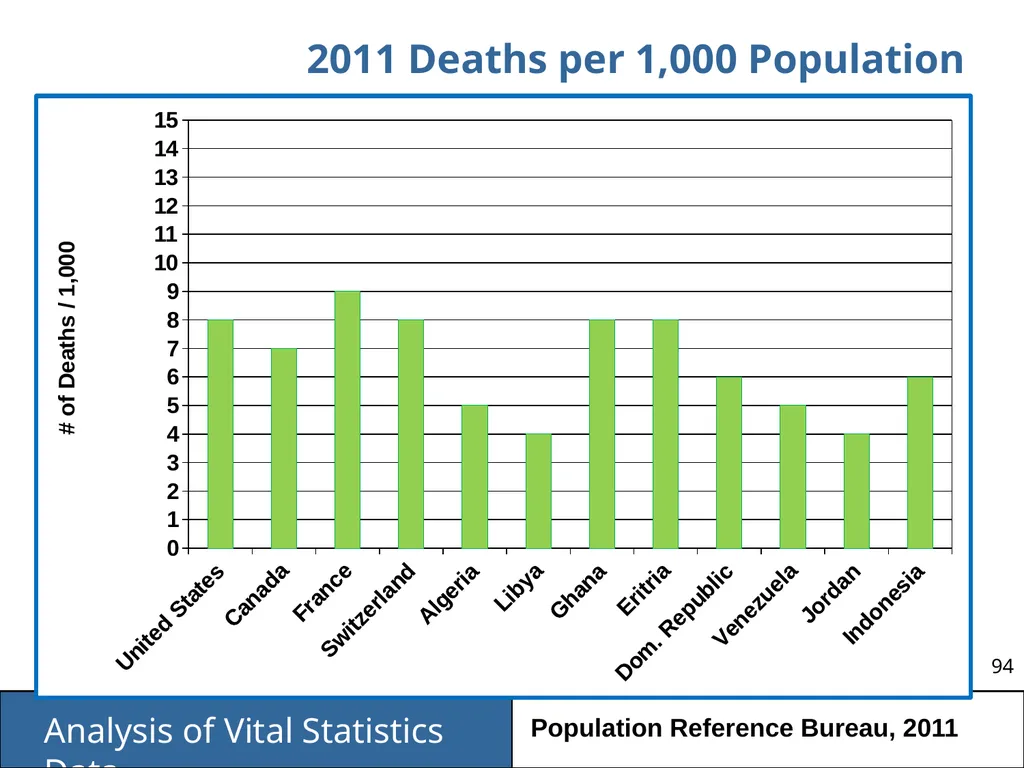
2011 Deaths per 1,000 Population Population Reference Bureau, 2011<br>
95
Mortality Statistics:
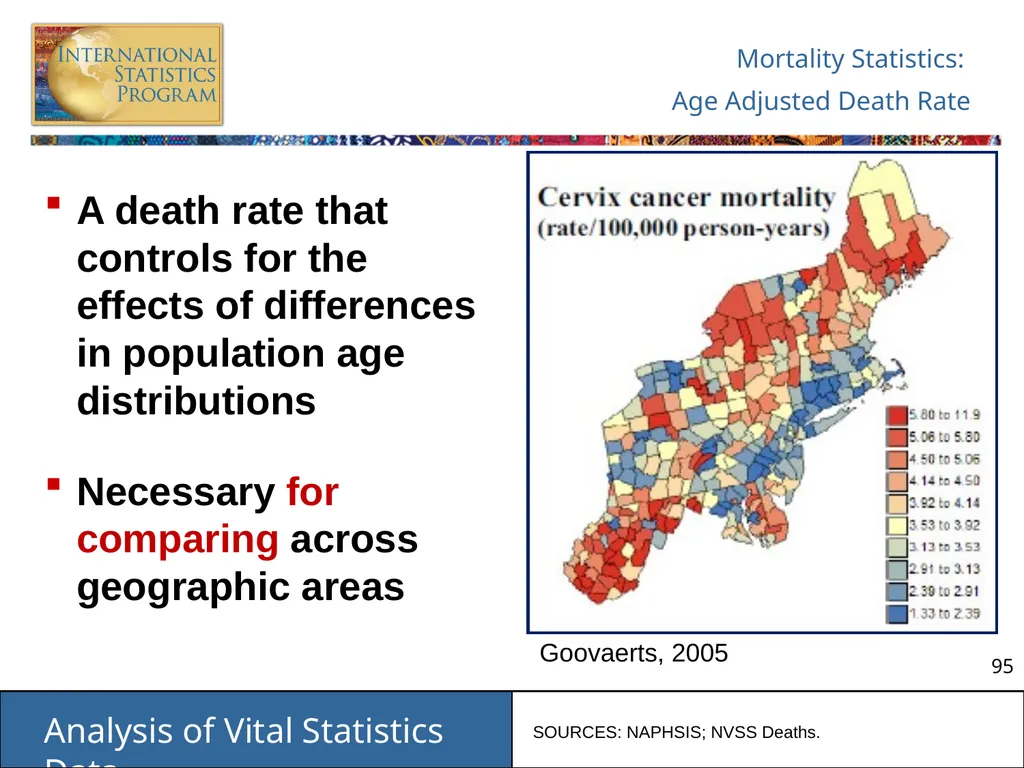
Age Adjusted Death Rate A death rate that controls for the effects of differences in population age distributions
Necessary for comparing across geographic areas Goovaerts, 2005 SOURCES: NAPHSIS; NVSS Deaths.<br>
Necessary for comparing across geographic areas Goovaerts, 2005 SOURCES: NAPHSIS; NVSS Deaths.<br>
96
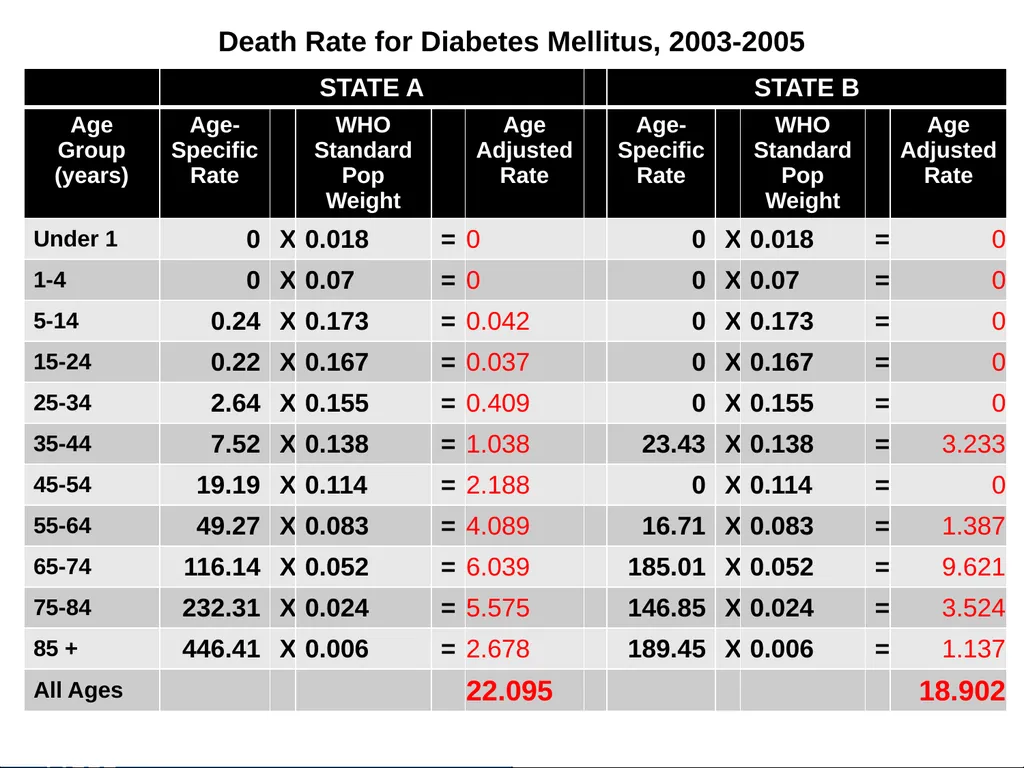
Age-adjusted Death Rate:
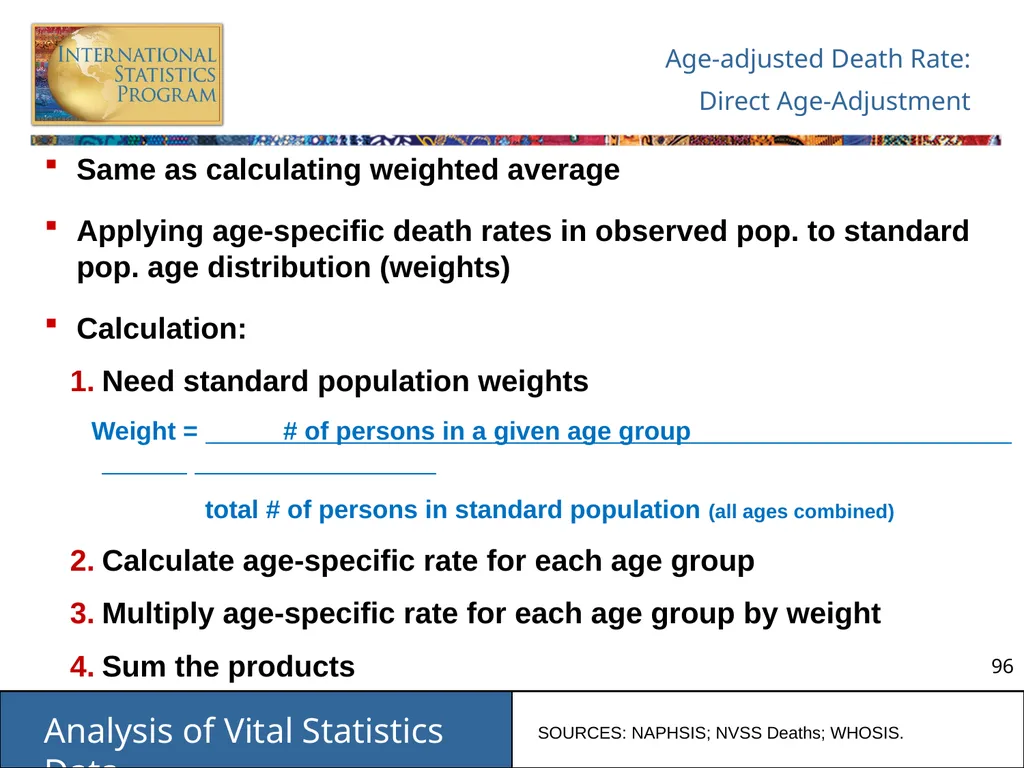
Direct Age-Adjustment Same as calculating weighted average
Applying age-specific death rates in observed pop. to standard pop. age distribution (weights)
Calculation:
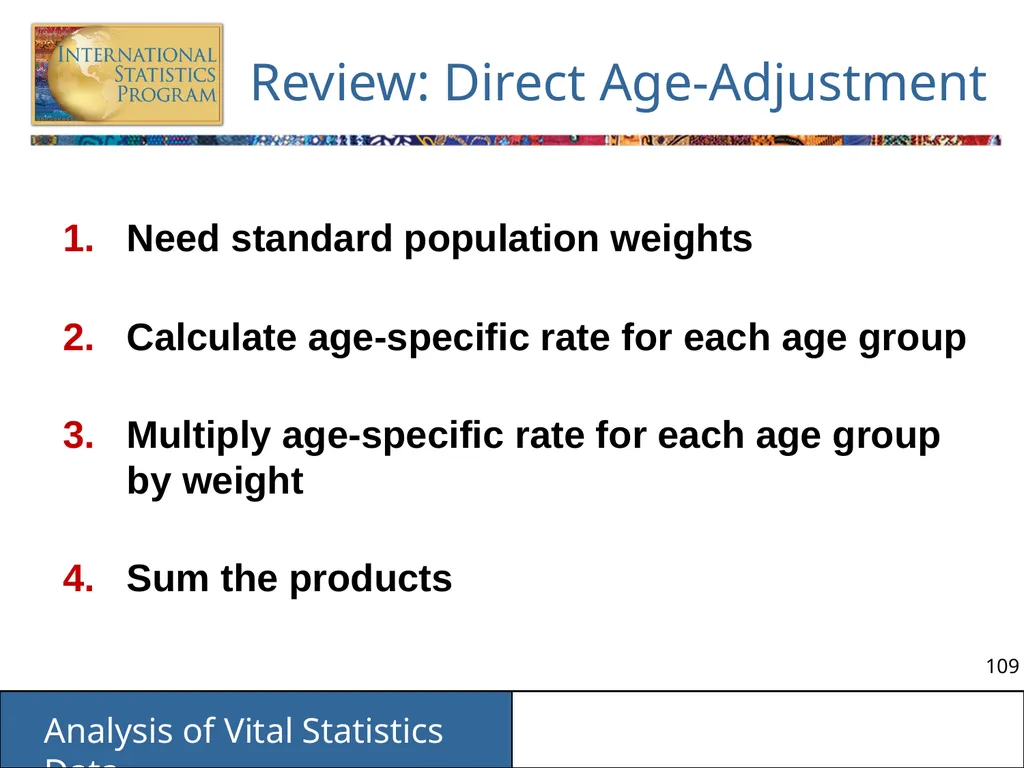
Need standard population weights
Weight = # of persons in a given age group
total # of persons in standard population (all ages combined)
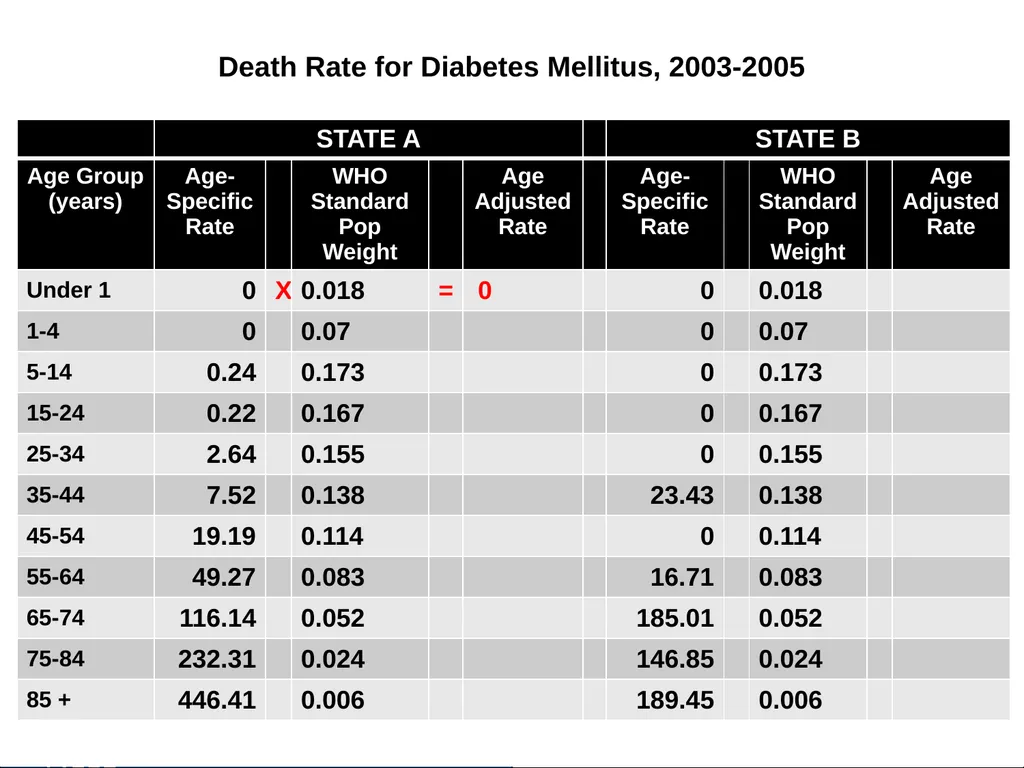
Calculate age-specific rate for each age group
Multiply age-specific rate for each age group by weight
Sum the products SOURCES: NAPHSIS; NVSS Deaths; WHOSIS.<br>
Applying age-specific death rates in observed pop. to standard pop. age distribution (weights)
Calculation:
Need standard population weights
Weight = # of persons in a given age group
total # of persons in standard population (all ages combined)
Calculate age-specific rate for each age group
Multiply age-specific rate for each age group by weight
Sum the products SOURCES: NAPHSIS; NVSS Deaths; WHOSIS.<br>
97
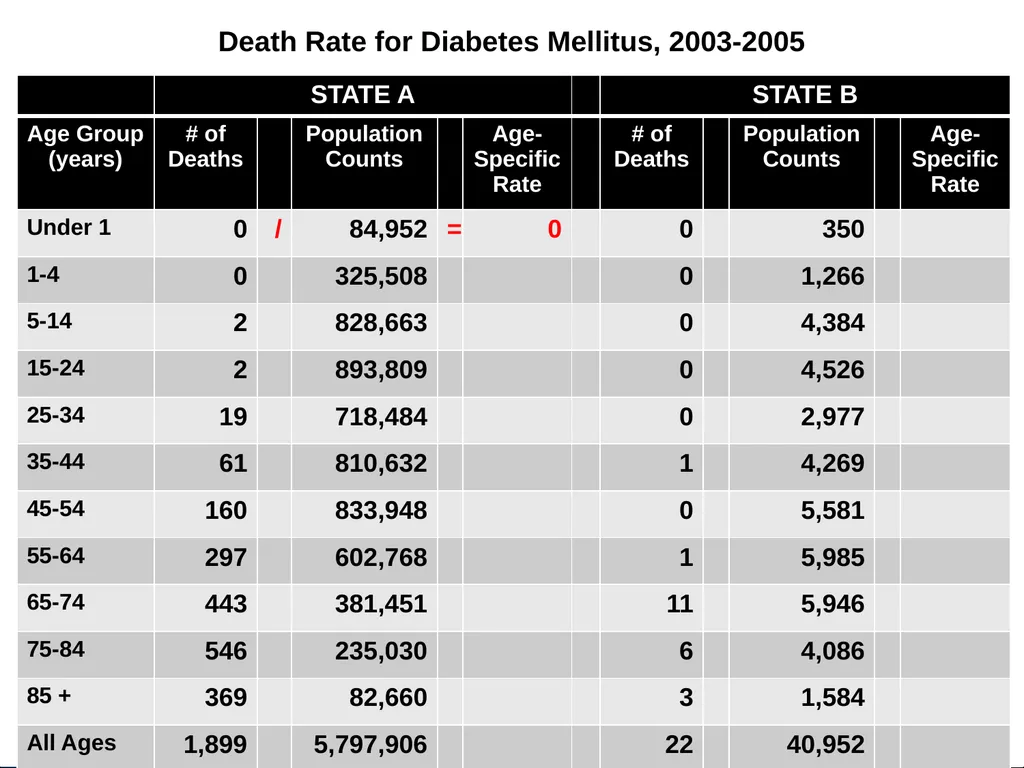
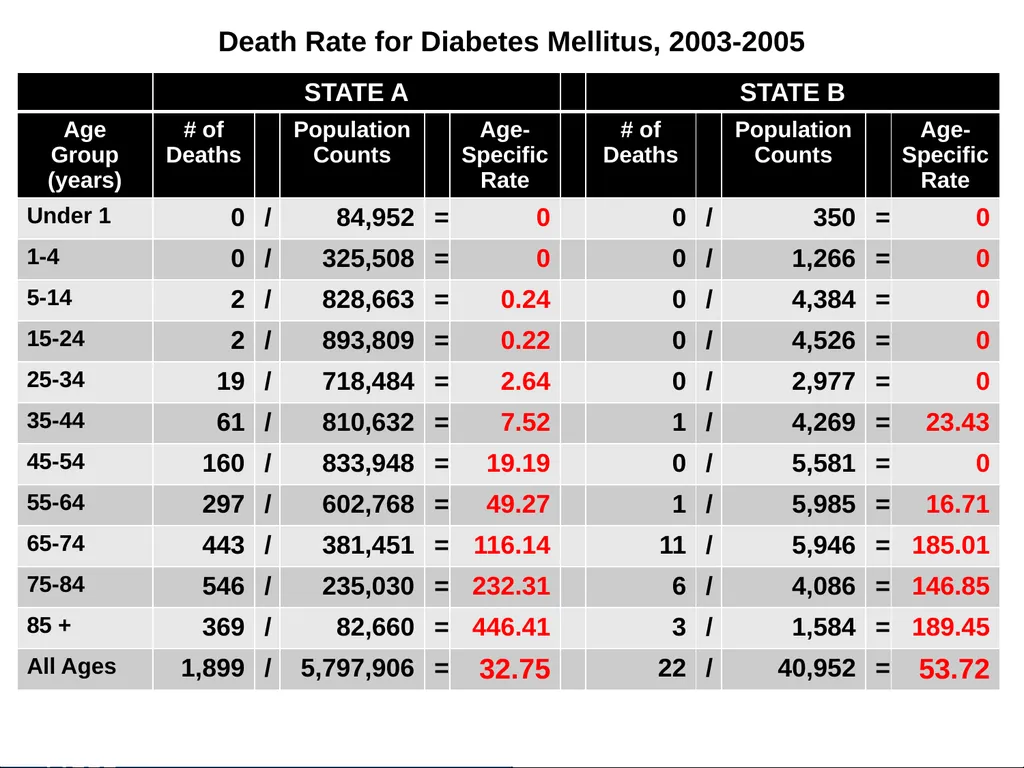
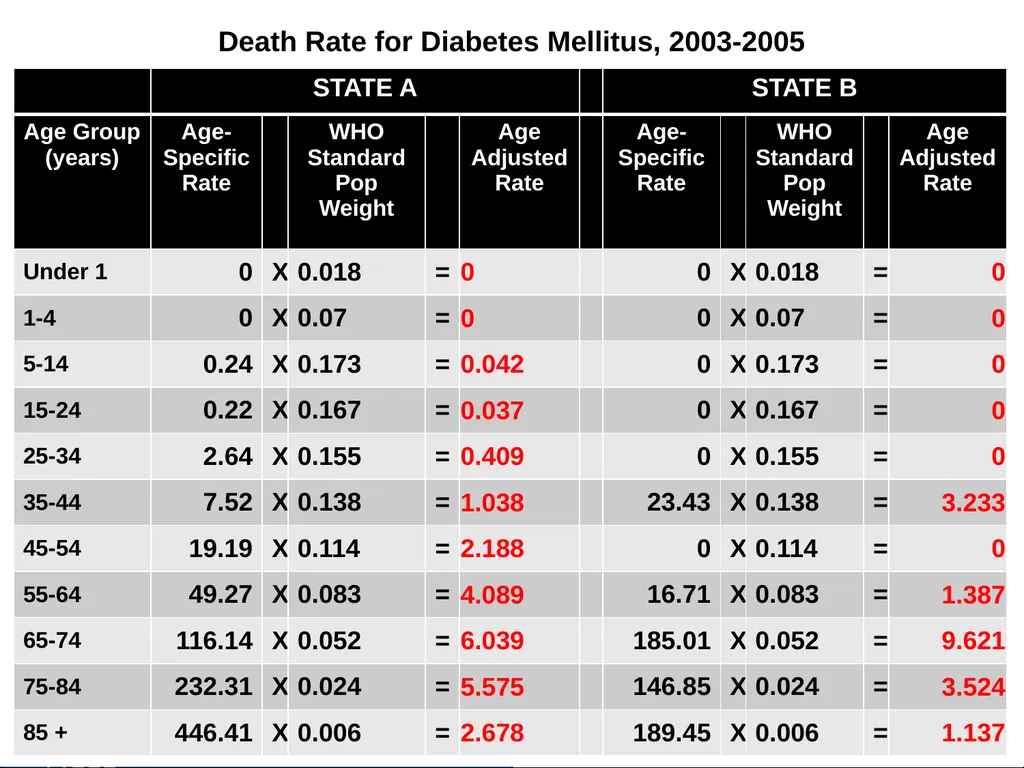
Exercise - Calculate: Age-adjusted death rates
from diabetes mellitus
for State A and State B
using data from 2003-2005<br>
from diabetes mellitus
for State A and State B
using data from 2003-2005<br>
98
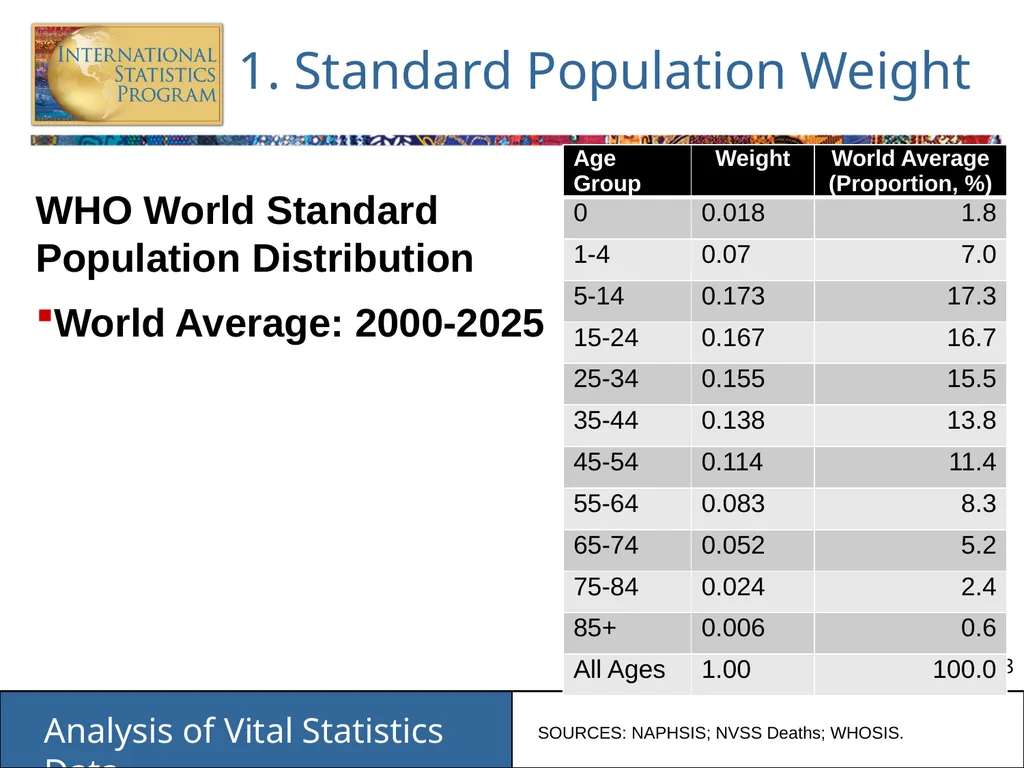
1. Standard Population Weight WHO World Standard Population Distribution
World Average: 2000-2025 SOURCES: NAPHSIS; NVSS Deaths; WHOSIS.<br>
World Average: 2000-2025 SOURCES: NAPHSIS; NVSS Deaths; WHOSIS.<br>
99
2. Calculate age-specific rate
for each age group<br>
100
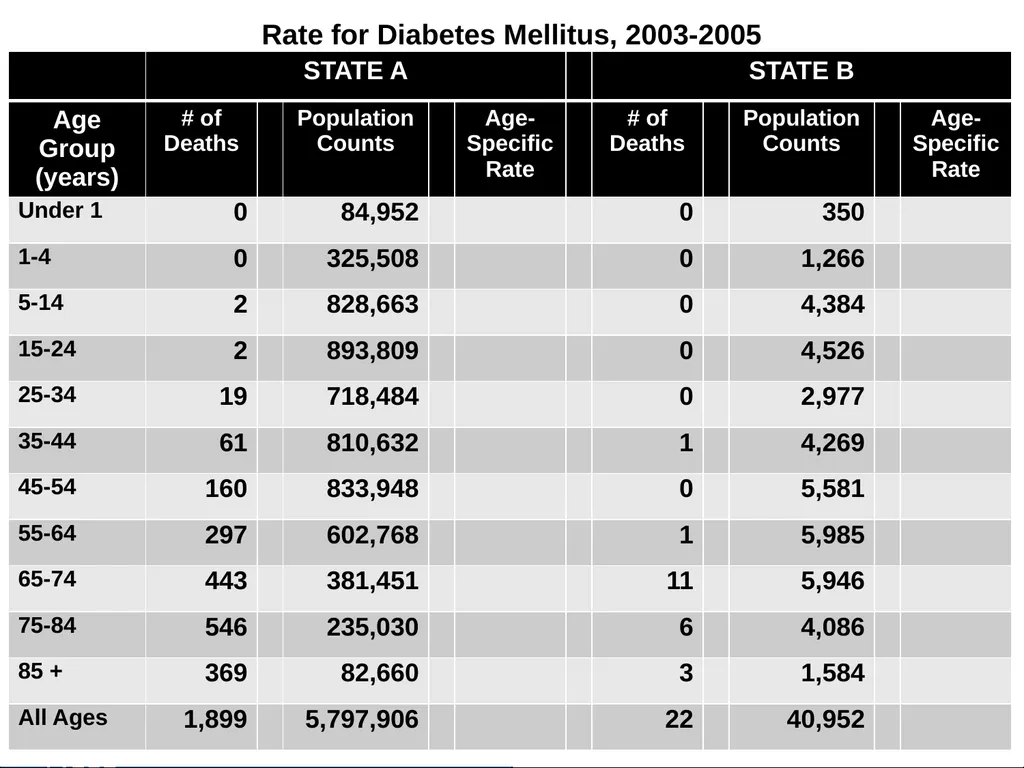
Rate for Diabetes Mellitus, 2003-2005<br>
101
Death Rate for Diabetes Mellitus, 2003-2005<br>
102
Death Rate for Diabetes Mellitus, 2003-2005<br>
103
3. Multiply age-specific rate
for each age group by weight<br>
104
Death Rate for Diabetes Mellitus, 2003-2005<br>
105
Death Rate for Diabetes Mellitus, 2003-2005<br>
106
4. Sum the products<br>
107
Death Rate for Diabetes Mellitus, 2003-2005<br>
108
Death Rate for Diabetes Mellitus, 2003-2005<br>
109
Review: Direct Age-Adjustment Need standard population weights
Calculate age-specific rate for each age group
Multiply age-specific rate for each age group by weight
Sum the products<br>
Calculate age-specific rate for each age group
Multiply age-specific rate for each age group by weight
Sum the products<br>
110
Standardized Mortality Ratio
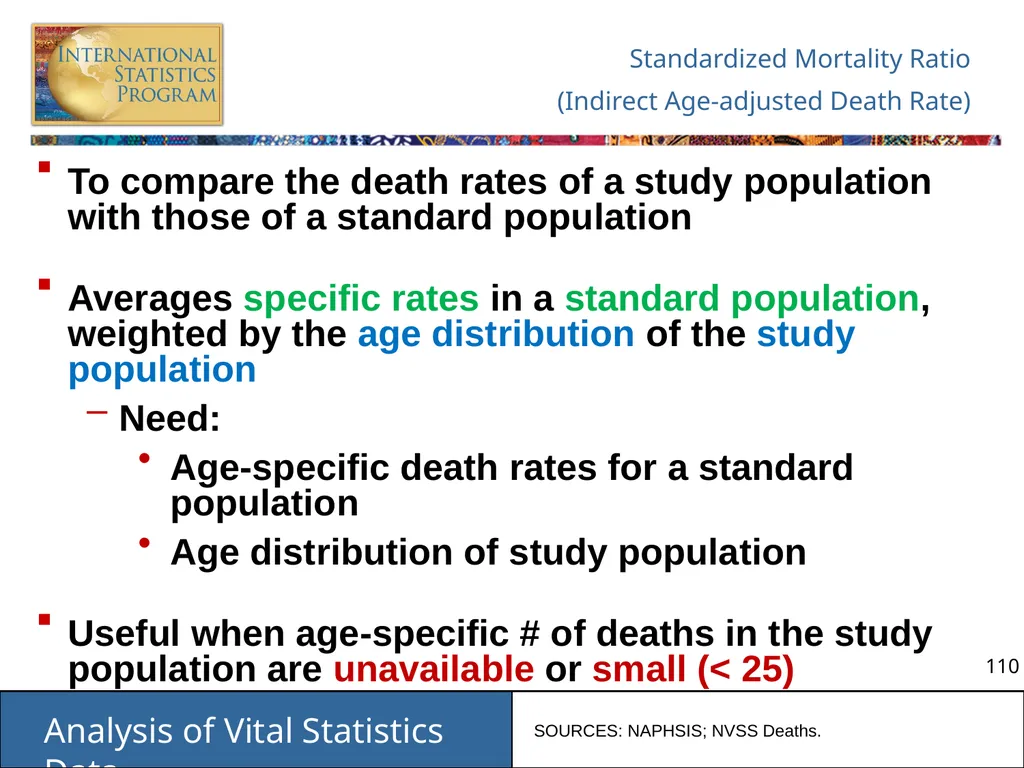
(Indirect Age-adjusted Death Rate) To compare the death rates of a study population with those of a standard population
Averages specific rates in a standard population, weighted by the age distribution of the study population
Need:
Age-specific death rates for a standard population
Age distribution of study population
Useful when age-specific # of deaths in the study population are unavailable or small (< 25) SOURCES: NAPHSIS; NVSS Deaths.<br>
Averages specific rates in a standard population, weighted by the age distribution of the study population
Need:
Age-specific death rates for a standard population
Age distribution of study population
Useful when age-specific # of deaths in the study population are unavailable or small (< 25) SOURCES: NAPHSIS; NVSS Deaths.<br>
111
Calculating a
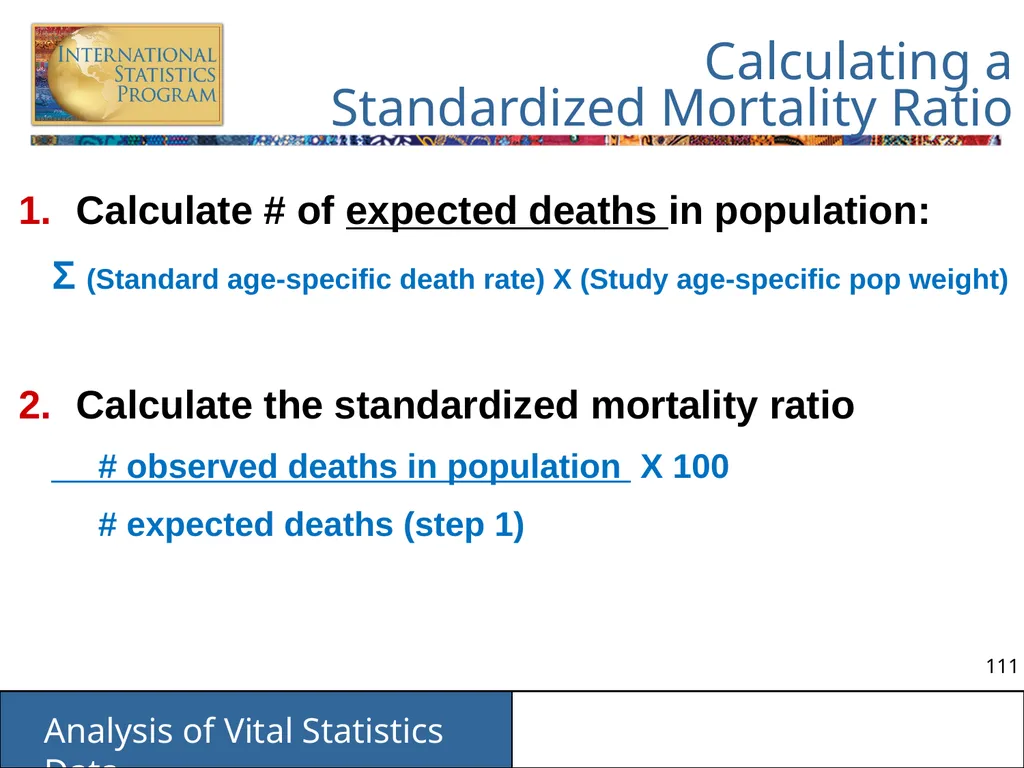
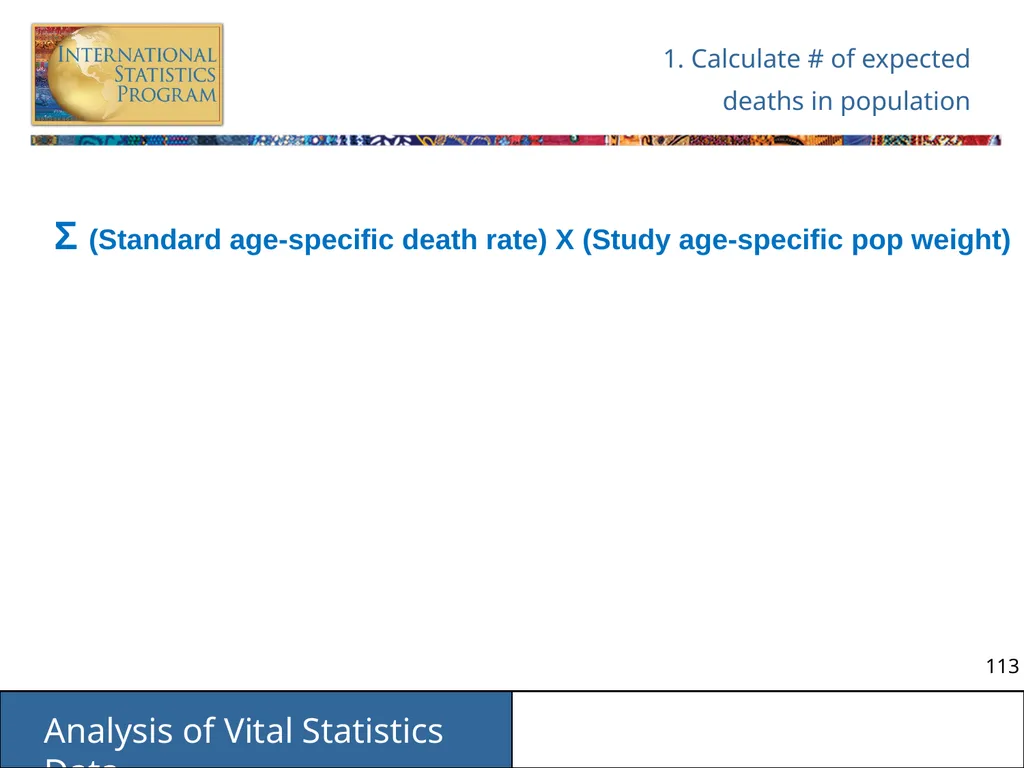
Standardized Mortality Ratio Calculate # of expected deaths in population:
Σ (Standard age-specific death rate) X (Study age-specific pop weight)
Calculate the standardized mortality ratio
# observed deaths in population X 100
# expected deaths (step 1)<br>
Σ (Standard age-specific death rate) X (Study age-specific pop weight)
Calculate the standardized mortality ratio
# observed deaths in population X 100
# expected deaths (step 1)<br>
112
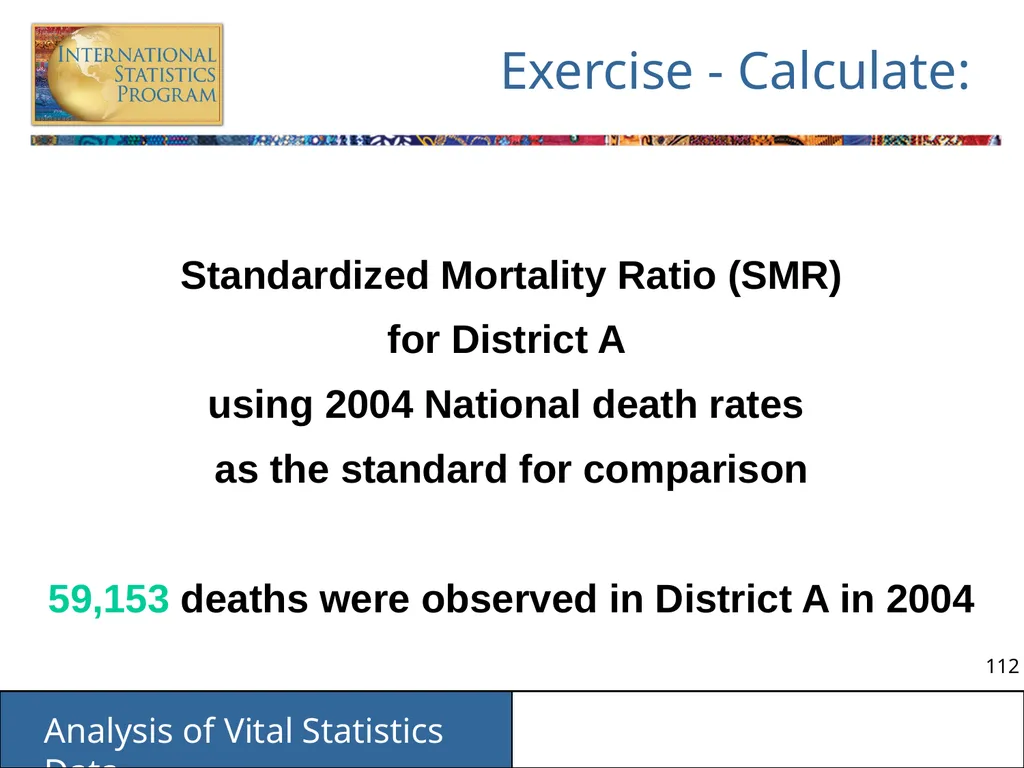
Exercise - Calculate: Standardized Mortality Ratio (SMR)
for District A
using 2004 National death rates
as the standard for comparison
59,153 deaths were observed in District A in 2004<br>
for District A
using 2004 National death rates
as the standard for comparison
59,153 deaths were observed in District A in 2004<br>
113
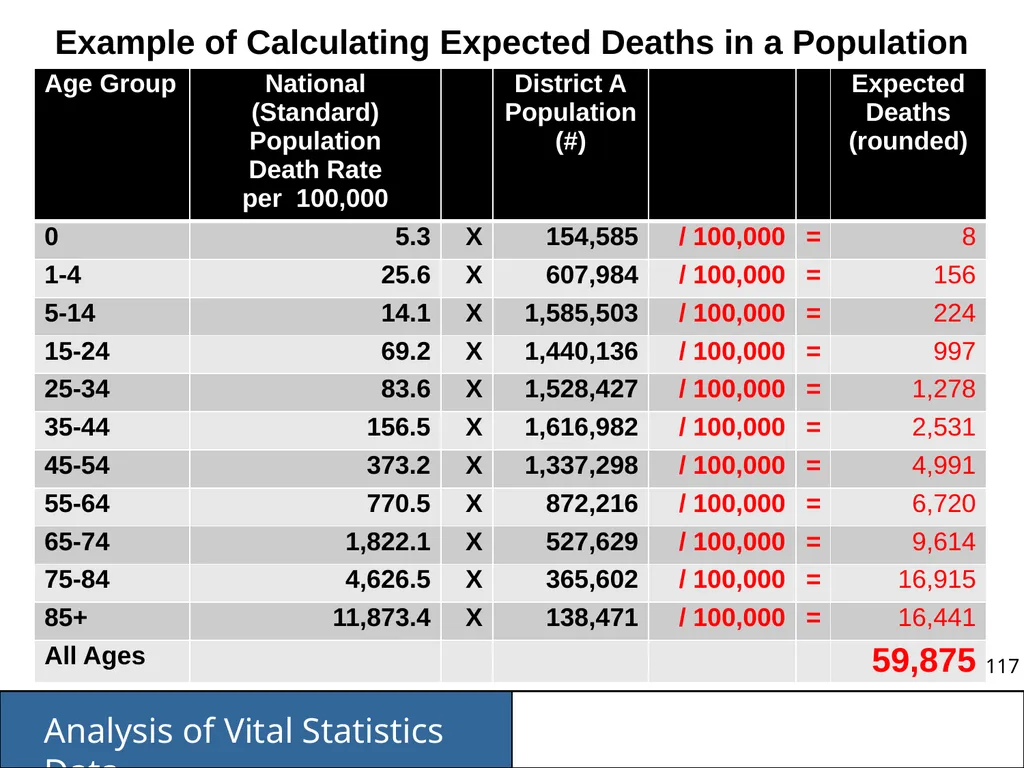
1. Calculate # of expected
deaths in population Σ (Standard age-specific death rate) X (Study age-specific pop weight)<br>
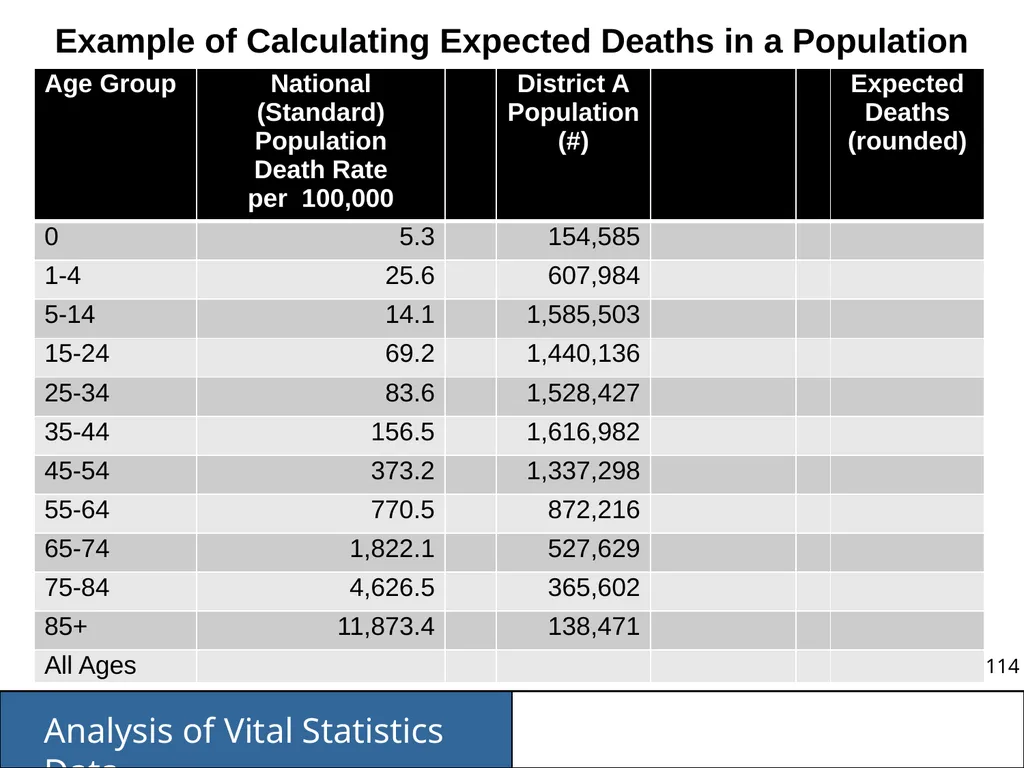
114
Example of Calculating Expected Deaths in a Population<br>
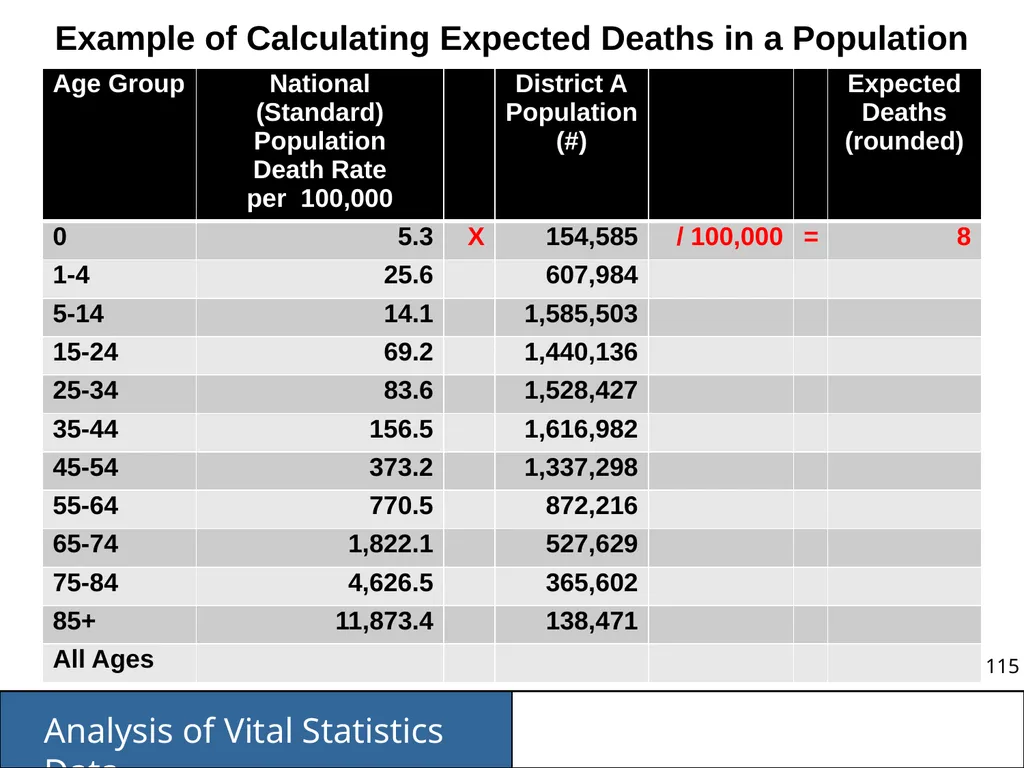
115
Example of Calculating Expected Deaths in a Population<br>
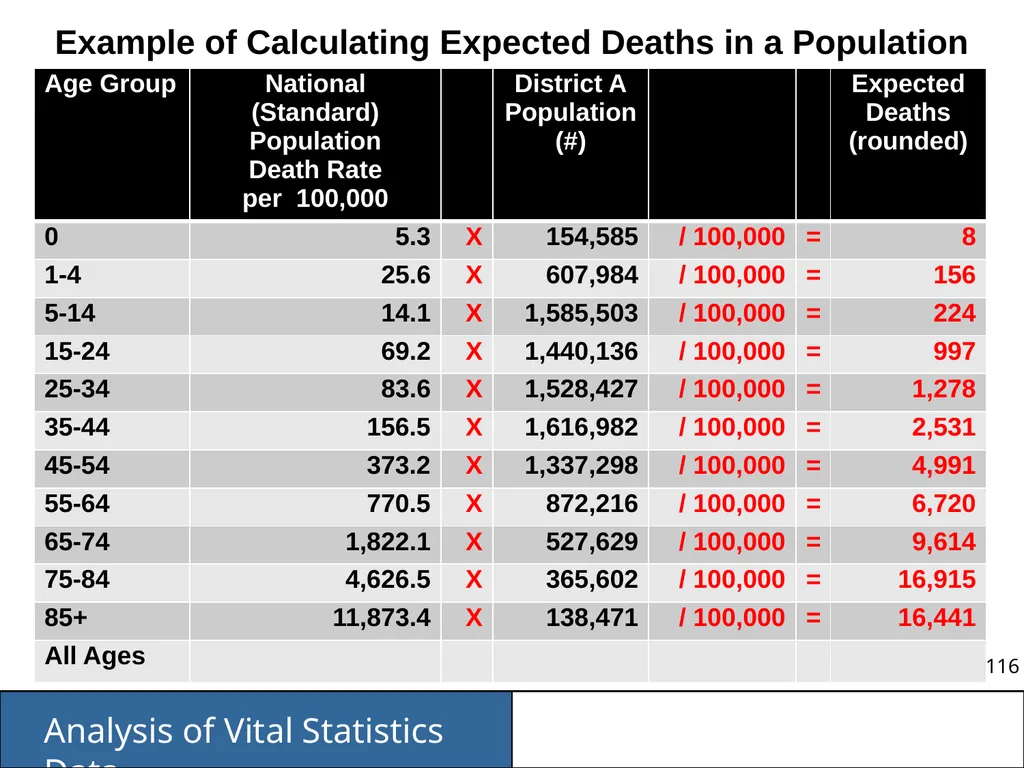
116
Example of Calculating Expected Deaths in a Population<br>
117
Example of Calculating Expected Deaths in a Population<br>
118
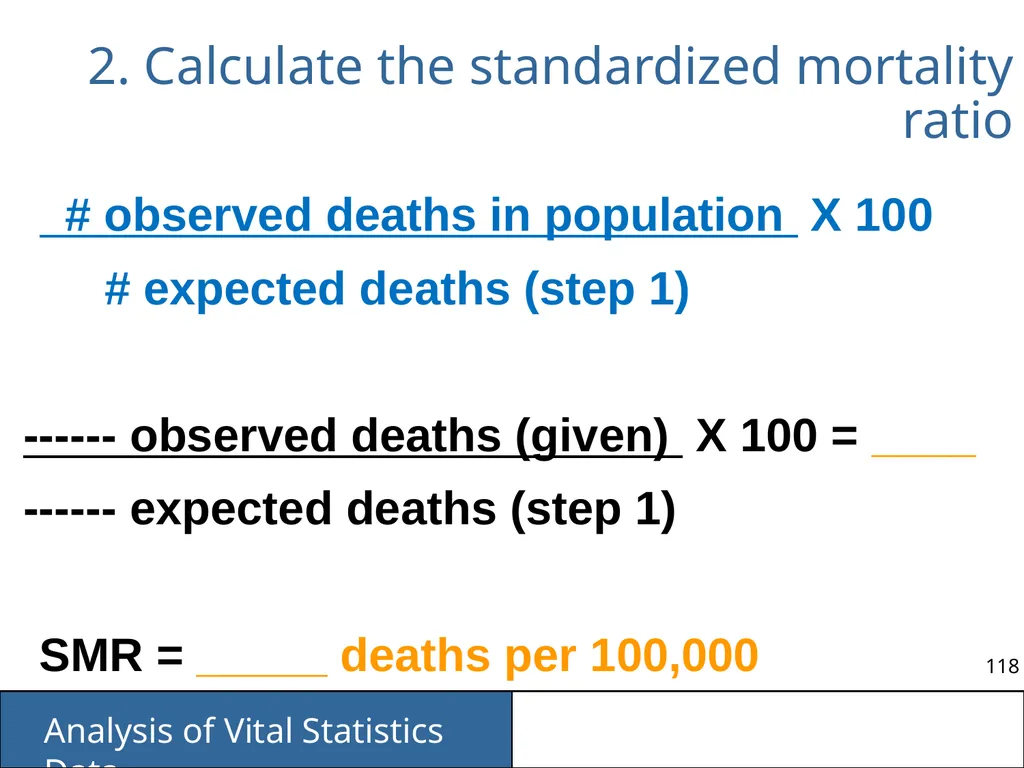
2. Calculate the standardized mortality ratio # observed deaths in population X 100
# expected deaths (step 1)
------ observed deaths (given) X 100 = ____
------ expected deaths (step 1)
SMR = _____ deaths per 100,000<br>
# expected deaths (step 1)
------ observed deaths (given) X 100 = ____
------ expected deaths (step 1)
SMR = _____ deaths per 100,000<br>
119
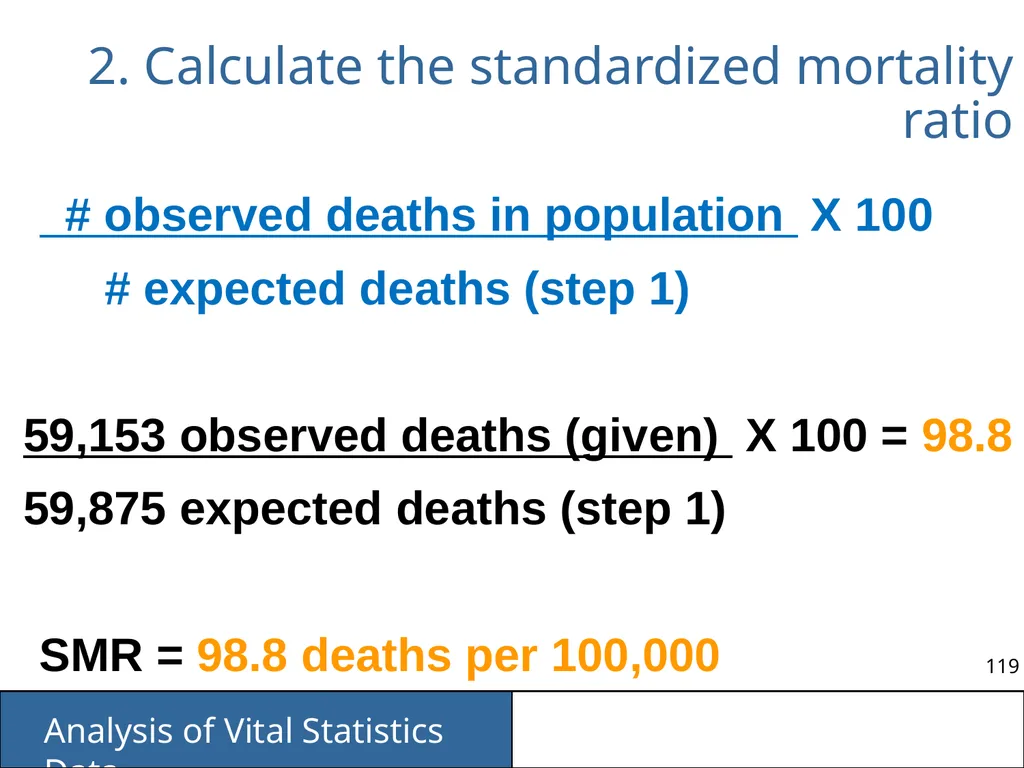
2. Calculate the standardized mortality ratio # observed deaths in population X 100
# expected deaths (step 1)
59,153 observed deaths (given) X 100 = 98.8
59,875 expected deaths (step 1)
SMR = 98.8 deaths per 100,000<br>
# expected deaths (step 1)
59,153 observed deaths (given) X 100 = 98.8
59,875 expected deaths (step 1)
SMR = 98.8 deaths per 100,000<br>
120
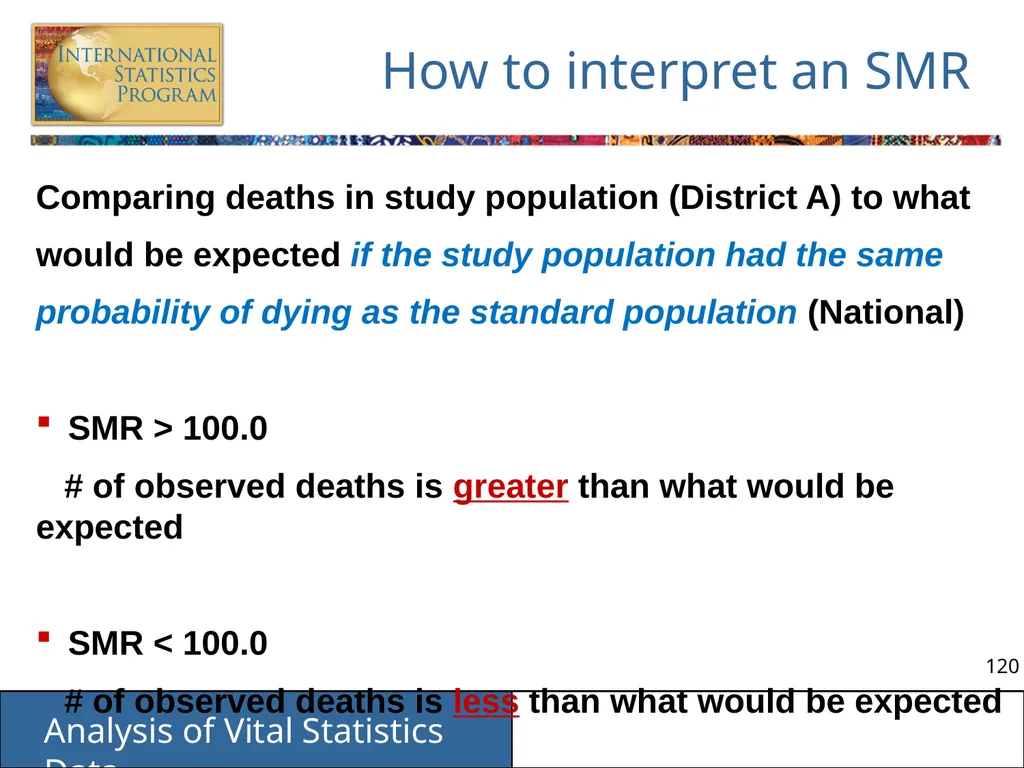
How to interpret an SMR Comparing deaths in study population (District A) to what would be expected if the study population had the same probability of dying as the standard population (National)
SMR > 100.0
# of observed deaths is greater than what would be expected
SMR < 100.0
# of observed deaths is less than what would be expected<br>
SMR > 100.0
# of observed deaths is greater than what would be expected
SMR < 100.0
# of observed deaths is less than what would be expected<br>
121
Review: Age Adjusting Why we adjust
Direct age adjustment
Uses standard population age distributions
Indirect age adjustment
Uses standard population age-specific death rate<br>
Direct age adjustment
Uses standard population age distributions
Indirect age adjustment
Uses standard population age-specific death rate<br>
122
Mortality Statistics What types of mortality statistics are produced/used in your country?<br>
123
Cause of Death Tabulations Cause of death lists are basis for:
Leading causes of death
National cause of death tabulations
WHO death tables by country as a resource:
http://www.who.int/healthinfo/statistics/mortality/en/index.html
Each country should develop national cause of death tabulation list to meet specific needs SOURCES: WHO Health Statistics and Health Information Systems, Mortality Data: http://www.who.int/healthinfo/statistics/mortality/en/index.html<br>
Leading causes of death
National cause of death tabulations
WHO death tables by country as a resource:
http://www.who.int/healthinfo/statistics/mortality/en/index.html
Each country should develop national cause of death tabulation list to meet specific needs SOURCES: WHO Health Statistics and Health Information Systems, Mortality Data: http://www.who.int/healthinfo/statistics/mortality/en/index.html<br>
124
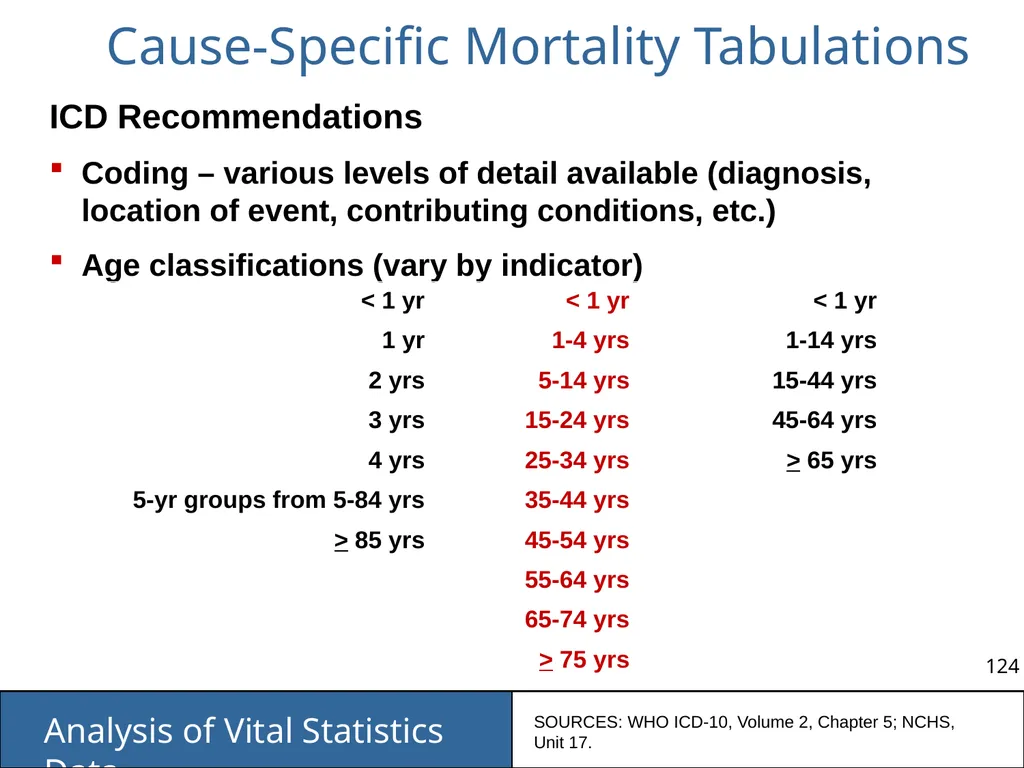
Cause-Specific Mortality Tabulations ICD Recommendations
Coding – various levels of detail available (diagnosis, location of event, contributing conditions, etc.)
Age classifications (vary by indicator) SOURCES: WHO ICD-10, Volume 2, Chapter 5; NCHS, Unit 17.<br>
Coding – various levels of detail available (diagnosis, location of event, contributing conditions, etc.)
Age classifications (vary by indicator) SOURCES: WHO ICD-10, Volume 2, Chapter 5; NCHS, Unit 17.<br>
125
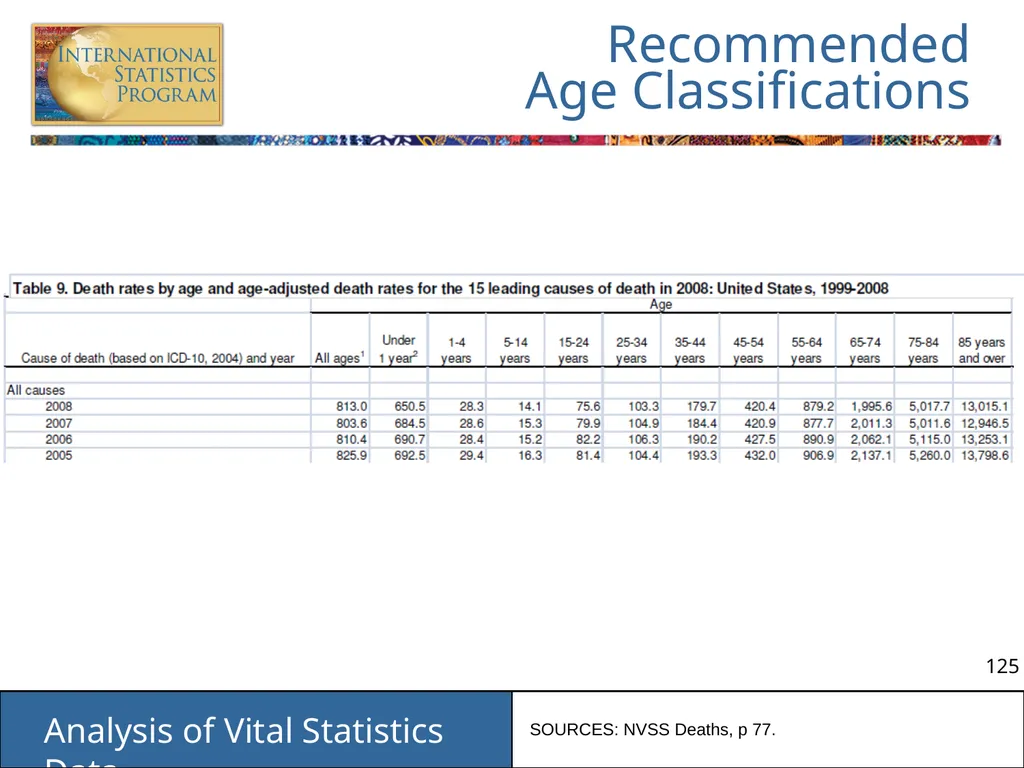
Recommended
Age Classifications SOURCES: NVSS Deaths, p 77.<br>
126
Cause-Specific
Mortality Tabulations ICD Recommendations (continued):
Area classifications
Major civil division (state, province, region, country, etc.)
Town or conurbation of ≥ 1 million, otherwise largest town with population ≥ 100,000
National aggregate of urban areas (≥ 100,000 population)
National aggregate of urban areas (< 100,000 population)
National aggregate of rural areas
* Include definitions of urban and rural
* Where medical certification of COD is limited to certain areas, separate figures for deaths not medically certified SOURCES: WHO ICD-10, Volume 2, Chapter 5.<br>
Area classifications
Major civil division (state, province, region, country, etc.)
Town or conurbation of ≥ 1 million, otherwise largest town with population ≥ 100,000
National aggregate of urban areas (≥ 100,000 population)
National aggregate of urban areas (< 100,000 population)
National aggregate of rural areas
* Include definitions of urban and rural
* Where medical certification of COD is limited to certain areas, separate figures for deaths not medically certified SOURCES: WHO ICD-10, Volume 2, Chapter 5.<br>
127
ICD Tabulation Lists:
Lists of causes of mortality
Adopted by World Health Assembly in 1990
4 lists:
General mortality, condensed list (103 causes)
General mortality, selected list (80 causes)
Infant & child mortality, condensed list (67 causes)
Infant & child mortality, selected list (51 causes) SOURCES: WHO ICD-10, Volume 1, p 1205-20, Volume 2, Chapter 5. Cause-Specific Mortality Tabulations<br>
Lists of causes of mortality
Adopted by World Health Assembly in 1990
4 lists:
General mortality, condensed list (103 causes)
General mortality, selected list (80 causes)
Infant & child mortality, condensed list (67 causes)
Infant & child mortality, selected list (51 causes) SOURCES: WHO ICD-10, Volume 1, p 1205-20, Volume 2, Chapter 5. Cause-Specific Mortality Tabulations<br>
128
ICD Tabulation Lists (continued):
Which list to use?
Condensed: Condense full range of ICD (3 character) categories
Selected: Items significant for monitoring population health status at sub-national, national, and international levels
Customize for local use (if no international comparison) SOURCES: WHO ICD-10, Volume 1, p 1205-20, Volume 2, Chapter 5. Cause-Specific Mortality Tabulations<br>
Which list to use?
Condensed: Condense full range of ICD (3 character) categories
Selected: Items significant for monitoring population health status at sub-national, national, and international levels
Customize for local use (if no international comparison) SOURCES: WHO ICD-10, Volume 1, p 1205-20, Volume 2, Chapter 5. Cause-Specific Mortality Tabulations<br>
129
Mortality Statistics:
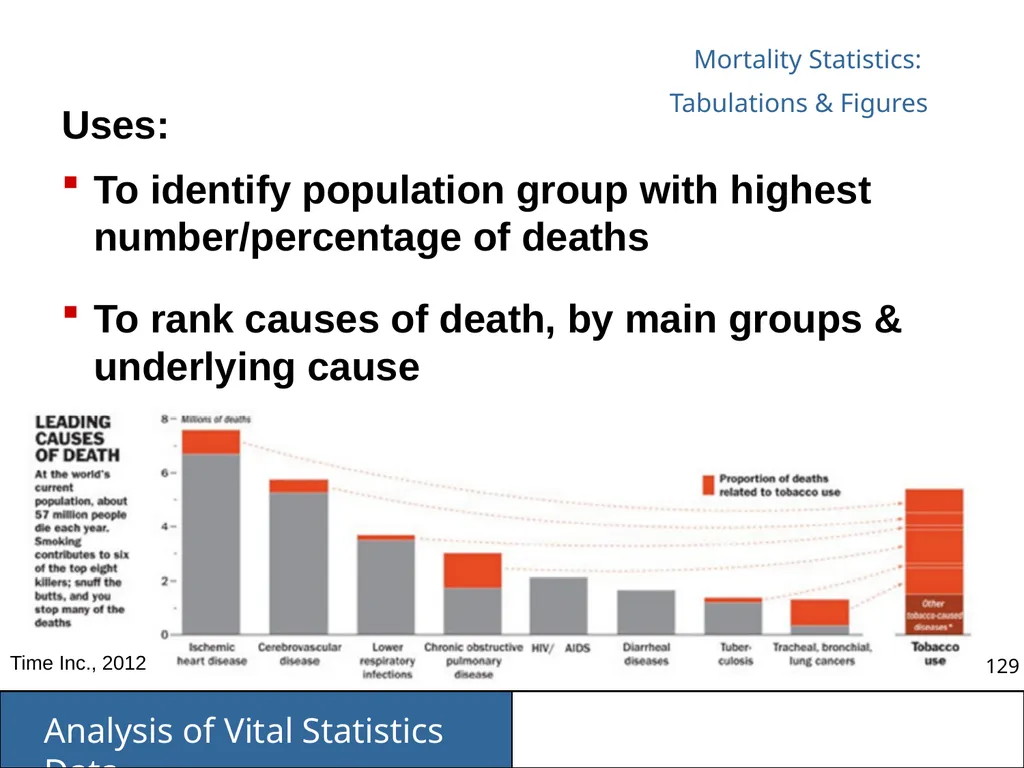
Tabulations & Figures Uses:
To identify population group with highest number/percentage of deaths
To rank causes of death, by main groups & underlying cause Time Inc., 2012<br>
To identify population group with highest number/percentage of deaths
To rank causes of death, by main groups & underlying cause Time Inc., 2012<br>
130
Crude and Age-adjusted Death Rates SOURCES: NVSS Deaths, p 9.<br>
131
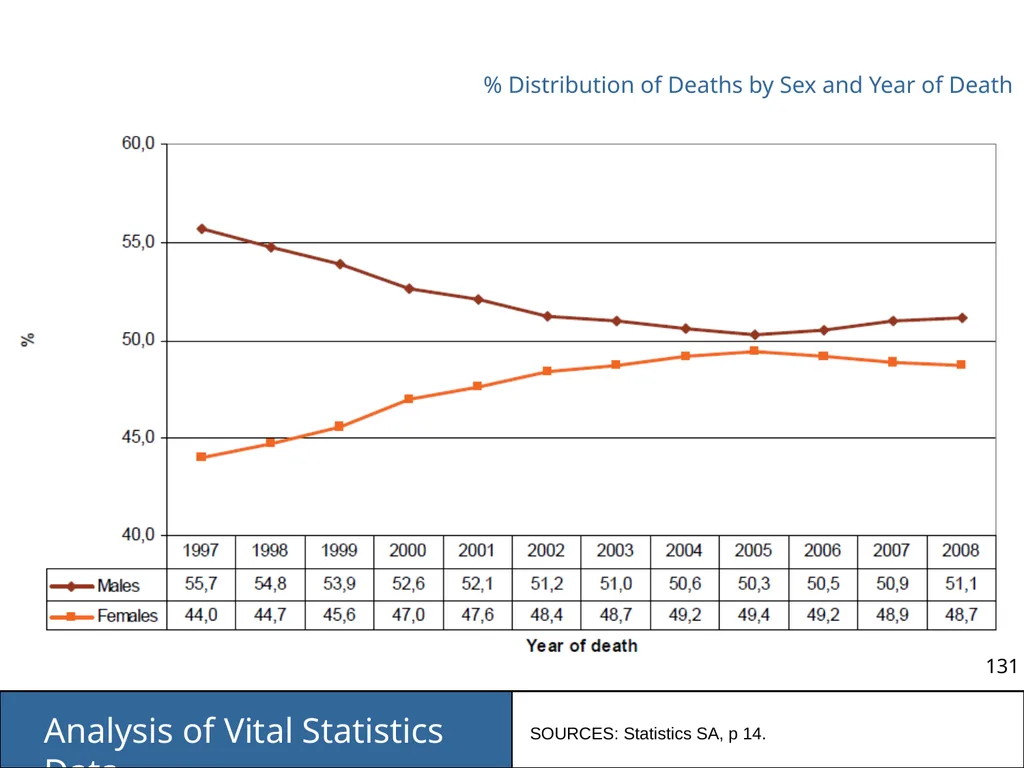
% Distribution of Deaths by Sex and Year of Death SOURCES: Statistics SA, p 14.<br>
132
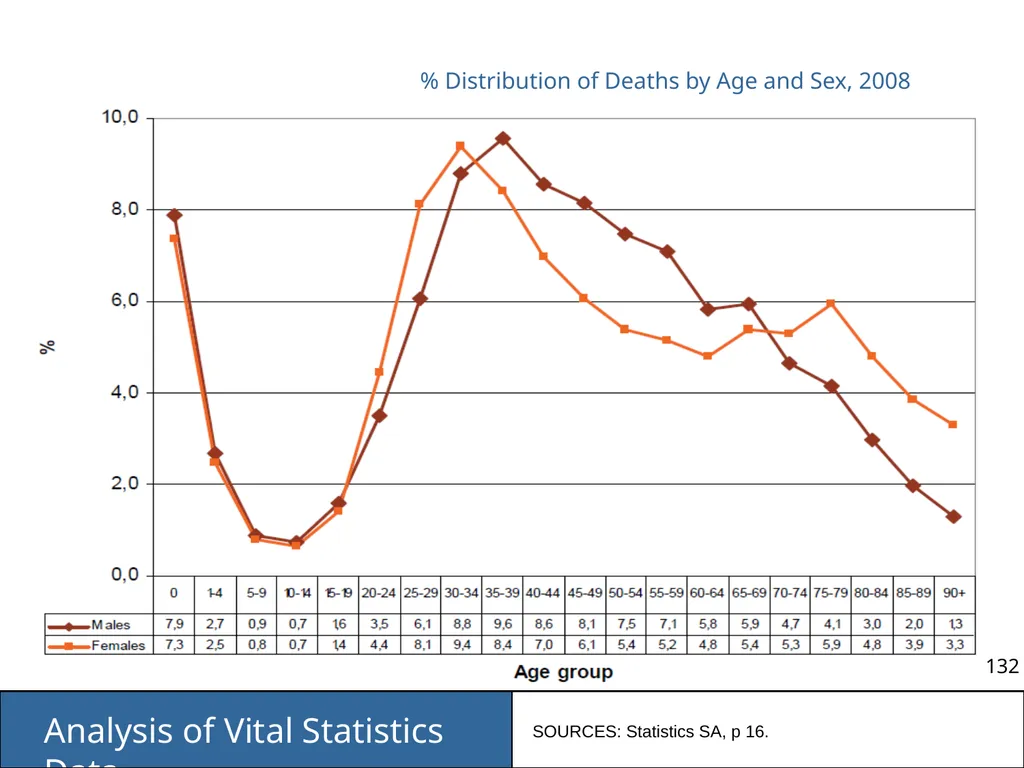
% Distribution of Deaths by Age and Sex, 2008 SOURCES: Statistics SA, p 16.<br>
133
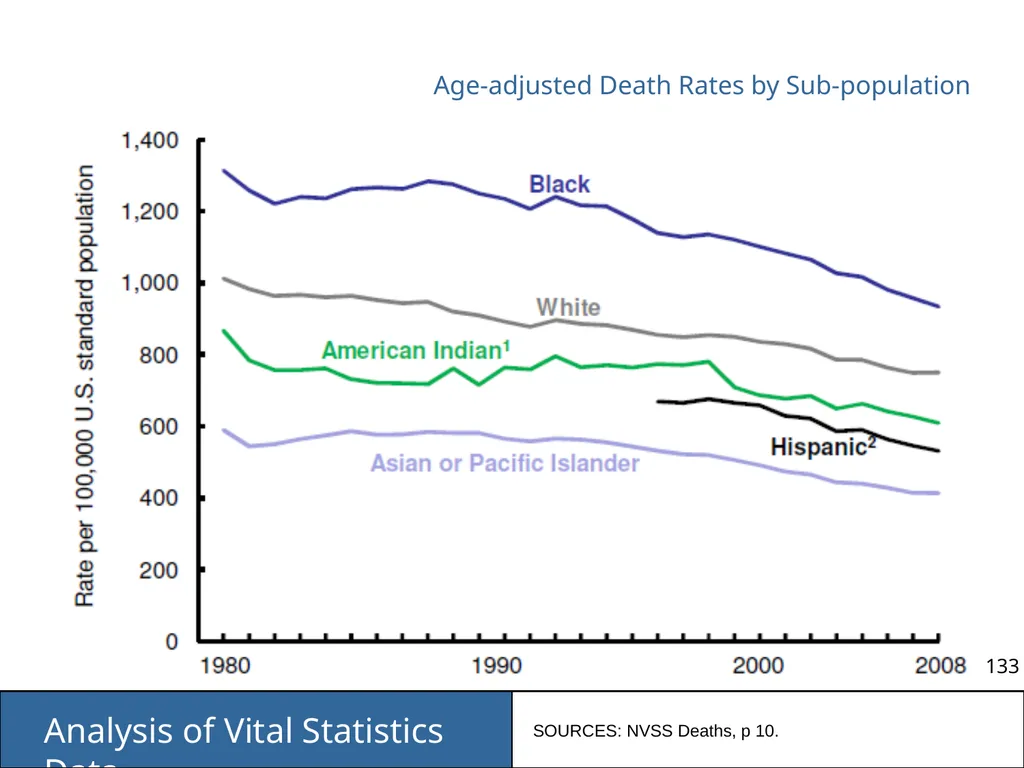
Age-adjusted Death Rates by Sub-population SOURCES: NVSS Deaths, p 10.<br>
134
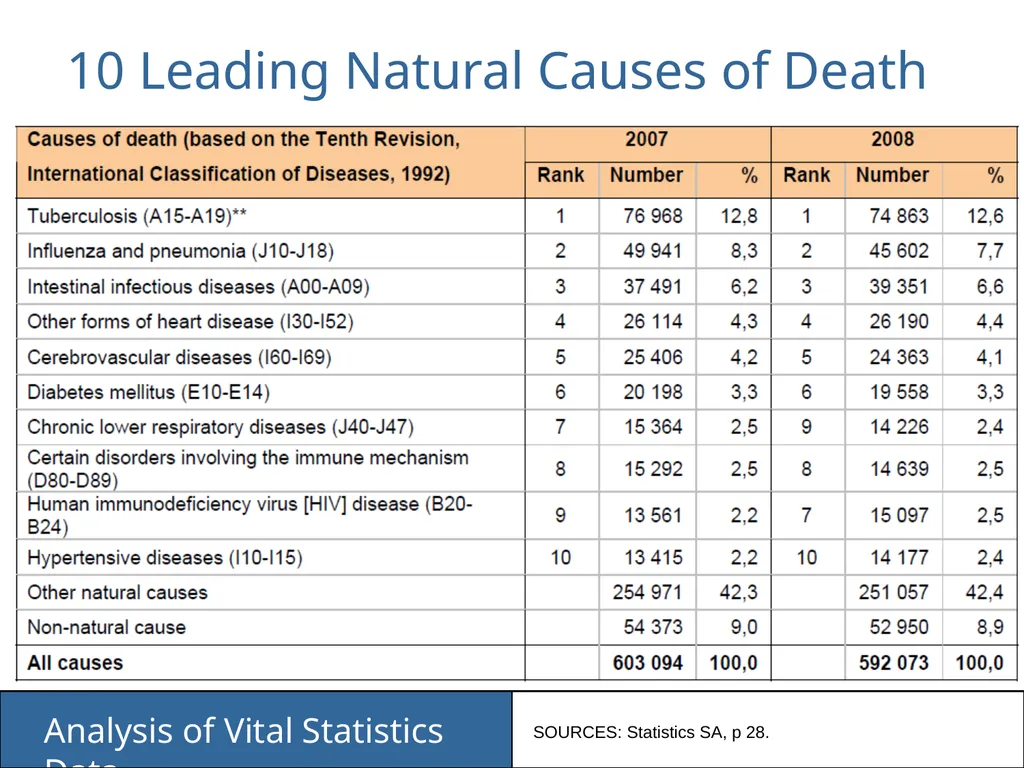
10 Leading Natural Causes of Death SOURCES: Statistics SA, p 28.<br>
135
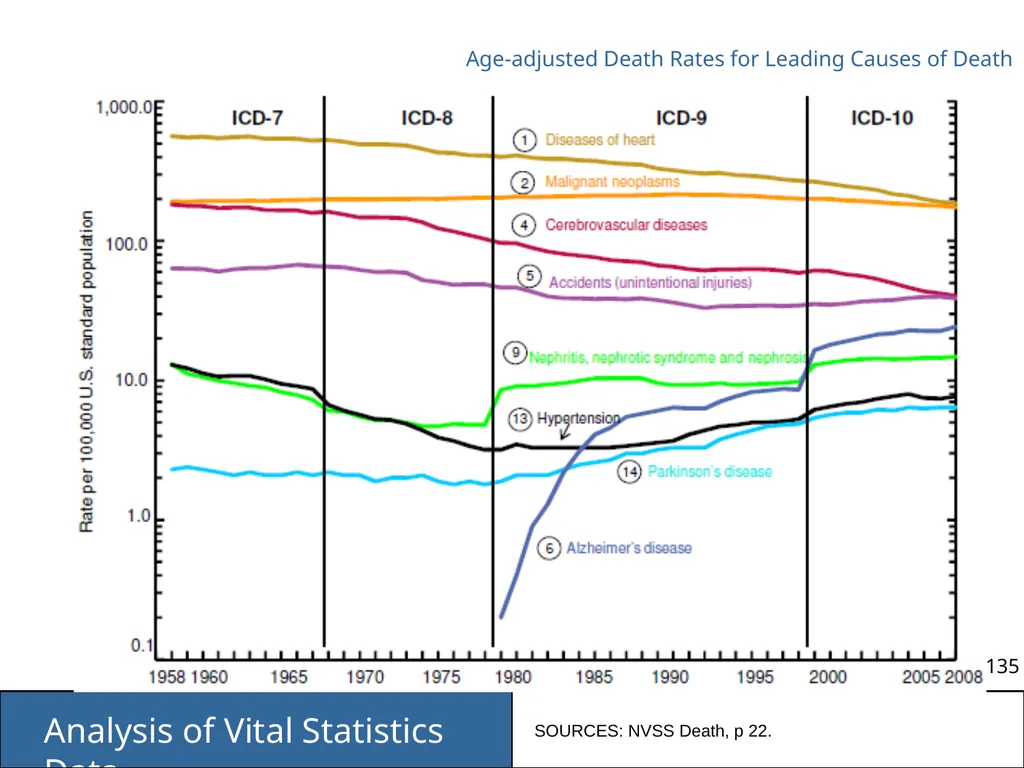
Age-adjusted Death Rates for Leading Causes of Death SOURCES: NVSS Death, p 22.<br>
136
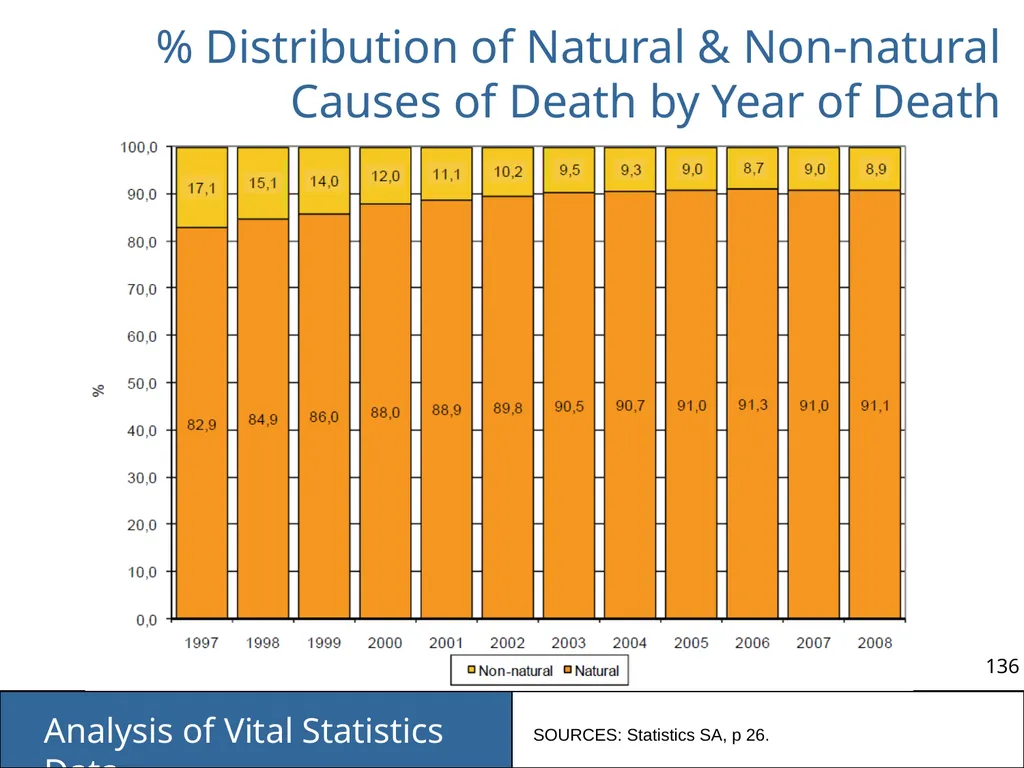
% Distribution of Natural & Non-natural
Causes of Death by Year of Death SOURCES: Statistics SA, p 26.<br>
137
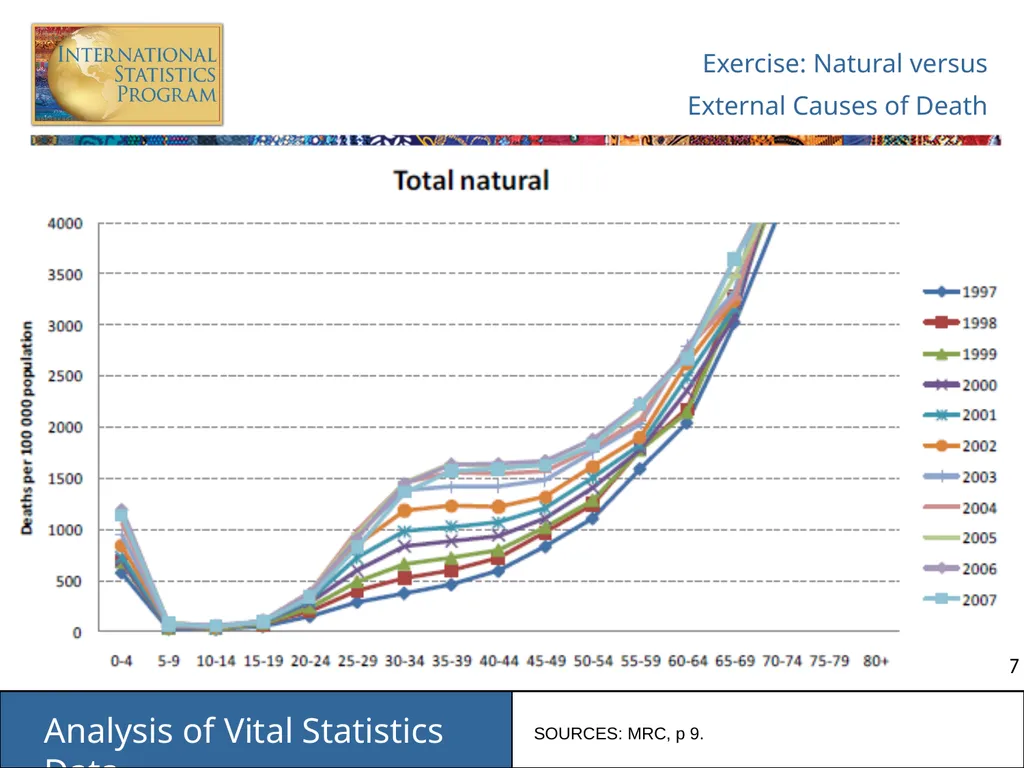
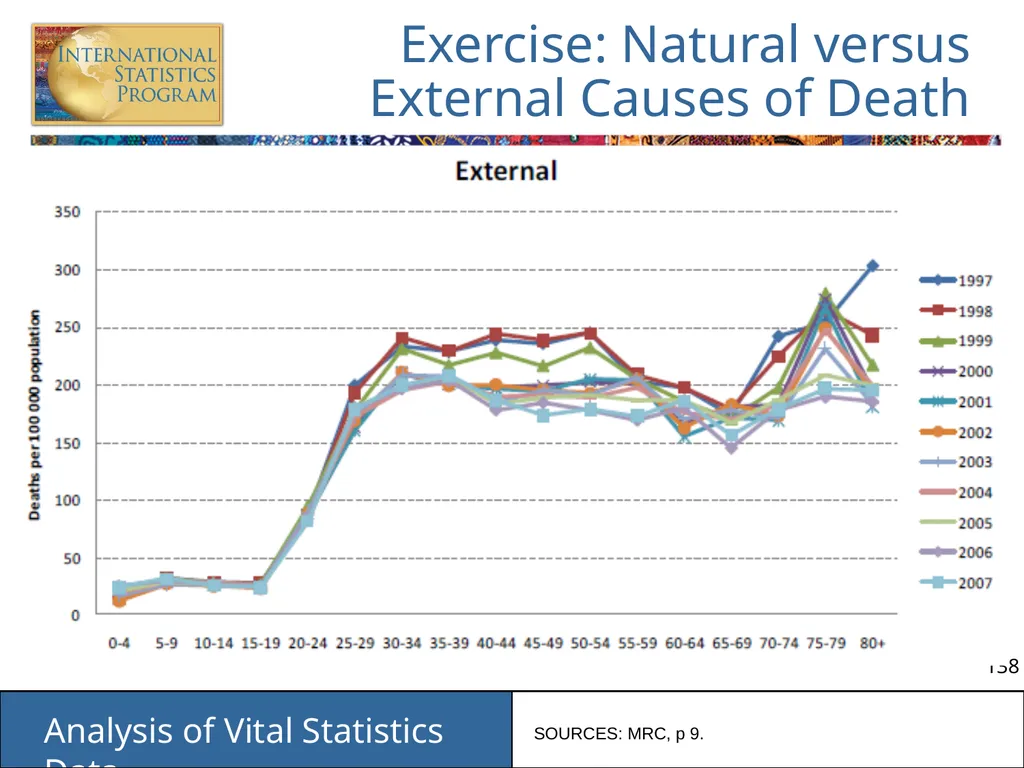
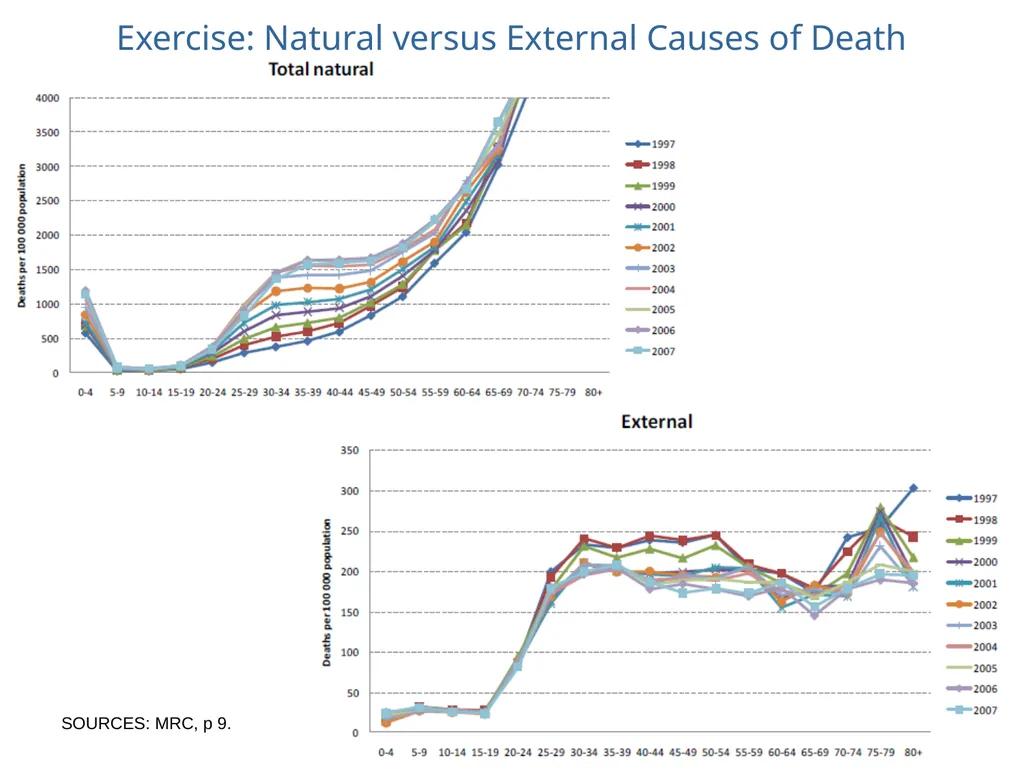
Exercise: Natural versus
External Causes of Death SOURCES: MRC, p 9.<br>
138
SOURCES: MRC, p 9. Exercise: Natural versus
External Causes of Death<br>
139
Exercise: Natural versus External Causes of Death SOURCES: MRC, p 9.<br>
140
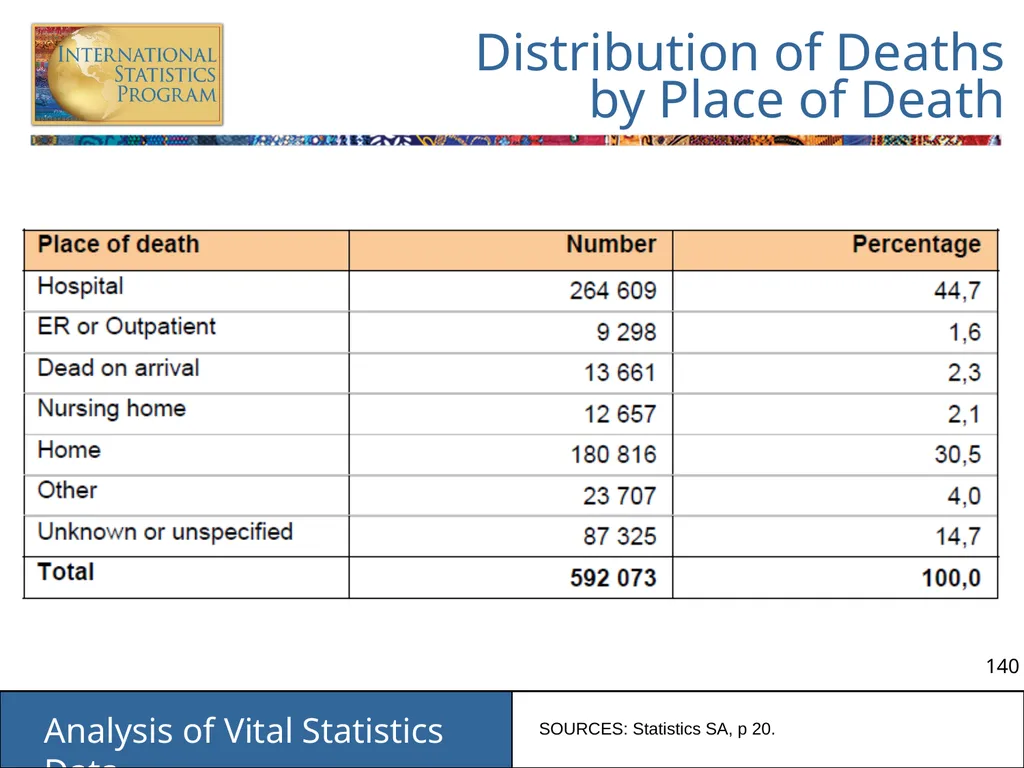
Distribution of Deaths
by Place of Death SOURCES: Statistics SA, p 20.<br>
141
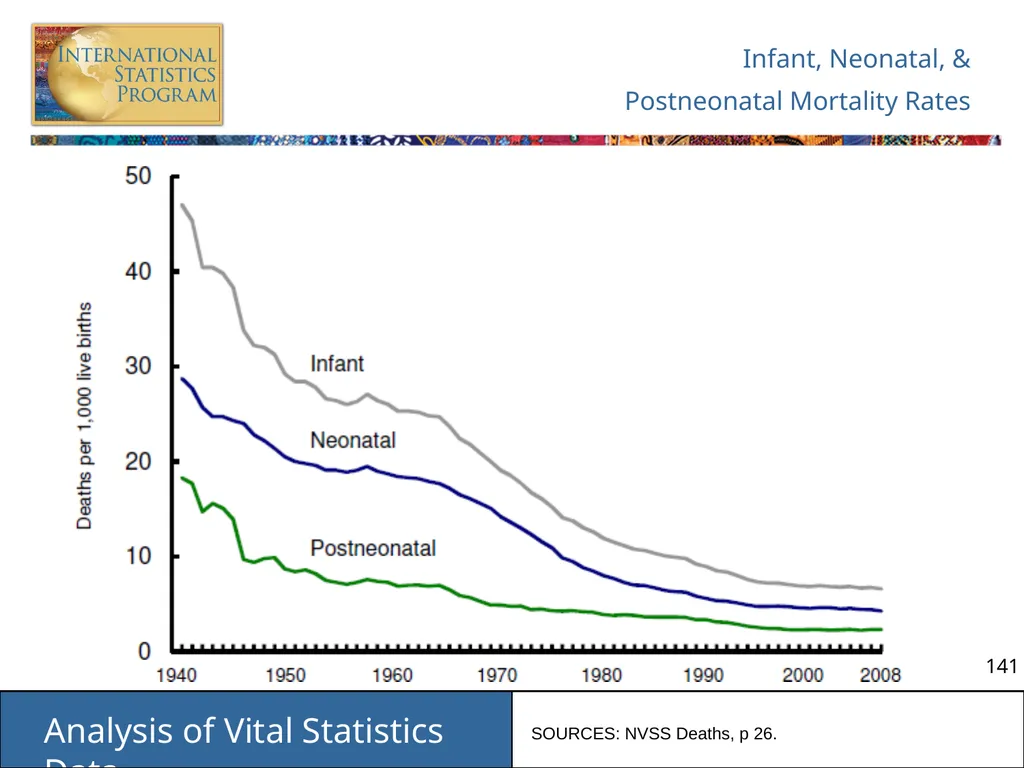
Infant, Neonatal, &
Postneonatal Mortality Rates SOURCES: NVSS Deaths, p 26.<br>
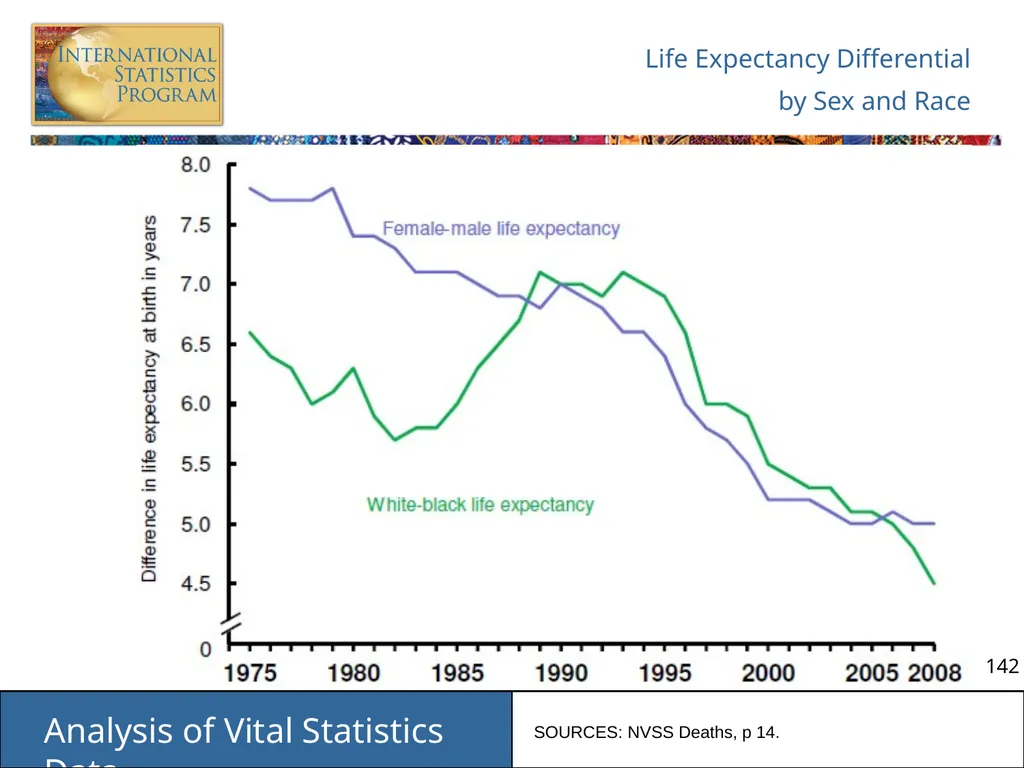
142
Life Expectancy Differential
by Sex and Race SOURCES: NVSS Deaths, p 14.<br>
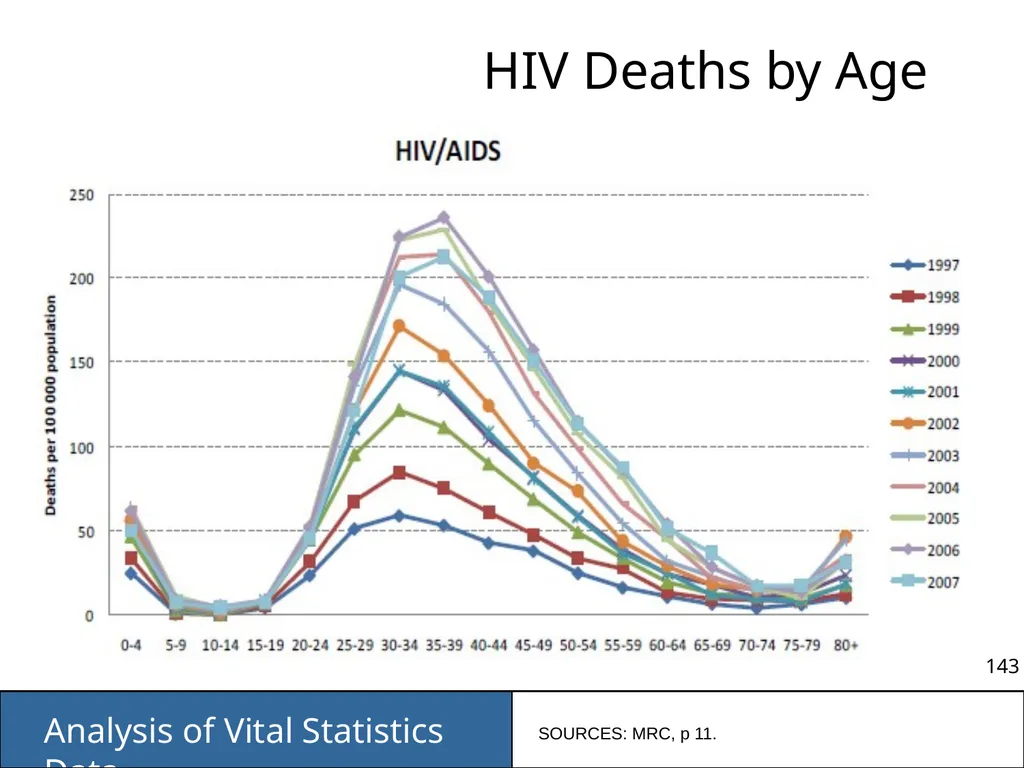
143
HIV Deaths by Age SOURCES: MRC, p 11.<br>
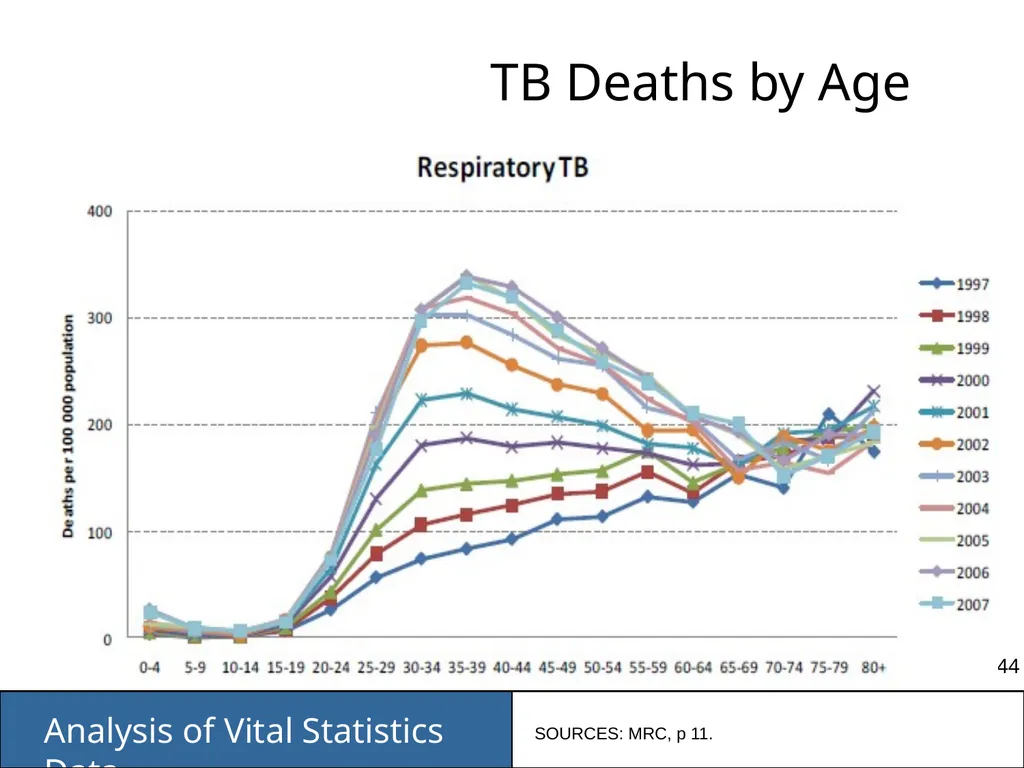
144
TB Deaths by Age SOURCES: MRC, p 11.<br>
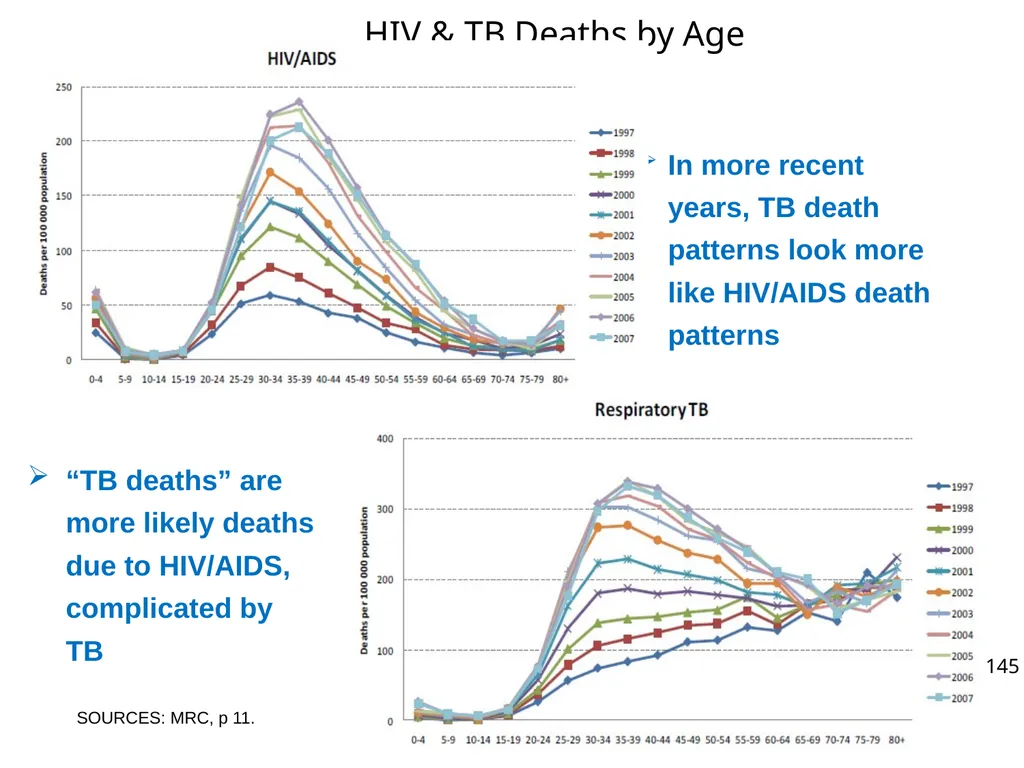
145
HIV & TB Deaths by Age SOURCES: MRC, p 11.<br>
146
Natural Deaths Due to Ill-defined Causes SOURCES: MRC, p 7.<br>
147
Analysis Points to Remember Always specify rate/ratio denominator (e.g. live births)
Analysis of population subgroups must consider size of subgroup
Use broader groups
Disease classification
Age categories
Aggregate data over a longer period of time SOURCES: WHO ICD-10, Volume 2, Chapter 5.<br>
Analysis of population subgroups must consider size of subgroup
Use broader groups
Disease classification
Age categories
Aggregate data over a longer period of time SOURCES: WHO ICD-10, Volume 2, Chapter 5.<br>
148
Analysis Points to Remember Small area analysis
Produce and use statistics in areas with good coverage
Data more accurate than survey data
Data used to show usefulness to government<br>
Produce and use statistics in areas with good coverage
Data more accurate than survey data
Data used to show usefulness to government<br>
149
Discuss What would be reasonable goals for collection and compilation of vital statistics?<br>
150
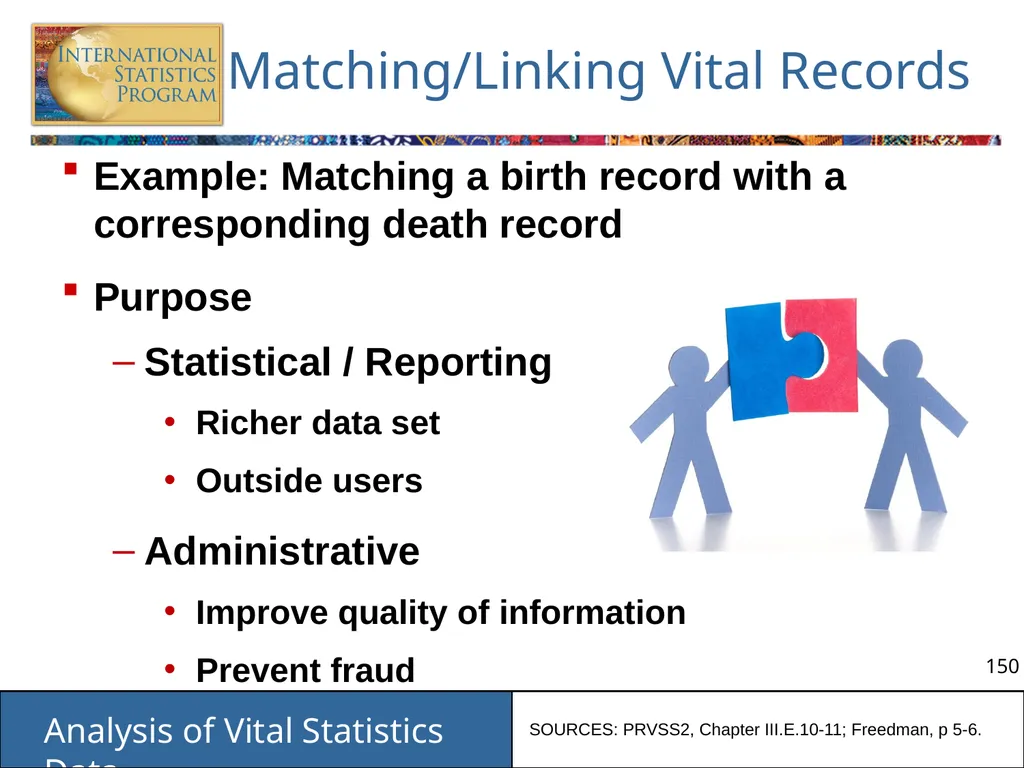
Matching/Linking Vital Records Example: Matching a birth record with a corresponding death record
Purpose
Statistical / Reporting
Richer data set
Outside users
Administrative
Improve quality of information
Prevent fraud SOURCES: PRVSS2, Chapter III.E.10-11; Freedman, p 5-6.<br>
Purpose
Statistical / Reporting
Richer data set
Outside users
Administrative
Improve quality of information
Prevent fraud SOURCES: PRVSS2, Chapter III.E.10-11; Freedman, p 5-6.<br>
151
Discuss What are some non-statistical &
statistical uses of record linkage?<br>
statistical uses of record linkage?<br>
152
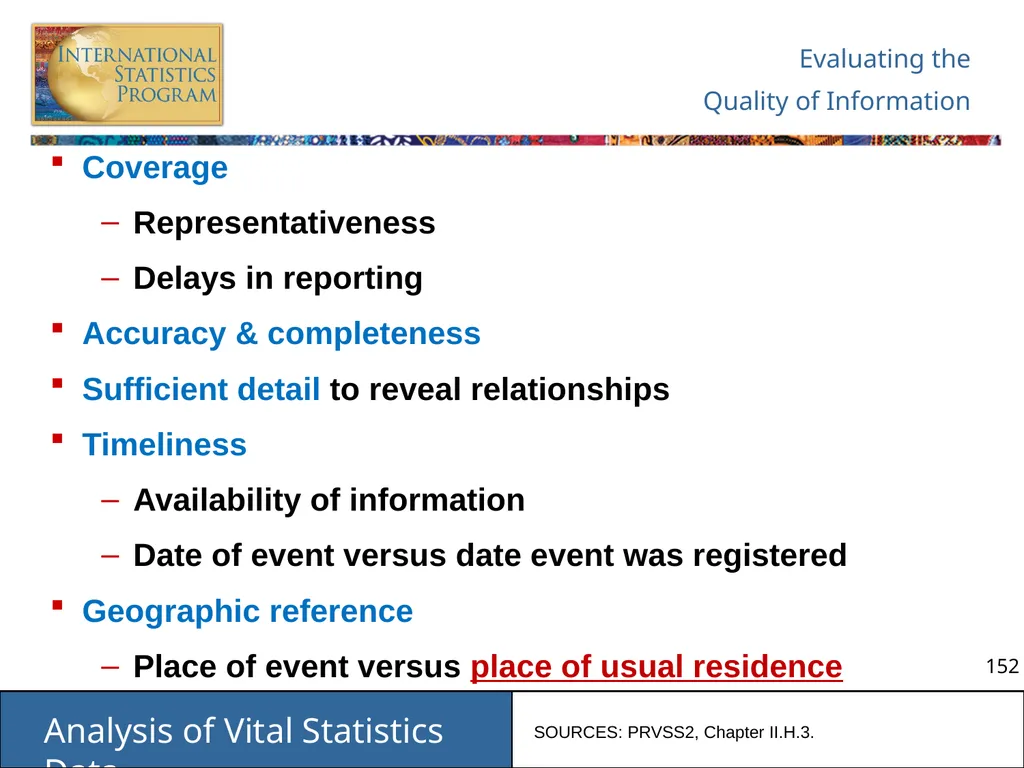
Evaluating the
Quality of Information Coverage
Representativeness
Delays in reporting
Accuracy & completeness
Sufficient detail to reveal relationships
Timeliness
Availability of information
Date of event versus date event was registered
Geographic reference
Place of event versus place of usual residence SOURCES: PRVSS2, Chapter II.H.3.<br>
Representativeness
Delays in reporting
Accuracy & completeness
Sufficient detail to reveal relationships
Timeliness
Availability of information
Date of event versus date event was registered
Geographic reference
Place of event versus place of usual residence SOURCES: PRVSS2, Chapter II.H.3.<br>
153
Discuss What leads to late registration?
What can be done to eliminate late registration?<br>
What can be done to eliminate late registration?<br>
154
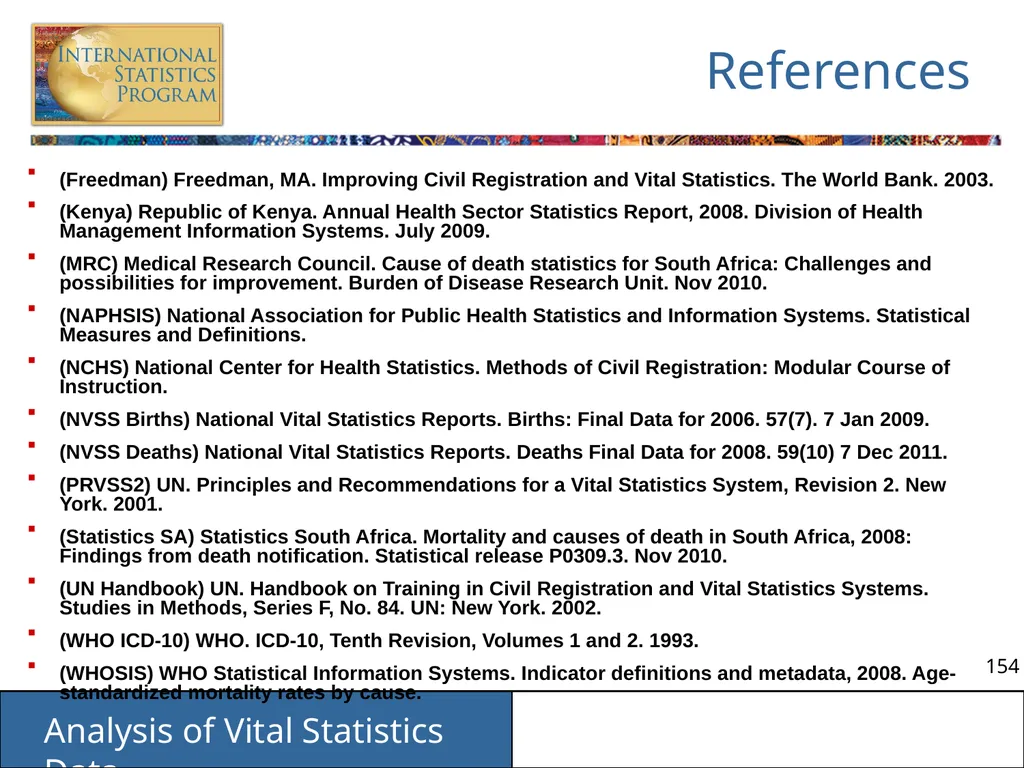
References (Freedman) Freedman, MA. Improving Civil Registration and Vital Statistics. The World Bank. 2003.
(Kenya) Republic of Kenya. Annual Health Sector Statistics Report, 2008. Division of Health Management Information Systems. July 2009.
(MRC) Medical Research Council. Cause of death statistics for South Africa: Challenges and possibilities for improvement. Burden of Disease Research Unit. Nov 2010.
(NAPHSIS) National Association for Public Health Statistics and Information Systems. Statistical Measures and Definitions.
(NCHS) National Center for Health Statistics. Methods of Civil Registration: Modular Course of Instruction.
(NVSS Births) National Vital Statistics Reports. Births: Final Data for 2006. 57(7). 7 Jan 2009.
(NVSS Deaths) National Vital Statistics Reports. Deaths Final Data for 2008. 59(10) 7 Dec 2011.
(PRVSS2) UN. Principles and Recommendations for a Vital Statistics System, Revision 2. New York. 2001.
(Statistics SA) Statistics South Africa. Mortality and causes of death in South Africa, 2008: Findings from death notification. Statistical release P0309.3. Nov 2010.
(UN Handbook) UN. Handbook on Training in Civil Registration and Vital Statistics Systems. Studies in Methods, Series F, No. 84. UN: New York. 2002.
(WHO ICD-10) WHO. ICD-10, Tenth Revision, Volumes 1 and 2. 1993.
(WHOSIS) WHO Statistical Information Systems. Indicator definitions and metadata, 2008. Age-standardized mortality rates by cause.<br>
(Kenya) Republic of Kenya. Annual Health Sector Statistics Report, 2008. Division of Health Management Information Systems. July 2009.
(MRC) Medical Research Council. Cause of death statistics for South Africa: Challenges and possibilities for improvement. Burden of Disease Research Unit. Nov 2010.
(NAPHSIS) National Association for Public Health Statistics and Information Systems. Statistical Measures and Definitions.
(NCHS) National Center for Health Statistics. Methods of Civil Registration: Modular Course of Instruction.
(NVSS Births) National Vital Statistics Reports. Births: Final Data for 2006. 57(7). 7 Jan 2009.
(NVSS Deaths) National Vital Statistics Reports. Deaths Final Data for 2008. 59(10) 7 Dec 2011.
(PRVSS2) UN. Principles and Recommendations for a Vital Statistics System, Revision 2. New York. 2001.
(Statistics SA) Statistics South Africa. Mortality and causes of death in South Africa, 2008: Findings from death notification. Statistical release P0309.3. Nov 2010.
(UN Handbook) UN. Handbook on Training in Civil Registration and Vital Statistics Systems. Studies in Methods, Series F, No. 84. UN: New York. 2002.
(WHO ICD-10) WHO. ICD-10, Tenth Revision, Volumes 1 and 2. 1993.
(WHOSIS) WHO Statistical Information Systems. Indicator definitions and metadata, 2008. Age-standardized mortality rates by cause.<br>
155
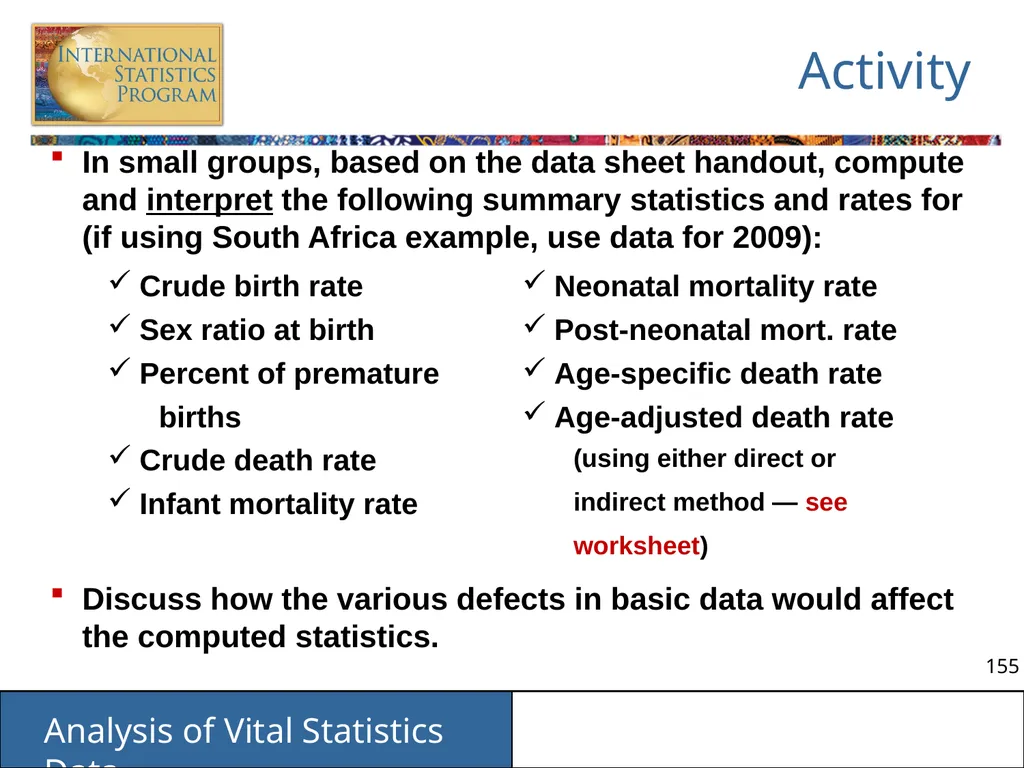
Activity In small groups, based on the data sheet handout, compute and interpret the following summary statistics and rates for (if using South Africa example, use data for 2009):
Discuss how the various defects in basic data would affect the computed statistics.<br>
Discuss how the various defects in basic data would affect the computed statistics.<br>
156
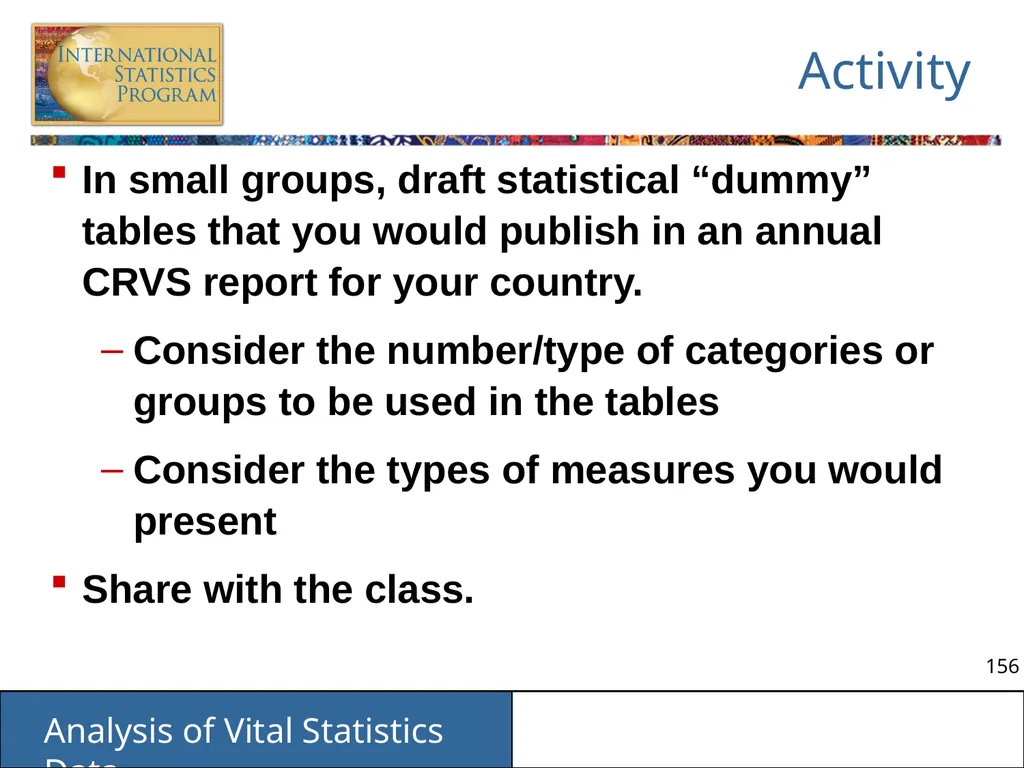
Activity In small groups, draft statistical “dummy” tables that you would publish in an annual CRVS report for your country.
Consider the number/type of categories or groups to be used in the tables
Consider the types of measures you would present
Share with the class.<br>
Consider the number/type of categories or groups to be used in the tables
Consider the types of measures you would present
Share with the class.<br>
157
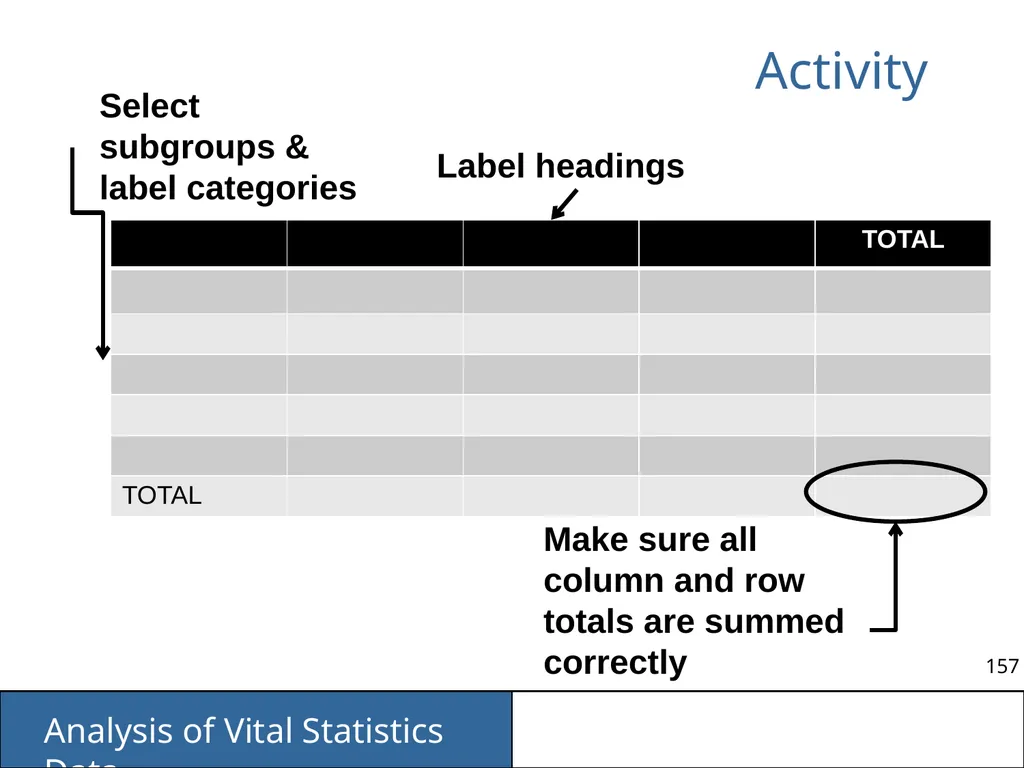
Activity Label headings Select subgroups & label categories Make sure all column and row totals are summed correctly<br>
158
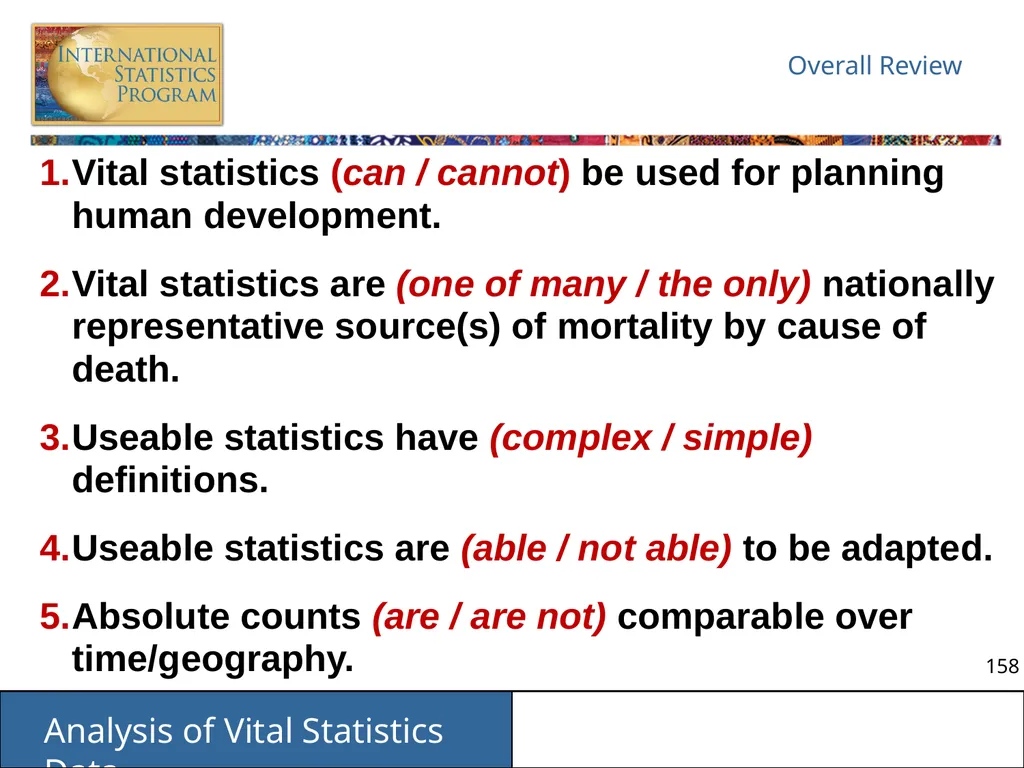
Overall Review Vital statistics (can / cannot) be used for planning human development.
Vital statistics are (one of many / the only) nationally representative source(s) of mortality by cause of death.
Useable statistics have (complex / simple) definitions.
Useable statistics are (able / not able) to be adapted.
Absolute counts (are / are not) comparable over time/geography.<br>
Vital statistics are (one of many / the only) nationally representative source(s) of mortality by cause of death.
Useable statistics have (complex / simple) definitions.
Useable statistics are (able / not able) to be adapted.
Absolute counts (are / are not) comparable over time/geography.<br>
159
Overall Review (Absolute / Relative) numbers must have denominator information.
In a ratio, the numerator (does / does not) have to be part of denominator.
Final tabulations should be calculated by date of (occurrence / registration) of the event.
Final tabulations should be calculated by place of (usual residence / occurrence of event).
Small area analysis data are (less / more) accurate than survey data.<br>
In a ratio, the numerator (does / does not) have to be part of denominator.
Final tabulations should be calculated by date of (occurrence / registration) of the event.
Final tabulations should be calculated by place of (usual residence / occurrence of event).
Small area analysis data are (less / more) accurate than survey data.<br>