Analyzing and Structuring Financially Sustainable Investments The World Bank Basic Requirements for Financially Sustainable WSS Investments Foundation for a Sustainable Utility Cost Recovery Improved Management Break Through Financing
Related Topics
Download this presentation From Below
"Analyzing and Structuring Financially Sustainable" is the property of its rightful owner. Permission is granted to
download and print the materials on this website for personal, non-commercial use only, and to display it
on your personal computer provided you do not modify the materials and that you retain all copyright
notices contained in the materials. By downloading content from our website, you accept the terms of this
agreement.
Share
Embed code
Presentation Transcript
01
Analyzing and Structuring Financially Sustainable Investments The World Bank<br>
02
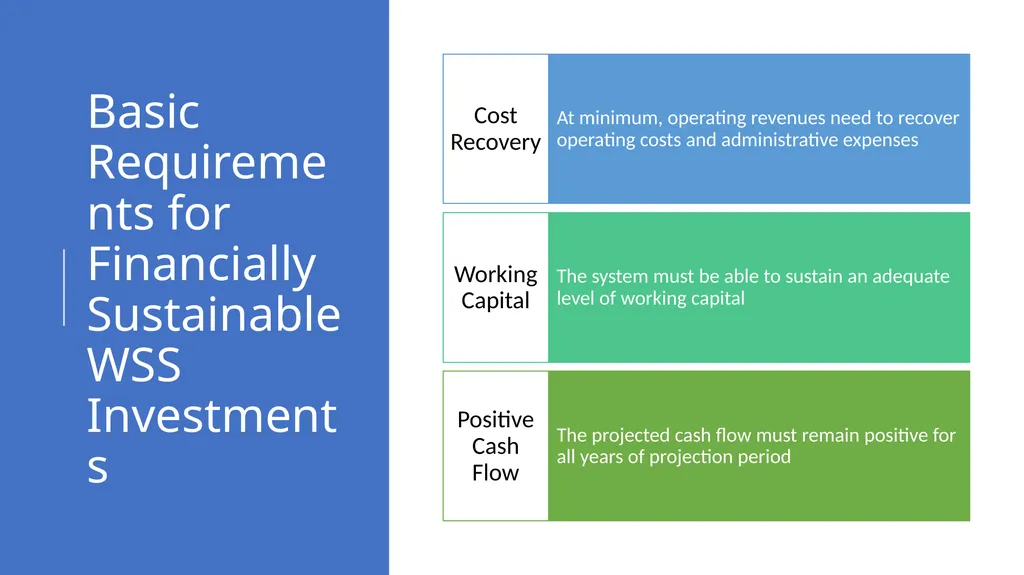
Basic Requirements for Financially Sustainable WSS Investments<br>
03
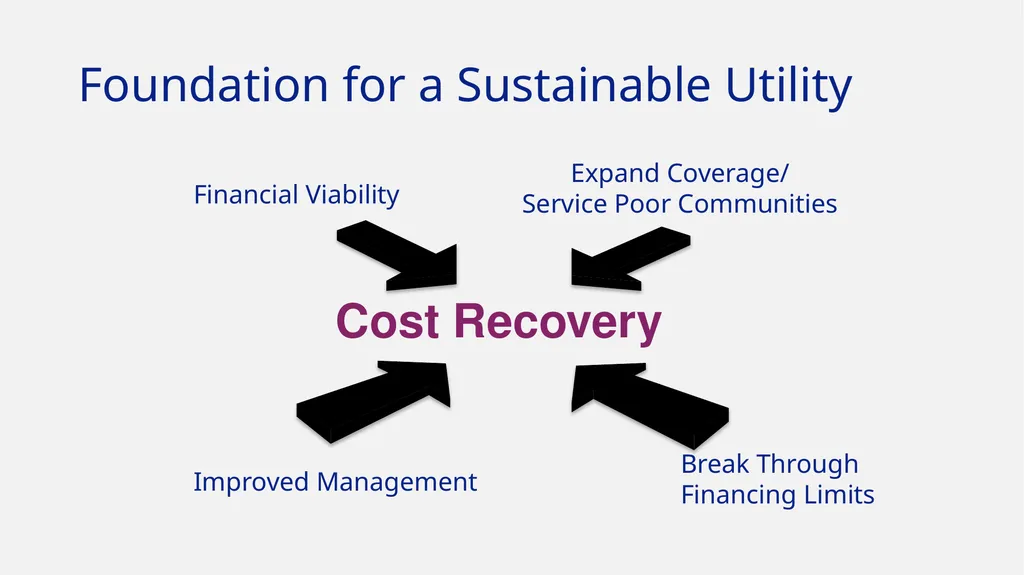
Foundation for a Sustainable Utility Cost Recovery Improved Management Break Through
Financing Limits Financial Viability Expand Coverage/
Service Poor Communities<br>
04
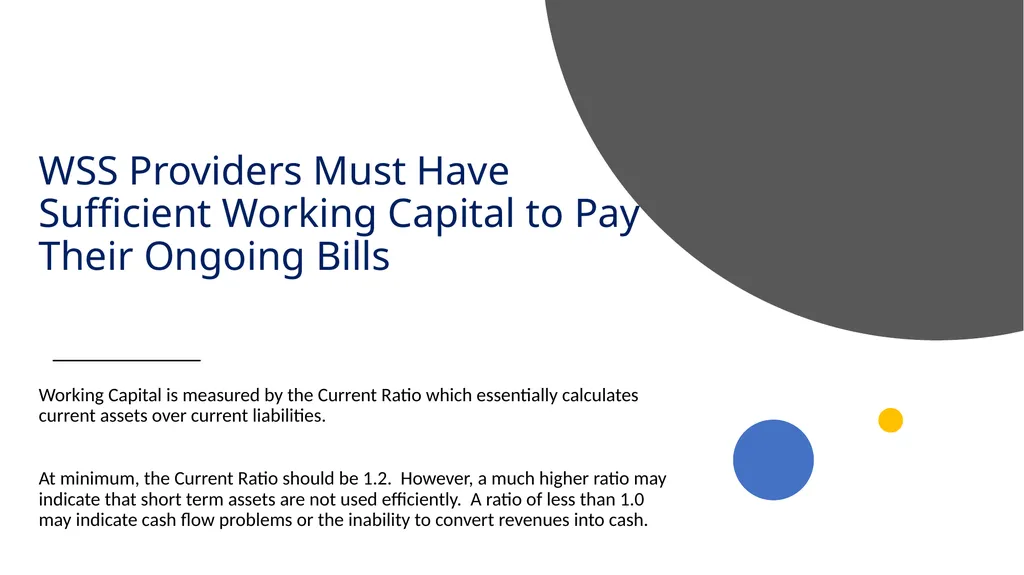
WSS Providers Must Have Sufficient Working Capital to Pay Their Ongoing Bills Working Capital is measured by the Current Ratio which essentially calculates current assets over current liabilities.
At minimum, the Current Ratio should be 1.2. However, a much higher ratio may indicate that short term assets are not used efficiently. A ratio of less than 1.0 may indicate cash flow problems or the inability to convert revenues into cash.<br>
05
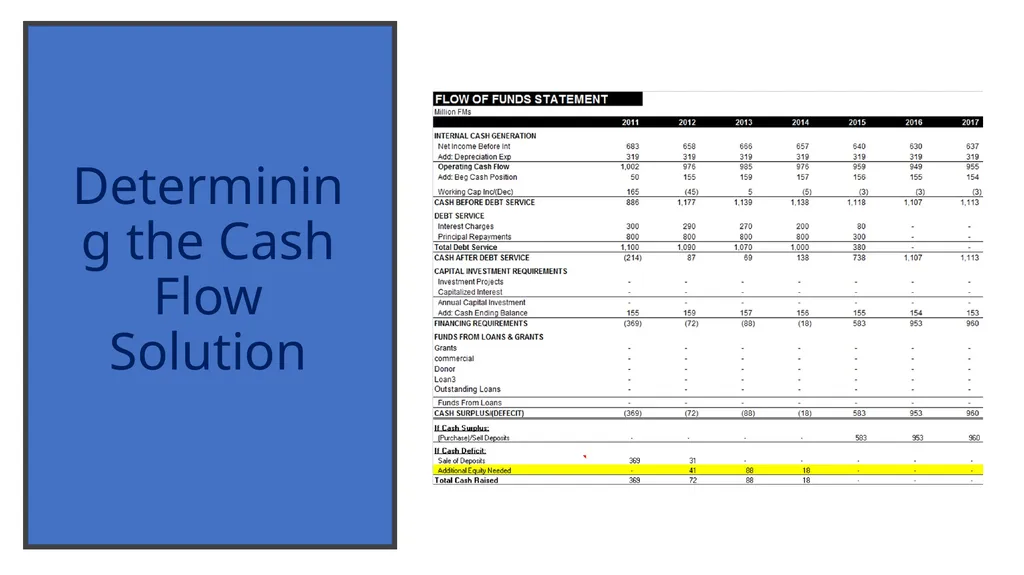
Determining the Cash Flow Solution<br>
06
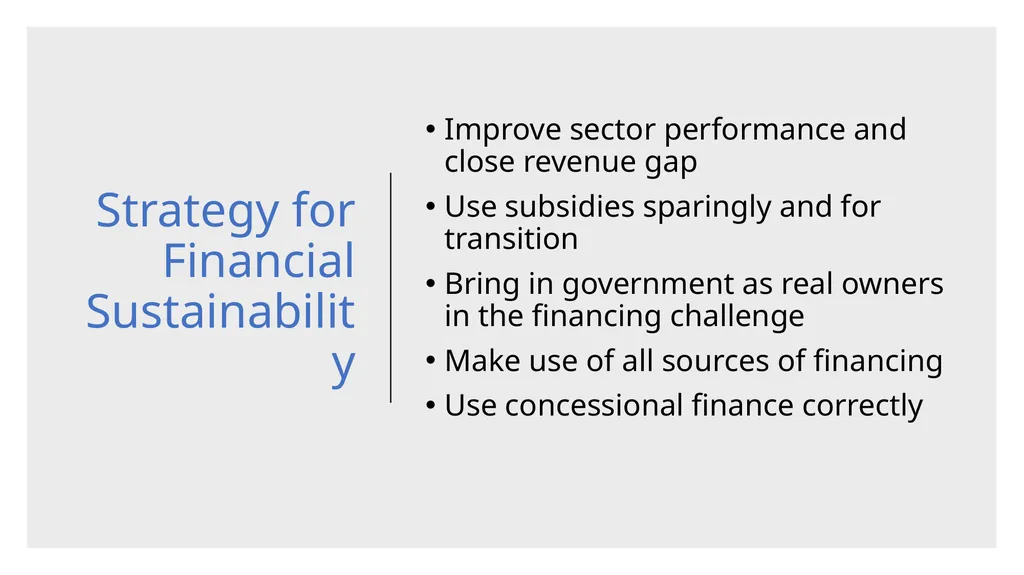
Strategy for Financial Sustainability Improve sector performance and close revenue gap
Use subsidies sparingly and for transition
Bring in government as real owners in the financing challenge
Make use of all sources of financing
Use concessional finance correctly<br>
07
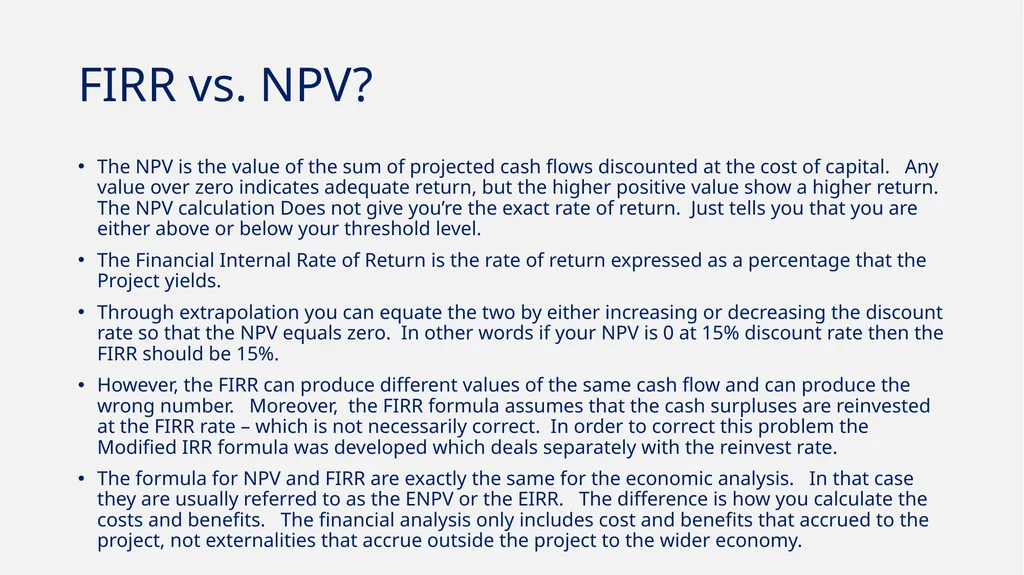
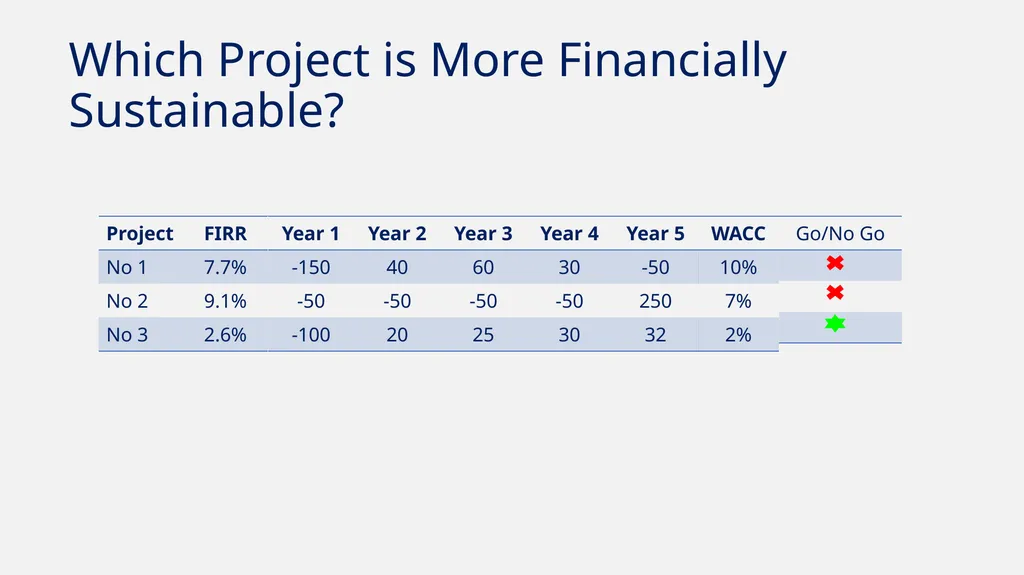
FIRR vs. NPV? The NPV is the value of the sum of projected cash flows discounted at the cost of capital. Any value over zero indicates adequate return, but the higher positive value show a higher return. The NPV calculation Does not give you’re the exact rate of return. Just tells you that you are either above or below your threshold level.
The Financial Internal Rate of Return is the rate of return expressed as a percentage that the Project yields.
Through extrapolation you can equate the two by either increasing or decreasing the discount rate so that the NPV equals zero. In other words if your NPV is 0 at 15% discount rate then the FIRR should be 15%.
However, the FIRR can produce different values of the same cash flow and can produce the wrong number. Moreover, the FIRR formula assumes that the cash surpluses are reinvested at the FIRR rate – which is not necessarily correct. In order to correct this problem the Modified IRR formula was developed which deals separately with the reinvest rate.
The formula for NPV and FIRR are exactly the same for the economic analysis. In that case they are usually referred to as the ENPV or the EIRR. The difference is how you calculate the costs and benefits. The financial analysis only includes cost and benefits that accrued to the project, not externalities that accrue outside the project to the wider economy.<br>
08
Which Project is More Financially Sustainable?<br>
09
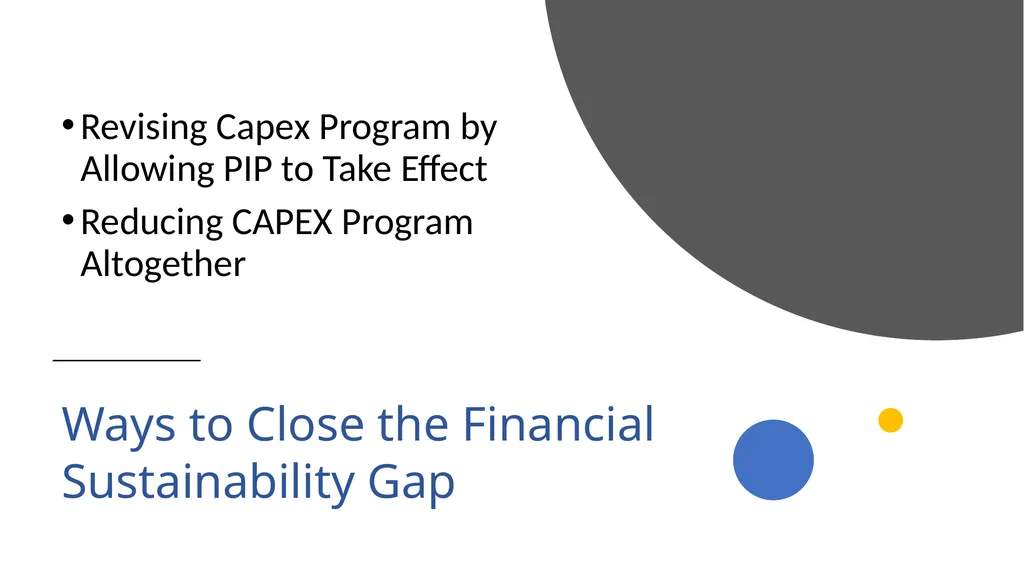
Ways to Close the Financial Sustainability Gap Revising Capex Program by Allowing PIP to Take Effect
Reducing CAPEX Program Altogether<br>
10
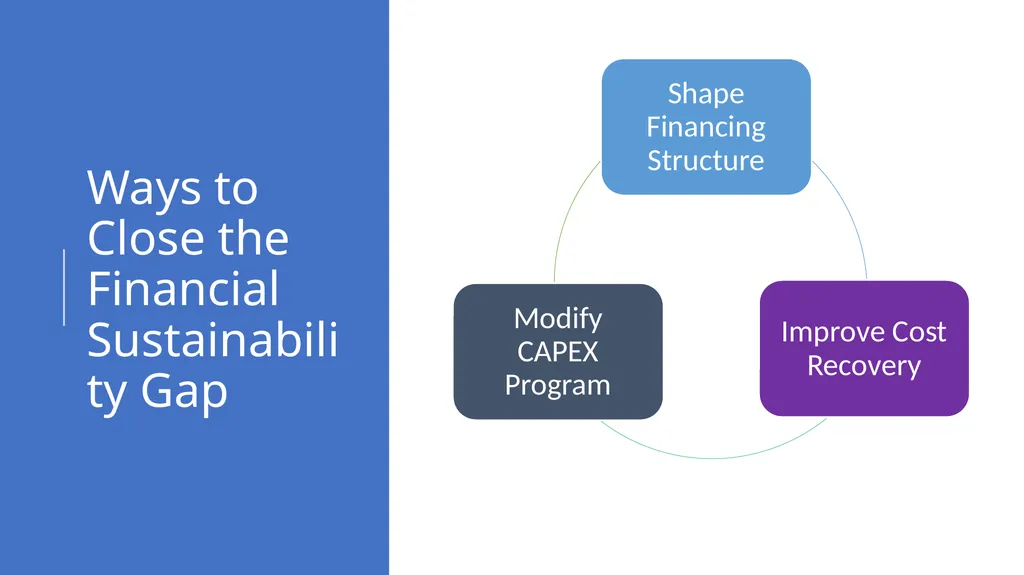
Ways to Close the Financial Sustainability Gap<br>
11
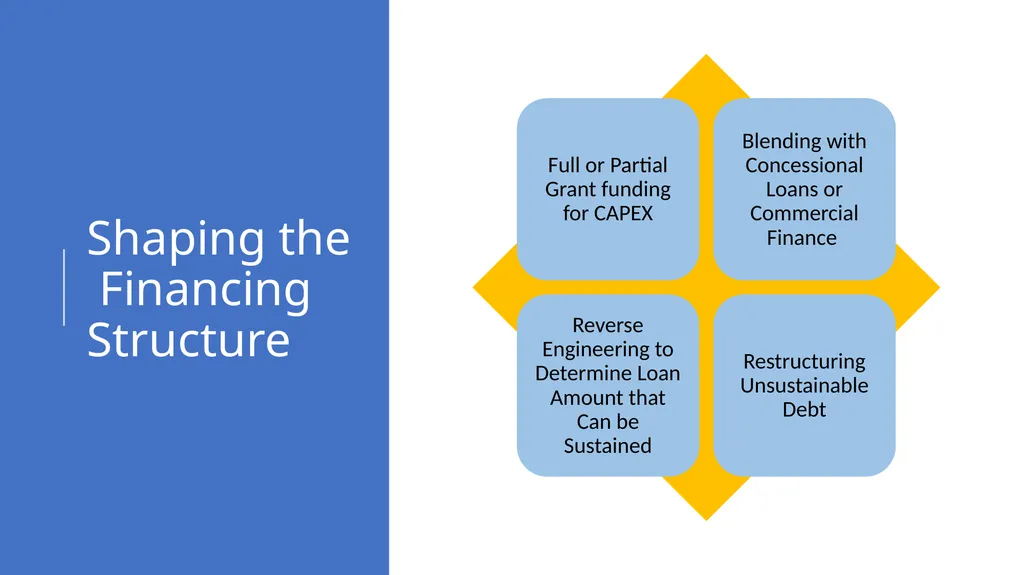
Shaping the Financing Structure<br>
12
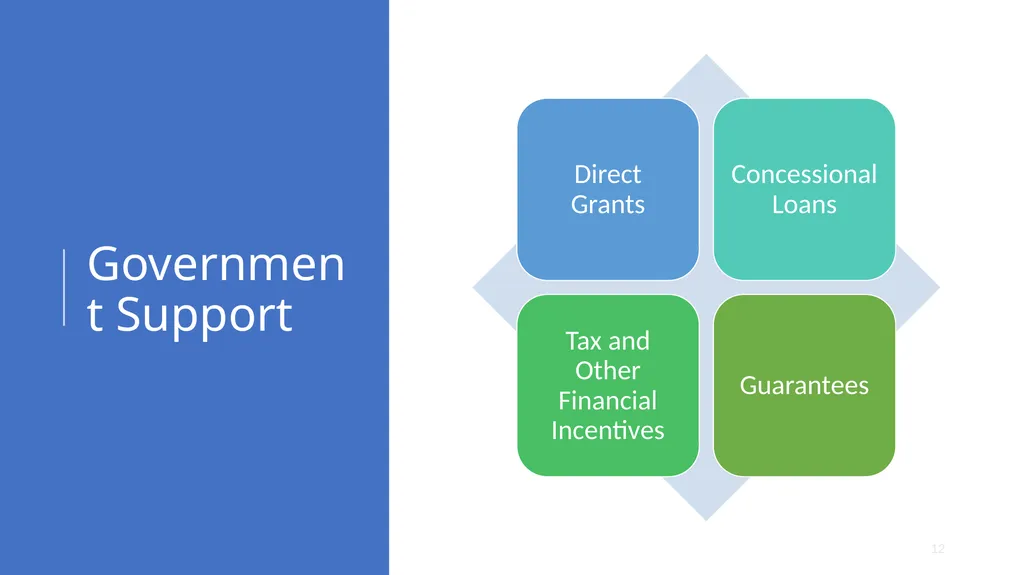
Government Support 12<br>
13
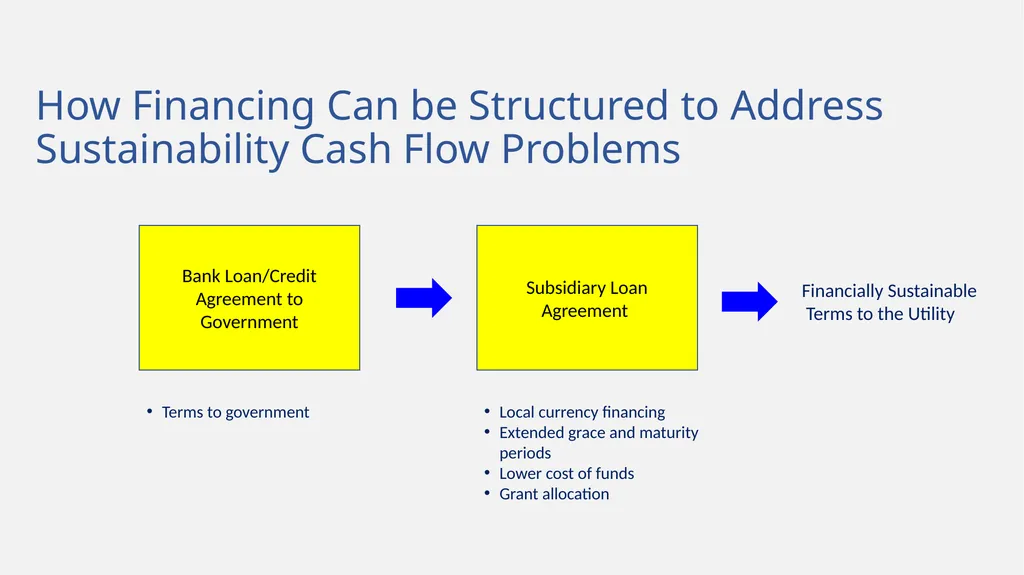
How Financing Can be Structured to Address Sustainability Cash Flow Problems Subsidiary Loan Agreement Bank Loan/Credit Agreement to Government Financially Sustainable
Terms to the Utility Local currency financing
Extended grace and maturity periods
Lower cost of funds
Grant allocation Terms to government<br>
14
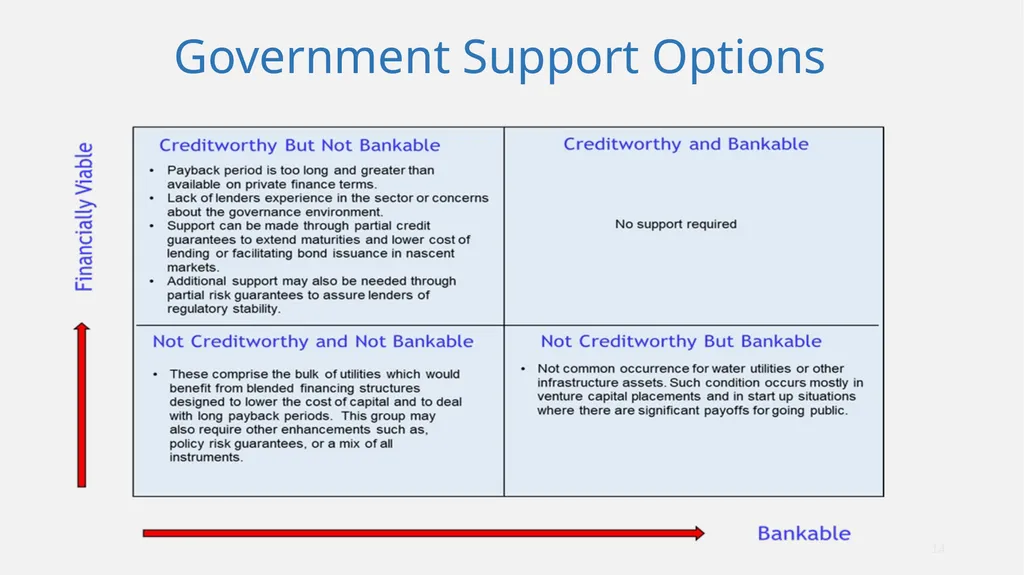
Government Support Options 14<br>
15
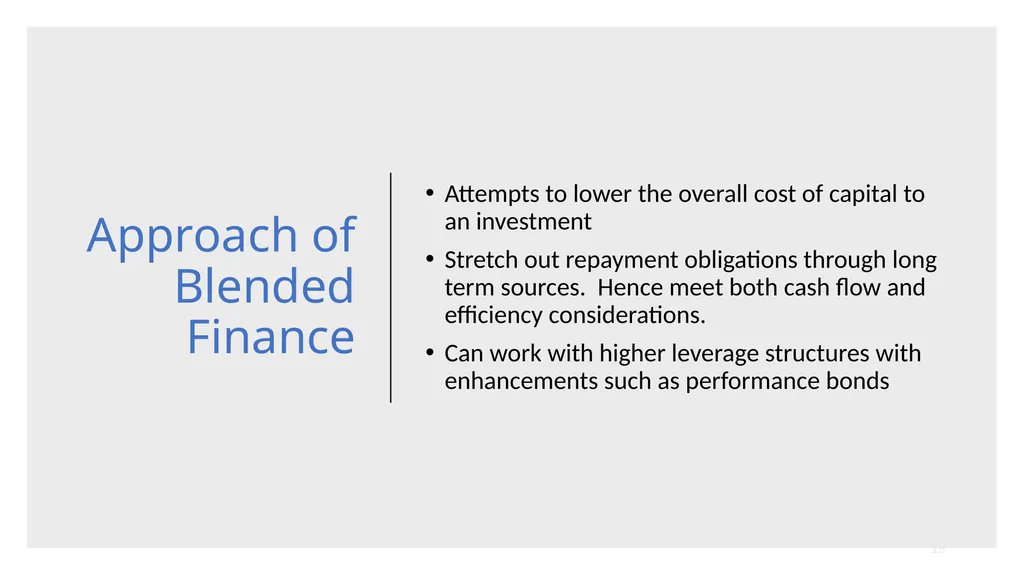
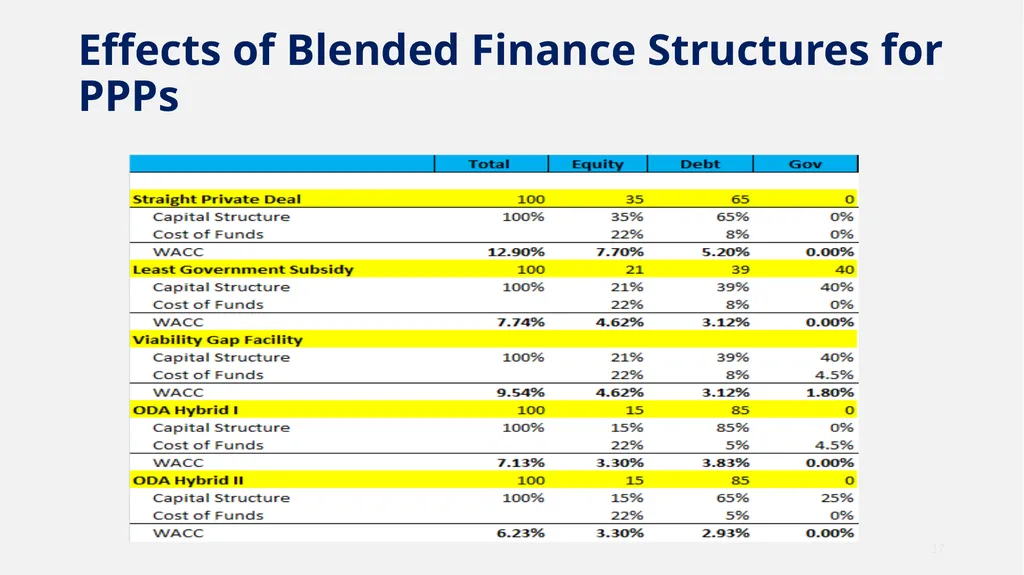
Approach of Blended Finance Attempts to lower the overall cost of capital to an investment
Stretch out repayment obligations through long term sources. Hence meet both cash flow and efficiency considerations.
Can work with higher leverage structures with enhancements such as performance bonds 15<br>
16
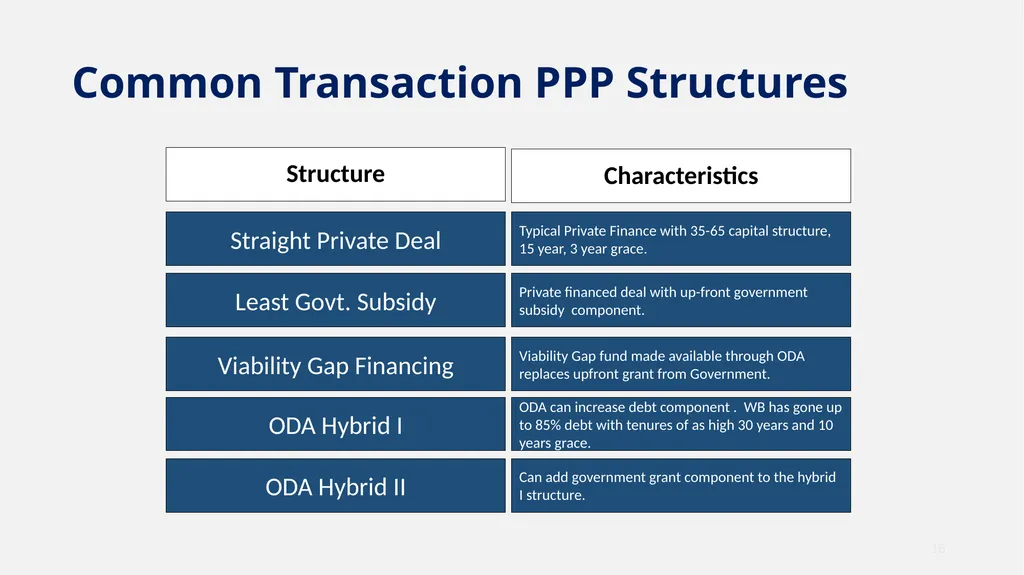
Common Transaction PPP Structures Characteristics 16 Straight Private Deal Least Govt. Subsidy Viability Gap Financing ODA Hybrid I ODA Hybrid II Typical Private Finance with 35-65 capital structure, 15 year, 3 year grace. Private financed deal with up-front government subsidy component. Viability Gap fund made available through ODA replaces upfront grant from Government. ODA can increase debt component . WB has gone up to 85% debt with tenures of as high 30 years and 10 years grace. Can add government grant component to the hybrid I structure. Structure<br>
17
Effects of Blended Finance Structures for PPPs 17<br>
18
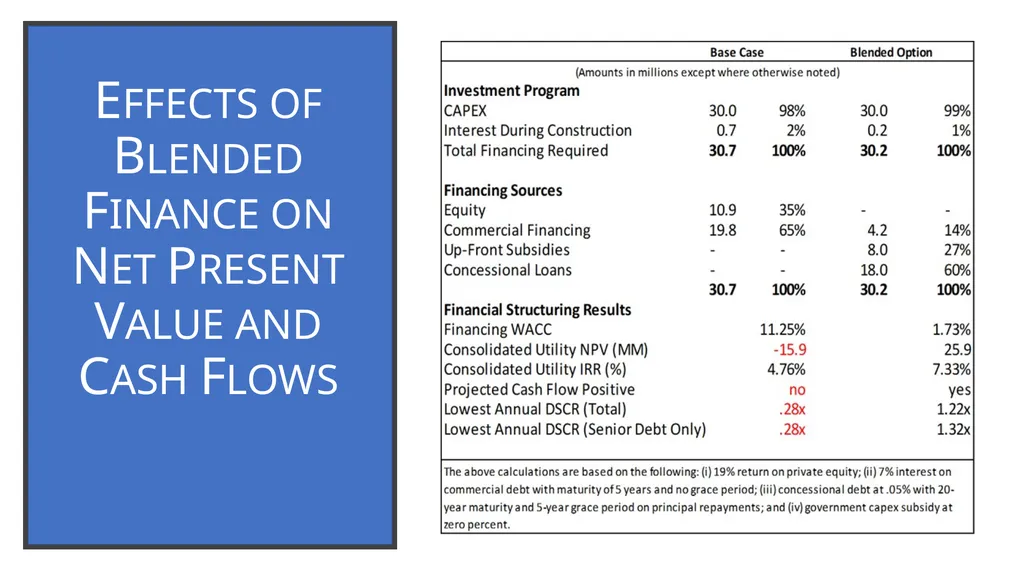
Effects of Blended Finance on Net Present Value and Cash Flows<br>
19
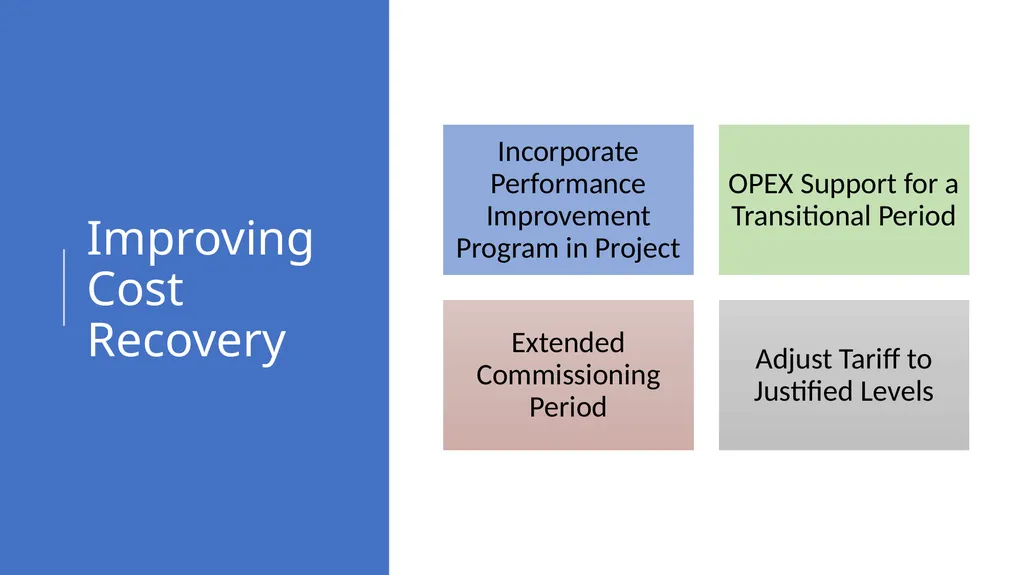
Improving Cost Recovery<br>
20
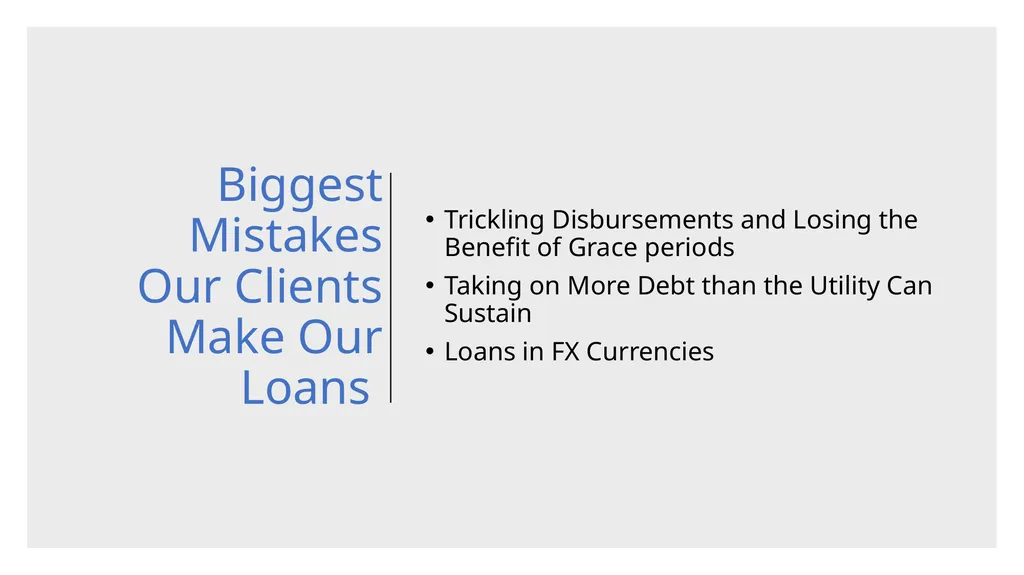
Biggest Mistakes Our Clients Make Our Loans Trickling Disbursements and Losing the Benefit of Grace periods
Taking on More Debt than the Utility Can Sustain
Loans in FX Currencies<br>