
Analyzing Critical Minerals Value Chains using the


Description: Analyzing Critical Minerals Value Chains using the GTAP MRIO Data Base Maksym Chepeliev Center for Global Trade Analysis, Purdue University 30th International Input-Output Association Conference July 1-5, 2024 Santiago, Chile Motivation
Related Topics
Download Presentation
"Analyzing Critical Minerals Value Chains using the" is the property of its rightful owner. Permission is granted to download and print the materials on this website for personal, non-commercial use only, and to display it on your personal computer provided you do not modify the materials and that you retain all copyright notices contained in the materials. By downloading content from our website, you accept the terms of this agreement.
Presentation Transcript
slide1. Analyzing Critical Minerals Value Chains using the GTAP MRIO Data Base Maksym Chepeliev
Center for Global Trade Analysis, Purdue University
30th International Input-Output Association Conference
July 1-5, 2024
Santiago, Chile<br>
slide2. Motivation
GTAP Data Base v11
GTAP circular economy database
3. Incorporating critical minerals and downstream sectors
4. Sample application: demand for minerals under mitigation scenarios
5. Conclusions and next steps Outline 2<br>
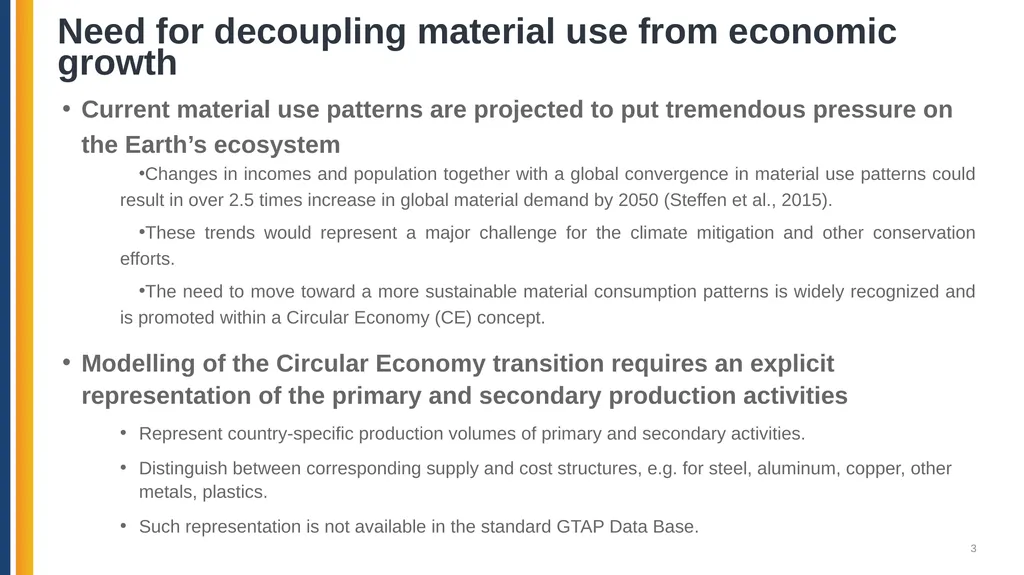
slide3. Current material use patterns are projected to put tremendous pressure on the Earth’s ecosystem
Changes in incomes and population together with a global convergence in material use patterns could result in over 2.5 times increase in global material demand by 2050 (Steffen et al., 2015).
These trends would represent a major challenge for the climate mitigation and other conservation efforts.
The need to move toward a more sustainable material consumption patterns is widely recognized and is promoted within a Circular Economy (CE) concept.
Modelling of the Circular Economy transition requires an explicit representation of the primary and secondary production activities
Represent country-specific production volumes of primary and secondary activities.
Distinguish between corresponding supply and cost structures, e.g. for steel, aluminum, copper, other metals, plastics.
Such representation is not available in the standard GTAP Data Base. Need for decoupling material use from economic growth 3<br>
slide4. A number of studies have represented the Circular Economy splits within the global CGE or IO modeling framework
MRIO assessments based on the EXIOBASE (e.g. Tisserant et al., 2017; Wiebe et al., 2019).
CGE-based assessment focusing on selected sector/commodity (e.g. Winning et al., 2017 for the case of steel).
GTAP-based assessments with a more detailed splits, e.g. OECD (2019), Dellink (2020), Bibas et al. (2021).
Selected limitations of the existing approaches:
Are based on the EXIOBASE cost structures and output values, which do not always correspond to the actual observations (see e.g. Winning et al., 2017).
Focus on selected commodities or specific aggregate regional representations.
Are not consistently updated over time.
Not publicly available. Previous efforts at modeling circularity have a number of limitations 4<br>
slide5. Achieving climate mitigation targets will require an unprecedented expansion in renewable infrastructure and technologies
Such transition will lead to the growing demand for critical minerals, such as nickel, platinum group metals, zinc, rare earths, etc., which are essential inputs for the development of renewable energy systems (Tokimatsu et al., 2018).
It is estimated that within the pathways toward limiting global warming below 1.5oC, the demand for critical minerals could increase between 2 and 267 times by 2050 depending on the mineral (Wang et al., 2022).
Apart from pure supply and logistical constraints, the rising demand for critical minerals is also associated with national security aspects and is prone to generate geopolitical frictions (Vakulchuk et al., 2022).
It is important to have the analytical capacity for the analysis of future energy transition scenarios with an explicit representation of the critical minerals value chains (both upstream and downstream). Representation of the future energy transition requires new sectoral details (both upstream and downstream) 5<br>
slide6. GTAP Data Base v11 6<br>
slide7. Five reference years
2004, 2007, 2011, 2014, 2017
141 countries + 19 aggregate regions
20 new and 39 updated national IOTs have been incorporated
Individual countries cover 99% of the world GDP and 96% of its population
Format consistent with the new standard GTAP model
GAMS containers, and distribution available for classic GTAP Key features of the GTAP 11 7<br>
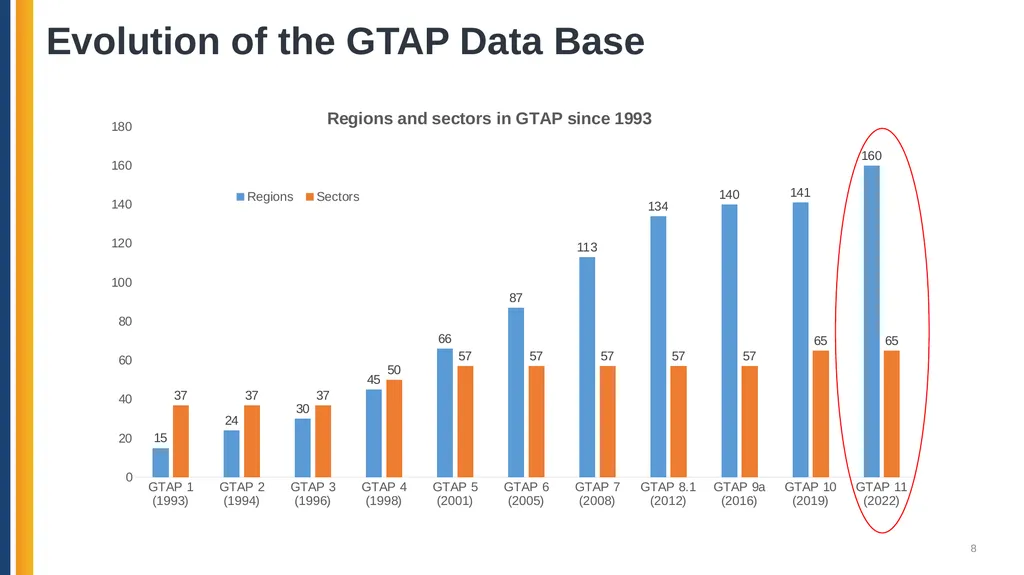
slide8. 8 Evolution of the GTAP Data Base<br>
slide9. GTAP 11: A major expansion of coverage in Africa 9 Afghanistan
Algeria
Central African Republic
Chad
Comoros
The Congo Republic
The Democratic Republic of the Congo
Equatorial Guinea
Eswatini
Gabon
Haiti
Iraq
Lebanon
Mali
Niger
Palestine
Serbia
Sudan
Syria
Uzbekistan.<br>
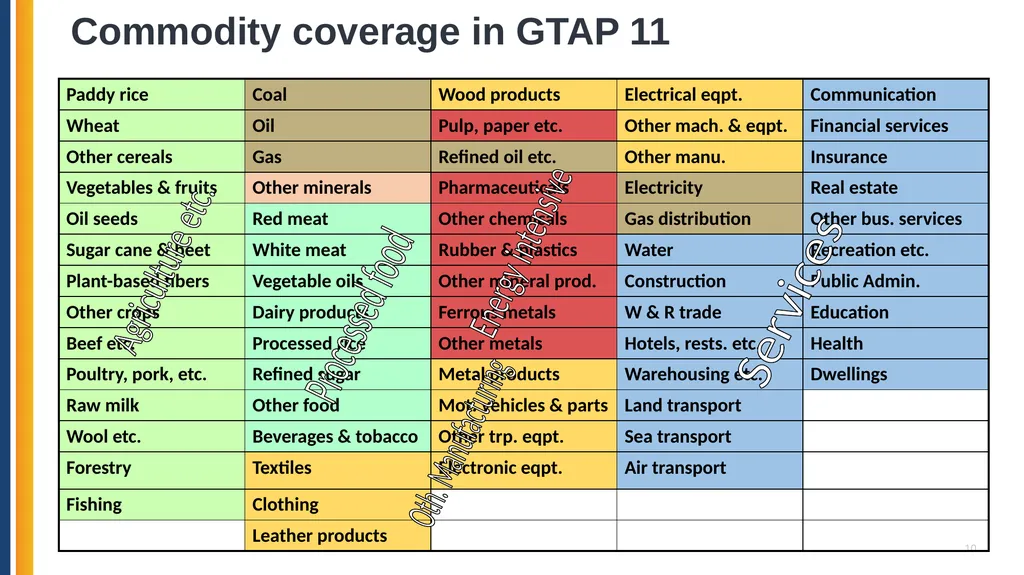
slide10. 10 Agriculture etc. Processed food Energy intensive Oth. Manufacturing Services Commodity coverage in GTAP 11<br>
slide11. GTAP-CE Data Base v11 11<br>
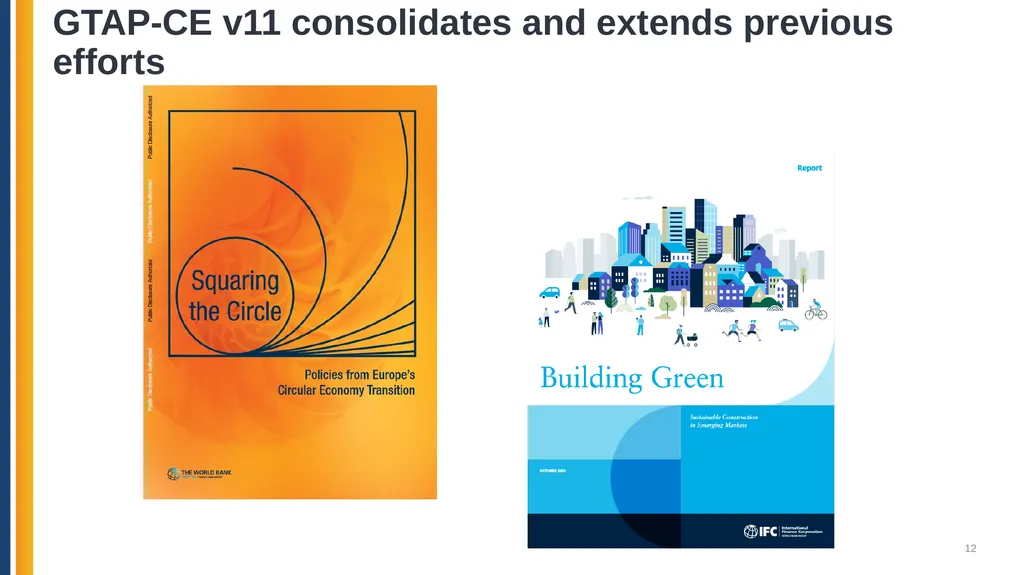
slide12. GTAP-CE v11 consolidates and extends previous efforts 12<br>
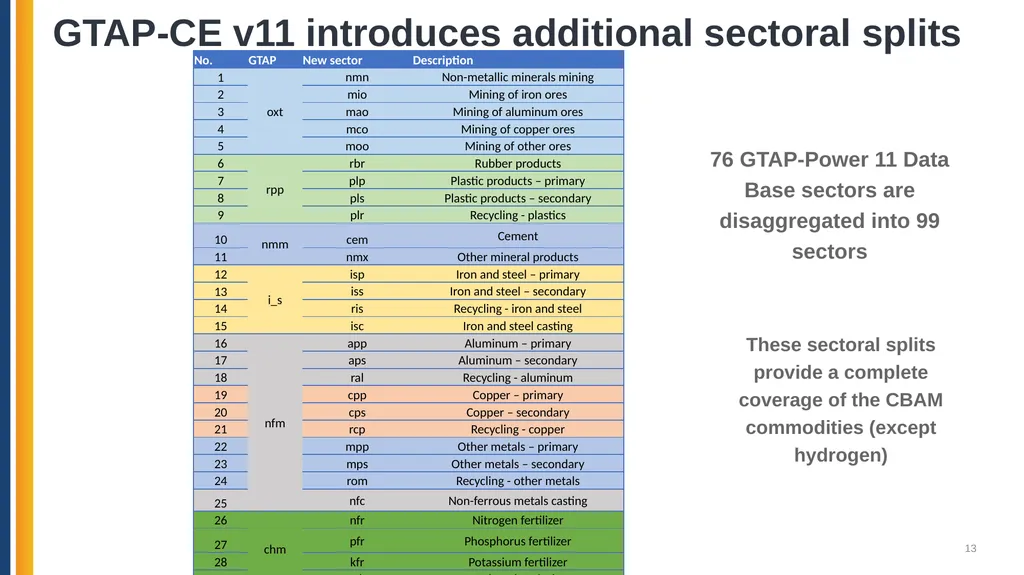
slide13. GTAP-CE v11 introduces additional sectoral splits 13 76 GTAP-Power 11 Data Base sectors are disaggregated into 99 sectors These sectoral splits provide a complete coverage of the CBAM commodities (except hydrogen)<br>
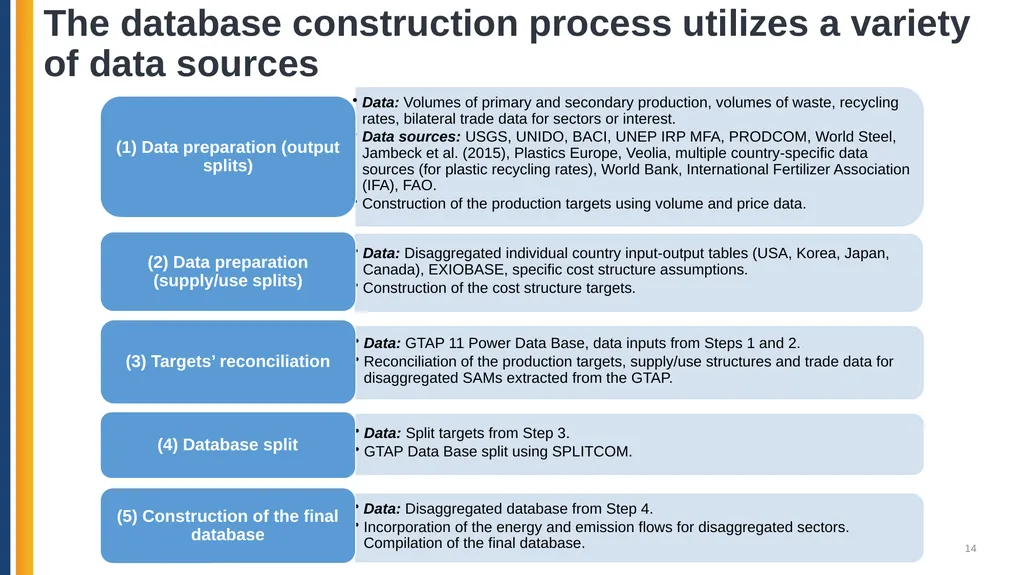
slide14. The database construction process utilizes a variety of data sources 14<br>
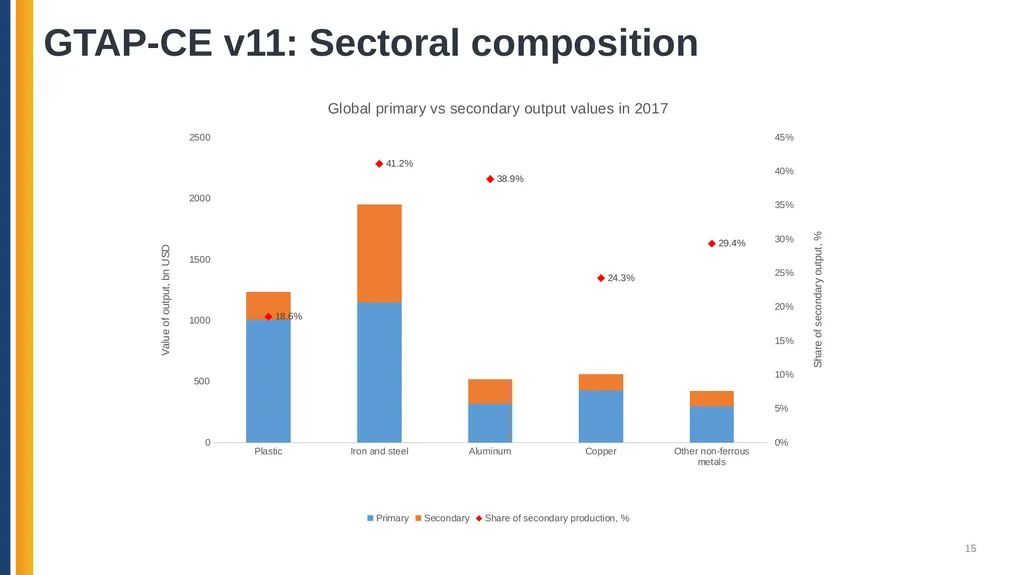
slide15. GTAP-CE v11: Sectoral composition 15<br>
slide16. Incorporating Critical Minerals into the GTAP Data Base 16<br>
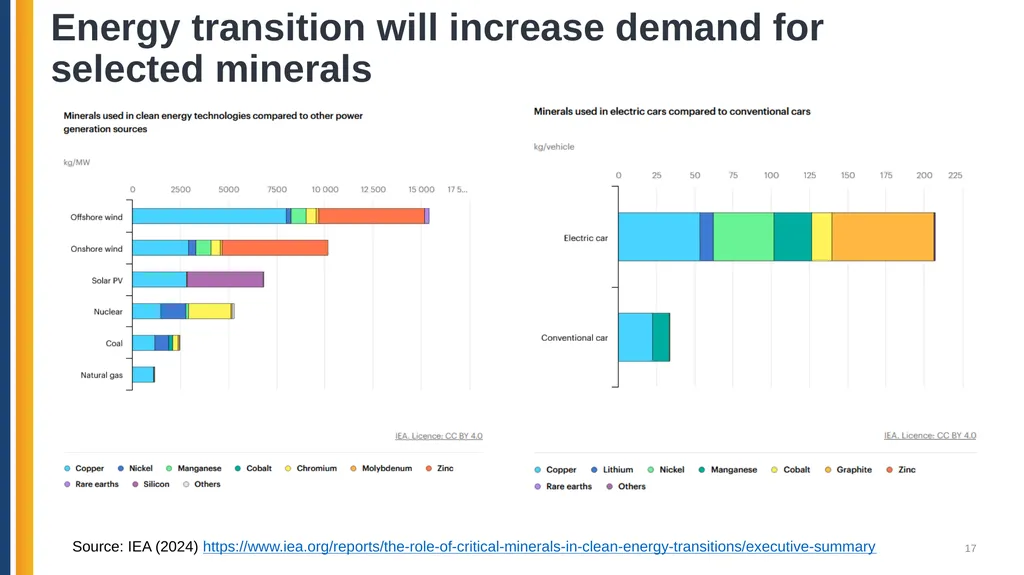
slide17. Energy transition will increase demand for selected minerals 17 Source: IEA (2024) https://www.iea.org/reports/the-role-of-critical-minerals-in-clean-energy-transitions/executive-summary<br>
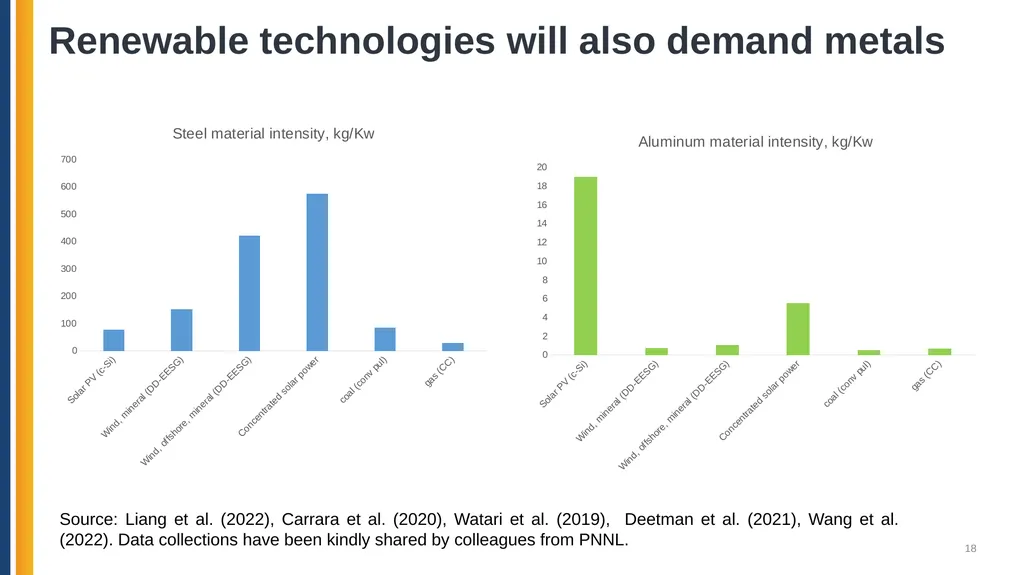
slide18. Renewable technologies will also demand metals 18 Source: Liang et al. (2022), Carrara et al. (2020), Watari et al. (2019), Deetman et al. (2021), Wang et al. (2022). Data collections have been kindly shared by colleagues from PNNL.<br>
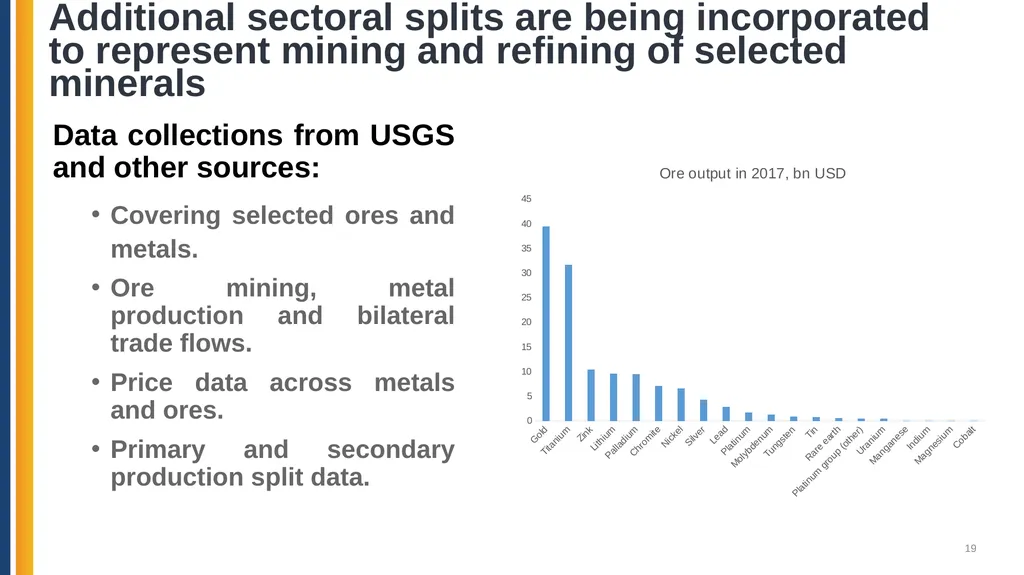
slide19. Additional sectoral splits are being incorporated to represent mining and refining of selected minerals 19 Data collections from USGS and other sources:
Covering selected ores and metals.
Ore mining, metal production and bilateral trade flows.
Price data across metals and ores.
Primary and secondary production split data.<br>
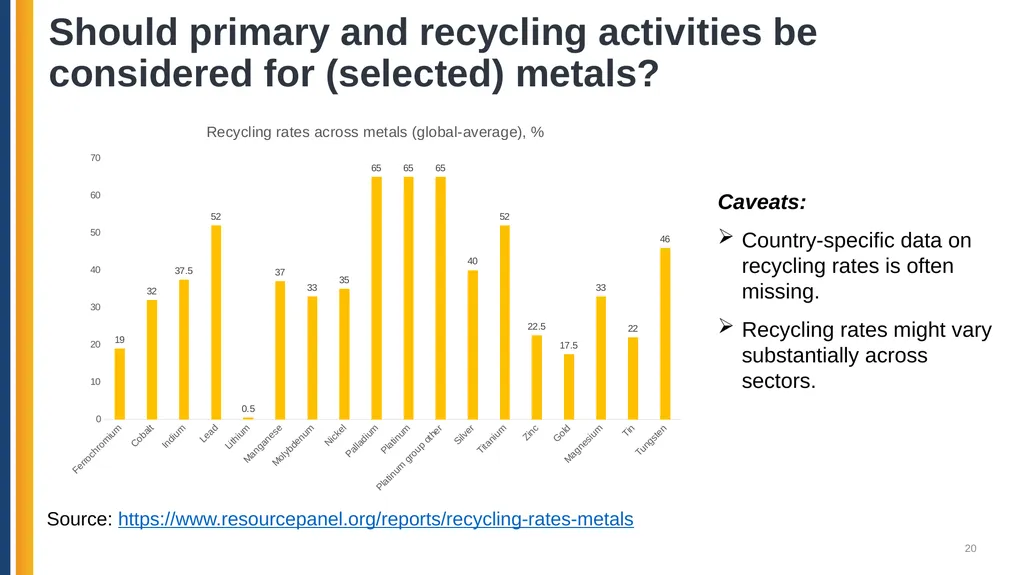
slide20. Should primary and recycling activities be considered for (selected) metals? 20 Source: https://www.resourcepanel.org/reports/recycling-rates-metals Caveats:
Country-specific data on recycling rates is often missing.
Recycling rates might vary substantially across sectors.<br>
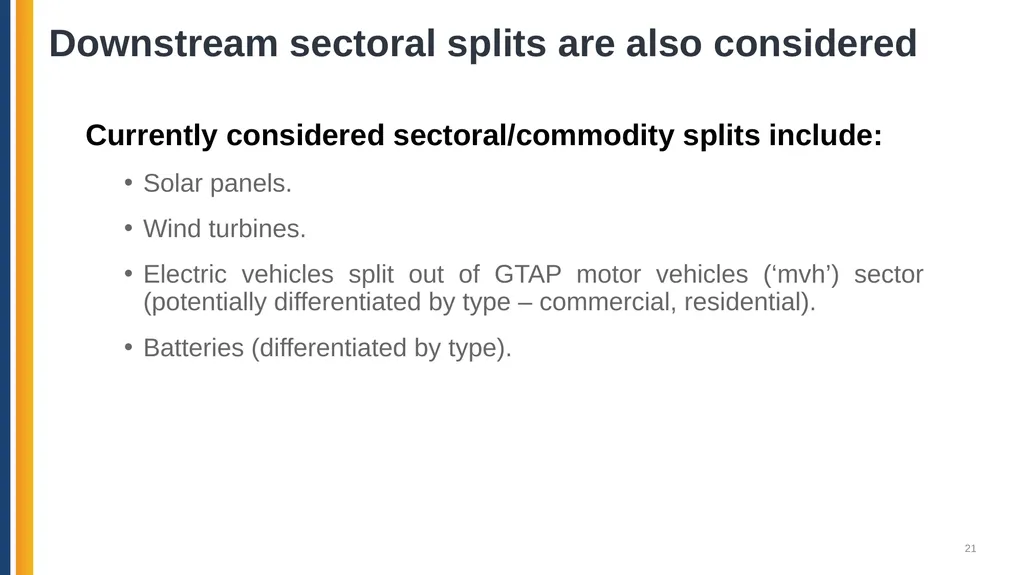
slide21. Downstream sectoral splits are also considered 21 Currently considered sectoral/commodity splits include:
Solar panels.
Wind turbines.
Electric vehicles split out of GTAP motor vehicles (‘mvh’) sector (potentially differentiated by type – commercial, residential).
Batteries (differentiated by type).<br>
slide22. Exploratory application: Demand for minerals under climate mitigation scenarios 22<br>
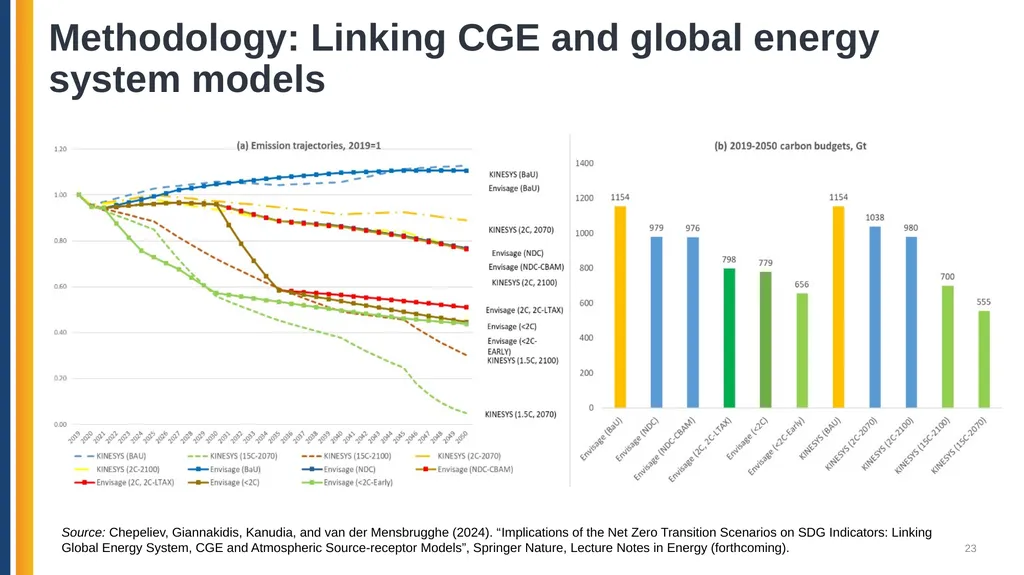
slide23. Methodology: Linking CGE and global energy system models 23 Source: Chepeliev, Giannakidis, Kanudia, and van der Mensbrugghe (2024). “Implications of the Net Zero Transition Scenarios on SDG Indicators: Linking Global Energy System, CGE and Atmospheric Source-receptor Models”, Springer Nature, Lecture Notes in Energy (forthcoming).<br>
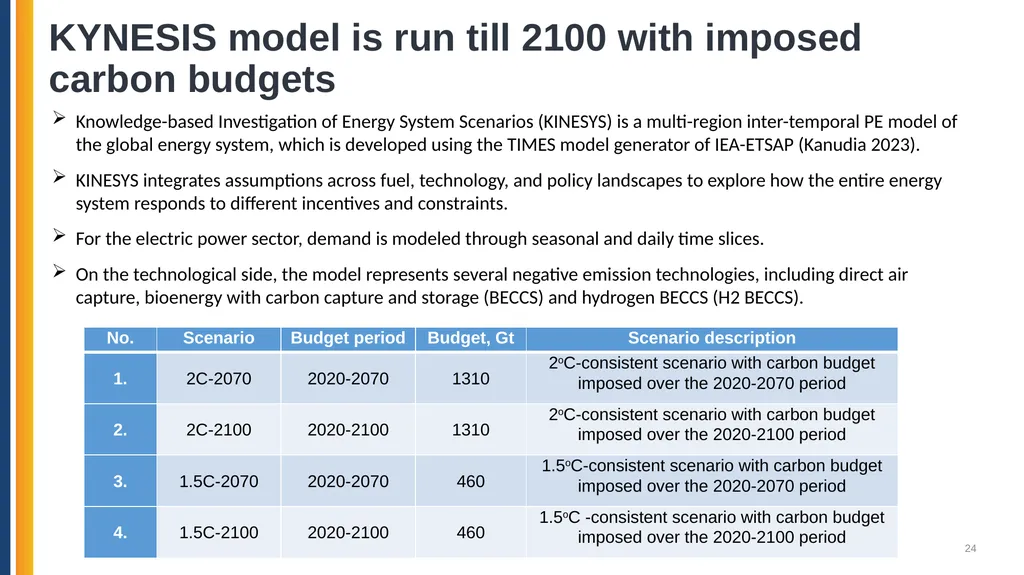
slide24. KYNESIS model is run till 2100 with imposed carbon budgets 24 Knowledge-based Investigation of Energy System Scenarios (KINESYS) is a multi-region inter-temporal PE model of the global energy system, which is developed using the TIMES model generator of IEA-ETSAP (Kanudia 2023).
KINESYS integrates assumptions across fuel, technology, and policy landscapes to explore how the entire energy system responds to different incentives and constraints.
For the electric power sector, demand is modeled through seasonal and daily time slices.
On the technological side, the model represents several negative emission technologies, including direct air capture, bioenergy with carbon capture and storage (BECCS) and hydrogen BECCS (H2 BECCS).<br>
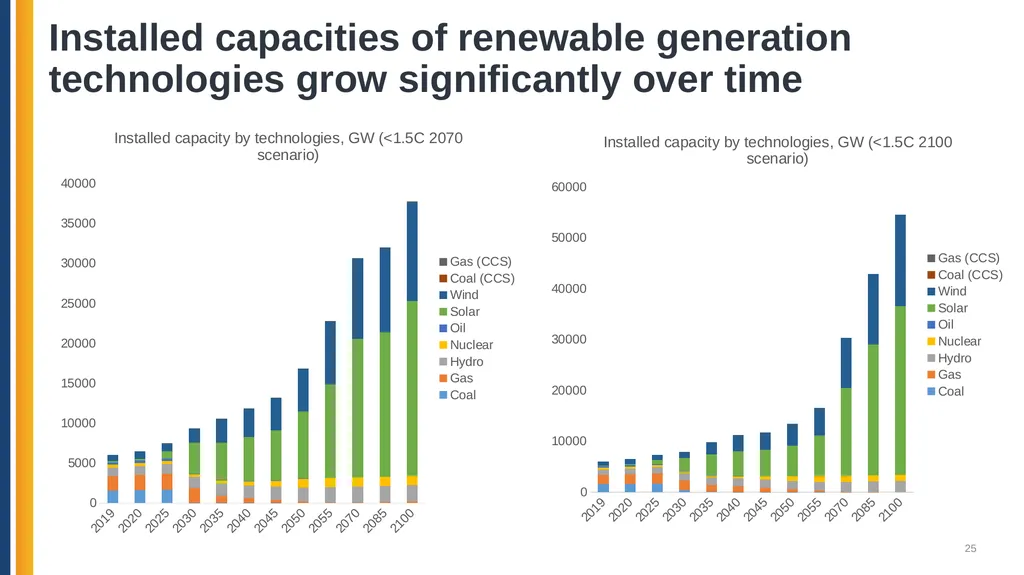
slide25. Installed capacities of renewable generation technologies grow significantly over time 25<br>
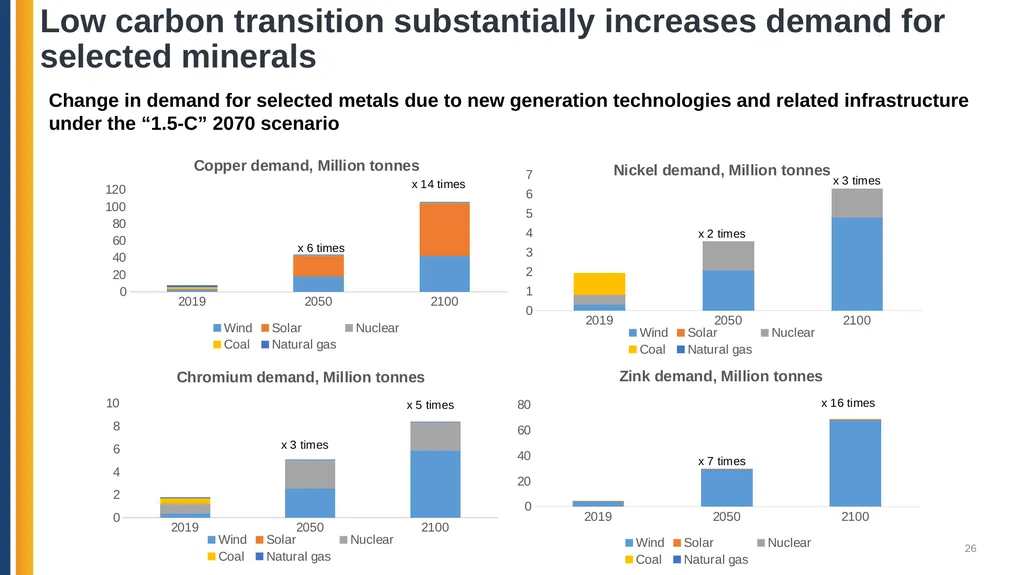
slide26. Low carbon transition substantially increases demand for selected minerals 26 Change in demand for selected metals due to new generation technologies and related infrastructure under the “1.5-C” 2070 scenario<br>
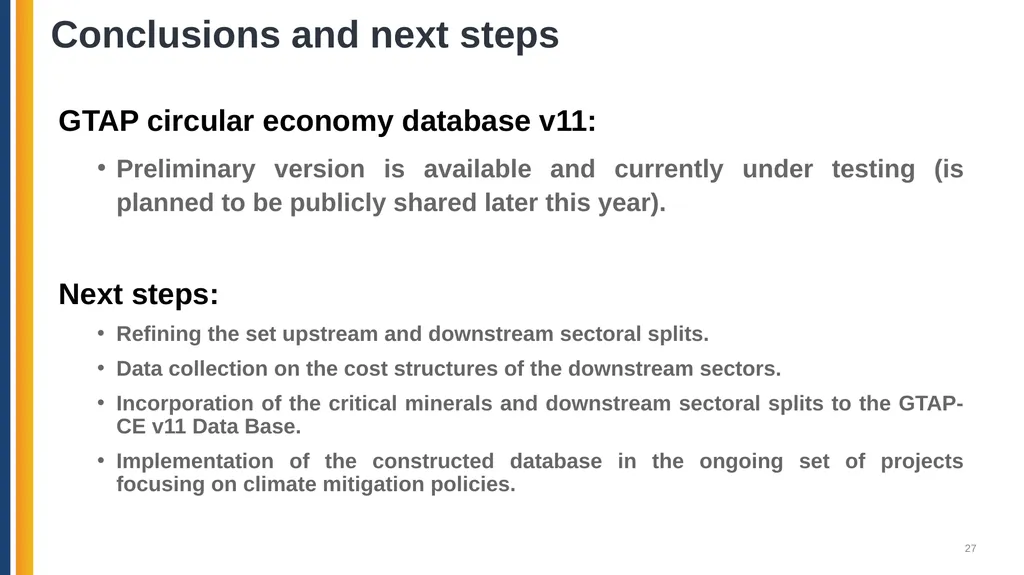
slide27. Conclusions and next steps 27 GTAP circular economy database v11:
Preliminary version is available and currently under testing (is planned to be publicly shared later this year).
Next steps:
Refining the set upstream and downstream sectoral splits.
Data collection on the cost structures of the downstream sectors.
Incorporation of the critical minerals and downstream sectoral splits to the GTAP-CE v11 Data Base.
Implementation of the constructed database in the ongoing set of projects focusing on climate mitigation policies.<br>
slide28. Thank you! Questions/Comments? mchepeli@purdue.edu<br>
Center for Global Trade Analysis, Purdue University
30th International Input-Output Association Conference
July 1-5, 2024
Santiago, Chile<br>
slide2. Motivation
GTAP Data Base v11
GTAP circular economy database
3. Incorporating critical minerals and downstream sectors
4. Sample application: demand for minerals under mitigation scenarios
5. Conclusions and next steps Outline 2<br>
slide3. Current material use patterns are projected to put tremendous pressure on the Earth’s ecosystem
Changes in incomes and population together with a global convergence in material use patterns could result in over 2.5 times increase in global material demand by 2050 (Steffen et al., 2015).
These trends would represent a major challenge for the climate mitigation and other conservation efforts.
The need to move toward a more sustainable material consumption patterns is widely recognized and is promoted within a Circular Economy (CE) concept.
Modelling of the Circular Economy transition requires an explicit representation of the primary and secondary production activities
Represent country-specific production volumes of primary and secondary activities.
Distinguish between corresponding supply and cost structures, e.g. for steel, aluminum, copper, other metals, plastics.
Such representation is not available in the standard GTAP Data Base. Need for decoupling material use from economic growth 3<br>
slide4. A number of studies have represented the Circular Economy splits within the global CGE or IO modeling framework
MRIO assessments based on the EXIOBASE (e.g. Tisserant et al., 2017; Wiebe et al., 2019).
CGE-based assessment focusing on selected sector/commodity (e.g. Winning et al., 2017 for the case of steel).
GTAP-based assessments with a more detailed splits, e.g. OECD (2019), Dellink (2020), Bibas et al. (2021).
Selected limitations of the existing approaches:
Are based on the EXIOBASE cost structures and output values, which do not always correspond to the actual observations (see e.g. Winning et al., 2017).
Focus on selected commodities or specific aggregate regional representations.
Are not consistently updated over time.
Not publicly available. Previous efforts at modeling circularity have a number of limitations 4<br>
slide5. Achieving climate mitigation targets will require an unprecedented expansion in renewable infrastructure and technologies
Such transition will lead to the growing demand for critical minerals, such as nickel, platinum group metals, zinc, rare earths, etc., which are essential inputs for the development of renewable energy systems (Tokimatsu et al., 2018).
It is estimated that within the pathways toward limiting global warming below 1.5oC, the demand for critical minerals could increase between 2 and 267 times by 2050 depending on the mineral (Wang et al., 2022).
Apart from pure supply and logistical constraints, the rising demand for critical minerals is also associated with national security aspects and is prone to generate geopolitical frictions (Vakulchuk et al., 2022).
It is important to have the analytical capacity for the analysis of future energy transition scenarios with an explicit representation of the critical minerals value chains (both upstream and downstream). Representation of the future energy transition requires new sectoral details (both upstream and downstream) 5<br>
slide6. GTAP Data Base v11 6<br>
slide7. Five reference years
2004, 2007, 2011, 2014, 2017
141 countries + 19 aggregate regions
20 new and 39 updated national IOTs have been incorporated
Individual countries cover 99% of the world GDP and 96% of its population
Format consistent with the new standard GTAP model
GAMS containers, and distribution available for classic GTAP Key features of the GTAP 11 7<br>
slide8. 8 Evolution of the GTAP Data Base<br>
slide9. GTAP 11: A major expansion of coverage in Africa 9 Afghanistan
Algeria
Central African Republic
Chad
Comoros
The Congo Republic
The Democratic Republic of the Congo
Equatorial Guinea
Eswatini
Gabon
Haiti
Iraq
Lebanon
Mali
Niger
Palestine
Serbia
Sudan
Syria
Uzbekistan.<br>
slide10. 10 Agriculture etc. Processed food Energy intensive Oth. Manufacturing Services Commodity coverage in GTAP 11<br>
slide11. GTAP-CE Data Base v11 11<br>
slide12. GTAP-CE v11 consolidates and extends previous efforts 12<br>
slide13. GTAP-CE v11 introduces additional sectoral splits 13 76 GTAP-Power 11 Data Base sectors are disaggregated into 99 sectors These sectoral splits provide a complete coverage of the CBAM commodities (except hydrogen)<br>
slide14. The database construction process utilizes a variety of data sources 14<br>
slide15. GTAP-CE v11: Sectoral composition 15<br>
slide16. Incorporating Critical Minerals into the GTAP Data Base 16<br>
slide17. Energy transition will increase demand for selected minerals 17 Source: IEA (2024) https://www.iea.org/reports/the-role-of-critical-minerals-in-clean-energy-transitions/executive-summary<br>
slide18. Renewable technologies will also demand metals 18 Source: Liang et al. (2022), Carrara et al. (2020), Watari et al. (2019), Deetman et al. (2021), Wang et al. (2022). Data collections have been kindly shared by colleagues from PNNL.<br>
slide19. Additional sectoral splits are being incorporated to represent mining and refining of selected minerals 19 Data collections from USGS and other sources:
Covering selected ores and metals.
Ore mining, metal production and bilateral trade flows.
Price data across metals and ores.
Primary and secondary production split data.<br>
slide20. Should primary and recycling activities be considered for (selected) metals? 20 Source: https://www.resourcepanel.org/reports/recycling-rates-metals Caveats:
Country-specific data on recycling rates is often missing.
Recycling rates might vary substantially across sectors.<br>
slide21. Downstream sectoral splits are also considered 21 Currently considered sectoral/commodity splits include:
Solar panels.
Wind turbines.
Electric vehicles split out of GTAP motor vehicles (‘mvh’) sector (potentially differentiated by type – commercial, residential).
Batteries (differentiated by type).<br>
slide22. Exploratory application: Demand for minerals under climate mitigation scenarios 22<br>
slide23. Methodology: Linking CGE and global energy system models 23 Source: Chepeliev, Giannakidis, Kanudia, and van der Mensbrugghe (2024). “Implications of the Net Zero Transition Scenarios on SDG Indicators: Linking Global Energy System, CGE and Atmospheric Source-receptor Models”, Springer Nature, Lecture Notes in Energy (forthcoming).<br>
slide24. KYNESIS model is run till 2100 with imposed carbon budgets 24 Knowledge-based Investigation of Energy System Scenarios (KINESYS) is a multi-region inter-temporal PE model of the global energy system, which is developed using the TIMES model generator of IEA-ETSAP (Kanudia 2023).
KINESYS integrates assumptions across fuel, technology, and policy landscapes to explore how the entire energy system responds to different incentives and constraints.
For the electric power sector, demand is modeled through seasonal and daily time slices.
On the technological side, the model represents several negative emission technologies, including direct air capture, bioenergy with carbon capture and storage (BECCS) and hydrogen BECCS (H2 BECCS).<br>
slide25. Installed capacities of renewable generation technologies grow significantly over time 25<br>
slide26. Low carbon transition substantially increases demand for selected minerals 26 Change in demand for selected metals due to new generation technologies and related infrastructure under the “1.5-C” 2070 scenario<br>
slide27. Conclusions and next steps 27 GTAP circular economy database v11:
Preliminary version is available and currently under testing (is planned to be publicly shared later this year).
Next steps:
Refining the set upstream and downstream sectoral splits.
Data collection on the cost structures of the downstream sectors.
Incorporation of the critical minerals and downstream sectoral splits to the GTAP-CE v11 Data Base.
Implementation of the constructed database in the ongoing set of projects focusing on climate mitigation policies.<br>
slide28. Thank you! Questions/Comments? mchepeli@purdue.edu<br>