Any Member of the Family Deserves the Best In its
Author : danika-pritchard | Published Date : 2025-05-16
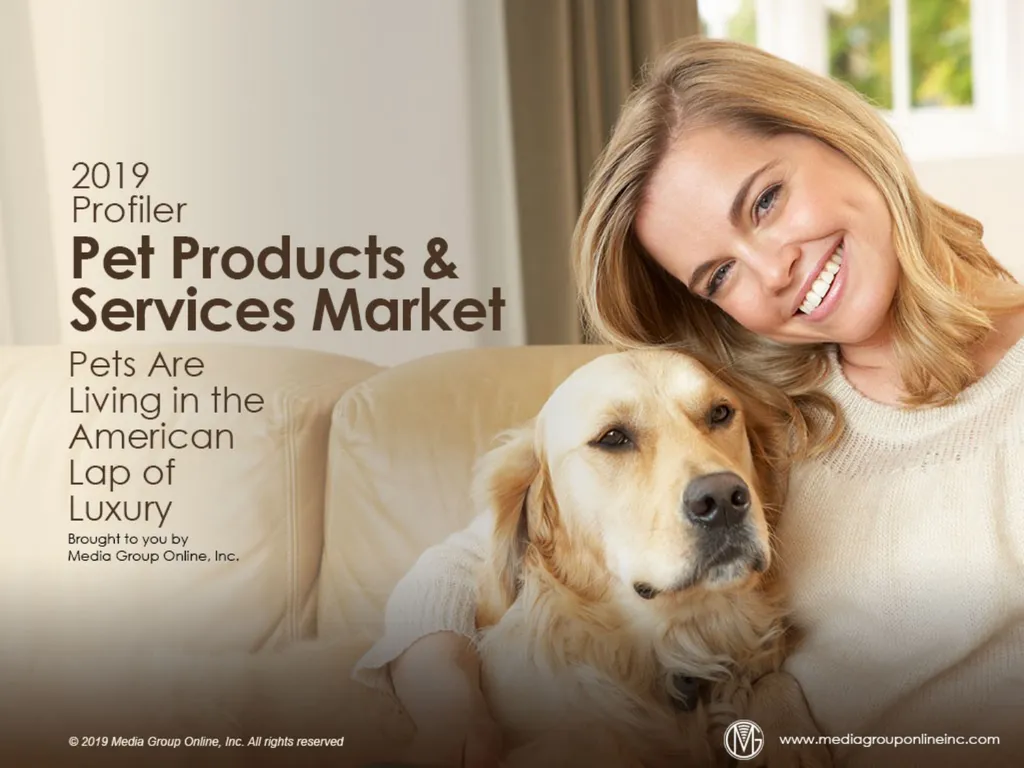
Description: Any Member of the Family Deserves the Best In its annual report March 2019 the American Pet Products Association APPA reported total 2018 US pet industry expenditures were 7256 billion which was a 44 increase from 2017 It also
Presentation Embed Code
Download Presentation
Download
Presentation The PPT/PDF document
"Any Member of the Family Deserves the Best In its" is the property of its rightful owner.
Permission is granted to download and print the materials on this website for personal, non-commercial use only,
and to display it on your personal computer provided you do not modify the materials and that you retain all
copyright notices contained in the materials. By downloading content from our website, you accept the terms of
this agreement.
Transcript:Any Member of the Family Deserves the Best In its:
Any Member of the Family Deserves the Best In its annual report (March 2019), the American Pet Products Association (APPA) reported total 2018 US pet industry expenditures were $72.56 billion, which was a 4.4% increase from 2017. It also estimated 2019 total expenditures of $75.38 billion. Analysis of US Bureau of Labor Statistics (BLS) data reveals Americans spent 44% more on their pets from 2013 to 2018 ($662 and $460, respectively), while average household income increased just 23%. Many trends affect the pet products & services market, but a potential driver of future sales is the 35.7 million Americans, or 28% of all US households, who live alone, which include both seniors and Millennials, and they could favor pet companionship. Consumer Pet Spending Behaviors According to its July 2019 consumer survey of 784 adults, Bigeye, an Orlando-based ad agency, 76% of Americans spend less than $100/month for pet products and services, with 19% spending as much as $2,400/year. More than twice as many younger adults (25–34) as those 45–55 spend more than $200/month. More pet owners living in the South region, or 36%, spend more than $200/month than any other region. Walmart (66%), PetSmart (62%) and grocery/department store (61%) are survey respondents’ top pet product shopping locations. Amazon (59%) and Chewy (44%) were consumers top online sources, and 39% shopped at local/independent stores. Declining Pet Food Expenditures Explained Based on the 2018 pet expenditures data from APPA on page 1, food is the largest category, or 41.8% of the total; however, a 2019 survey of 1,000 adults from LendEDU found 55% of their monthly pet expenditures were for food. Surprisingly, BLS data revealed total 2018 pet food spending was $28.85 billion (compared to the APPA’s $30.32 billion), or a 7.3% decrease from 2017. Different survey periods and other trends may account for the discrepancy. (See page 3 of the Profiler.) The Bigeye survey found 34% of pet owners purchase from one or more subscription services, with the youngest adults (25–34) the largest group, at 40%, and all subscribers purchase food as the #1 item, at 63%. Americans Willing to Spend More for Premium Pet Food In a Q1 2019 survey of premium pet food purchasers from Mondi, a packaging and paper vendor, and Dow Chemical, 91% of respondents said “it’s worth spending a little more on quality pet food” and 75% said “they value freshness,” as important. Among dog owners,