
Ark Energy | Energy Transition, Cleantech and
AM
Published · 16 slides · 0 views

1 / 1
Description
Ark Energy Energy Transition, Cleantech and Digitalization Advisory 30 March 2023 Creating a Conducive Environment for the Development of a Local ESCO Market Aref Abouzahr Chief Executive Officer Ark Energy Perspective on Energy
Related Topics
Share
Embed code
Download this presentation From Below
"Ark Energy | Energy Transition, Cleantech and" is the property of its rightful owner. Permission is granted to download and print the materials on this website for personal, non-commercial use only, and to display it on your personal computer provided you do not modify the materials and that you retain all copyright notices contained in the materials. By downloading content from our website, you accept the terms of this agreement.
Presentation Transcript
01
Ark Energy | Energy Transition, Cleantech and Digitalization Advisory 30 March 2023 Creating a Conducive Environment for the Development of a Local ESCO Market Aref Abouzahr – Chief Executive Officer | Ark Energy<br>
02
Perspective on Energy Transition
Market Challenges
Market Enablers
Enablers Impact
Highlight / Funding Options
Highlight / Measurement & Verification and Digitalization 1 2 3 4 5 6 2<br>
Market Challenges
Market Enablers
Enablers Impact
Highlight / Funding Options
Highlight / Measurement & Verification and Digitalization 1 2 3 4 5 6 2<br>
03
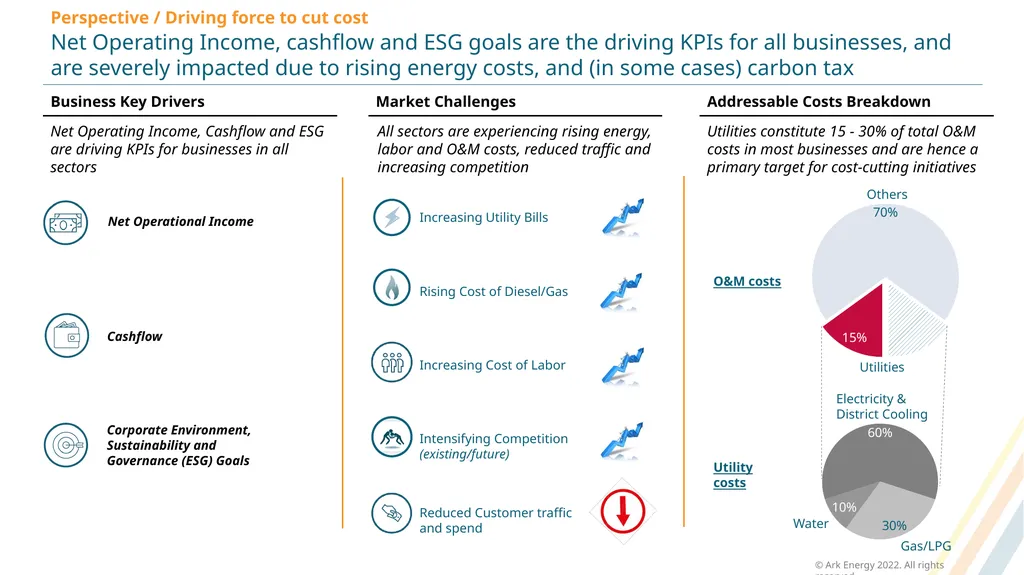
Perspective / Driving force to cut cost Net Operating Income, cashflow and ESG goals are the driving KPIs for all businesses, and are severely impacted due to rising energy costs, and (in some cases) carbon tax Increasing Utility Bills Rising Cost of Diesel/Gas Increasing Cost of Labor Intensifying Competition (existing/future) Reduced Customer traffic and spend O&M costs Utility costs Utilities Others Electricity &
District Cooling Gas/LPG Water Net Operating Income, Cashflow and ESG are driving KPIs for businesses in all sectors Utilities constitute 15 - 30% of total O&M costs in most businesses and are hence a primary target for cost-cutting initiatives All sectors are experiencing rising energy, labor and O&M costs, reduced traffic and increasing competition<br>
District Cooling Gas/LPG Water Net Operating Income, Cashflow and ESG are driving KPIs for businesses in all sectors Utilities constitute 15 - 30% of total O&M costs in most businesses and are hence a primary target for cost-cutting initiatives All sectors are experiencing rising energy, labor and O&M costs, reduced traffic and increasing competition<br>
04
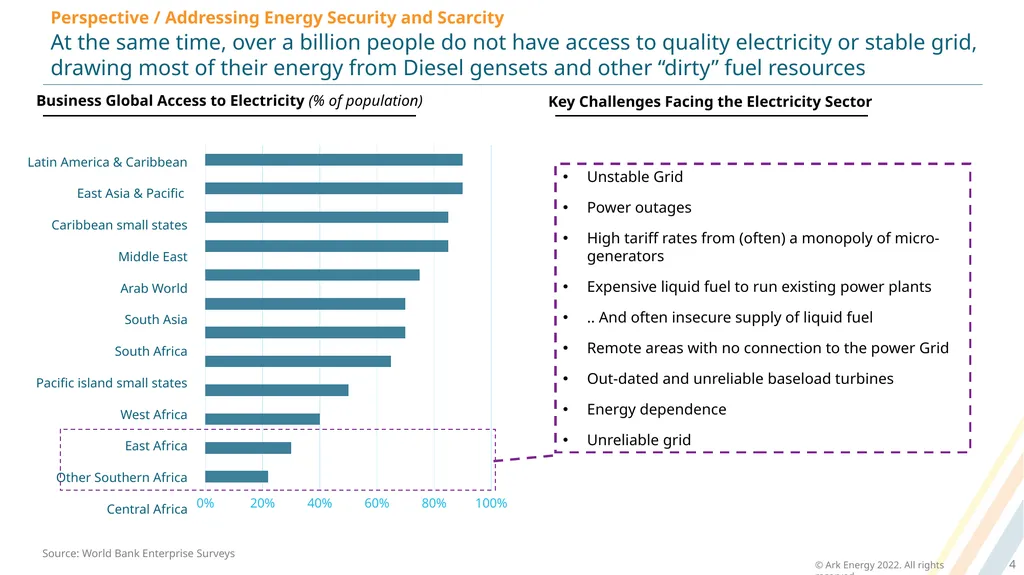
Perspective / Addressing Energy Security and Scarcity At the same time, over a billion people do not have access to quality electricity or stable grid, drawing most of their energy from Diesel gensets and other “dirty” fuel resources 4 Pacific island small states South Asia Latin America & Caribbean Middle East Arab World Caribbean small states East Asia & Pacific South Africa West Africa East Africa Other Southern Africa Central Africa Source: World Bank Enterprise Surveys Unstable Grid
Power outages
High tariff rates from (often) a monopoly of micro-generators
Expensive liquid fuel to run existing power plants
.. And often insecure supply of liquid fuel
Remote areas with no connection to the power Grid
Out-dated and unreliable baseload turbines
Energy dependence
Unreliable grid Business Global Access to Electricity (% of population) Key Challenges Facing the Electricity Sector<br>
Power outages
High tariff rates from (often) a monopoly of micro-generators
Expensive liquid fuel to run existing power plants
.. And often insecure supply of liquid fuel
Remote areas with no connection to the power Grid
Out-dated and unreliable baseload turbines
Energy dependence
Unreliable grid Business Global Access to Electricity (% of population) Key Challenges Facing the Electricity Sector<br>
05
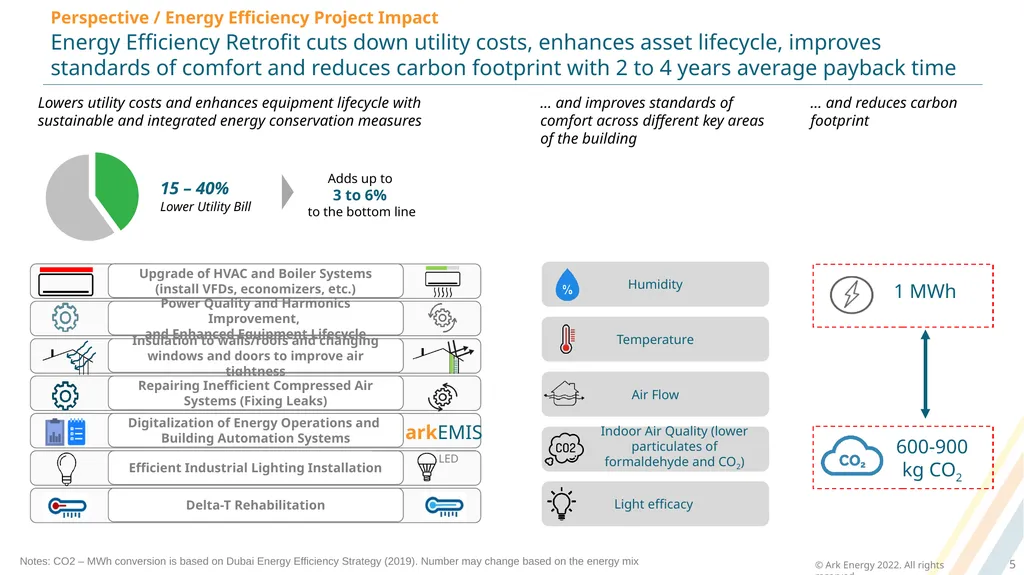
Perspective / Energy Efficiency Project Impact Energy Efficiency Retrofit cuts down utility costs, enhances asset lifecycle, improves standards of comfort and reduces carbon footprint with 2 to 4 years average payback time 5 Lowers utility costs and enhances equipment lifecycle with sustainable and integrated energy conservation measures … and improves standards of comfort across different key areas of the building Upgrade of HVAC and Boiler Systems (install VFDs, economizers, etc.) Power Quality and Harmonics Improvement,
and Enhanced Equipment Lifecycle Insulation to walls/roofs and changing windows and doors to improve air tightness Digitalization of Energy Operations and
Building Automation Systems arkEMIS Efficient Industrial Lighting Installation 15 – 40%
Lower Utility Bill Adds up to
3 to 6%
to the bottom line Humidity Temperature Air Flow Indoor Air Quality (lower particulates of formaldehyde and CO2) Light efficacy 1 MWh 600-900 kg CO2 Notes: CO2 – MWh conversion is based on Dubai Energy Efficiency Strategy (2019). Number may change based on the energy mix Repairing Inefficient Compressed Air Systems (Fixing Leaks) Delta-T Rehabilitation … and reduces carbon footprint<br>
and Enhanced Equipment Lifecycle Insulation to walls/roofs and changing windows and doors to improve air tightness Digitalization of Energy Operations and
Building Automation Systems arkEMIS Efficient Industrial Lighting Installation 15 – 40%
Lower Utility Bill Adds up to
3 to 6%
to the bottom line Humidity Temperature Air Flow Indoor Air Quality (lower particulates of formaldehyde and CO2) Light efficacy 1 MWh 600-900 kg CO2 Notes: CO2 – MWh conversion is based on Dubai Energy Efficiency Strategy (2019). Number may change based on the energy mix Repairing Inefficient Compressed Air Systems (Fixing Leaks) Delta-T Rehabilitation … and reduces carbon footprint<br>
06
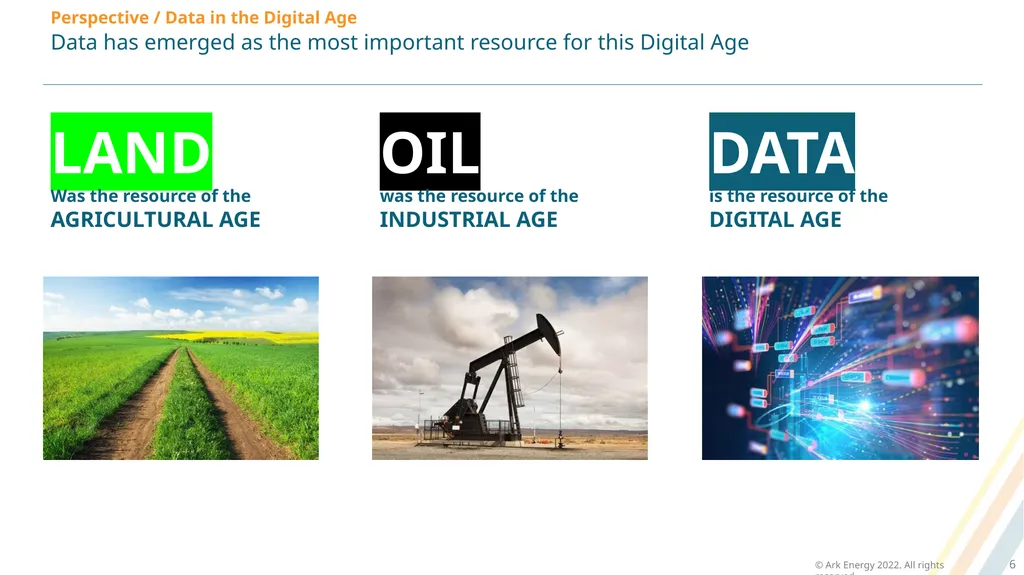
Data has emerged as the most important resource for this Digital Age 6 LAND
Was the resource of the
AGRICULTURAL AGE OIL
was the resource of the
INDUSTRIAL AGE DATA
is the resource of the
DIGITAL AGE Perspective / Data in the Digital Age<br>
Was the resource of the
AGRICULTURAL AGE OIL
was the resource of the
INDUSTRIAL AGE DATA
is the resource of the
DIGITAL AGE Perspective / Data in the Digital Age<br>
07
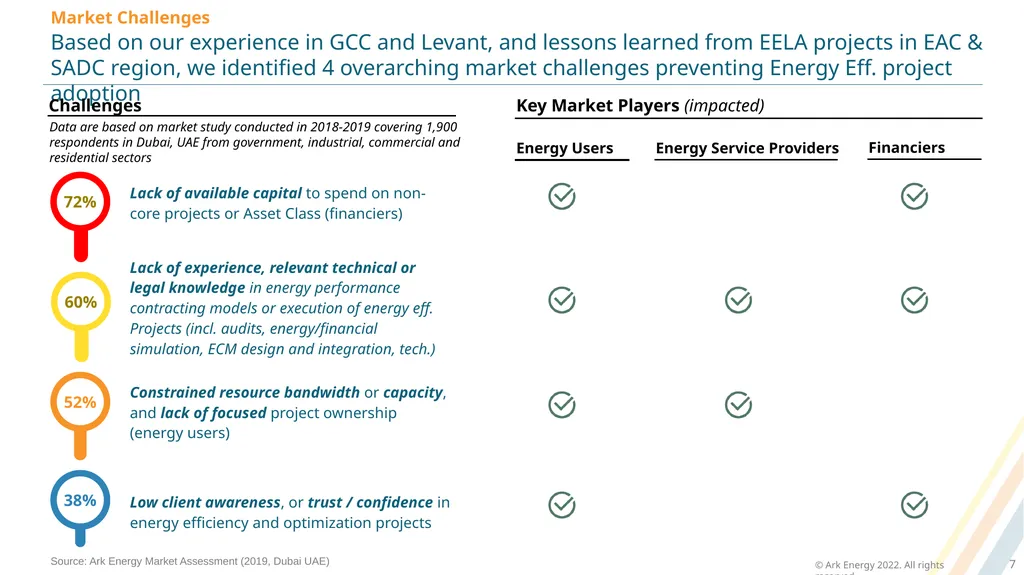
Market Challenges Based on our experience in GCC and Levant, and lessons learned from EELA projects in EAC & SADC region, we identified 4 overarching market challenges preventing Energy Eff. project adoption 7 Challenges Key Market Players (impacted) Energy Users Energy Service Providers Financiers Source: Ark Energy Market Assessment (2019, Dubai UAE) Data are based on market study conducted in 2018-2019 covering 1,900 respondents in Dubai, UAE from government, industrial, commercial and residential sectors<br>
08
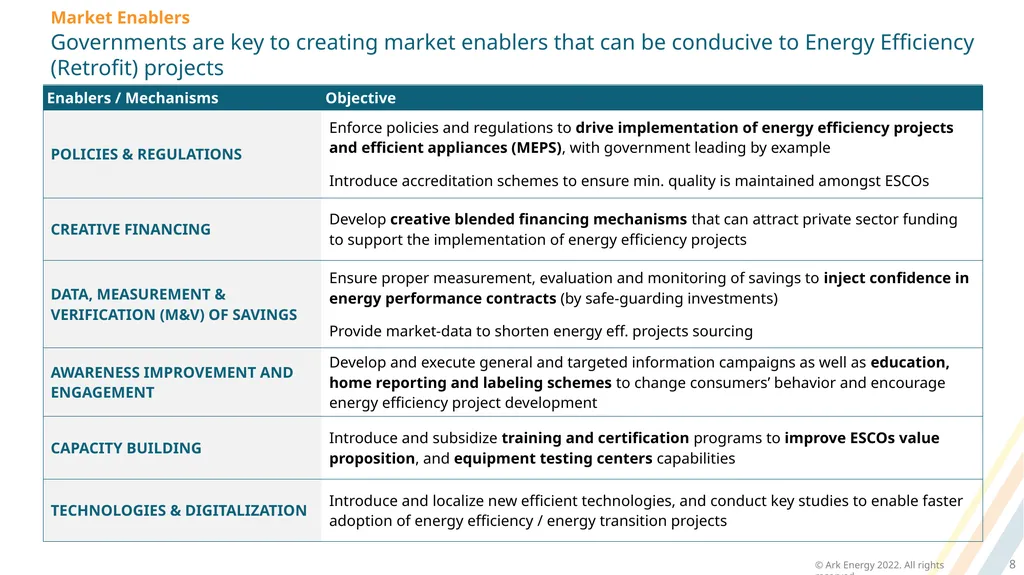
Market Enablers Governments are key to creating market enablers that can be conducive to Energy Efficiency (Retrofit) projects 8<br>
09
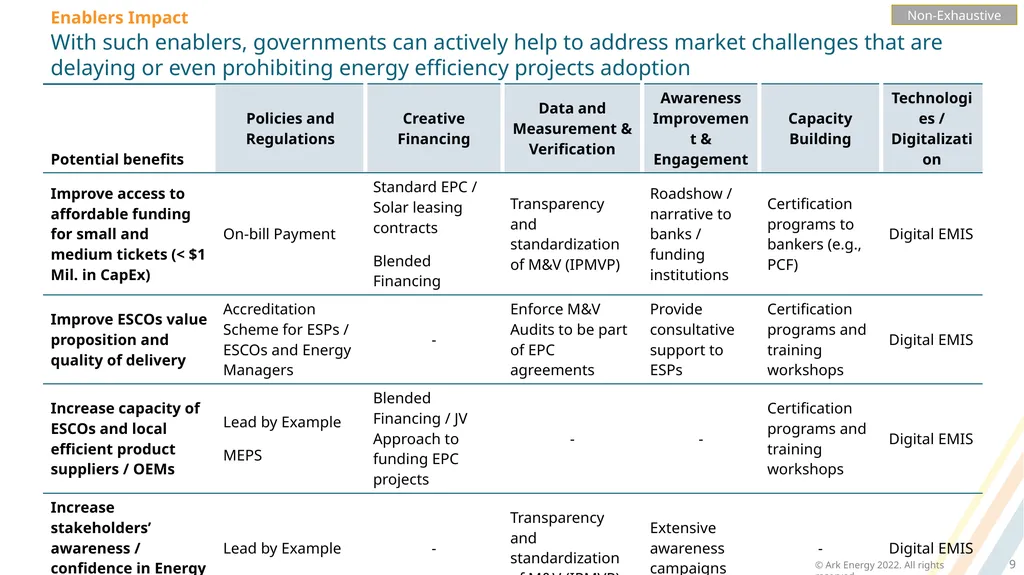
Enablers Impact With such enablers, governments can actively help to address market challenges that are delaying or even prohibiting energy efficiency projects adoption 9 Non-Exhaustive<br>
10
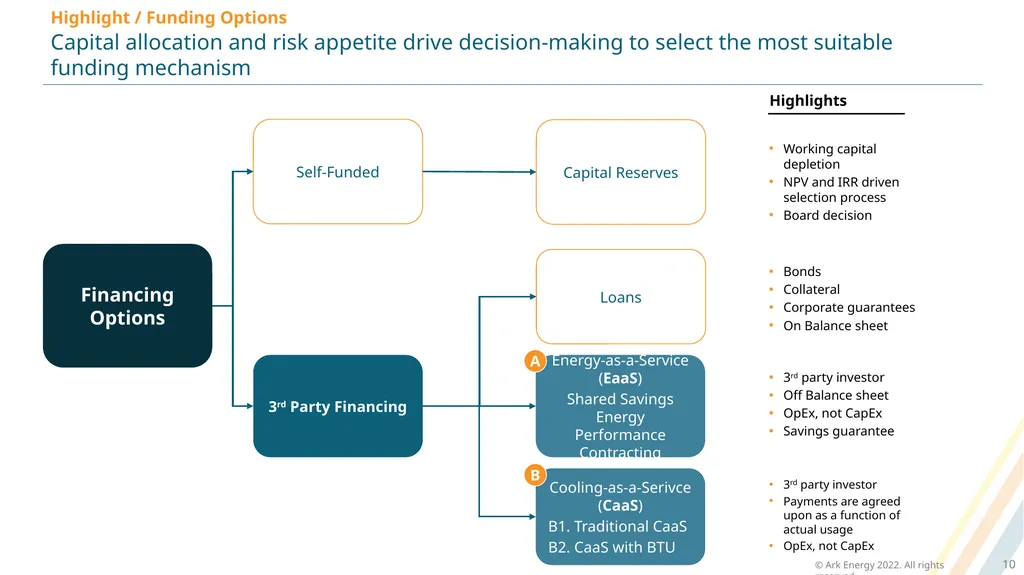
Capital allocation and risk appetite drive decision-making to select the most suitable funding mechanism 10 Highlight / Funding Options Self-Funded 3rd Party Financing Loans Cooling-as-a-Serivce (CaaS)
B1. Traditional CaaS
B2. CaaS with BTU Capital Reserves Financing Options Bonds
Collateral
Corporate guarantees
On Balance sheet 3rd party investor
Payments are agreed upon as a function of actual usage
OpEx, not CapEx Working capital depletion
NPV and IRR driven selection process
Board decision Highlights Energy-as-a-Service (EaaS)
Shared Savings Energy Performance Contracting 3rd party investor
Off Balance sheet
OpEx, not CapEx
Savings guarantee A B<br>
B1. Traditional CaaS
B2. CaaS with BTU Capital Reserves Financing Options Bonds
Collateral
Corporate guarantees
On Balance sheet 3rd party investor
Payments are agreed upon as a function of actual usage
OpEx, not CapEx Working capital depletion
NPV and IRR driven selection process
Board decision Highlights Energy-as-a-Service (EaaS)
Shared Savings Energy Performance Contracting 3rd party investor
Off Balance sheet
OpEx, not CapEx
Savings guarantee A B<br>
11
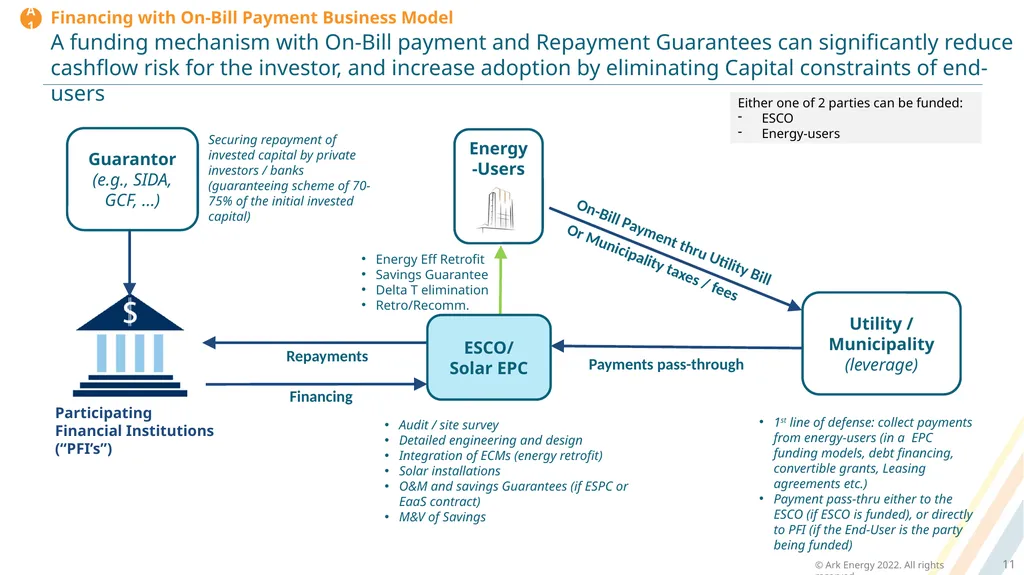
Financing with On-Bill Payment Business Model A funding mechanism with On-Bill payment and Repayment Guarantees can significantly reduce cashflow risk for the investor, and increase adoption by eliminating Capital constraints of end-users 11 Audit / site survey
Detailed engineering and design
Integration of ECMs (energy retrofit)
Solar installations
O&M and savings Guarantees (if ESPC or EaaS contract)
M&V of Savings Financing Energy Eff Retrofit
Savings Guarantee
Delta T elimination
Retro/Recomm. Participating Financial Institutions (“PFI’s”) On-Bill Payment thru Utility Bill Repayments Payments pass-through ESCO/
Solar EPC Utility / Municipality (leverage) A1 1st line of defense: collect payments from energy-users (in a EPC funding models, debt financing, convertible grants, Leasing agreements etc.)
Payment pass-thru either to the ESCO (if ESCO is funded), or directly to PFI (if the End-User is the party being funded) Guarantor (e.g., SIDA, GCF, …) Securing repayment of invested capital by private investors / banks (guaranteeing scheme of 70-75% of the initial invested capital) Either one of 2 parties can be funded:
ESCO
Energy-users Or Municipality taxes / fees<br>
Detailed engineering and design
Integration of ECMs (energy retrofit)
Solar installations
O&M and savings Guarantees (if ESPC or EaaS contract)
M&V of Savings Financing Energy Eff Retrofit
Savings Guarantee
Delta T elimination
Retro/Recomm. Participating Financial Institutions (“PFI’s”) On-Bill Payment thru Utility Bill Repayments Payments pass-through ESCO/
Solar EPC Utility / Municipality (leverage) A1 1st line of defense: collect payments from energy-users (in a EPC funding models, debt financing, convertible grants, Leasing agreements etc.)
Payment pass-thru either to the ESCO (if ESCO is funded), or directly to PFI (if the End-User is the party being funded) Guarantor (e.g., SIDA, GCF, …) Securing repayment of invested capital by private investors / banks (guaranteeing scheme of 70-75% of the initial invested capital) Either one of 2 parties can be funded:
ESCO
Energy-users Or Municipality taxes / fees<br>
12
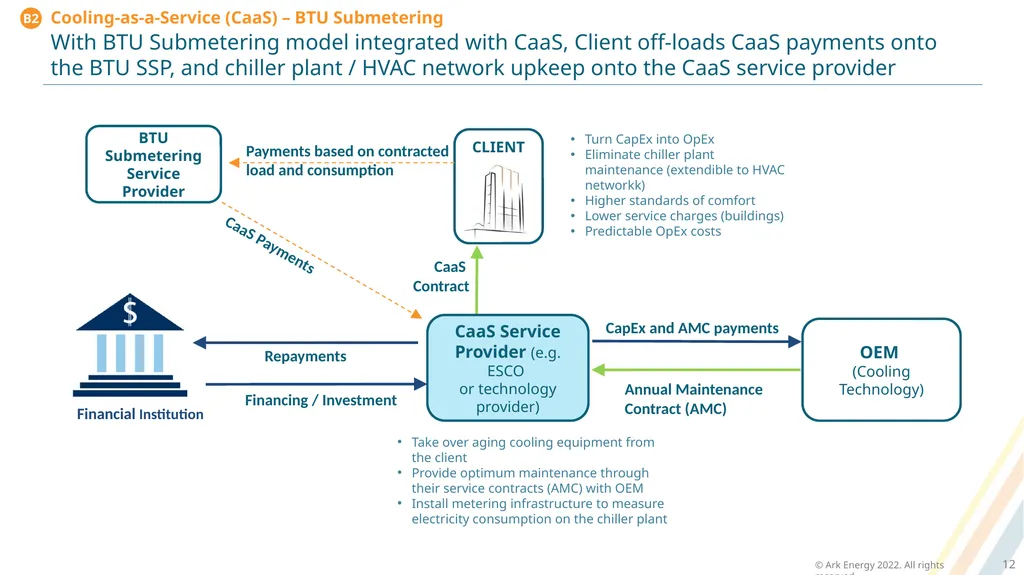
Cooling-as-a-Service (CaaS) – BTU Submetering With BTU Submetering model integrated with CaaS, Client off-loads CaaS payments onto the BTU SSP, and chiller plant / HVAC network upkeep onto the CaaS service provider 12 Financing / Investment CaaS
Contract Financial Institution Repayments CapEx and AMC payments Turn CapEx into OpEx
Eliminate chiller plant maintenance (extendible to HVAC networkk)
Higher standards of comfort
Lower service charges (buildings)
Predictable OpEx costs CaaS Service Provider (e.g. ESCO
or technology provider) OEM
(Cooling Technology) Take over aging cooling equipment from the client
Provide optimum maintenance through their service contracts (AMC) with OEM
Install metering infrastructure to measure electricity consumption on the chiller plant Annual Maintenance Contract (AMC) BTU Submetering Service Provider Payments based on contracted load and consumption CaaS Payments B2<br>
Contract Financial Institution Repayments CapEx and AMC payments Turn CapEx into OpEx
Eliminate chiller plant maintenance (extendible to HVAC networkk)
Higher standards of comfort
Lower service charges (buildings)
Predictable OpEx costs CaaS Service Provider (e.g. ESCO
or technology provider) OEM
(Cooling Technology) Take over aging cooling equipment from the client
Provide optimum maintenance through their service contracts (AMC) with OEM
Install metering infrastructure to measure electricity consumption on the chiller plant Annual Maintenance Contract (AMC) BTU Submetering Service Provider Payments based on contracted load and consumption CaaS Payments B2<br>
13
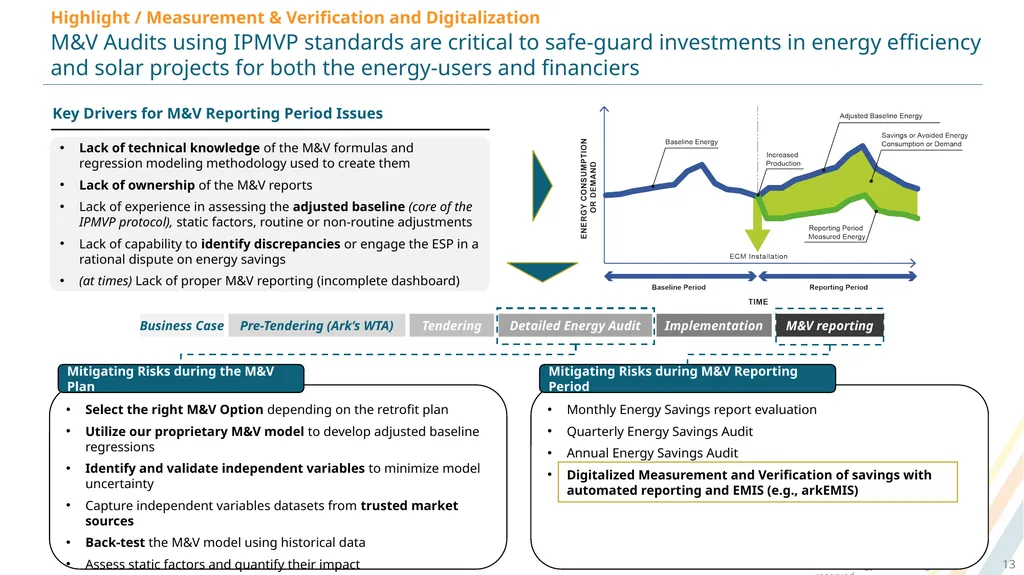
Highlight / Measurement & Verification and Digitalization M&V Audits using IPMVP standards are critical to safe-guard investments in energy efficiency and solar projects for both the energy-users and financiers 13 Lack of technical knowledge of the M&V formulas and regression modeling methodology used to create them
Lack of ownership of the M&V reports
Lack of experience in assessing the adjusted baseline (core of the IPMVP protocol), static factors, routine or non-routine adjustments
Lack of capability to identify discrepancies or engage the ESP in a rational dispute on energy savings
(at times) Lack of proper M&V reporting (incomplete dashboard) Key Drivers for M&V Reporting Period Issues Tendering M&V reporting Detailed Energy Audit Implementation Pre-Tendering (Ark’s WTA) Business Case Select the right M&V Option depending on the retrofit plan
Utilize our proprietary M&V model to develop adjusted baseline regressions
Identify and validate independent variables to minimize model uncertainty
Capture independent variables datasets from trusted market sources
Back-test the M&V model using historical data
Assess static factors and quantify their impact Mitigating Risks during the M&V Plan<br>
Lack of ownership of the M&V reports
Lack of experience in assessing the adjusted baseline (core of the IPMVP protocol), static factors, routine or non-routine adjustments
Lack of capability to identify discrepancies or engage the ESP in a rational dispute on energy savings
(at times) Lack of proper M&V reporting (incomplete dashboard) Key Drivers for M&V Reporting Period Issues Tendering M&V reporting Detailed Energy Audit Implementation Pre-Tendering (Ark’s WTA) Business Case Select the right M&V Option depending on the retrofit plan
Utilize our proprietary M&V model to develop adjusted baseline regressions
Identify and validate independent variables to minimize model uncertainty
Capture independent variables datasets from trusted market sources
Back-test the M&V model using historical data
Assess static factors and quantify their impact Mitigating Risks during the M&V Plan<br>
14
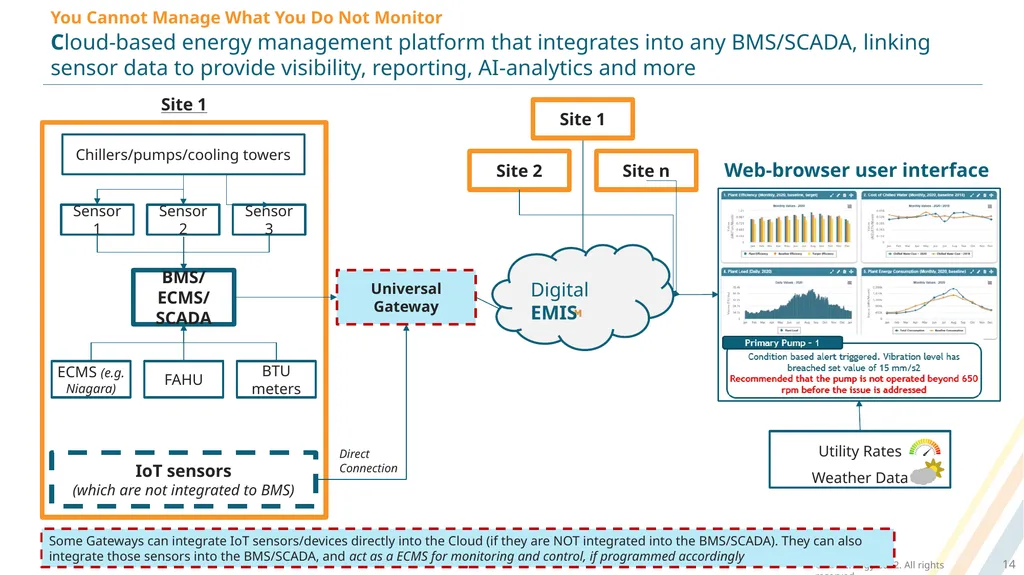
You Cannot Manage What You Do Not Monitor Cloud-based energy management platform that integrates into any BMS/SCADA, linking sensor data to provide visibility, reporting, AI-analytics and more 14 FAHU ECMS (e.g. Niagara) BTU meters BMS/ECMS/SCADA Universal Gateway Chillers/pumps/cooling towers Sensor 2 Sensor 1 Sensor 3 Web-browser user interface Site 1 Site 2 Site n Site 1 IoT sensors
(which are not integrated to BMS) Direct Connection Some Gateways can integrate IoT sensors/devices directly into the Cloud (if they are NOT integrated into the BMS/SCADA). They can also integrate those sensors into the BMS/SCADA, and act as a ECMS for monitoring and control, if programmed accordingly Digital EMIS<br>
(which are not integrated to BMS) Direct Connection Some Gateways can integrate IoT sensors/devices directly into the Cloud (if they are NOT integrated into the BMS/SCADA). They can also integrate those sensors into the BMS/SCADA, and act as a ECMS for monitoring and control, if programmed accordingly Digital EMIS<br>
15
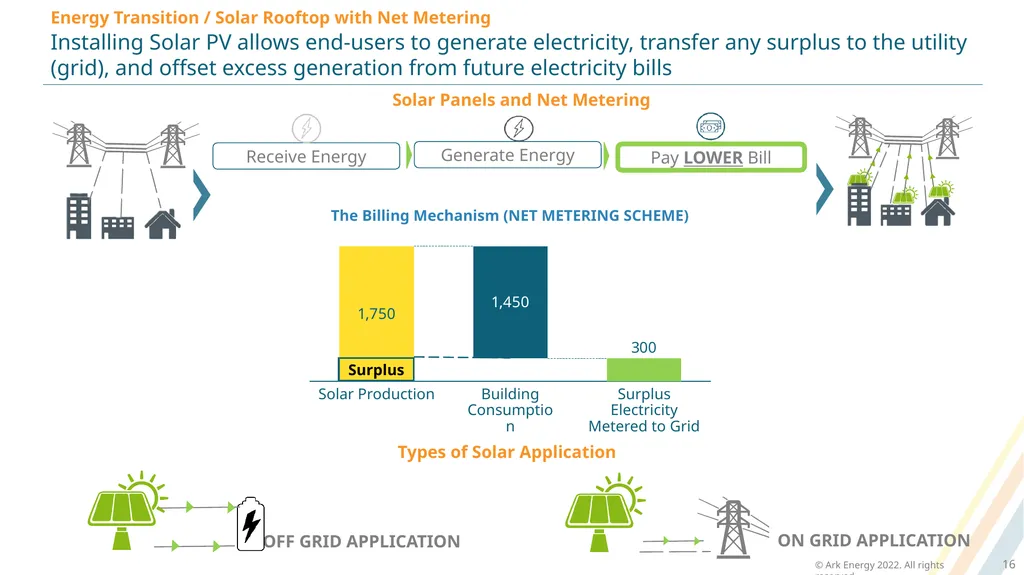
Energy Transition / Solar Rooftop with Net Metering Installing Solar PV allows end-users to generate electricity, transfer any surplus to the utility (grid), and offset excess generation from future electricity bills 16 Solar Panels and Net Metering Pay LOWER Bill Receive Energy Generate Energy Types of Solar Application OFF GRID APPLICATION ON GRID APPLICATION Solar Production Surplus Electricity Metered to Grid Building Consumption Surplus The Billing Mechanism (NET METERING SCHEME)<br>