Assessing Financial health Using Financial Metrics to Assess Financial Health and Inform Data-Driven Decision Making Christina Day, Budget Manager Portland Community College February 2016 Goals for today Share tools for strategic financial
"Assessing Financial health Using Financial Metrics" is the property of its rightful owner. Permission is granted to
download and print the materials on this website for personal, non-commercial use only, and to display it
on your personal computer provided you do not modify the materials and that you retain all copyright
notices contained in the materials. By downloading content from our website, you accept the terms of this
agreement.
Presentation Transcript
01
Assessing Financial health Using Financial Metrics to Assess Financial Health and Inform Data-Driven Decision Making Christina Day, Budget Manager
Portland Community College
February 2016<br>
02
Goals for today Share tools for strategic financial analysis
Discuss use of financial ratios for analysis
Identify possible strategies for improved financial management<br>
03
Key financial focus for Board and Senior leadership Are we appropriately funding the activities that we have currently undertaken? How do we compare financially with our peer institutions - are we in a position to compete effectively? Where do we need to invest to meet our strategic goals, and do we have the funds available? If we are to pursue a growth strategy, how much resource do we have available today as a baseline to fund an expansion?<br>
04
Purpose of strategic financial analysis The alignment of strategic financial goals with actions and risk assessment will improve strategic decision making and chances of institutional success. The mission, as articulated in the strategic plan, is the institutional driver; financial capacity and affordability measure the feasibility of the institution’s aspirations.”
Prager, Sealy & Co. (2010)
In other words – Are we financially healthy enough to take actions and risks to meet our mission?<br>
05
Why use Strategic financial ratio analysis? Gauge the financial health of your institution to meet its mission
Another lens for analysis – quantifiable measures
Benchmark with other institutions
Identify areas for investment to improve performance and align to strategic goals
Informs data-driven decisions
Uses GAAP-adjusted CAFR data<br>
06
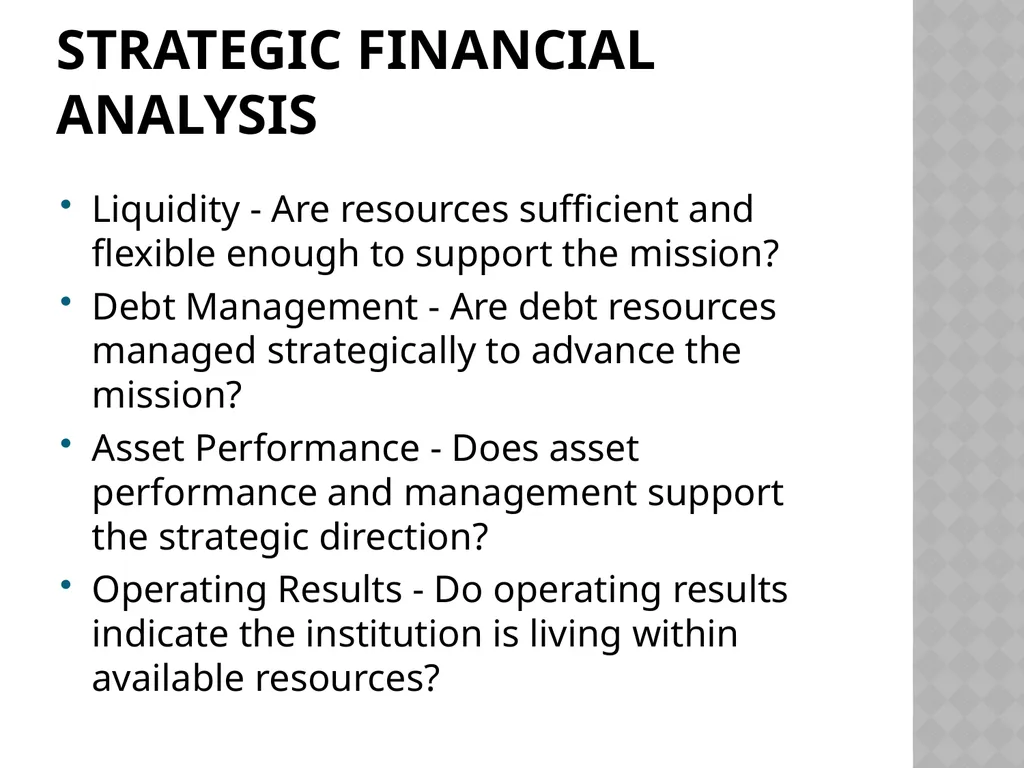
Strategic Financial analysis Liquidity - Are resources sufficient and flexible enough to support the mission?
Debt Management - Are debt resources managed strategically to advance the mission?
Asset Performance - Does asset performance and management support the strategic direction?
Operating Results - Do operating results indicate the institution is living within available resources?<br>
07
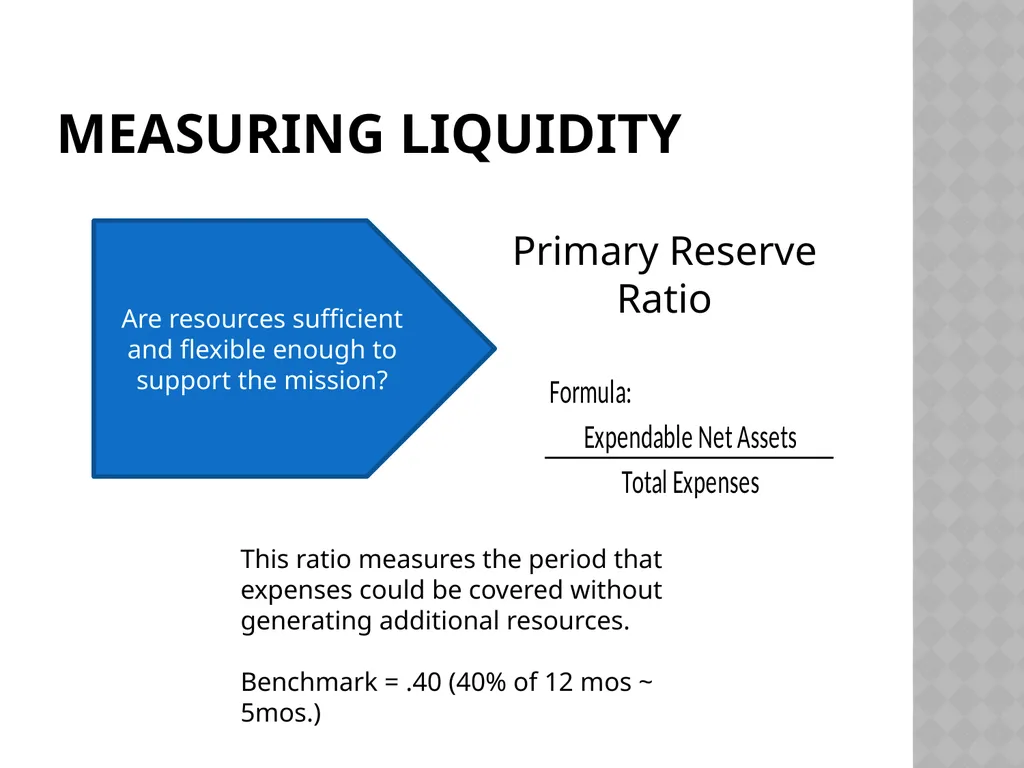
Measuring Liquidity Primary Reserve Ratio Are resources sufficient and flexible enough to support the mission? This ratio measures the period that expenses could be covered without generating additional resources.
Benchmark = .40 (40% of 12 mos ~ 5mos.)<br>
08
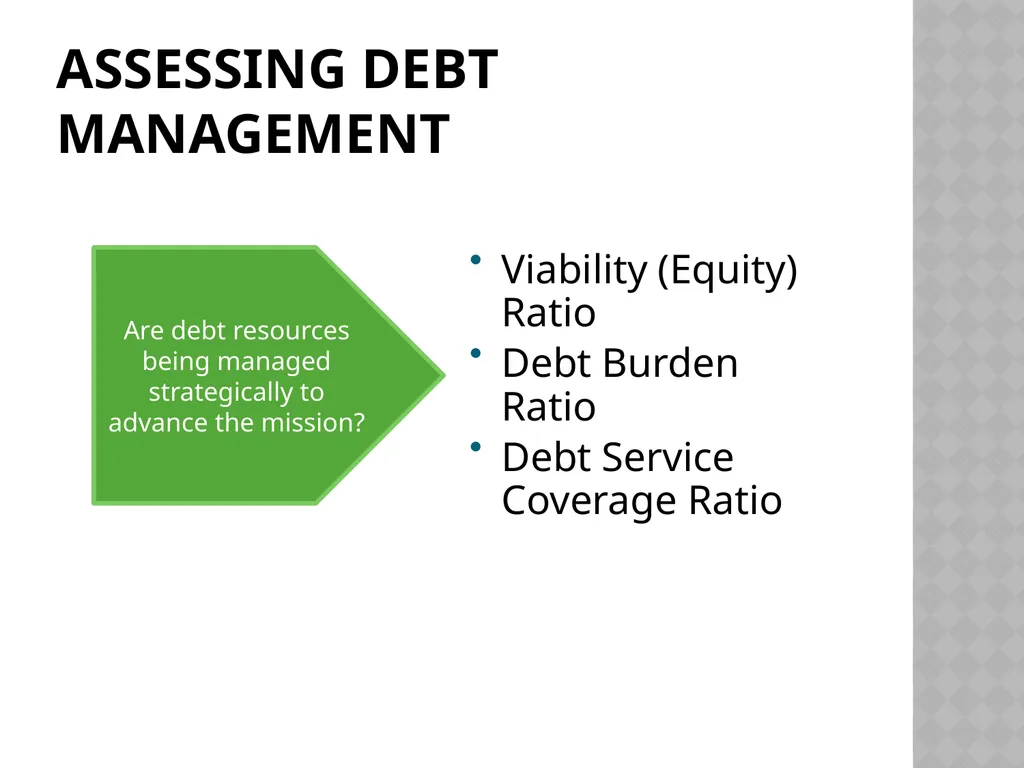
Assessing debt management Viability (Equity) Ratio
Debt Burden Ratio
Debt Service Coverage Ratio Are debt resources being managed strategically to advance the mission?<br>
09
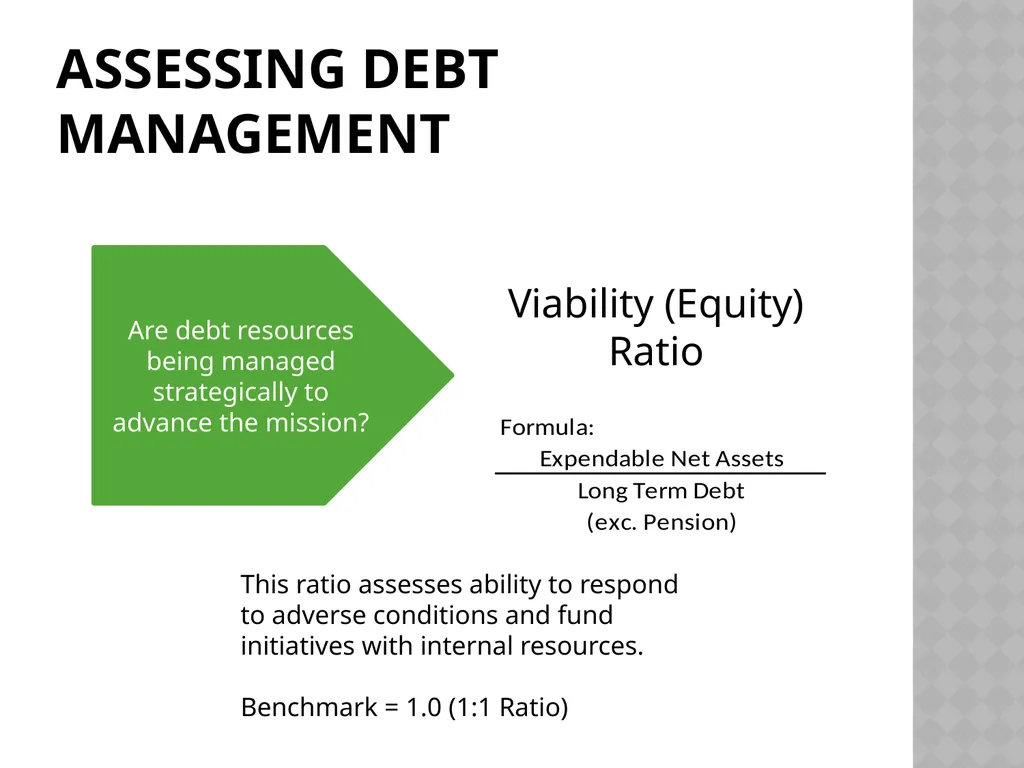
Assessing debt management Viability (Equity) Ratio Are debt resources being managed strategically to advance the mission? This ratio assesses ability to respond to adverse conditions and fund initiatives with internal resources.
Benchmark = 1.0 (1:1 Ratio)<br>
10
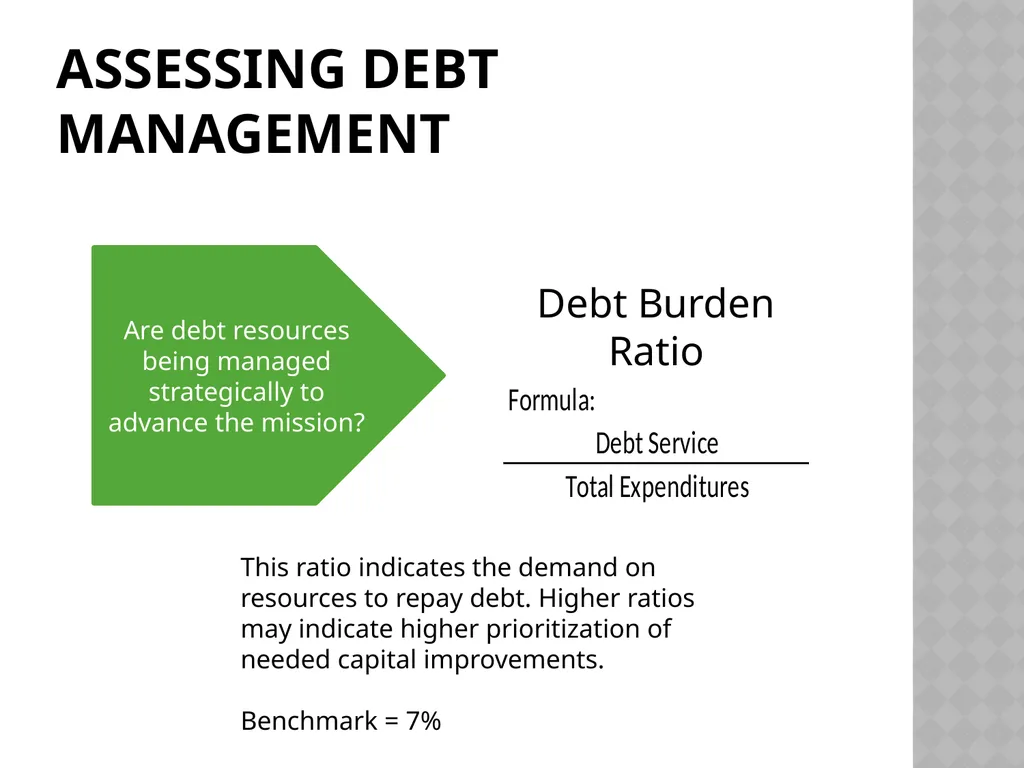
Assessing debt management Debt Burden Ratio Are debt resources being managed strategically to advance the mission? This ratio indicates the demand on resources to repay debt. Higher ratios may indicate higher prioritization of needed capital improvements.
Benchmark = 7%<br>
11
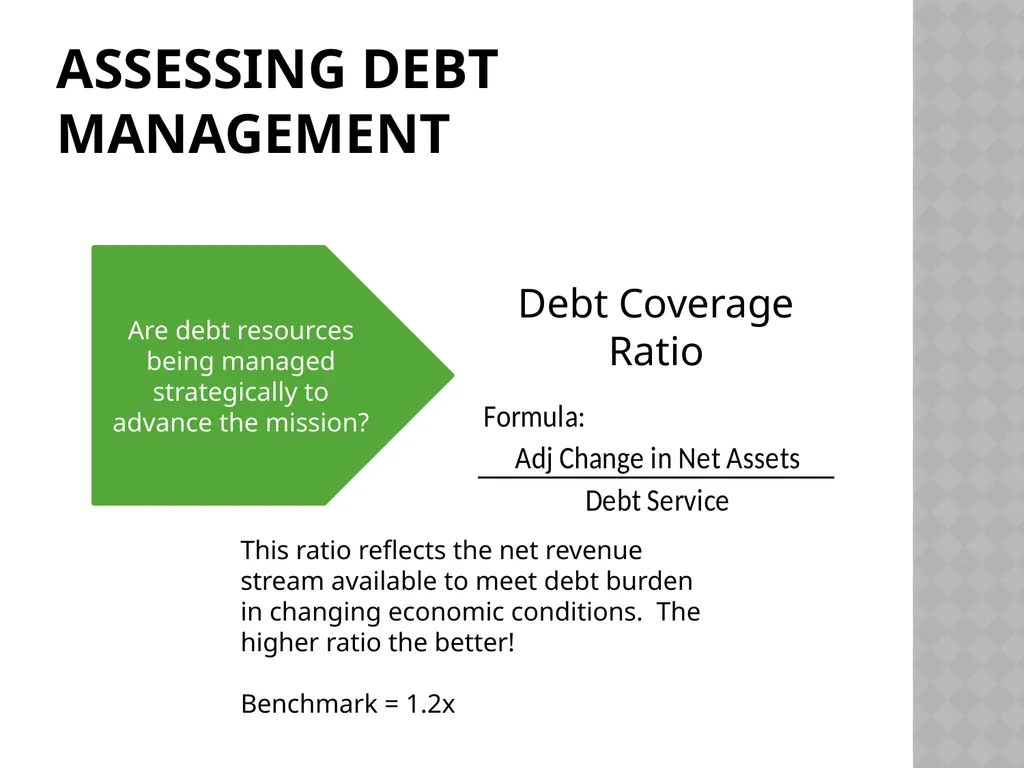
Assessing debt management Debt Coverage Ratio Are debt resources being managed strategically to advance the mission? This ratio reflects the net revenue stream available to meet debt burden in changing economic conditions. The higher ratio the better!
Benchmark = 1.2x<br>
12
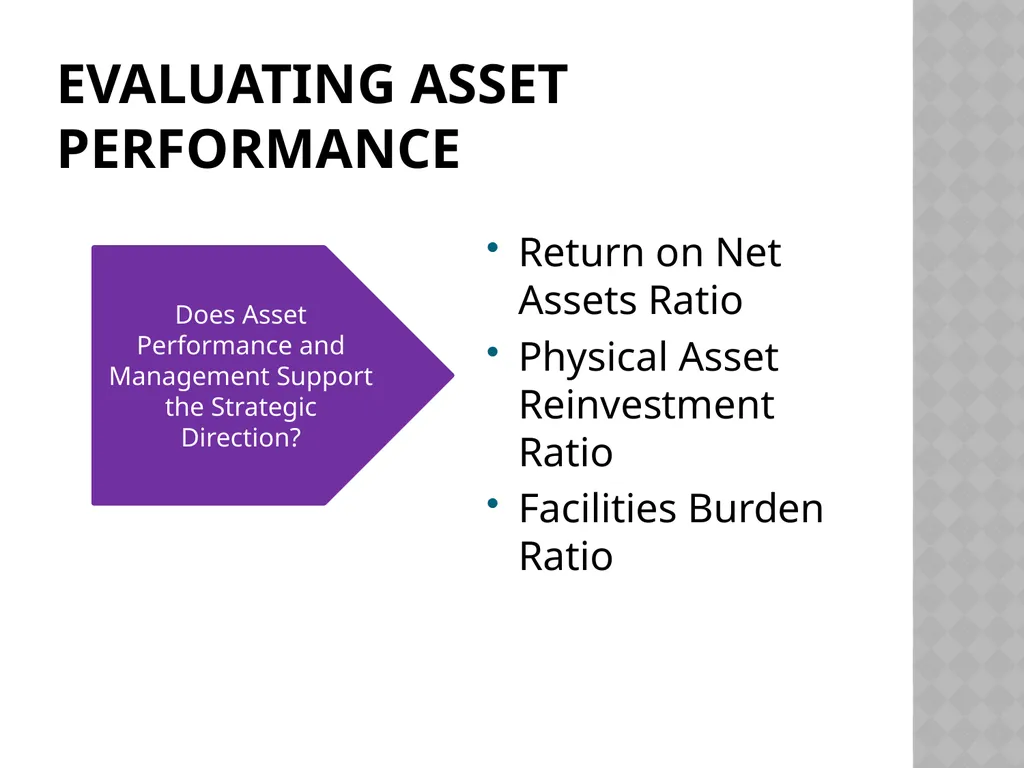
Evaluating asset performance Does Asset Performance and Management Support the Strategic Direction? Return on Net Assets Ratio
Physical Asset Reinvestment Ratio
Facilities Burden Ratio<br>
13
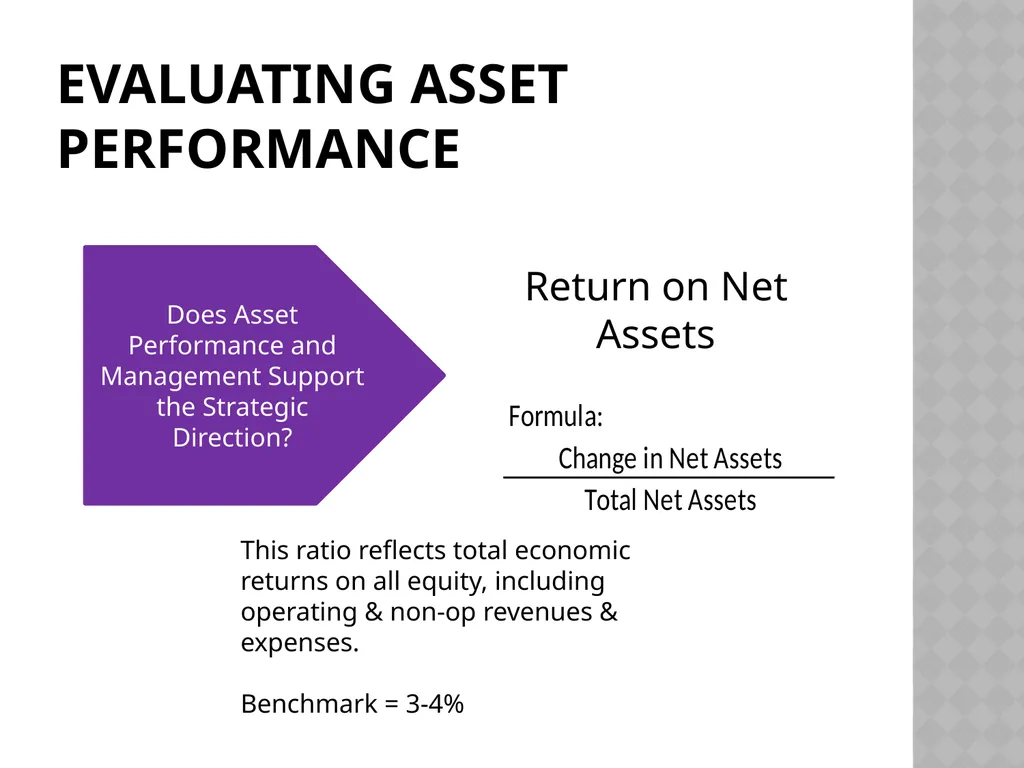
Evaluating asset performance Return on Net Assets This ratio reflects total economic returns on all equity, including operating & non-op revenues & expenses.
Benchmark = 3-4% Does Asset Performance and Management Support the Strategic Direction?<br>
14
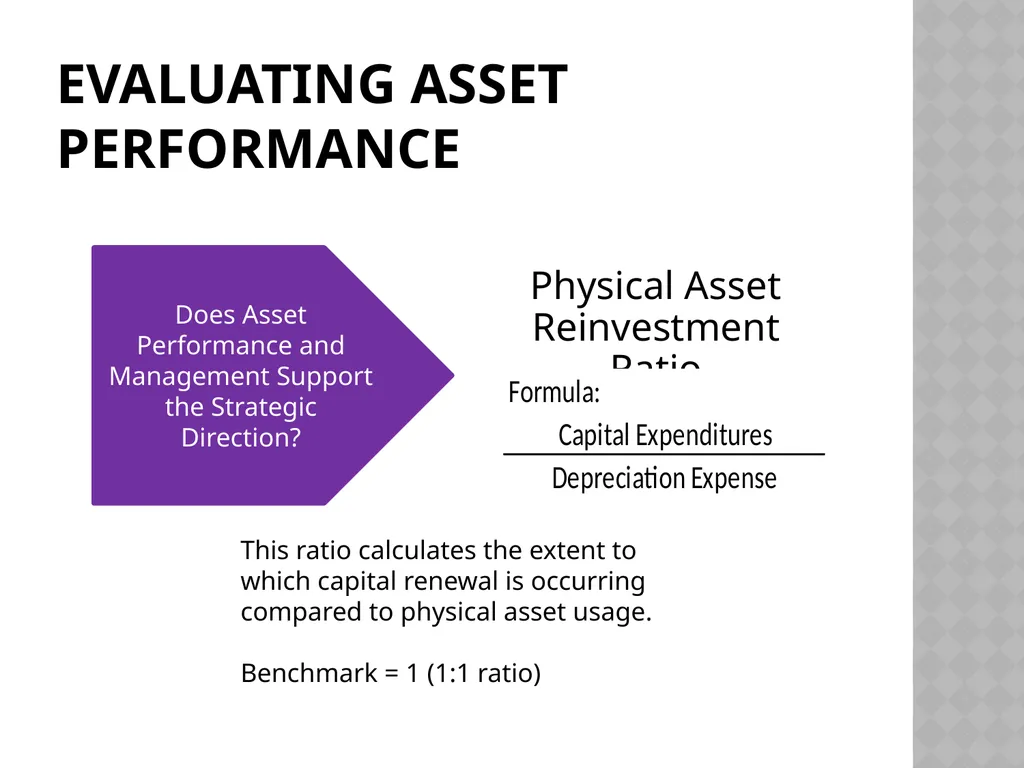
Evaluating asset performance Physical Asset Reinvestment Ratio This ratio calculates the extent to which capital renewal is occurring compared to physical asset usage.
Benchmark = 1 (1:1 ratio) Does Asset Performance and Management Support the Strategic Direction?<br>
15
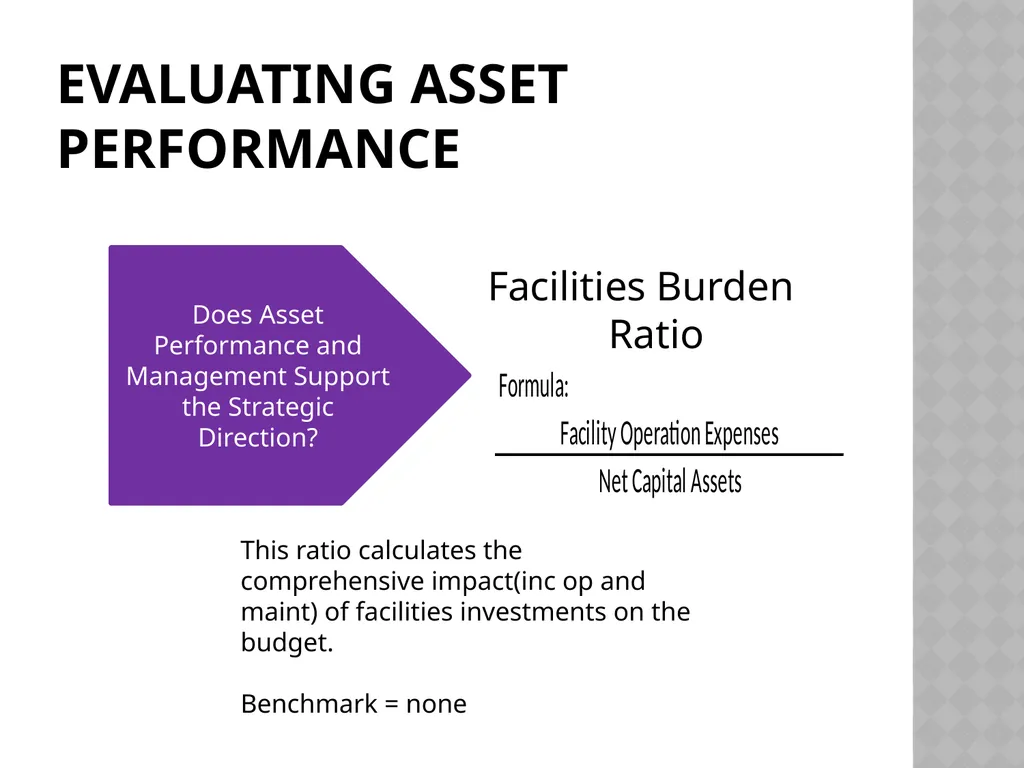
Evaluating asset performance Facilities Burden Ratio This ratio calculates the comprehensive impact(inc op and maint) of facilities investments on the budget.
Benchmark = none Does Asset Performance and Management Support the Strategic Direction?<br>
16
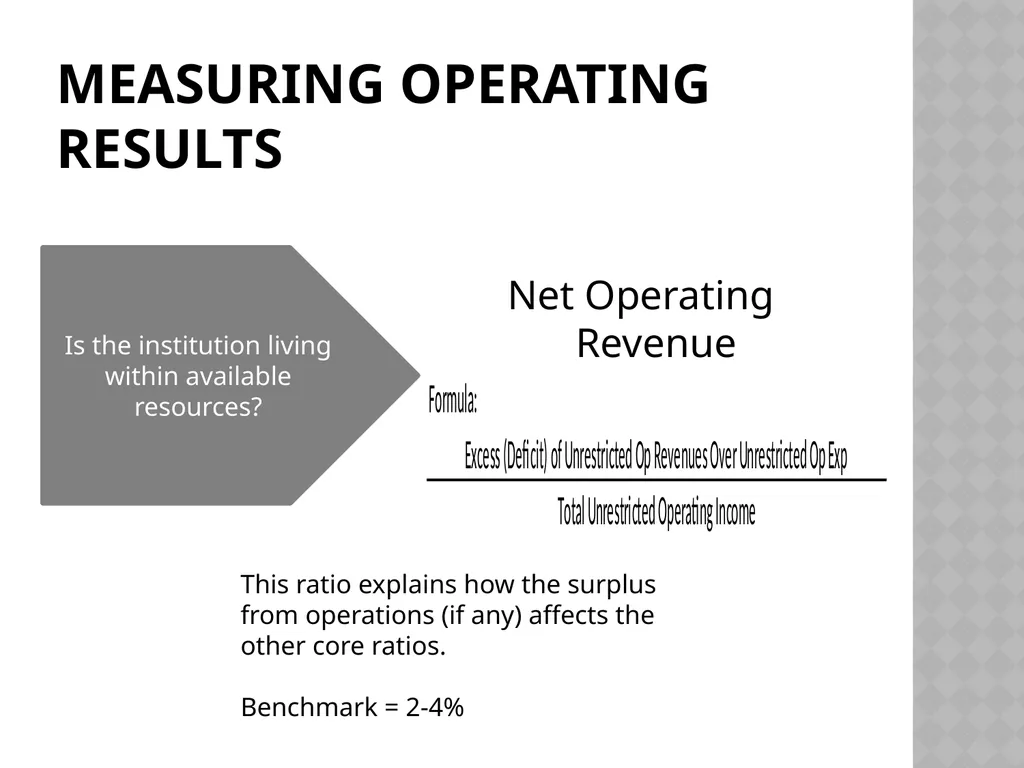
Measuring operating results Net Operating Revenue Is the institution living within available resources? This ratio explains how the surplus from operations (if any) affects the other core ratios.
Benchmark = 2-4%<br>
17
Sample institution Ratios<br>
18
Composite financial index Combines the 4 core ratios into a single score
Primary reserve ratio
Viability ratio
Return on net assets ratio
Net operating revenues ratio
Attempts to quantify the
overall financial well being of
the institution<br>
19
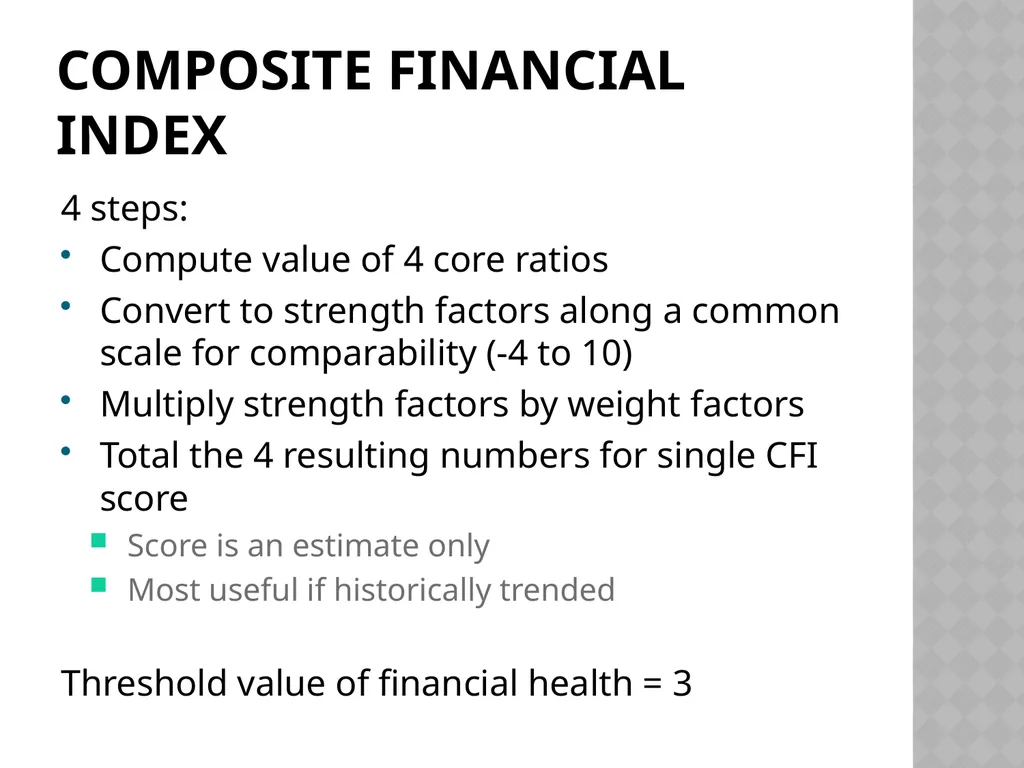
Composite Financial Index 4 steps:
Compute value of 4 core ratios
Convert to strength factors along a common scale for comparability (-4 to 10)
Multiply strength factors by weight factors
Total the 4 resulting numbers for single CFI score
Score is an estimate only
Most useful if historically trended
Threshold value of financial health = 3<br>
20
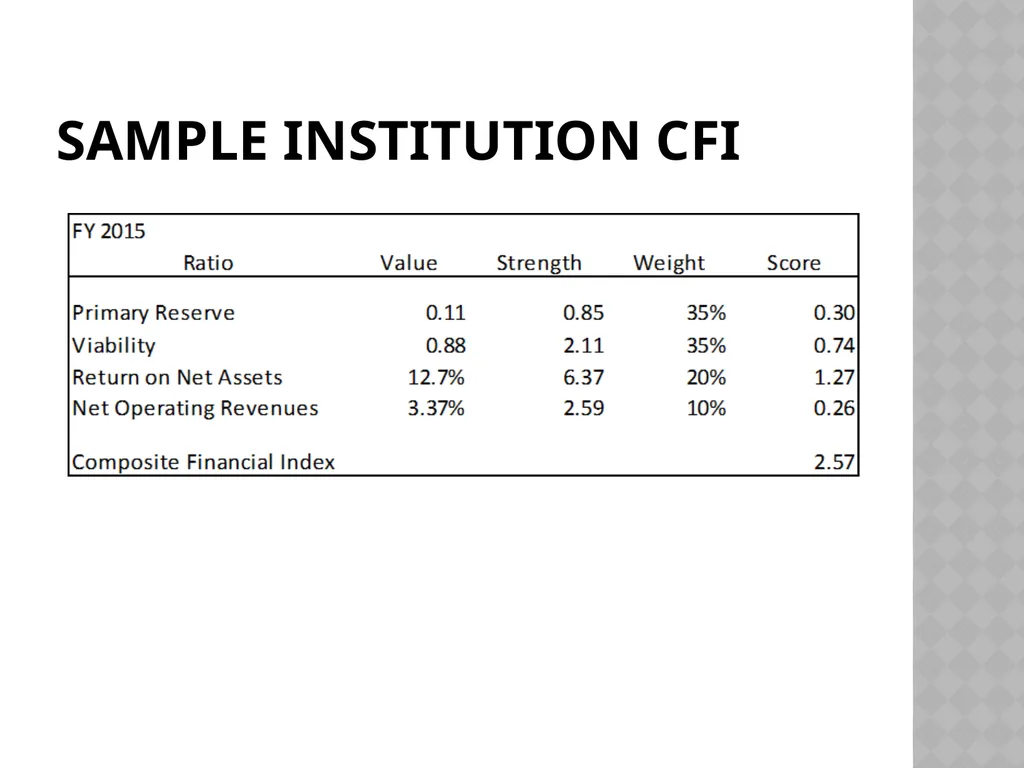
Sample institution cfi<br>
21
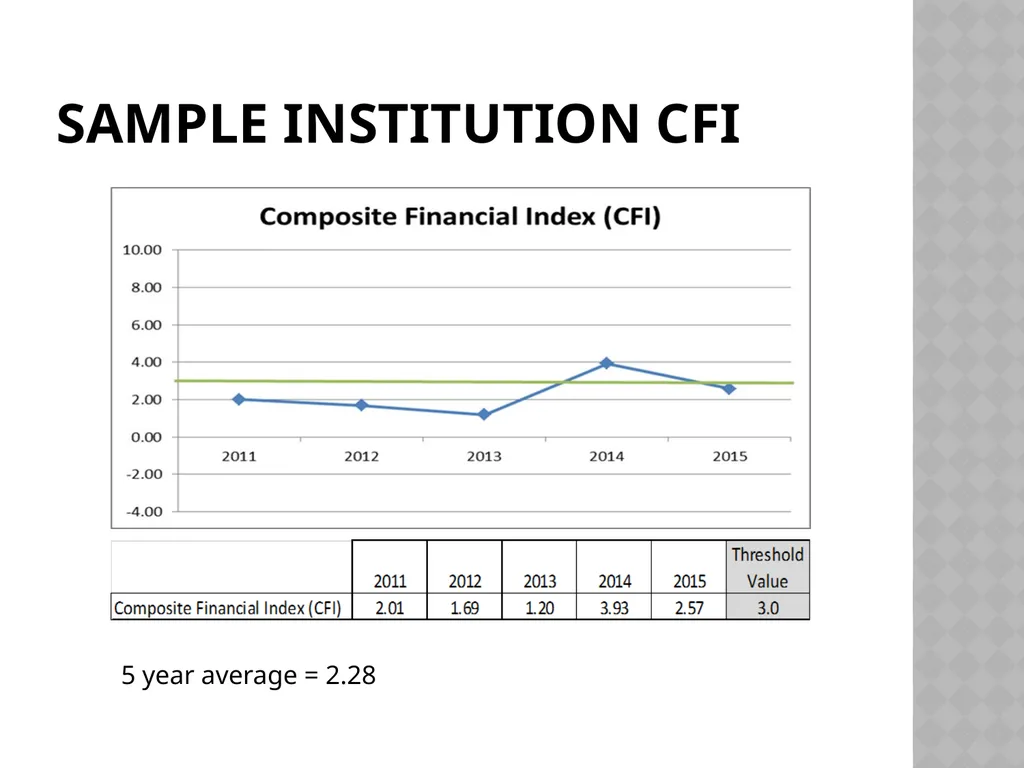
Sample institution cfi 5 year average = 2.28<br>
22
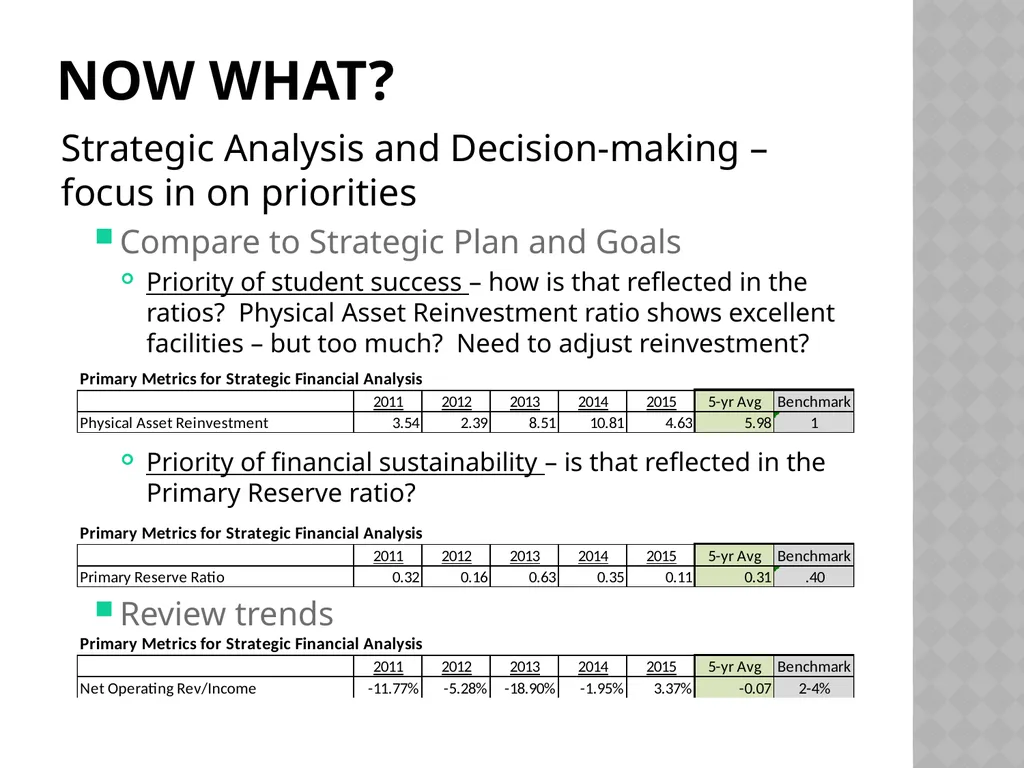
Now What? Strategic Analysis and Decision-making – focus in on priorities
Compare to Strategic Plan and Goals
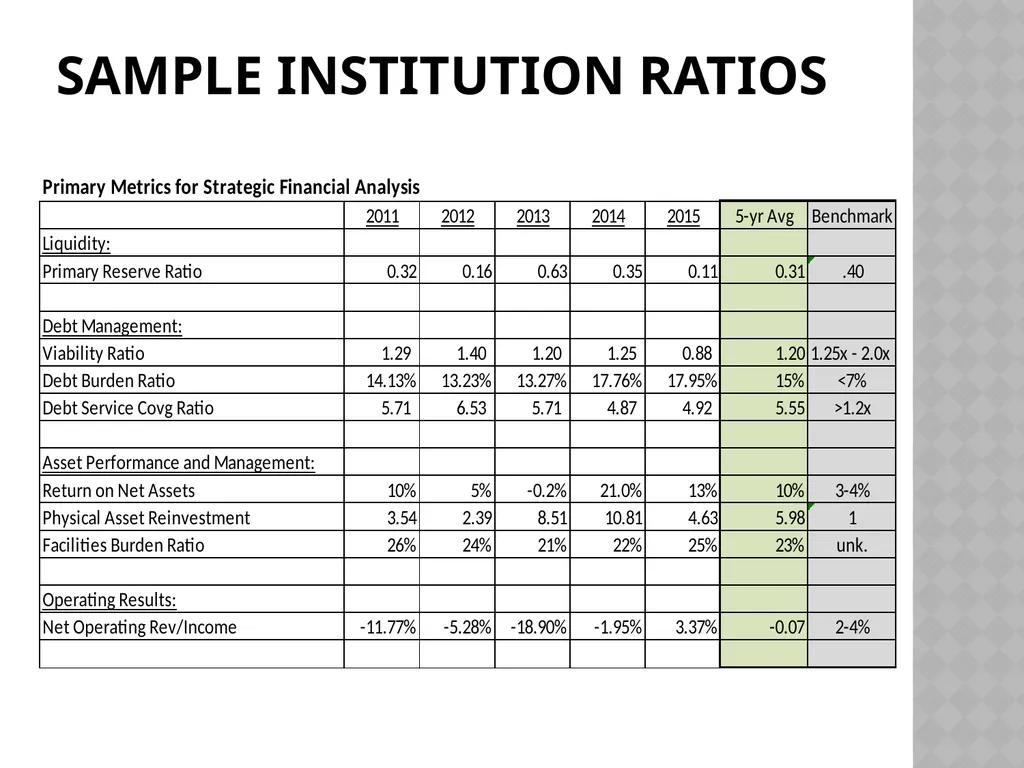
Priority of student success – how is that reflected in the ratios? Physical Asset Reinvestment ratio shows excellent facilities – but too much? Need to adjust reinvestment?
Priority of financial sustainability – is that reflected in the Primary Reserve ratio?
Review trends<br>
23
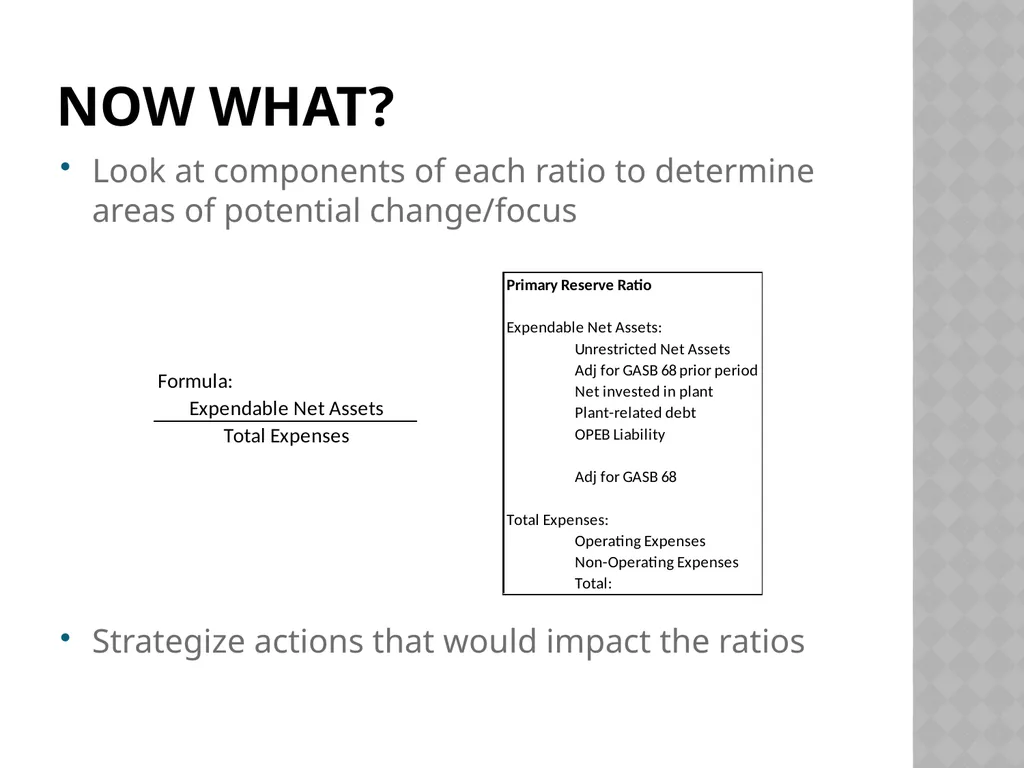
Now what? Look at components of each ratio to determine areas of potential change/focus
Strategize actions that would impact the ratios<br>
24
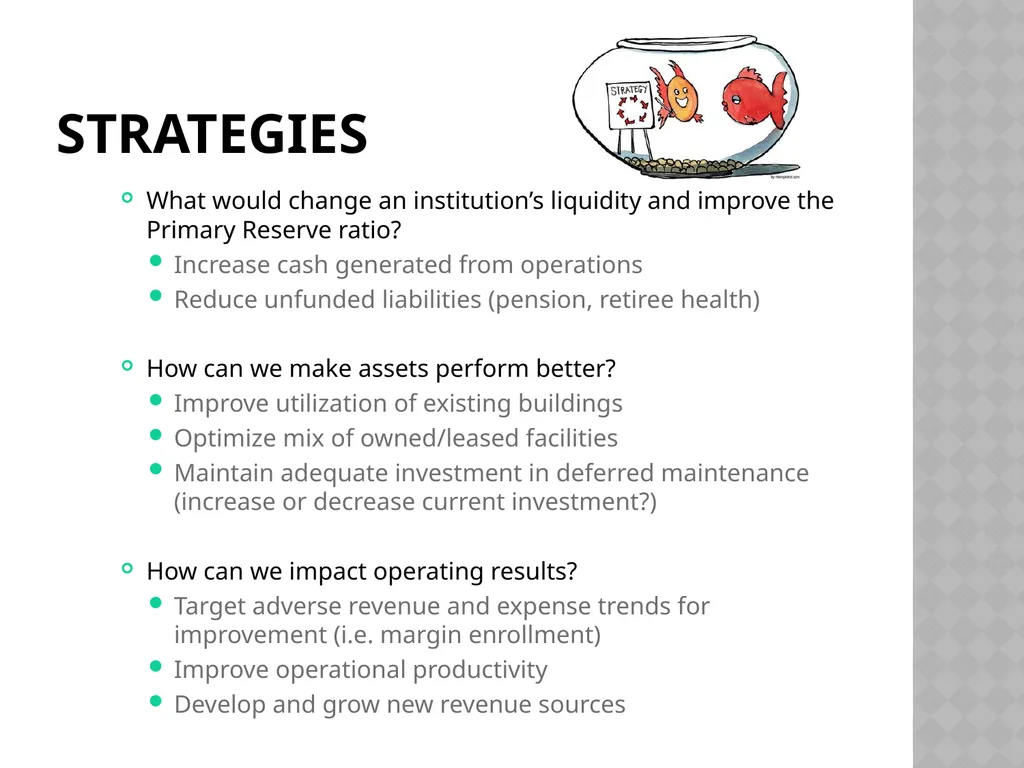
Strategies What would change an institution’s liquidity and improve the Primary Reserve ratio?
Increase cash generated from operations
Reduce unfunded liabilities (pension, retiree health)
How can we make assets perform better?
Improve utilization of existing buildings
Optimize mix of owned/leased facilities
Maintain adequate investment in deferred maintenance (increase or decrease current investment?)
How can we impact operating results?
Target adverse revenue and expense trends for improvement (i.e. margin enrollment)
Improve operational productivity
Develop and grow new revenue sources<br>
25
My Goals for this tool at pcc: Better manage financial health with a larger variety of tools
Make data-driven decisions (i.e. Facilities)
Align resource allocation with strategic goals
Support responses to Board, senior leaders and stakeholders
Quantify results of strategic changes<br>
26
Resources Prager, Sealy & Co. / KPMG. (2010). Strategic Financial Analysis for Higher Education (Vol. 7th Edition). USA: KPMG.
Salluzzo, R. (2014). Partner - Attain, LLC. "Do you know the financial health of your institution?". Charlotte, NC.
Thinking Strategically About UCLA's Resources - Senate Budget Seminar #4. (2013, December 6). Retrieved January 2016, from www.senate.ucla.edu/documents/senatebudget presentation12-06-2013.pdf<br>