Assessing SES differences in life expectancy: Issues in using longitudinal data Elsie Pamuk, Kim Lochner, Nat Schenker, Van Parsons, Ellen Kramarow National Center for Health Statistics Centers for Disease Control and Prevention Why is this
"Assessing SES differences in life expectancy:" is the property of its rightful owner. Permission is granted to
download and print the materials on this website for personal, non-commercial use only, and to display it
on your personal computer provided you do not modify the materials and that you retain all copyright
notices contained in the materials. By downloading content from our website, you accept the terms of this
agreement.
Presentation Transcript
01
Assessing SES differences in life expectancy: Issues in using longitudinal data Elsie Pamuk, Kim Lochner, Nat Schenker,
Van Parsons, Ellen Kramarow
National Center for Health Statistics
Centers for Disease Control and Prevention<br>
02
Why is this important? Socioeconomic disparities
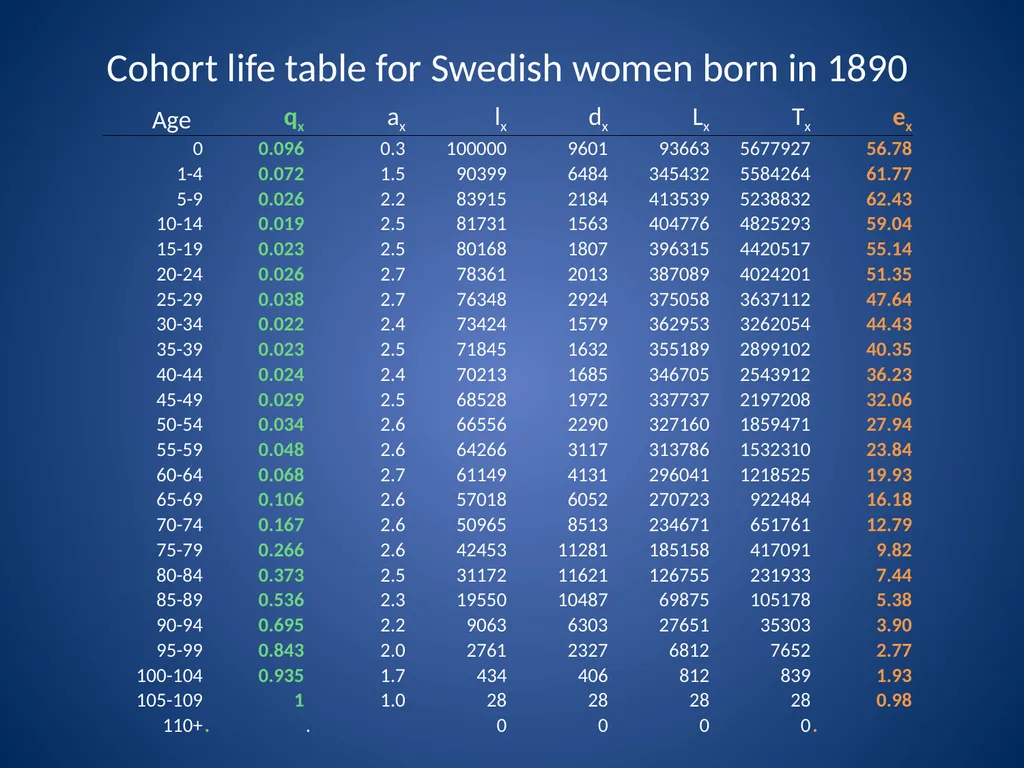
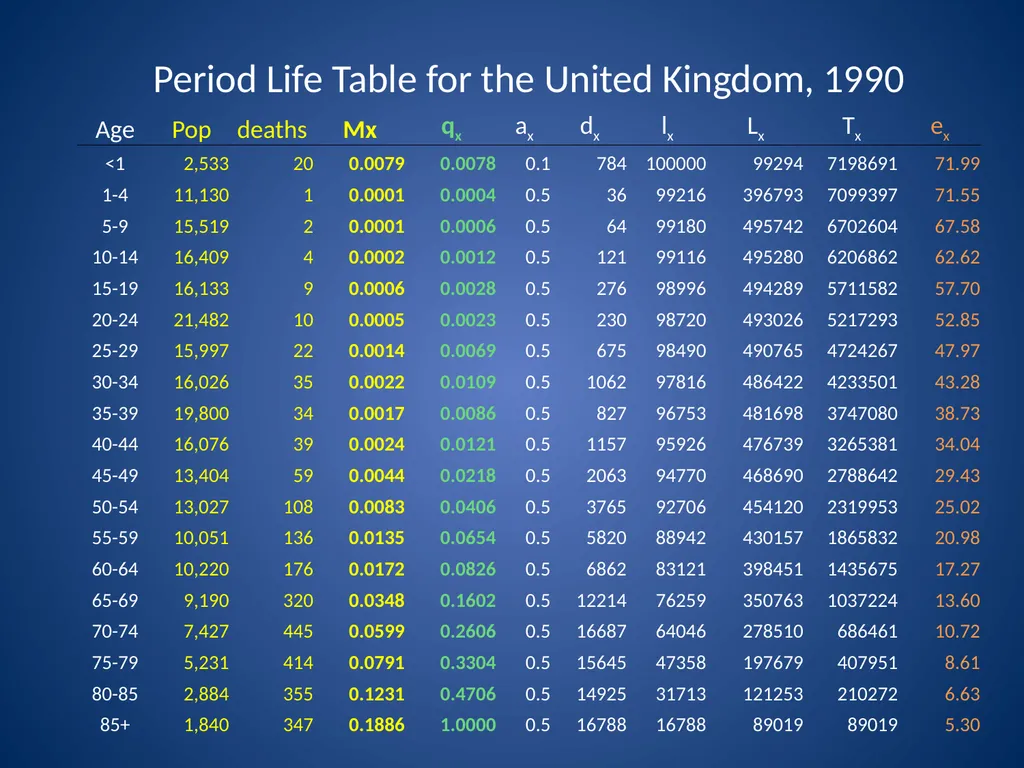
Life expectancy
Longitudinal data<br>
03
Socioeconomic disparities Focus of health policy
“Inequalities in income and education
underlie many health disparities in
the United States.”
Healthy People 2010: Understanding and Improving Health<br>
04
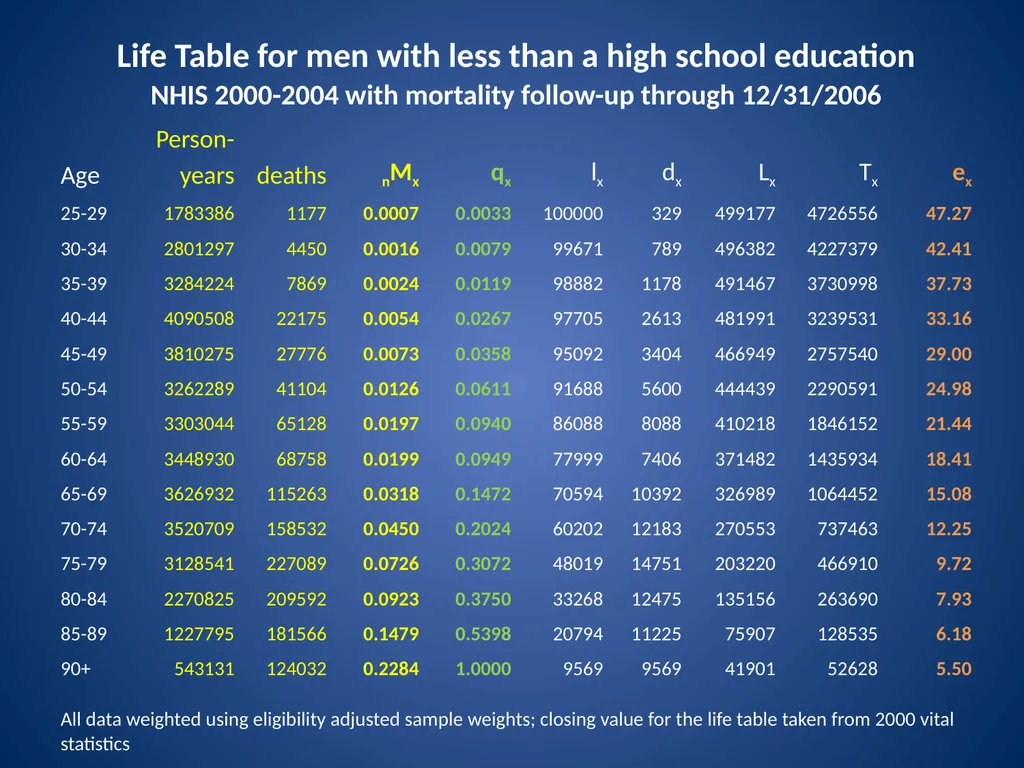
Life Expectancy Useful (and intuitive) measure for summarizing mortality rates across all ages
Derived from a life table<br>
05
Longitudinal data Allows the calculation of life expectancies for groups defined by survey characteristics
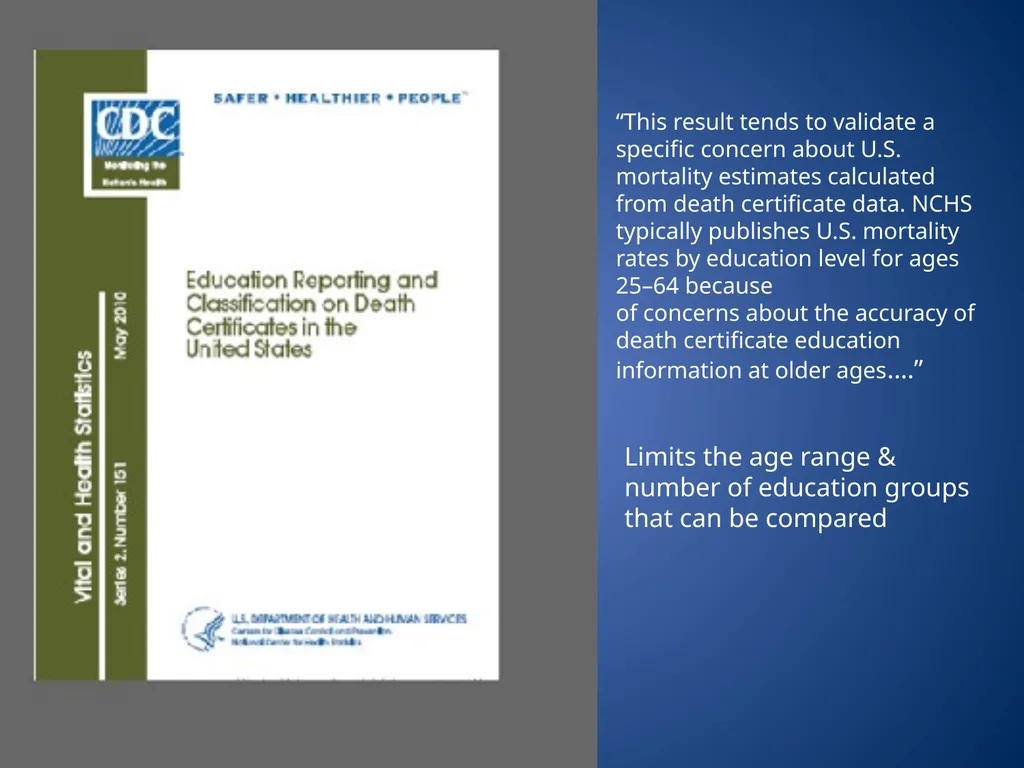
Limits the age range &
number of education groups
that can be compared “This result tends to validate a specific concern about U.S. mortality estimates calculated from death certificate data. NCHS typically publishes U.S. mortality rates by education level for ages 25–64 because
of concerns about the accuracy of death certificate education information at older ages….”<br>
07
Issues arising from using
longitudinal data to estimate life expectancies<br>
08
Data quality<br>
09
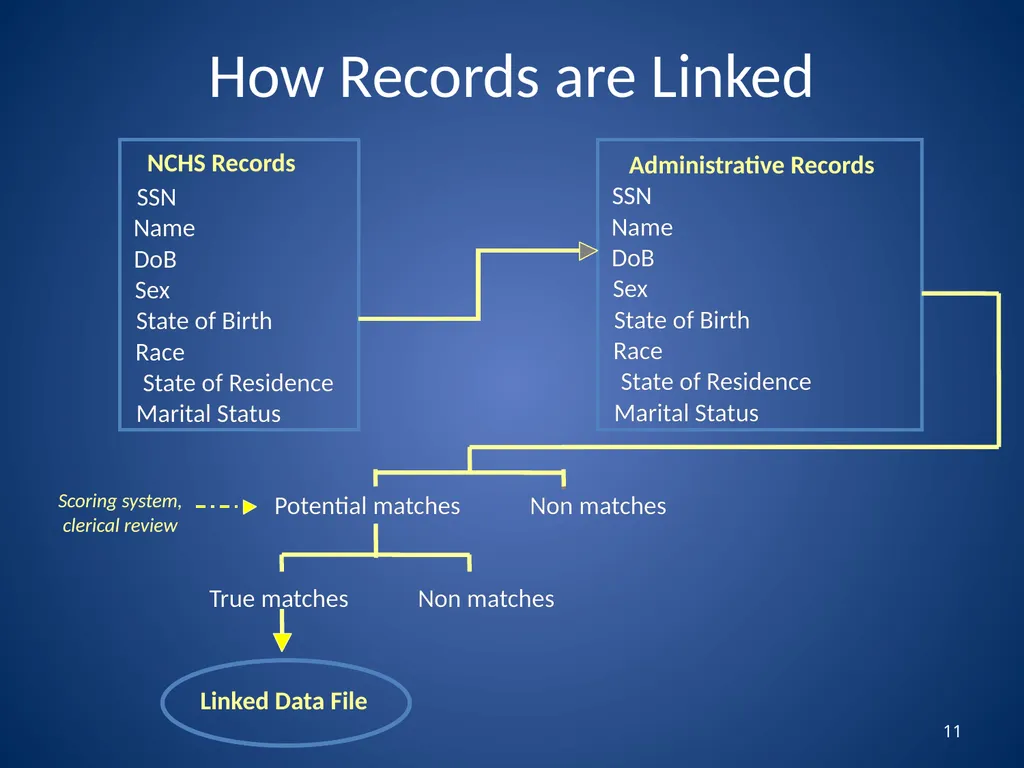
How Records are Linked 11<br>
10
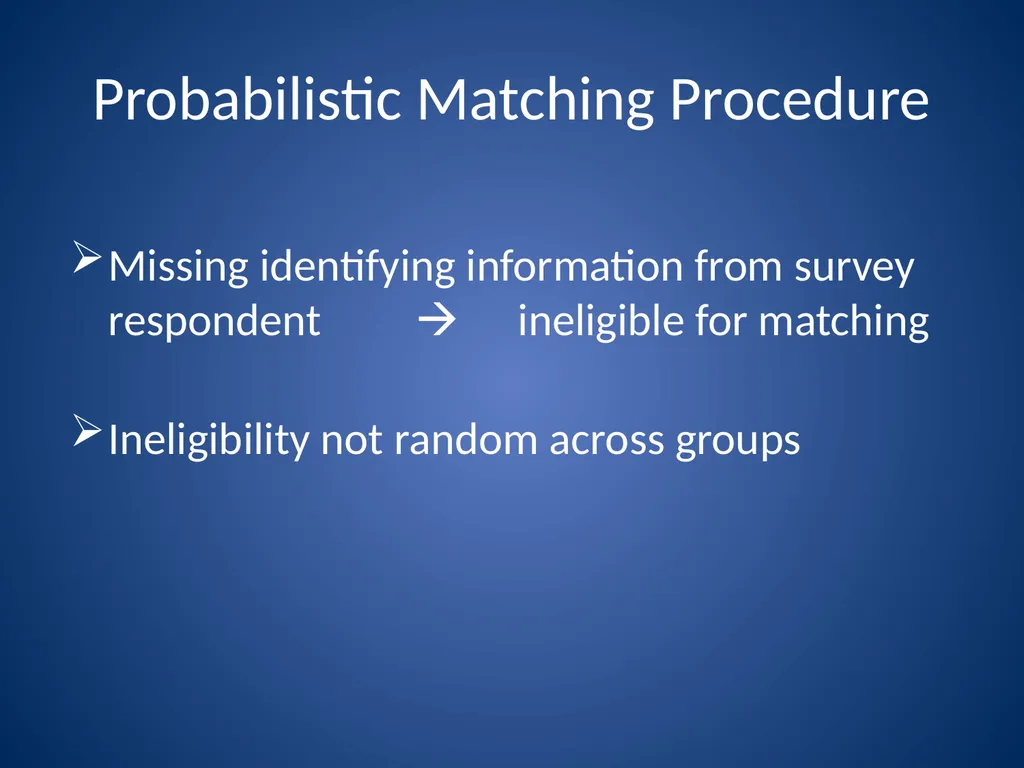
Probabilistic Matching Procedure Missing identifying information from survey respondent ineligible for matching
Ineligibility not random across groups<br>
11
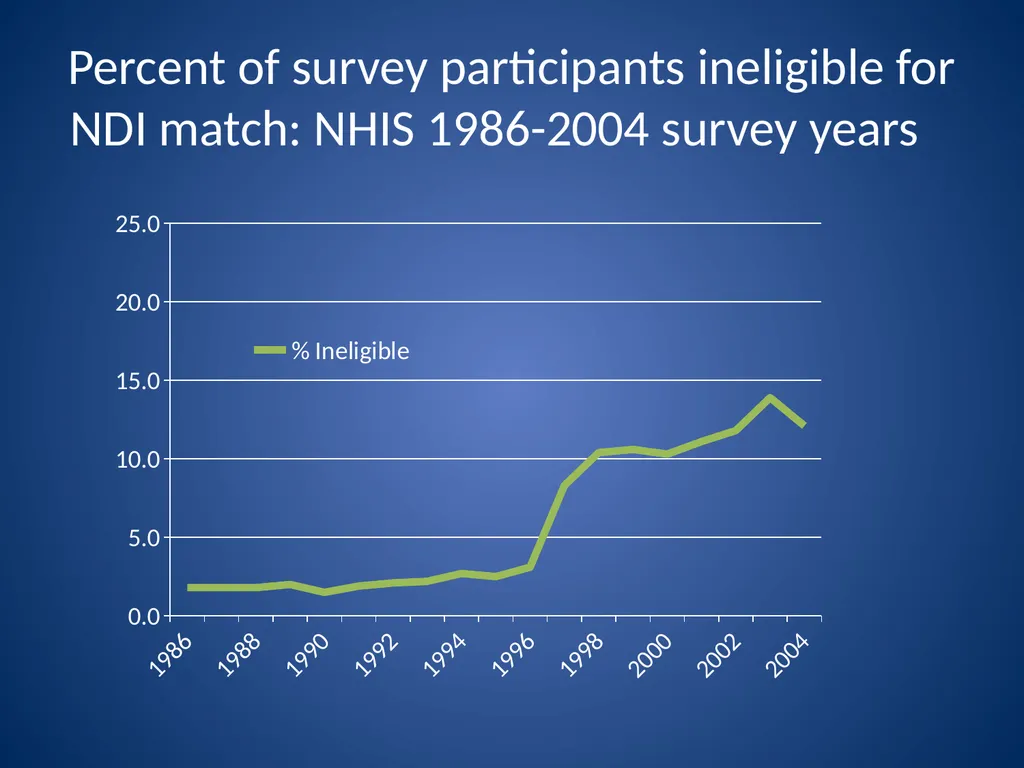
Percent of survey participants ineligible for NDI match: NHIS 1986-2004 survey years<br>
12
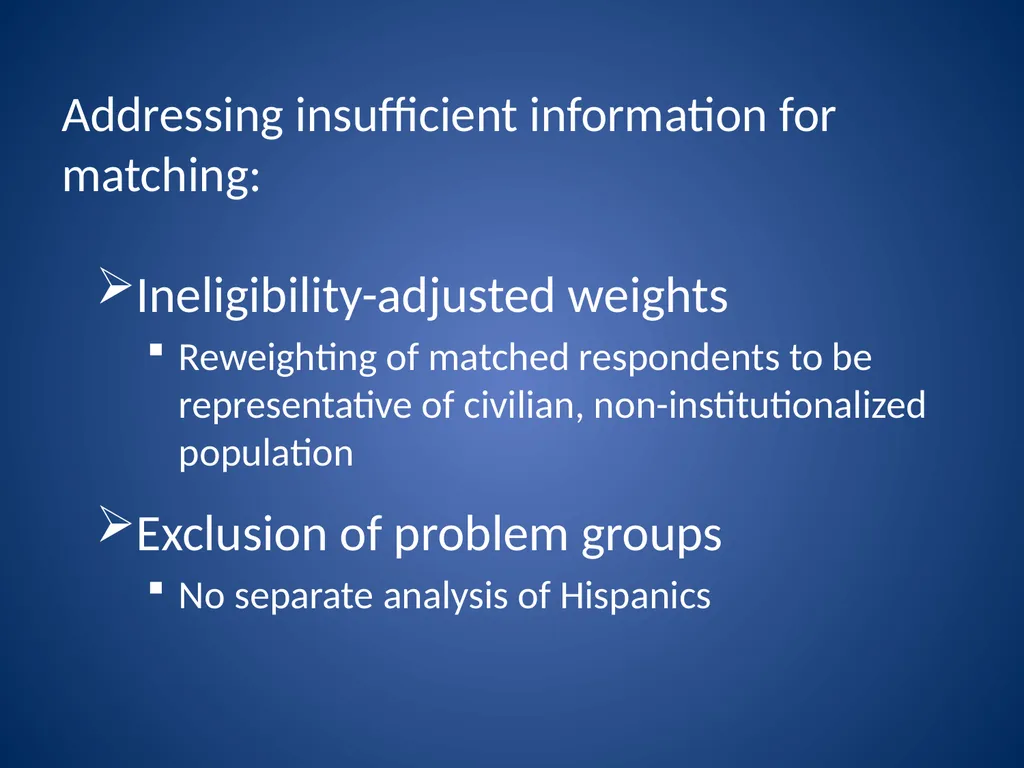
Addressing insufficient information for matching: Ineligibility-adjusted weights
Reweighting of matched respondents to be representative of civilian, non-institutionalized population
Exclusion of problem groups
No separate analysis of Hispanics<br>
13
Generating appropriate measures of sampling variability<br>
14
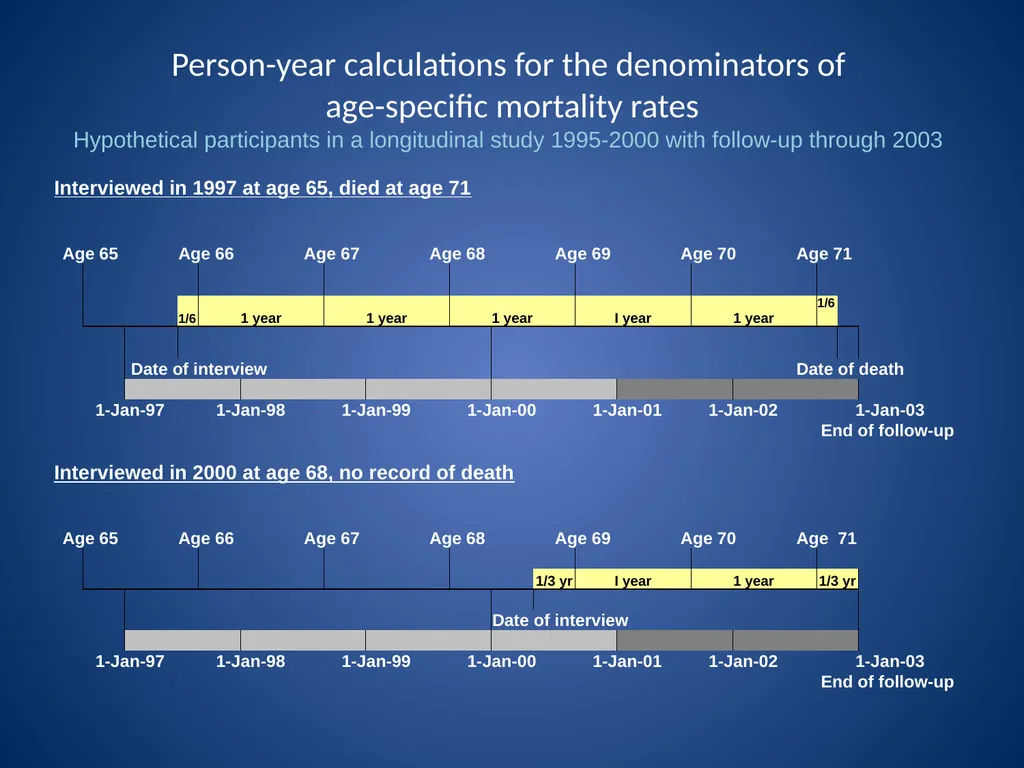
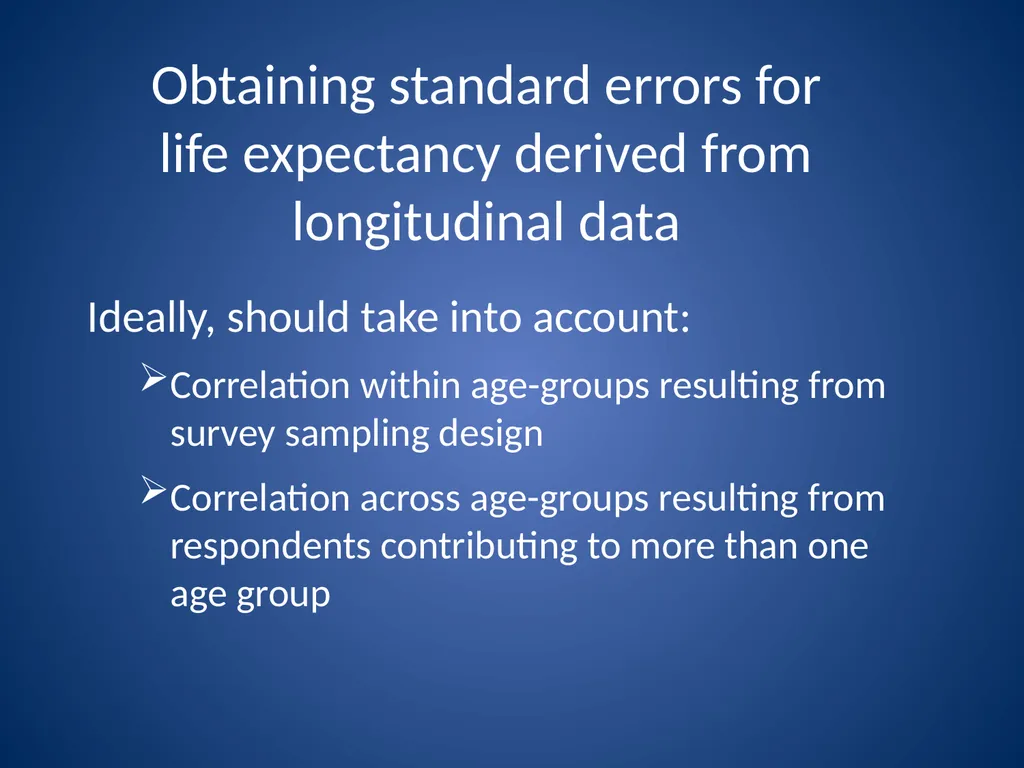
Obtaining standard errors for life expectancy derived from longitudinal data Ideally, should take into account:
Correlation within age-groups resulting from survey sampling design
Correlation across age-groups resulting from respondents contributing to more than one age group<br>
15
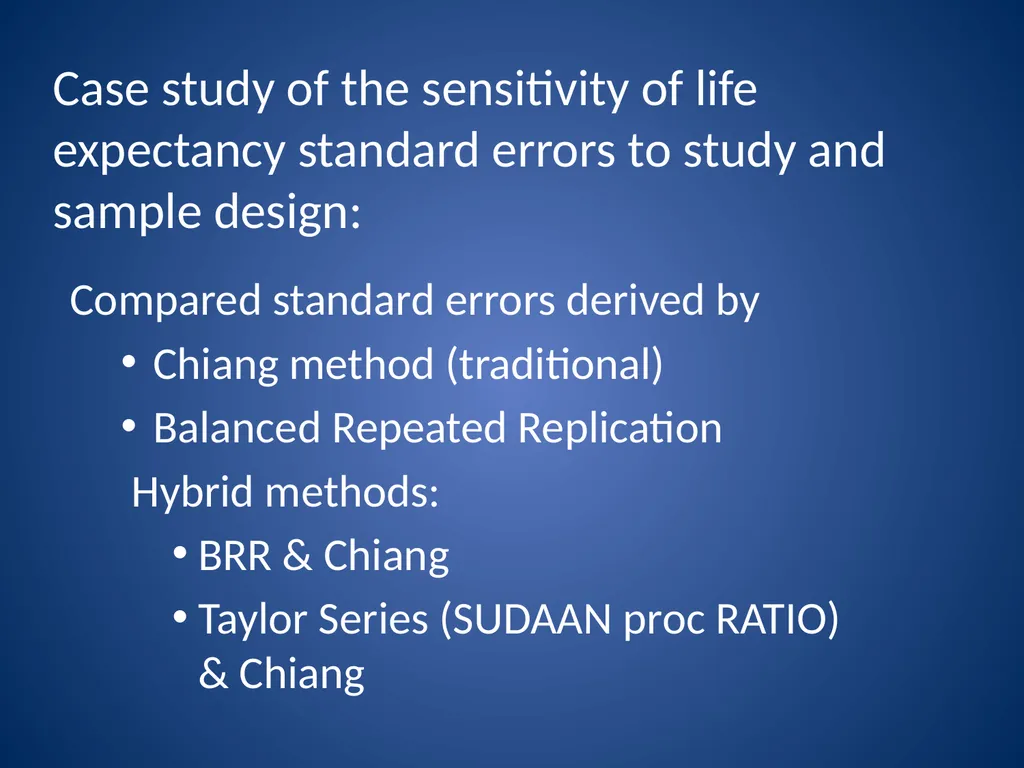
Case study of the sensitivity of life expectancy standard errors to study and sample design: Compared standard errors derived by
Chiang method (traditional)
Balanced Repeated Replication
Hybrid methods:
BRR & Chiang
Taylor Series (SUDAAN proc RATIO) & Chiang<br>
16
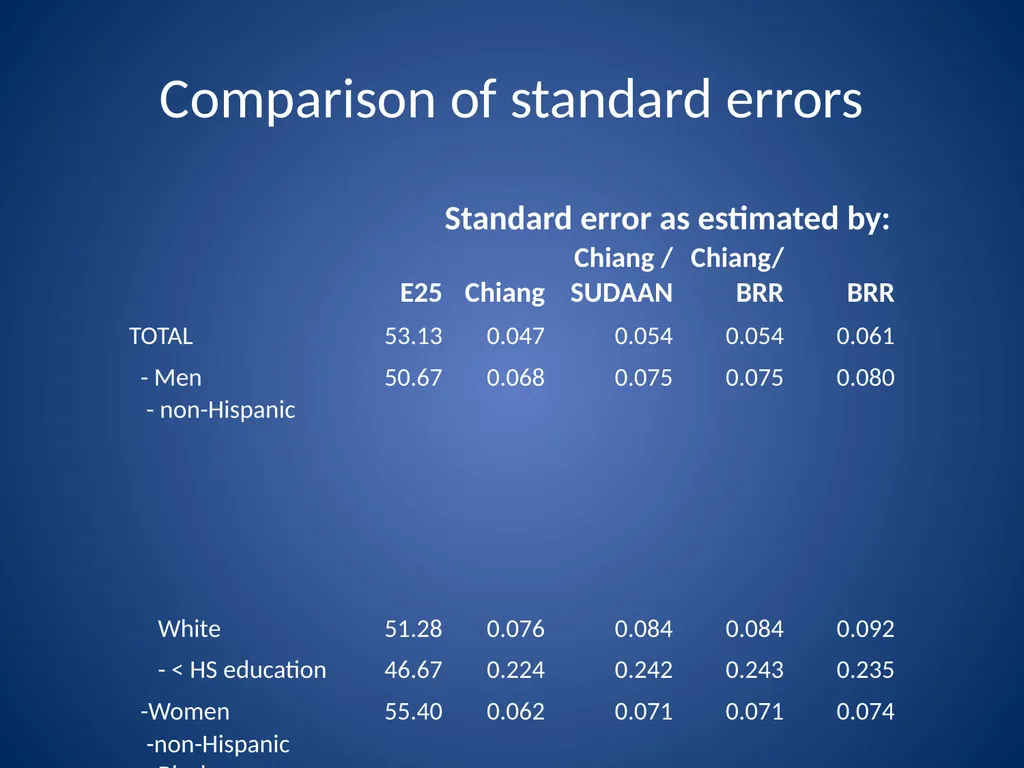
Comparison of standard errors<br>
17
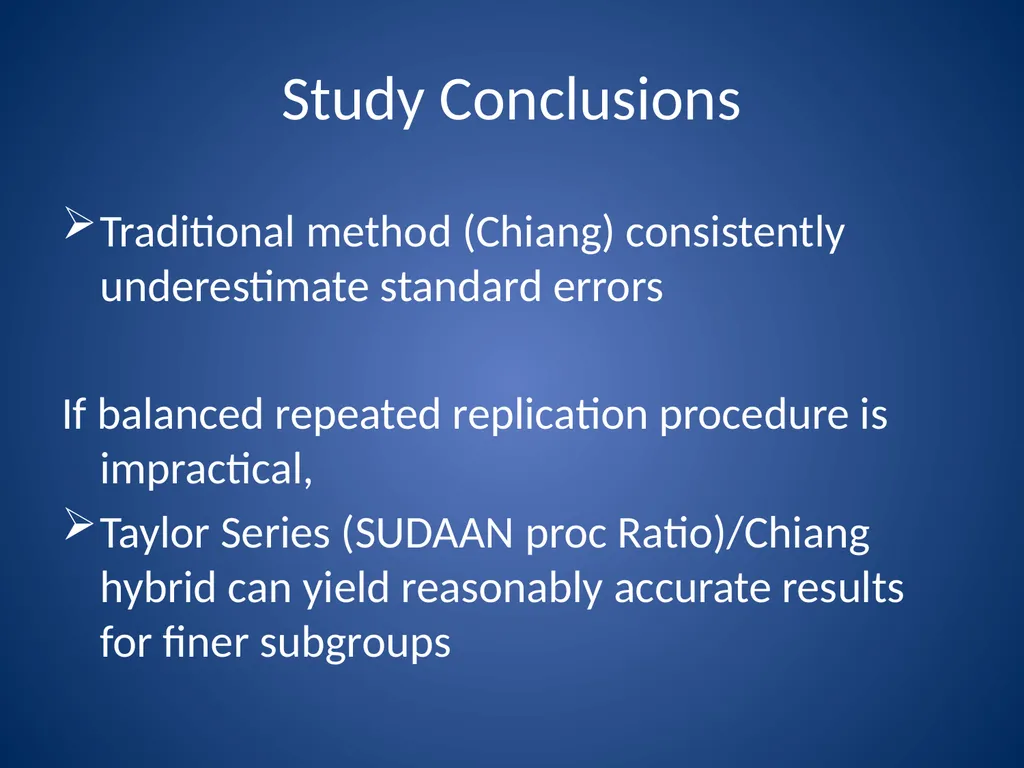
Study Conclusions Traditional method (Chiang) consistently underestimate standard errors
If balanced repeated replication procedure is impractical,
Taylor Series (SUDAAN proc Ratio)/Chiang hybrid can yield reasonably accurate results for finer subgroups<br>
18
Exclusion of the institutionalized population<br>
19
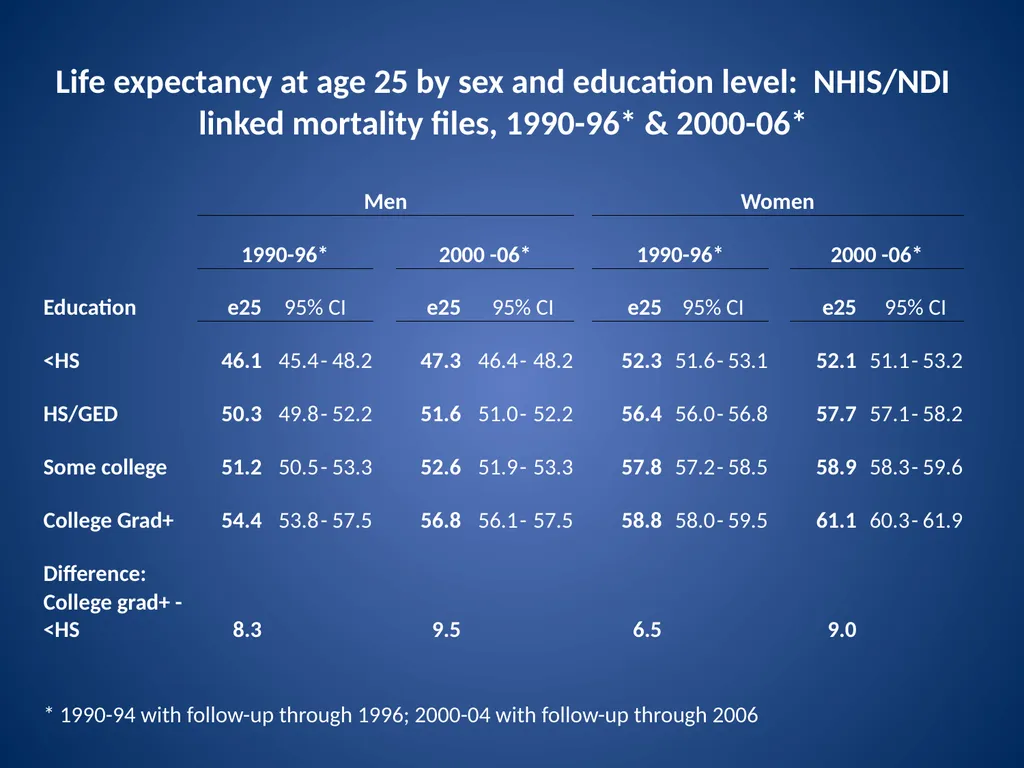
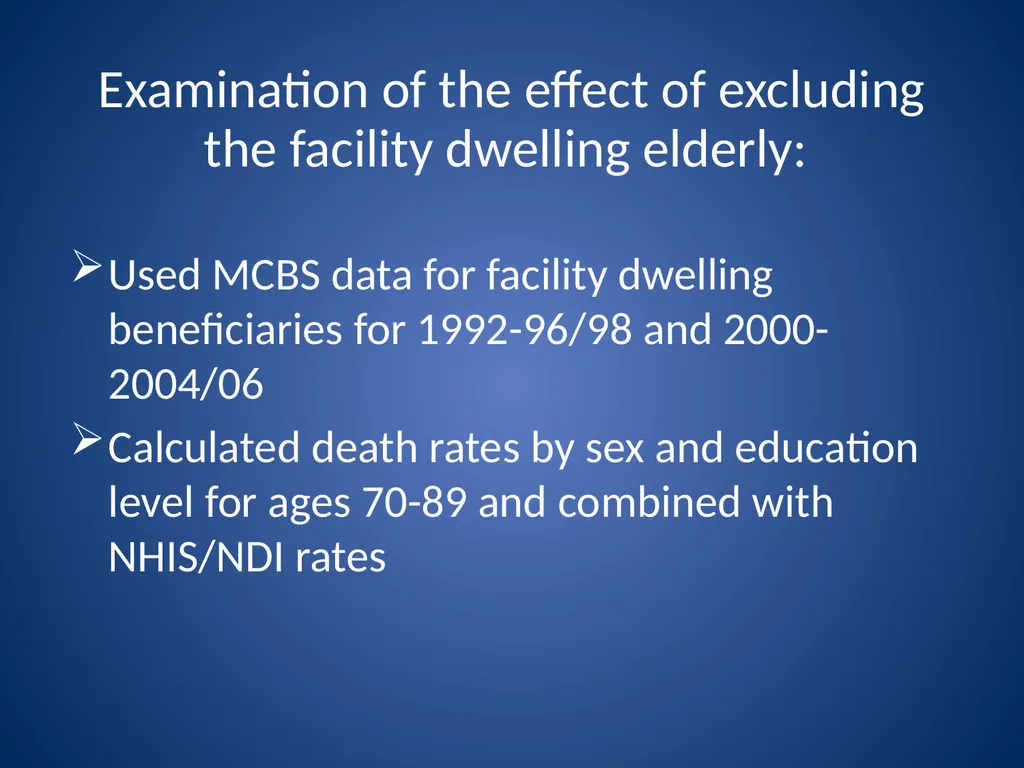
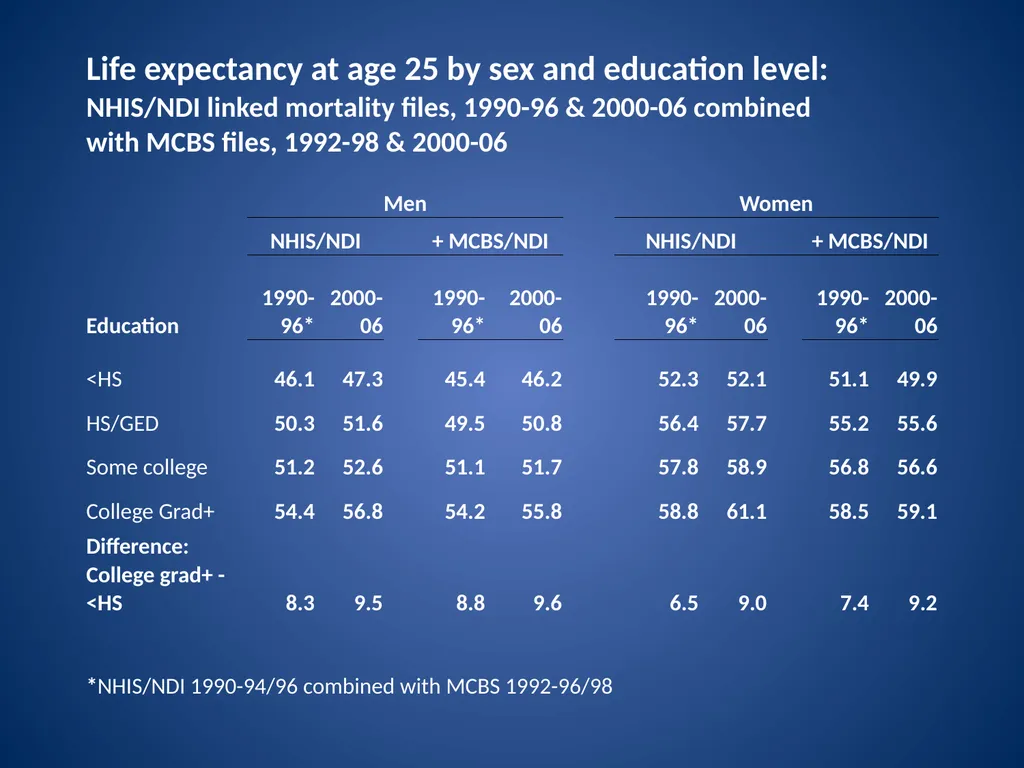
Examination of the effect of excluding the facility dwelling elderly: Used MCBS data for facility dwelling beneficiaries for 1992-96/98 and 2000-2004/06
Calculated death rates by sex and education level for ages 70-89 and combined with NHIS/NDI rates<br>
20
Using longitudinal data to examine SES differences in life expectancy Adds to our ability to routinely monitor SES differences in mortality
Brings with it several methodological challenges<br>