Benefits of Tracealyzer vs. Trace Compass Johan Kraft, Percepio AB Sept. 2, 2019 Tracealyzer v4.3.5 Copyright: Percepio AB License: Commercial, Proprietary Development start: 20042009 Trace Compass v5.0.0 Copyright: Ericsson and others
"Benefits of Tracealyzer vs. Trace Compass Johan" is the property of its rightful owner. Permission is granted to
download and print the materials on this website for personal, non-commercial use only, and to display it
on your personal computer provided you do not modify the materials and that you retain all copyright
notices contained in the materials. By downloading content from our website, you accept the terms of this
agreement.
Presentation Transcript
01
Benefits of Tracealyzer vs. Trace Compass Johan Kraft, Percepio AB
Sept. 2, 2019<br>
02
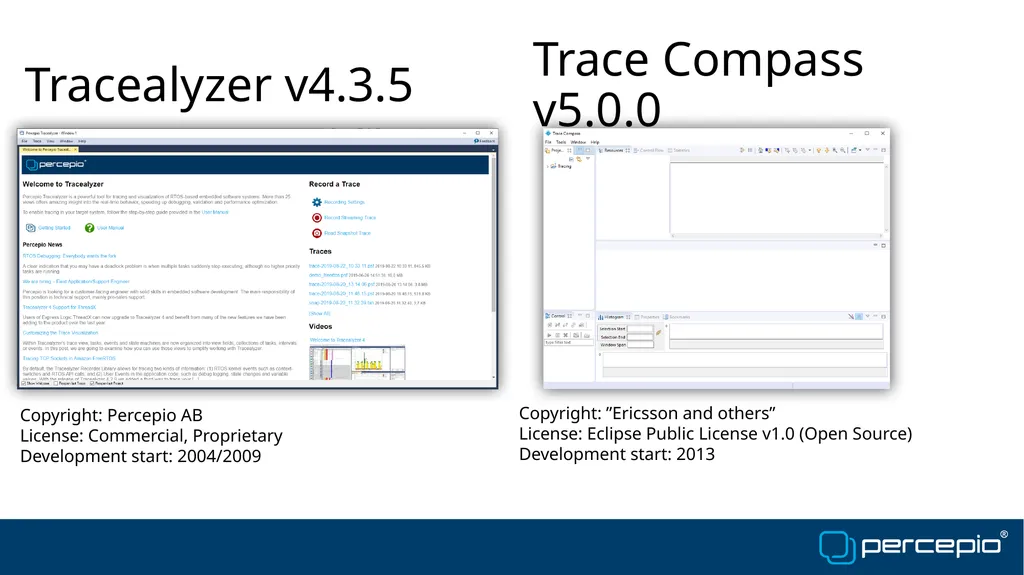
Tracealyzer v4.3.5 Copyright: Percepio AB
License: Commercial, Proprietary
Development start: 2004/2009 Trace Compass v5.0.0 Copyright: ”Ericsson and others”
License: Eclipse Public License v1.0 (Open Source)
Development start: 2013<br>
03
High Level Comparison<br>
04
Tracealyzer Product Benefits Easier workflow, designed for application developers
30+ graphical views, lightning fast and with better drill-down
True cross-platform analysis capability, not just focusing on Linux
A portable tracing library for supporting other RTOSes
Cloud-based device monitoring
Percepio Device Firmware Monitor, see https://percepio.com/dfm
Eclipse interoperability
https://marketplace.eclipse.org/content/percepio-trace-exporter<br>
05
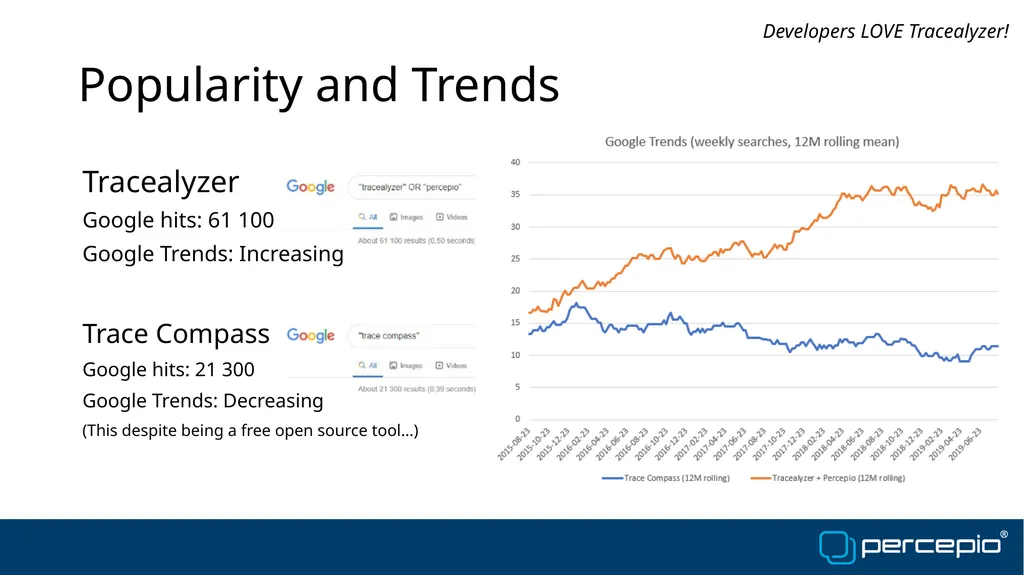
Popularity and Trends Tracealyzer
Google hits: 61 100
Google Trends: Increasing Trace Compass
Google hits: 21 300
Google Trends: Decreasing
(This despite being a free open source tool…) Developers LOVE Tracealyzer!<br>
06
Features and User Experience<br>
07
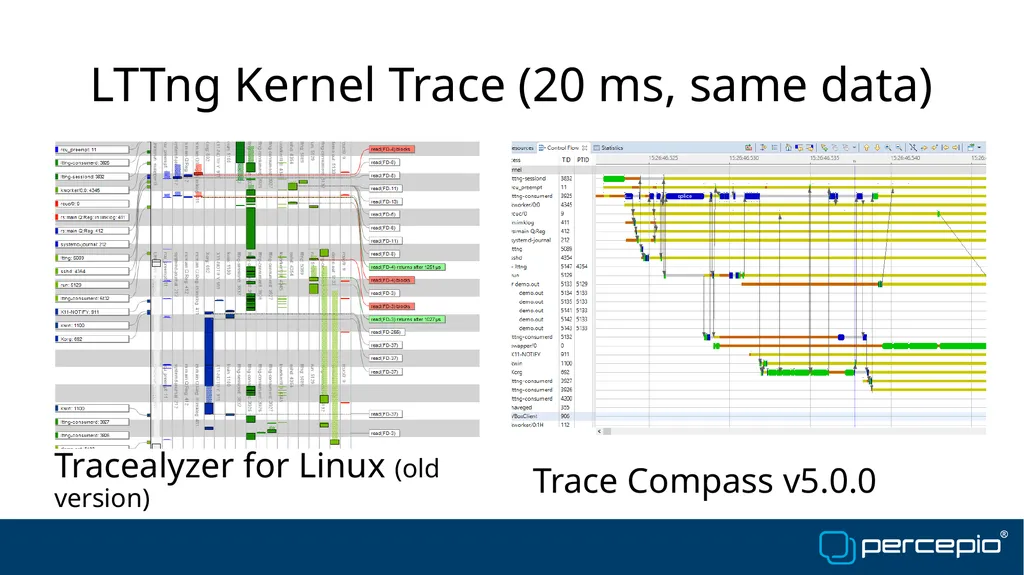
LTTng Kernel Trace (20 ms, same data) Tracealyzer for Linux (old version) Trace Compass v5.0.0<br>
08
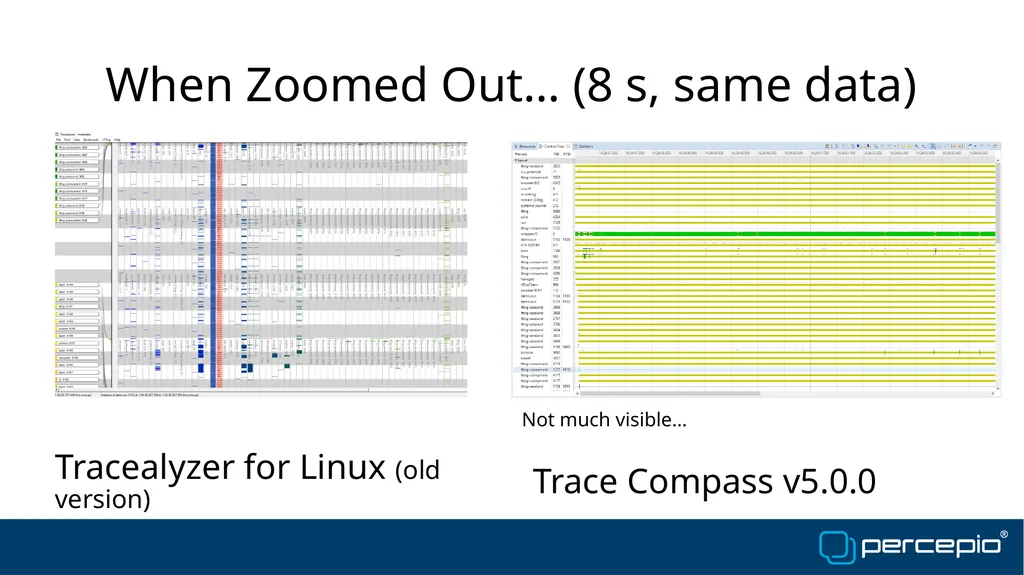
When Zoomed Out… (8 s, same data) Tracealyzer for Linux (old version) Trace Compass v5.0.0 Not much visible…<br>
09
Examples of Unique Tracealyzer Features Superior Trace View
More Application-focused Views
Communication Flow
User Event Signal Plot
State Machine Graph
“Actor Instance” Awareness for Profiling of Real-Time Tasks
Other things…
More extensive and user-friendly documentation, blog examples, etc.
Antialiasing etc. for better graphics
Parallel views always in sync (minimal update delay)
… All features are designed to be cross-platform.
Not just Linux, also VxWorks and other RTOSes<br>
10
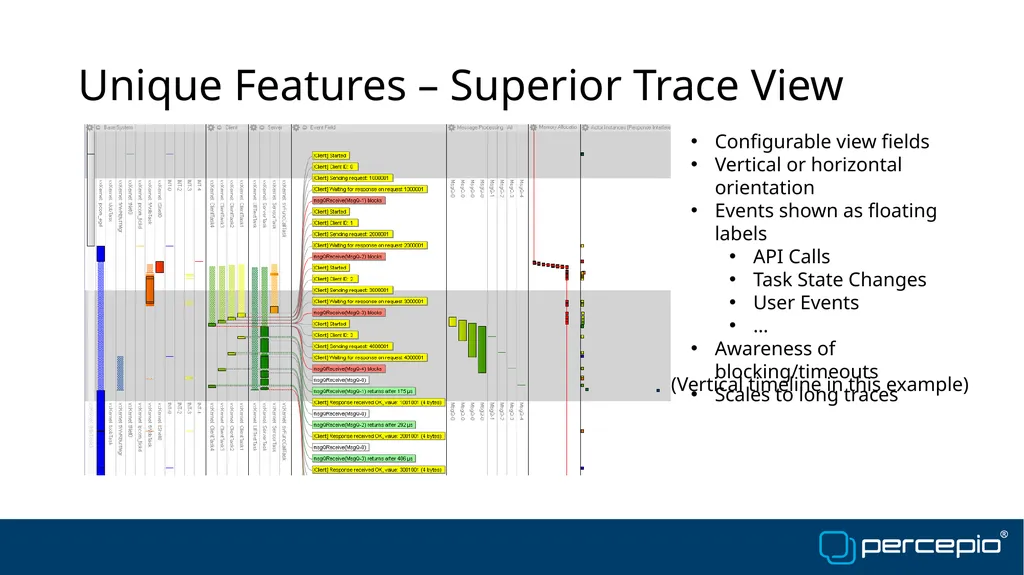
Unique Features – Superior Trace View (Vertical timeline in this example) Configurable view fields
Vertical or horizontal orientation
Events shown as floating labels
API Calls
Task State Changes
User Events
…
Awareness of blocking/timeouts
Scales to long traces<br>
11
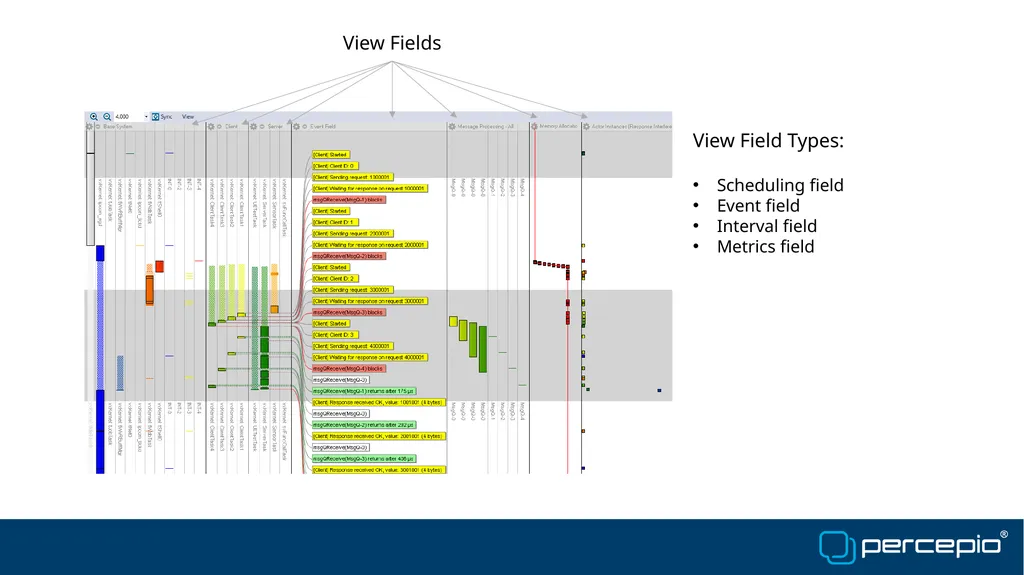
View Fields View Field Types:
Scheduling field
Event field
Interval field
Metrics field<br>
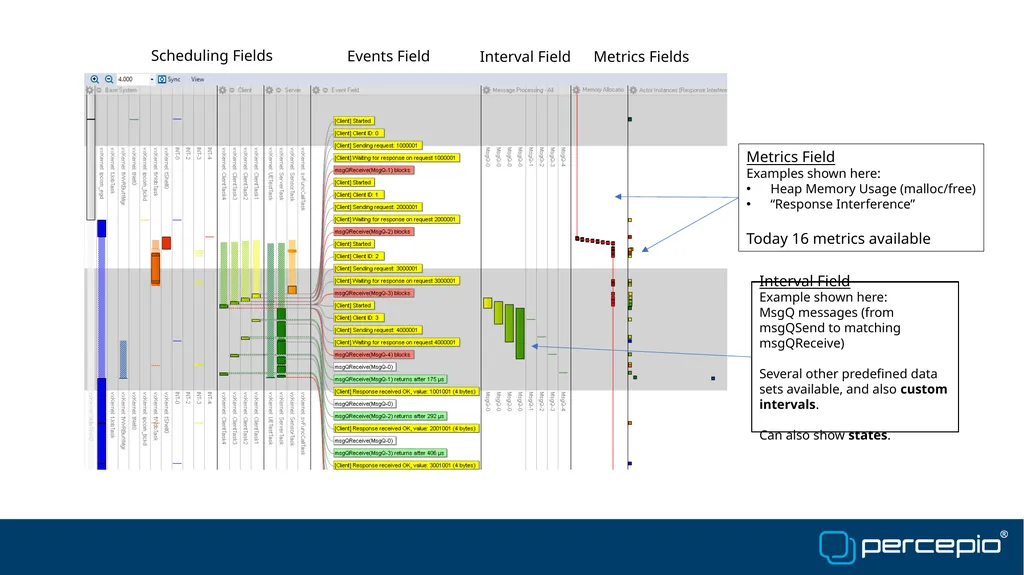
Today 16 metrics available Events Field Interval Field Metrics Fields Interval Field
Example shown here:
MsgQ messages (from msgQSend to matching msgQReceive)
Several other predefined data sets available, and also custom intervals.
Can also show states.<br>
13
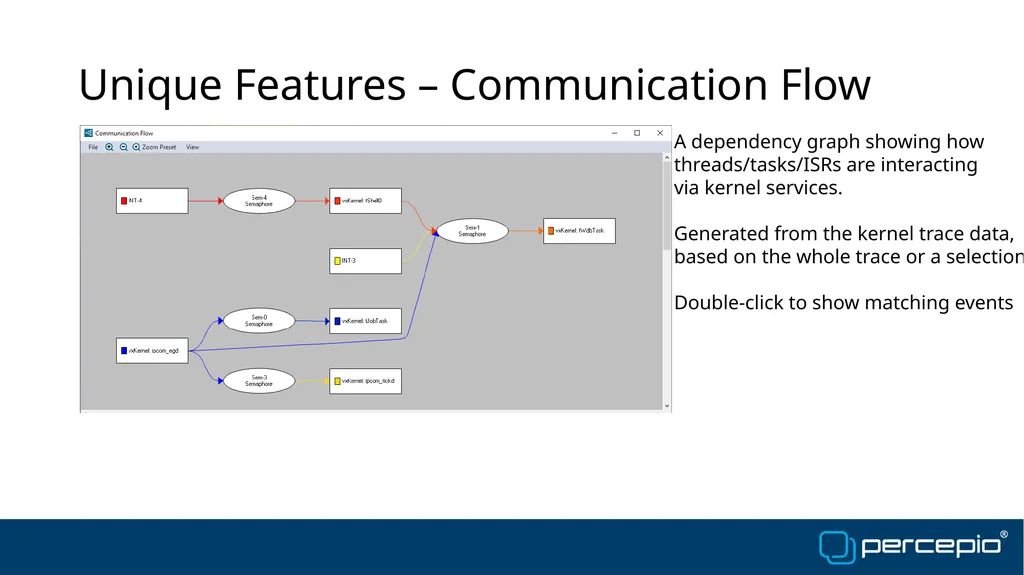
Unique Features – Communication Flow A dependency graph showing how
threads/tasks/ISRs are interacting
via kernel services.
Generated from the kernel trace data,
based on the whole trace or a selection.
Double-click to show matching events<br>
14
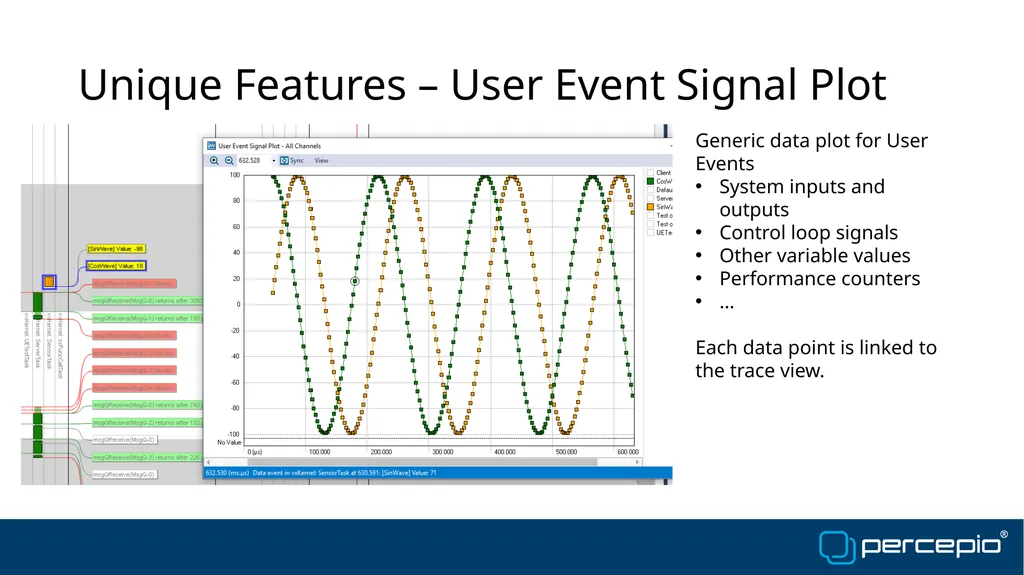
Unique Features – User Event Signal Plot Generic data plot for User Events
System inputs and outputs
Control loop signals
Other variable values
Performance counters
…
Each data point is linked to the trace view.<br>
15
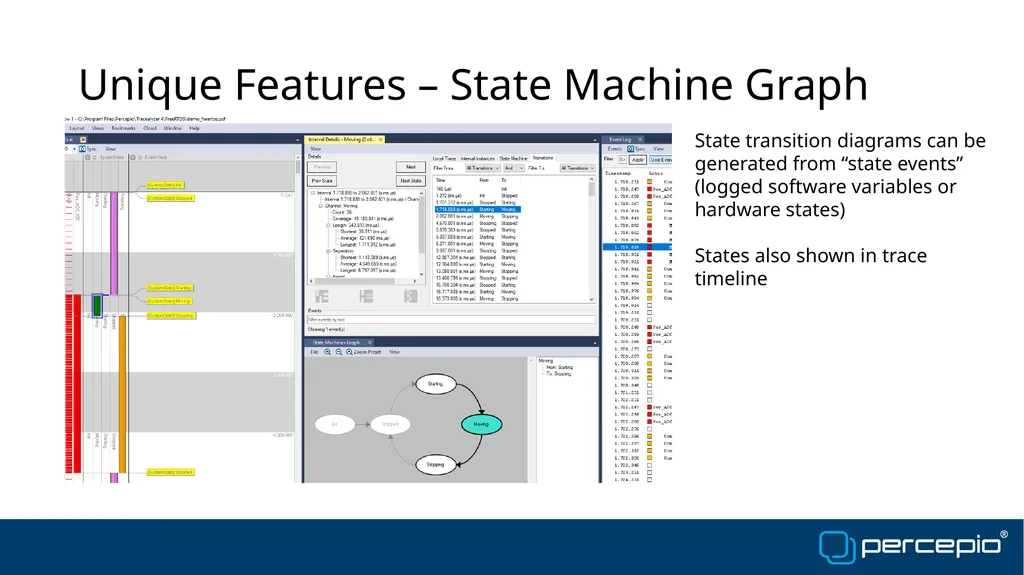
Unique Features – State Machine Graph State transition diagrams can be generated from “state events” (logged software variables or hardware states)
States also shown in trace timeline<br>
16
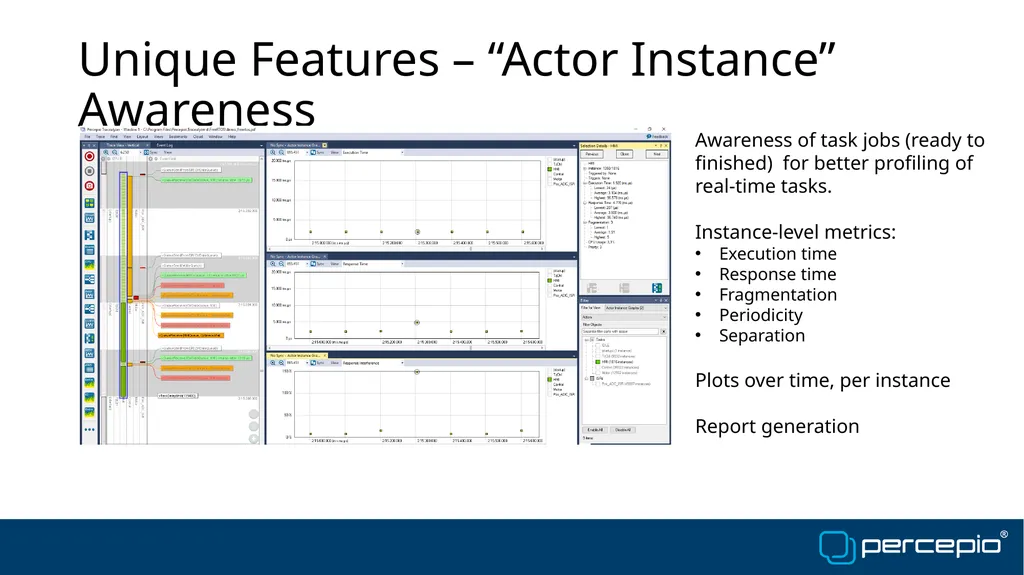
Unique Features – “Actor Instance” Awareness Awareness of task jobs (ready to finished) for better profiling of real-time tasks.
Instance-level metrics:
Execution time
Response time
Fragmentation
Periodicity
Separation