
Biostatistics for High Value Testing and Treatment
FD
Published · 33 slides · 0 views
1 / 1
Description
Biostatistics for High Value Testing and Treatment Fellowship HVC Curriculum 2016-2017 Presentation 3 of 7 Learning Objectives Explain basic statistical concepts for diagnostic testing: sensitivity and specificity, predictive values, and
Related Topics
Share
Embed code
Download this presentation From Below
"Biostatistics for High Value Testing and Treatment" is the property of its rightful owner. Permission is granted to download and print the materials on this website for personal, non-commercial use only, and to display it on your personal computer provided you do not modify the materials and that you retain all copyright notices contained in the materials. By downloading content from our website, you accept the terms of this agreement.
Presentation Transcript
01
Biostatistics for High Value Testing and Treatment Fellowship HVC Curriculum 2016-2017 • Presentation 3 of 7<br>
02
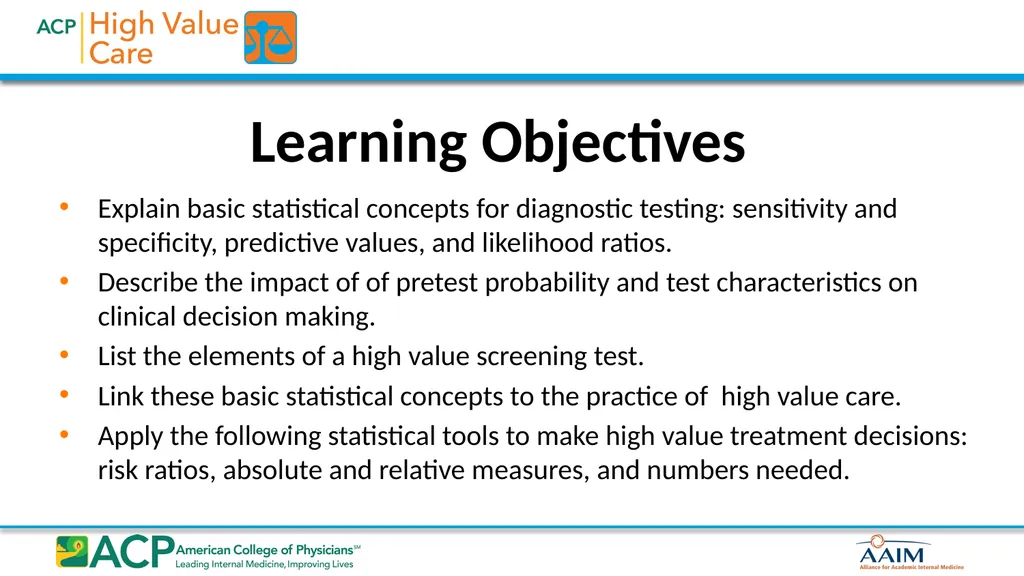
Learning Objectives Explain basic statistical concepts for diagnostic testing: sensitivity and specificity, predictive values, and likelihood ratios.
Describe the impact of of pretest probability and test characteristics on clinical decision making.
List the elements of a high value screening test.
Link these basic statistical concepts to the practice of high value care.
Apply the following statistical tools to make high value treatment decisions: risk ratios, absolute and relative measures, and numbers needed.<br>
Describe the impact of of pretest probability and test characteristics on clinical decision making.
List the elements of a high value screening test.
Link these basic statistical concepts to the practice of high value care.
Apply the following statistical tools to make high value treatment decisions: risk ratios, absolute and relative measures, and numbers needed.<br>
03
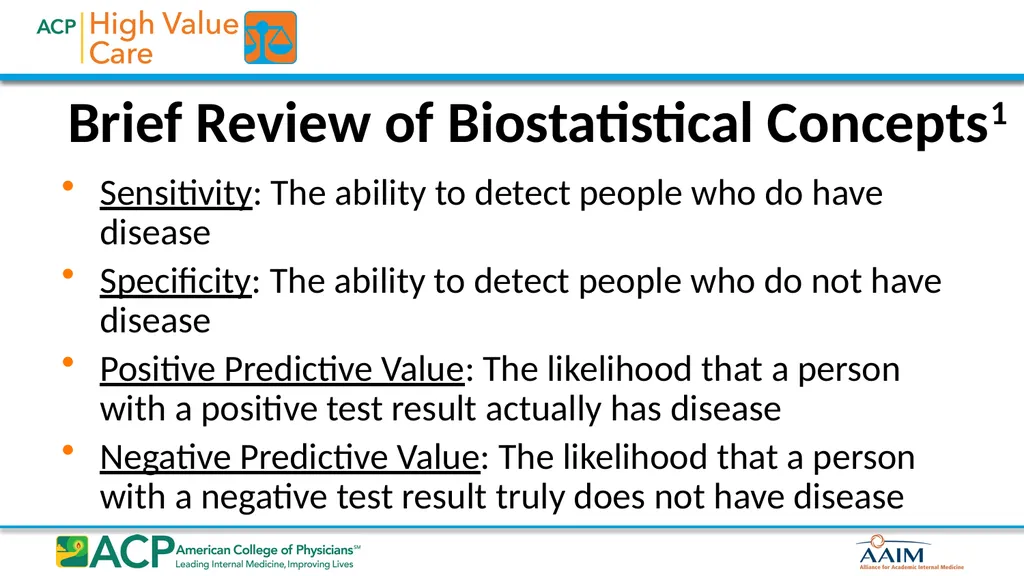
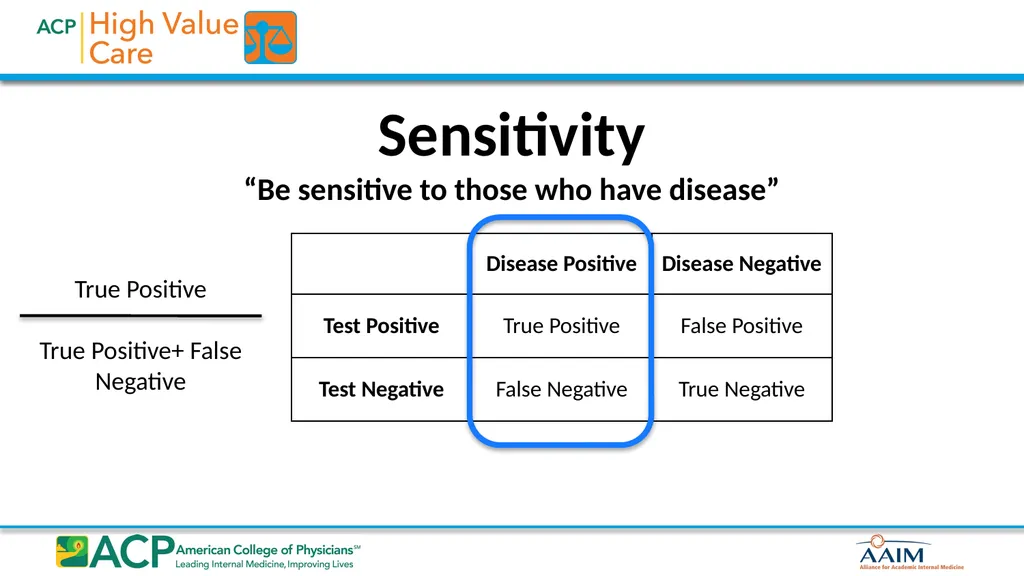
Brief Review of Biostatistical Concepts1 Sensitivity: The ability to detect people who do have disease
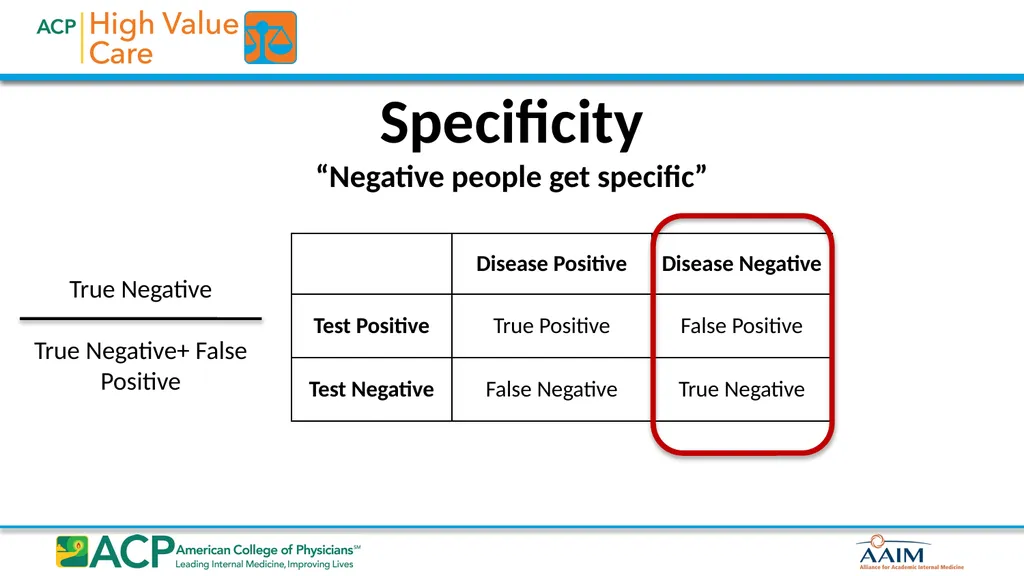
Specificity: The ability to detect people who do not have disease
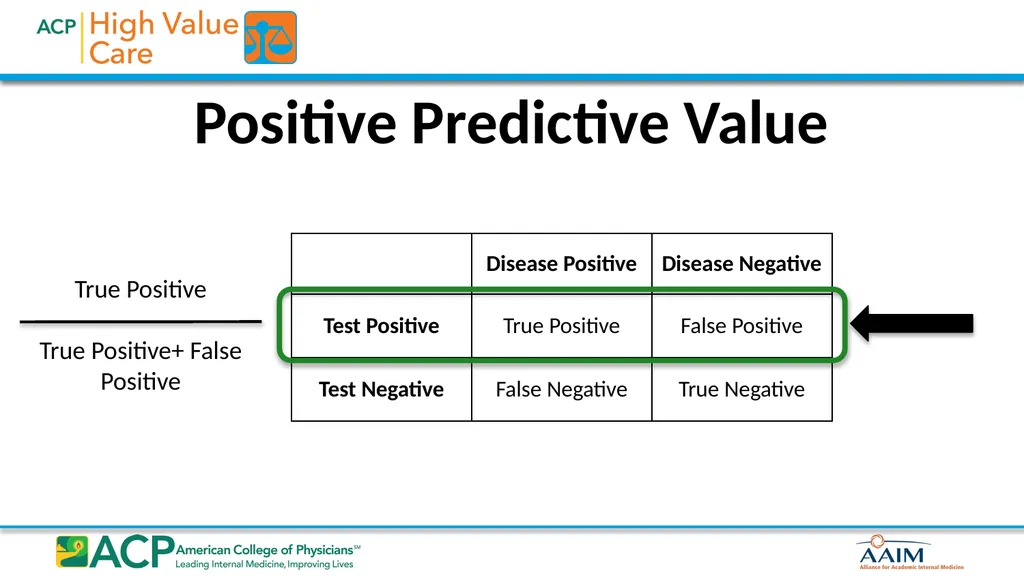
Positive Predictive Value: The likelihood that a person with a positive test result actually has disease
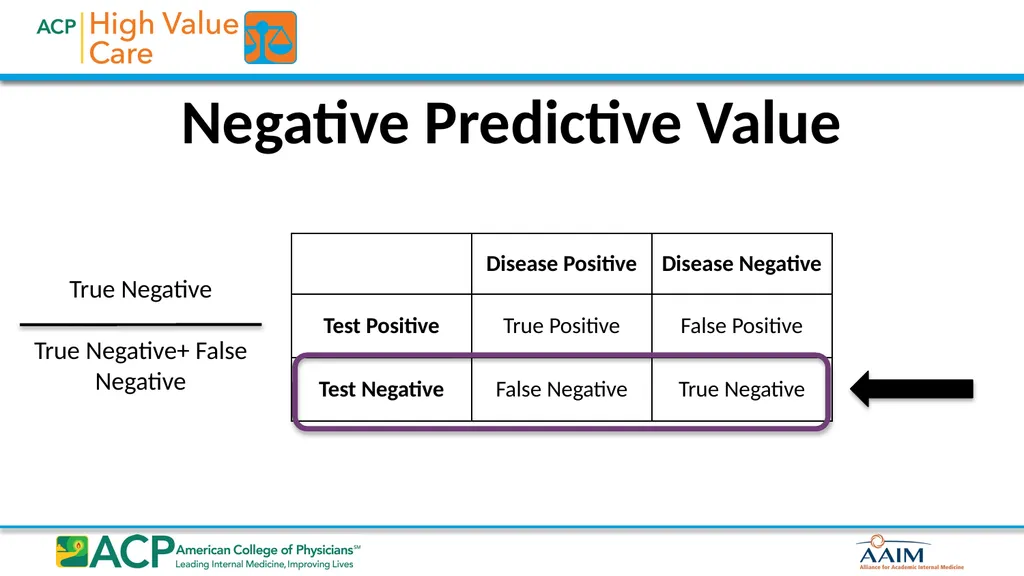
Negative Predictive Value: The likelihood that a person with a negative test result truly does not have disease<br>
Specificity: The ability to detect people who do not have disease
Positive Predictive Value: The likelihood that a person with a positive test result actually has disease
Negative Predictive Value: The likelihood that a person with a negative test result truly does not have disease<br>
04
Sensitivity
“Be sensitive to those who have disease” True Positive
True Positive+ False Negative<br>
True Positive+ False Negative<br>
05
Specificity
“Negative people get specific” True Negative
True Negative+ False Positive<br>
True Negative+ False Positive<br>
06
Positive Predictive Value True Positive
True Positive+ False Positive<br>
True Positive+ False Positive<br>
07
Negative Predictive Value True Negative
True Negative+ False Negative<br>
True Negative+ False Negative<br>
08
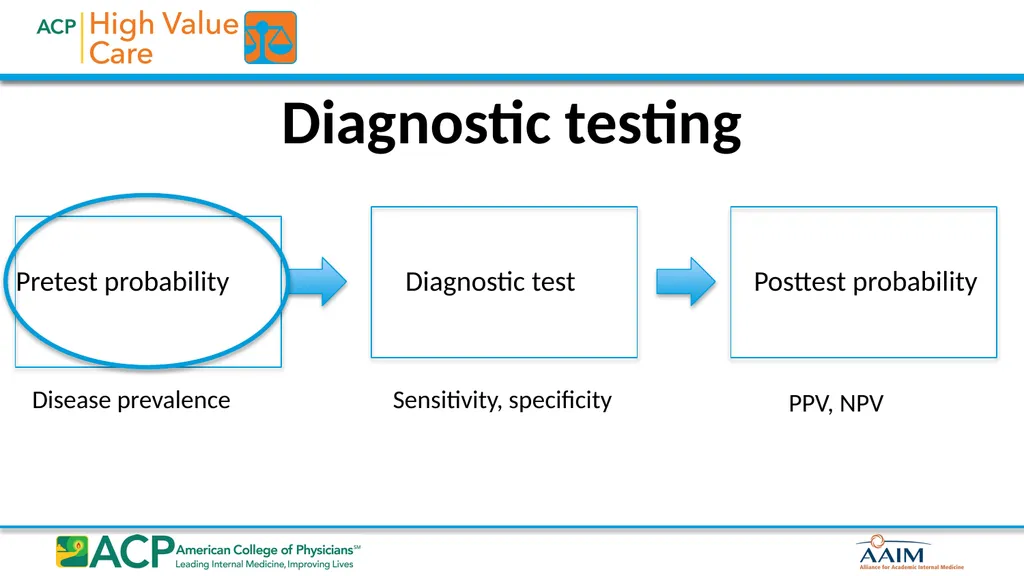
Diagnostic testing Pretest probability Diagnostic test Posttest probability Disease prevalence Sensitivity, specificity PPV, NPV<br>
09
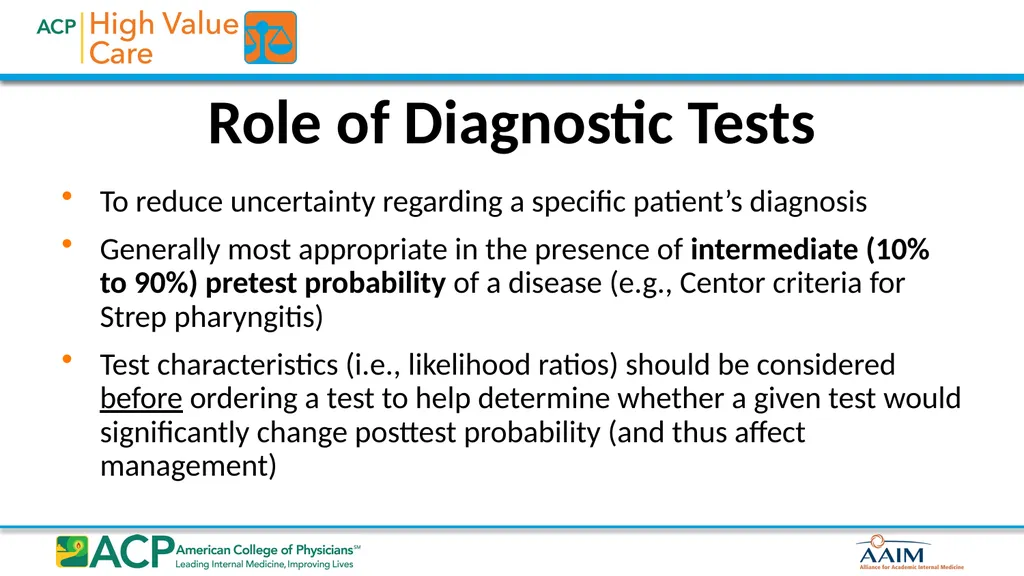
Role of Diagnostic Tests To reduce uncertainty regarding a specific patient’s diagnosis
Generally most appropriate in the presence of intermediate (10% to 90%) pretest probability of a disease (e.g., Centor criteria for Strep pharyngitis)
Test characteristics (i.e., likelihood ratios) should be considered before ordering a test to help determine whether a given test would significantly change posttest probability (and thus affect management)<br>
Generally most appropriate in the presence of intermediate (10% to 90%) pretest probability of a disease (e.g., Centor criteria for Strep pharyngitis)
Test characteristics (i.e., likelihood ratios) should be considered before ordering a test to help determine whether a given test would significantly change posttest probability (and thus affect management)<br>
10
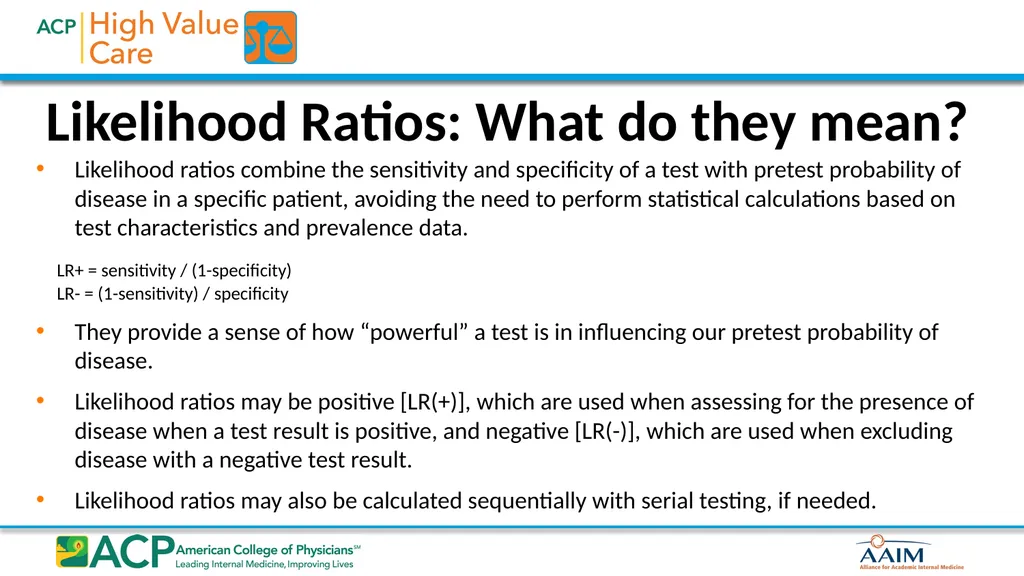
Likelihood Ratios: What do they mean? Likelihood ratios combine the sensitivity and specificity of a test with pretest probability of disease in a specific patient, avoiding the need to perform statistical calculations based on test characteristics and prevalence data.
LR+ = sensitivity / (1-specificity) LR- = (1-sensitivity) / specificity
They provide a sense of how “powerful” a test is in influencing our pretest probability of disease.
Likelihood ratios may be positive [LR(+)], which are used when assessing for the presence of disease when a test result is positive, and negative [LR(-)], which are used when excluding disease with a negative test result.
Likelihood ratios may also be calculated sequentially with serial testing, if needed.<br>
LR+ = sensitivity / (1-specificity) LR- = (1-sensitivity) / specificity
They provide a sense of how “powerful” a test is in influencing our pretest probability of disease.
Likelihood ratios may be positive [LR(+)], which are used when assessing for the presence of disease when a test result is positive, and negative [LR(-)], which are used when excluding disease with a negative test result.
Likelihood ratios may also be calculated sequentially with serial testing, if needed.<br>
11
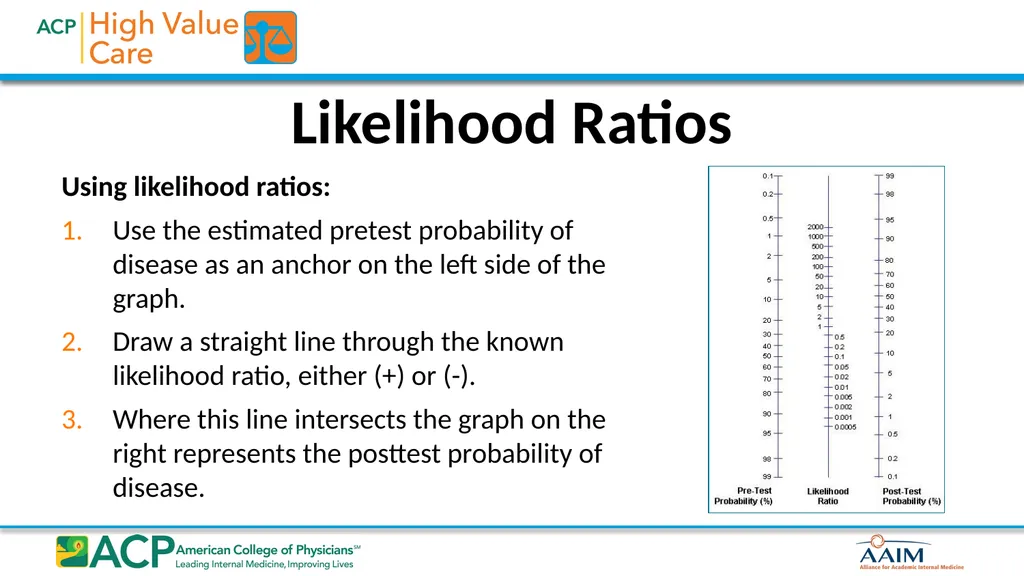
Likelihood Ratios Using likelihood ratios:
Use the estimated pretest probability of disease as an anchor on the left side of the graph.
Draw a straight line through the known likelihood ratio, either (+) or (-).
Where this line intersects the graph on the right represents the posttest probability of disease.<br>
Use the estimated pretest probability of disease as an anchor on the left side of the graph.
Draw a straight line through the known likelihood ratio, either (+) or (-).
Where this line intersects the graph on the right represents the posttest probability of disease.<br>
12
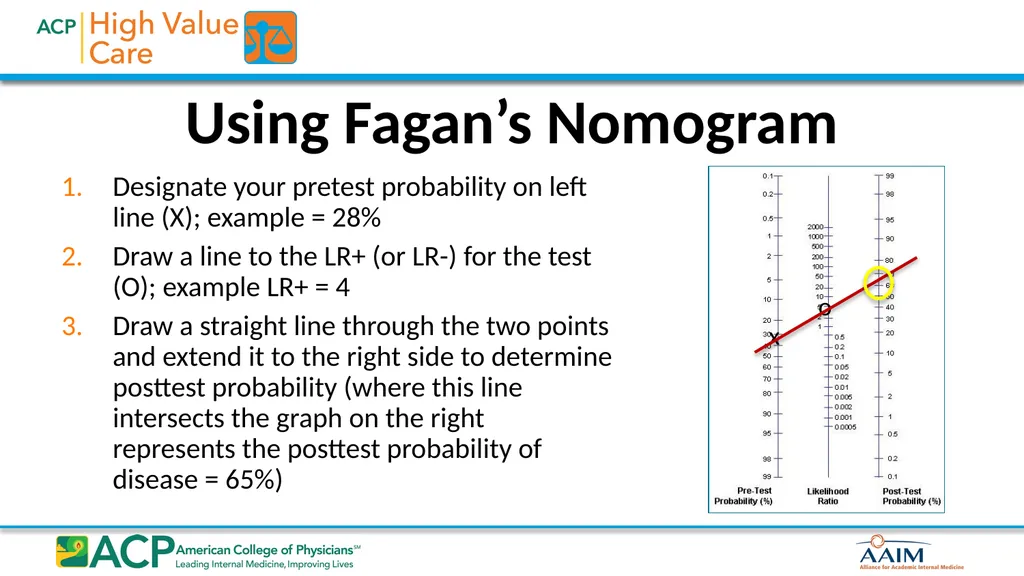
Using Fagan’s Nomogram Designate your pretest probability on left line (X); example = 28%
Draw a line to the LR+ (or LR-) for the test (O); example LR+ = 4
Draw a straight line through the two points and extend it to the right side to determine posttest probability (where this line intersects the graph on the right represents the posttest probability of disease = 65%) x o<br>
Draw a line to the LR+ (or LR-) for the test (O); example LR+ = 4
Draw a straight line through the two points and extend it to the right side to determine posttest probability (where this line intersects the graph on the right represents the posttest probability of disease = 65%) x o<br>
13
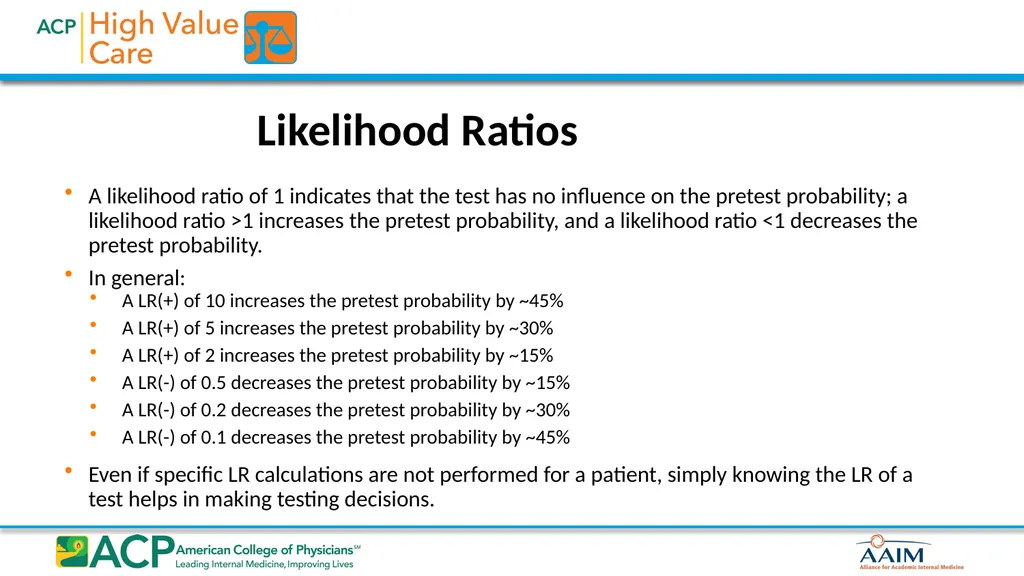
Likelihood Ratios A likelihood ratio of 1 indicates that the test has no influence on the pretest probability; a likelihood ratio >1 increases the pretest probability, and a likelihood ratio <1 decreases the pretest probability.
In general:
A LR(+) of 10 increases the pretest probability by ~45%
A LR(+) of 5 increases the pretest probability by ~30%
A LR(+) of 2 increases the pretest probability by ~15%
A LR(-) of 0.5 decreases the pretest probability by ~15%
A LR(-) of 0.2 decreases the pretest probability by ~30%
A LR(-) of 0.1 decreases the pretest probability by ~45%
Even if specific LR calculations are not performed for a patient, simply knowing the LR of a test helps in making testing decisions.<br>
In general:
A LR(+) of 10 increases the pretest probability by ~45%
A LR(+) of 5 increases the pretest probability by ~30%
A LR(+) of 2 increases the pretest probability by ~15%
A LR(-) of 0.5 decreases the pretest probability by ~15%
A LR(-) of 0.2 decreases the pretest probability by ~30%
A LR(-) of 0.1 decreases the pretest probability by ~45%
Even if specific LR calculations are not performed for a patient, simply knowing the LR of a test helps in making testing decisions.<br>
14
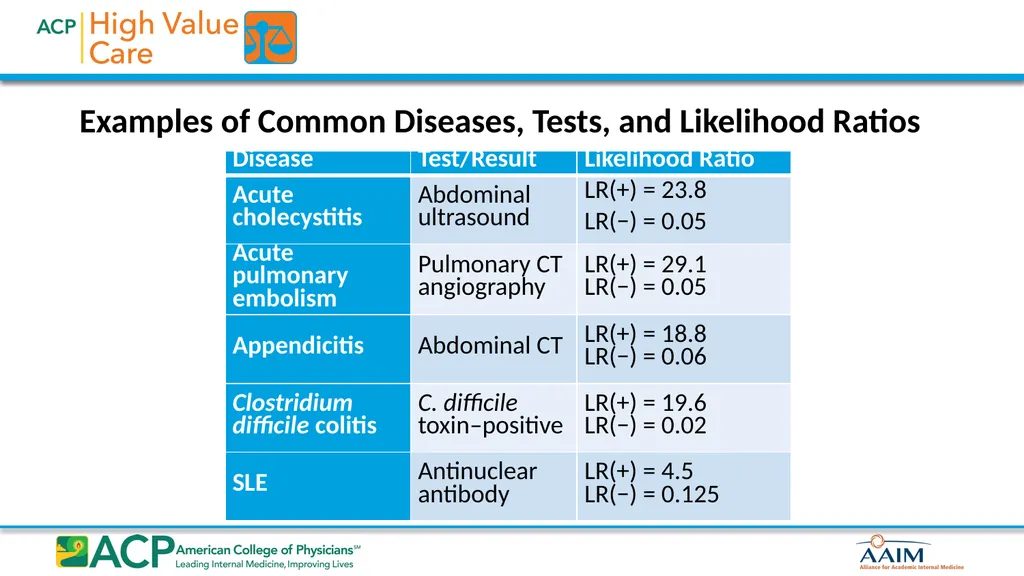
Examples of Common Diseases, Tests, and Likelihood Ratios<br>
15
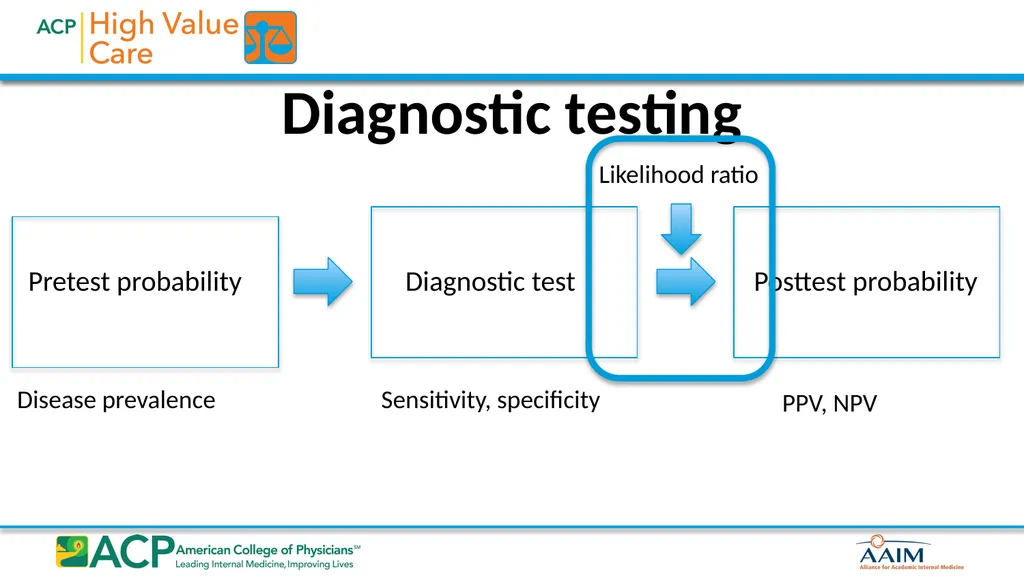
Diagnostic testing Pretest probability Diagnostic test Posttest probability Disease prevalence Sensitivity, specificity PPV, NPV Likelihood ratio<br>
16
Using Likelihood Ratios: Small Group Exercise Use the nomograms and LRs given to come up with the posttest probability of disease for the cases provided.
Focus on the diagnostic process:
Estimate the pretest probability of disease in your patient.
Evaluate how testing would influence your pretest probability of disease using the LR provided and the nomogram.
Decide if you think the test is high value based on this exercise.
Be prepared to briefly summarize your findings and share them with the larger group.<br>
Focus on the diagnostic process:
Estimate the pretest probability of disease in your patient.
Evaluate how testing would influence your pretest probability of disease using the LR provided and the nomogram.
Decide if you think the test is high value based on this exercise.
Be prepared to briefly summarize your findings and share them with the larger group.<br>
17
Role of Screening Tests To detect asymptomatic and early stage disease
Should be highly sensitive and highly specific to pick up most cases of true disease and avoid false positives
Targeted toward populations with a higher disease prevalence (high positive predictive value)
Should be relatively safe and cost-effective
Should screen for diseases in which early identification and treatment have been demonstrated to improve clinical outcomes<br>
Should be highly sensitive and highly specific to pick up most cases of true disease and avoid false positives
Targeted toward populations with a higher disease prevalence (high positive predictive value)
Should be relatively safe and cost-effective
Should screen for diseases in which early identification and treatment have been demonstrated to improve clinical outcomes<br>
18
Common Harms Associated with Screening False positive results
Primary goal of screening: find specific diseases Maximize sensitivity at cost of specificity False positives
Can lead to incorrect labeling, inconvenience, expense, and physical harm in follow-up tests
Selection bias (healthy volunteer bias)<br>
Primary goal of screening: find specific diseases Maximize sensitivity at cost of specificity False positives
Can lead to incorrect labeling, inconvenience, expense, and physical harm in follow-up tests
Selection bias (healthy volunteer bias)<br>
19
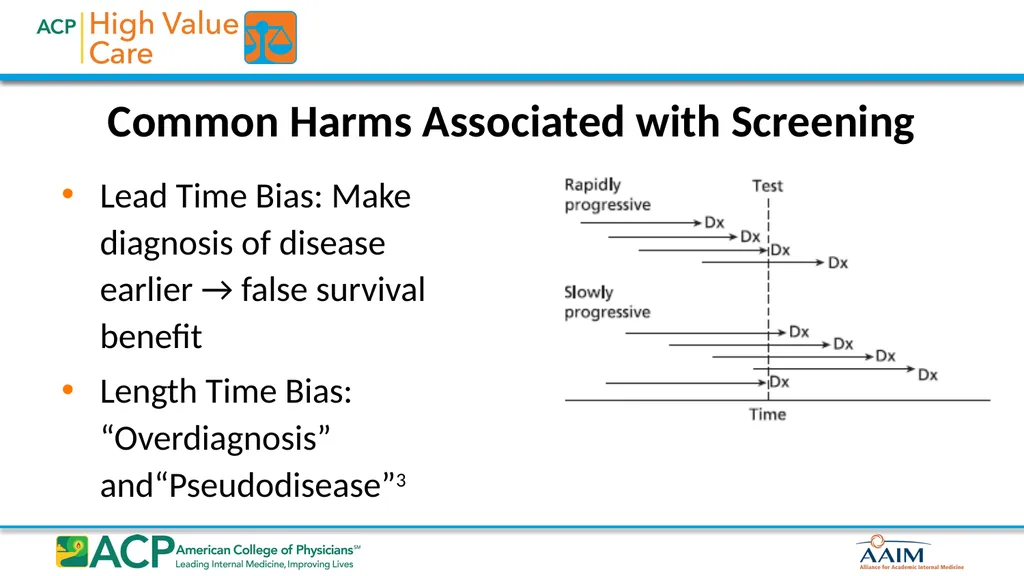
Common Harms Associated with Screening Lead Time Bias: Make diagnosis of disease earlier → false survival benefit
Length Time Bias: “Overdiagnosis” and“Pseudodisease”3<br>
Length Time Bias: “Overdiagnosis” and“Pseudodisease”3<br>
20
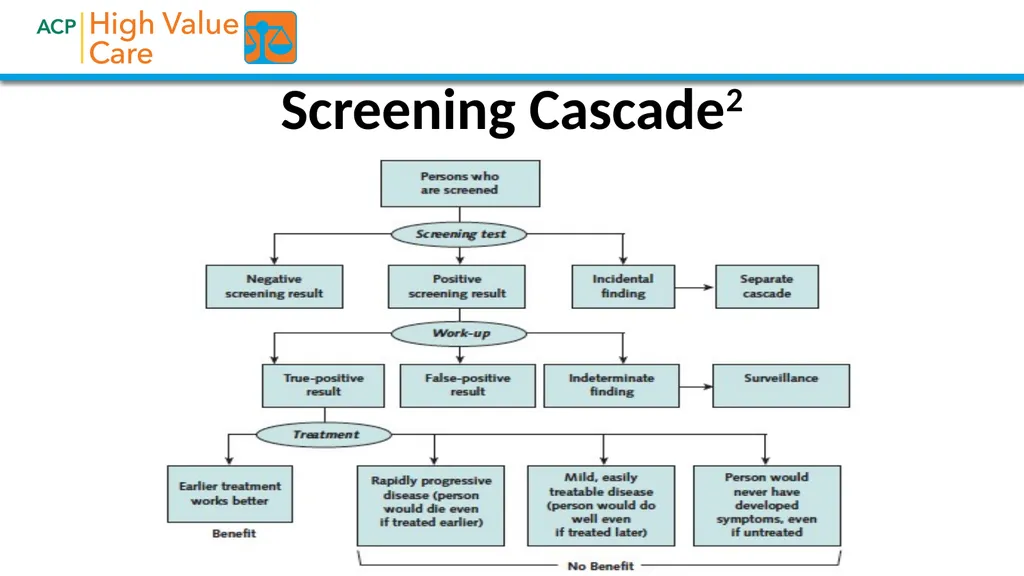
Screening Cascade2<br>
21
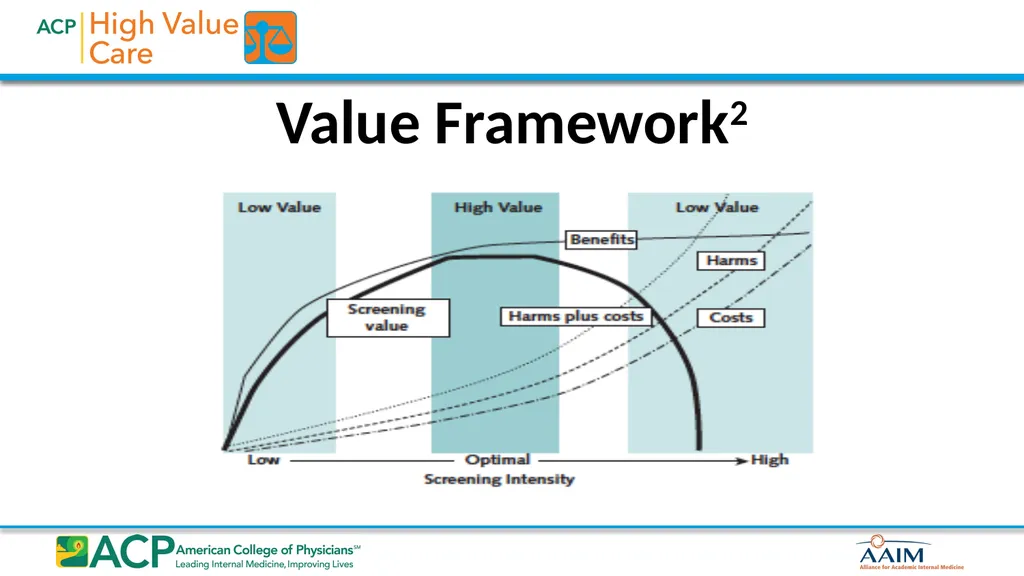
Value Framework2<br>
22
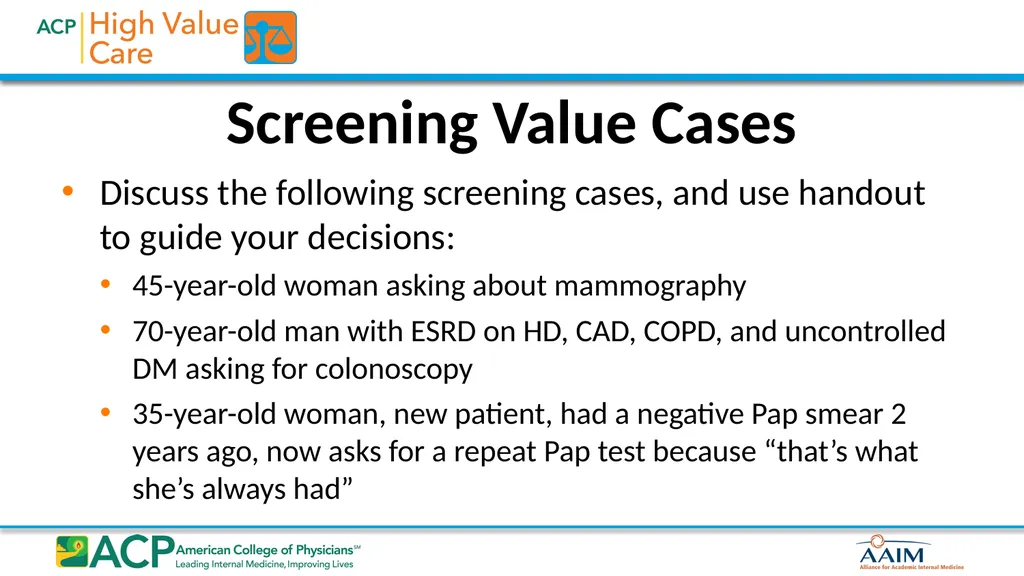
Screening Value Cases Discuss the following screening cases, and use handout to guide your decisions:
45-year-old woman asking about mammography
70-year-old man with ESRD on HD, CAD, COPD, and uncontrolled DM asking for colonoscopy
35-year-old woman, new patient, had a negative Pap smear 2 years ago, now asks for a repeat Pap test because “that’s what she’s always had”<br>
45-year-old woman asking about mammography
70-year-old man with ESRD on HD, CAD, COPD, and uncontrolled DM asking for colonoscopy
35-year-old woman, new patient, had a negative Pap smear 2 years ago, now asks for a repeat Pap test because “that’s what she’s always had”<br>
23
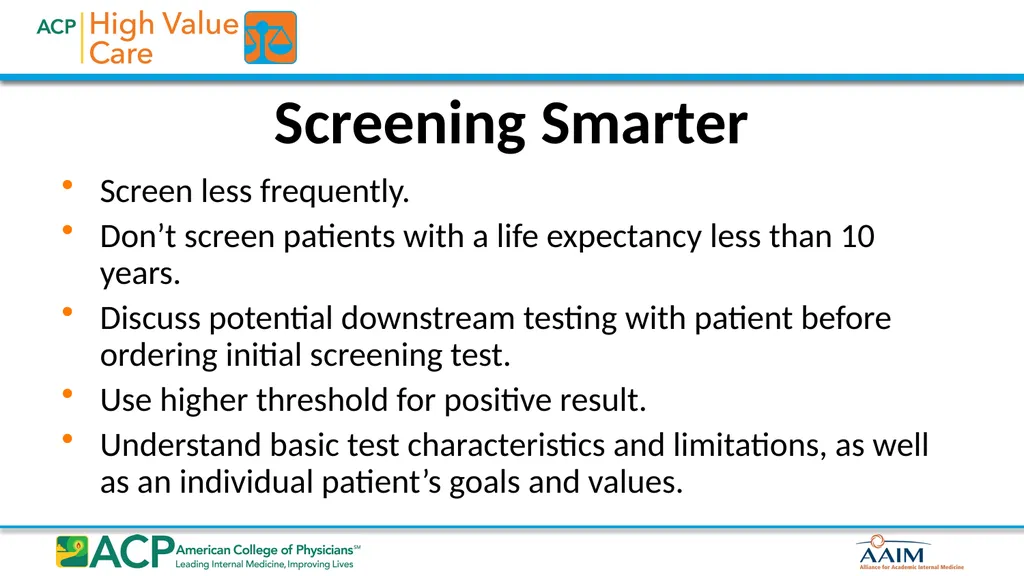
Screening Smarter Screen less frequently.
Don’t screen patients with a life expectancy less than 10 years.
Discuss potential downstream testing with patient before ordering initial screening test.
Use higher threshold for positive result.
Understand basic test characteristics and limitations, as well as an individual patient’s goals and values.<br>
Don’t screen patients with a life expectancy less than 10 years.
Discuss potential downstream testing with patient before ordering initial screening test.
Use higher threshold for positive result.
Understand basic test characteristics and limitations, as well as an individual patient’s goals and values.<br>
24
Biostatistical Principles in Treatment High value therapeutic decision making requires understanding the effectiveness of different treatment options, and balancing potential benefits with both medical and financial costs.<br>
25
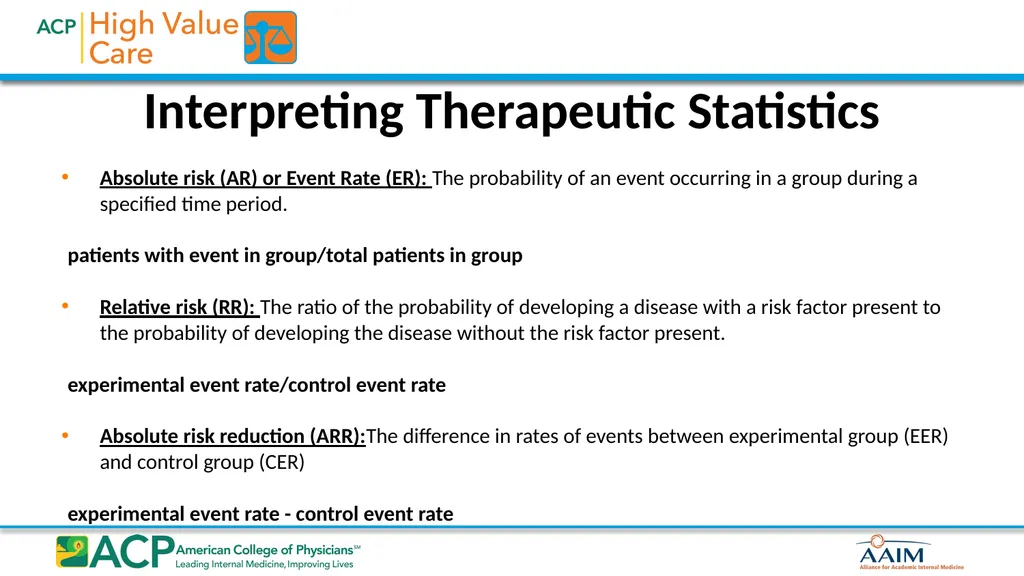
Interpreting Therapeutic Statistics Absolute risk (AR) or Event Rate (ER): The probability of an event occurring in a group during a specified time period.
patients with event in group/total patients in group
Relative risk (RR): The ratio of the probability of developing a disease with a risk factor present to the probability of developing the disease without the risk factor present.
experimental event rate/control event rate
Absolute risk reduction (ARR):The difference in rates of events between experimental group (EER) and control group (CER)
experimental event rate - control event rate<br>
patients with event in group/total patients in group
Relative risk (RR): The ratio of the probability of developing a disease with a risk factor present to the probability of developing the disease without the risk factor present.
experimental event rate/control event rate
Absolute risk reduction (ARR):The difference in rates of events between experimental group (EER) and control group (CER)
experimental event rate - control event rate<br>
26
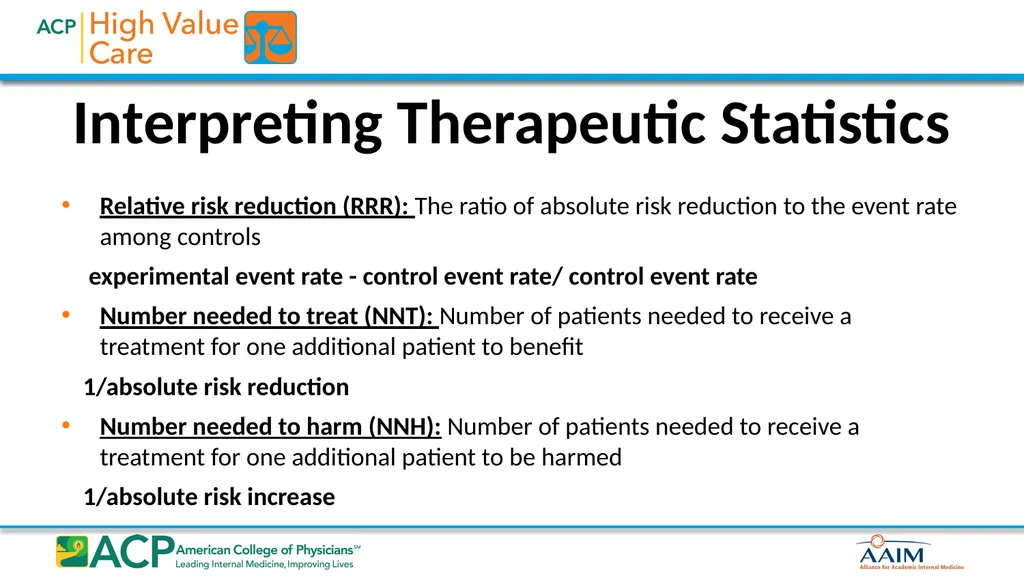
Interpreting Therapeutic Statistics Relative risk reduction (RRR): The ratio of absolute risk reduction to the event rate among controls
experimental event rate - control event rate/ control event rate
Number needed to treat (NNT): Number of patients needed to receive a treatment for one additional patient to benefit
1/absolute risk reduction
Number needed to harm (NNH): Number of patients needed to receive a treatment for one additional patient to be harmed
1/absolute risk increase<br>
experimental event rate - control event rate/ control event rate
Number needed to treat (NNT): Number of patients needed to receive a treatment for one additional patient to benefit
1/absolute risk reduction
Number needed to harm (NNH): Number of patients needed to receive a treatment for one additional patient to be harmed
1/absolute risk increase<br>
27
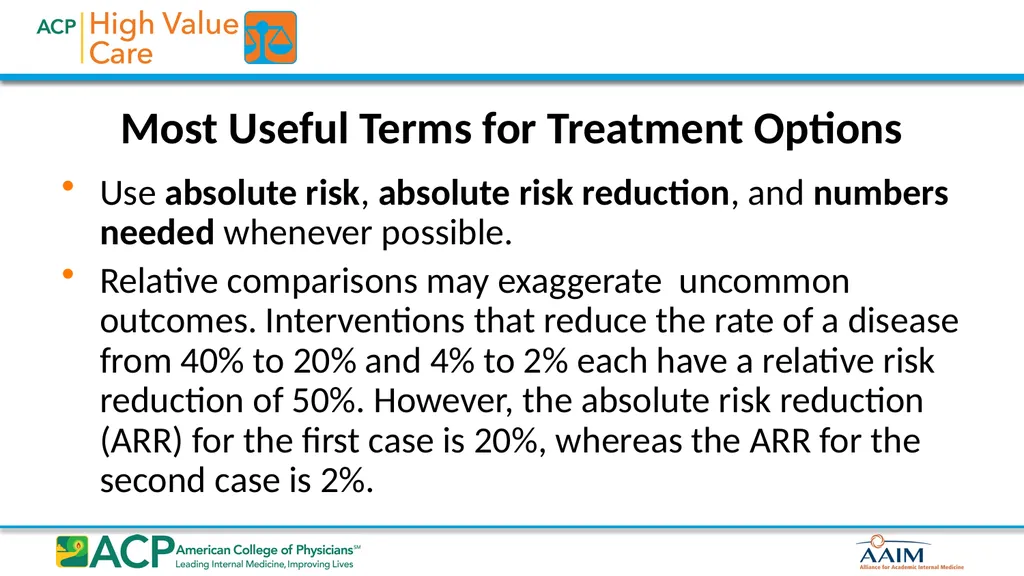
Most Useful Terms for Treatment Options Use absolute risk, absolute risk reduction, and numbers needed whenever possible.
Relative comparisons may exaggerate uncommon outcomes. Interventions that reduce the rate of a disease from 40% to 20% and 4% to 2% each have a relative risk reduction of 50%. However, the absolute risk reduction (ARR) for the first case is 20%, whereas the ARR for the second case is 2%.<br>
Relative comparisons may exaggerate uncommon outcomes. Interventions that reduce the rate of a disease from 40% to 20% and 4% to 2% each have a relative risk reduction of 50%. However, the absolute risk reduction (ARR) for the first case is 20%, whereas the ARR for the second case is 2%.<br>
28
Most Useful Terms for Treatment Options Numbers needed are useful indicators of the clinical impact of an intervention because they provide a sense of magnitude expected from the intervention.
Statistical significance ≠ clinical importance, especially for large studies with uncommon outcomes.<br>
Statistical significance ≠ clinical importance, especially for large studies with uncommon outcomes.<br>
29
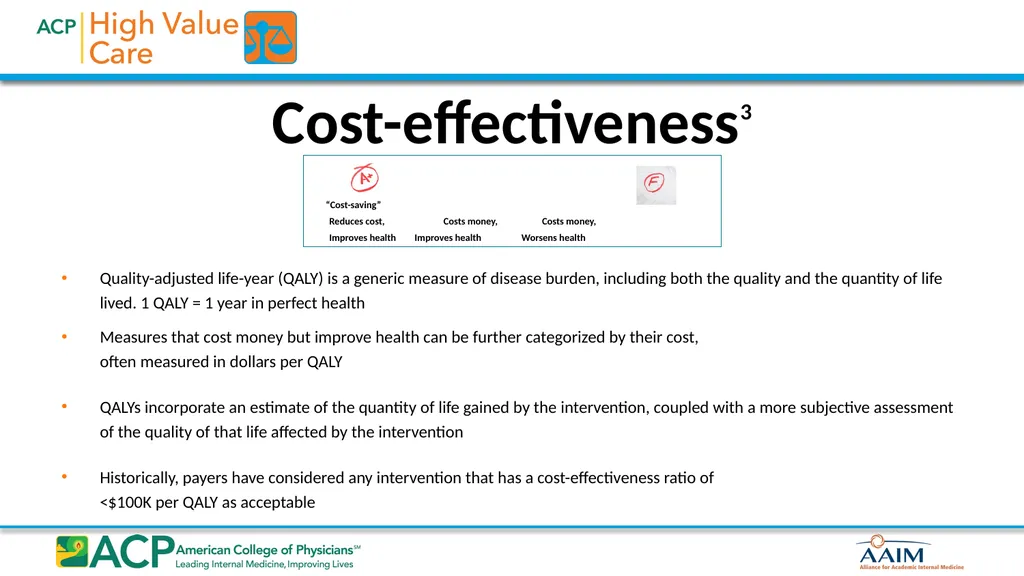
Cost-effectiveness3 Quality-adjusted life-year (QALY) is a generic measure of disease burden, including both the quality and the quantity of life lived. 1 QALY = 1 year in perfect health
Measures that cost money but improve health can be further categorized by their cost, often measured in dollars per QALY
QALYs incorporate an estimate of the quantity of life gained by the intervention, coupled with a more subjective assessment of the quality of that life affected by the intervention
Historically, payers have considered any intervention that has a cost-effectiveness ratio of <$100K per QALY as acceptable “Cost-saving”
Reduces cost, Costs money, Costs money,
Improves health Improves health Worsens health<br>
Measures that cost money but improve health can be further categorized by their cost, often measured in dollars per QALY
QALYs incorporate an estimate of the quantity of life gained by the intervention, coupled with a more subjective assessment of the quality of that life affected by the intervention
Historically, payers have considered any intervention that has a cost-effectiveness ratio of <$100K per QALY as acceptable “Cost-saving”
Reduces cost, Costs money, Costs money,
Improves health Improves health Worsens health<br>
30
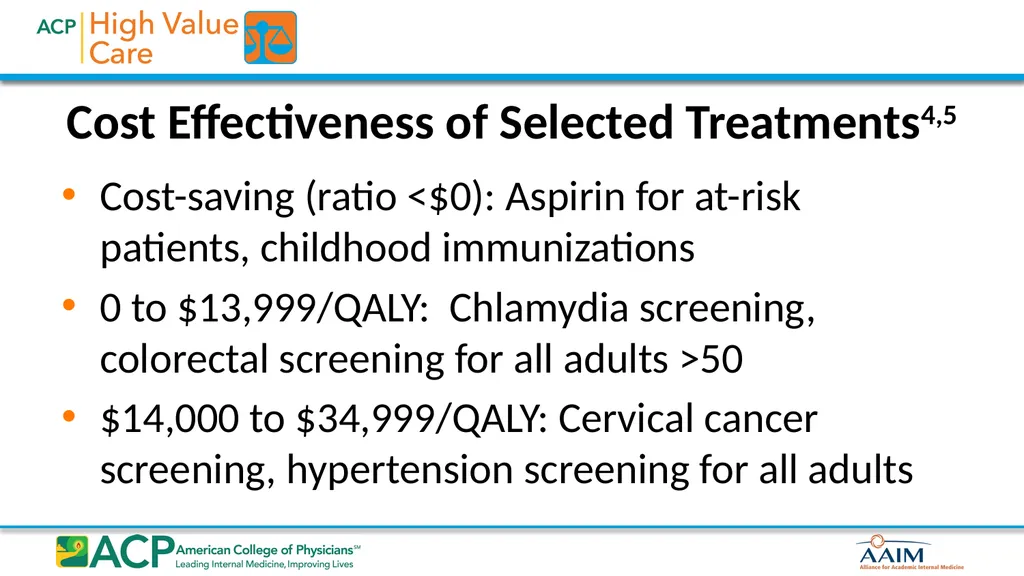
Cost Effectiveness of Selected Treatments4,5 Cost-saving (ratio <$0): Aspirin for at-risk patients, childhood immunizations
0 to $13,999/QALY: Chlamydia screening, colorectal screening for all adults >50
$14,000 to $34,999/QALY: Cervical cancer screening, hypertension screening for all adults<br>
0 to $13,999/QALY: Chlamydia screening, colorectal screening for all adults >50
$14,000 to $34,999/QALY: Cervical cancer screening, hypertension screening for all adults<br>
31
Summary Diagnostic tests should only be used if the result is likely to significantly affect your certainty of a disease (posttest probability) and should rely on likelihood ratios for a given test when available.
The goals of screening are to detect treatable, asymptomatic, or early stage disease.
The limitations, harms, and costs associated with screening should be considered in the context of the patient’s goals.
Whenever possible, treatment benefit should be expressed in terms of absolute risk reduction (not relative risk reduction).<br>
The goals of screening are to detect treatable, asymptomatic, or early stage disease.
The limitations, harms, and costs associated with screening should be considered in the context of the patient’s goals.
Whenever possible, treatment benefit should be expressed in terms of absolute risk reduction (not relative risk reduction).<br>
32
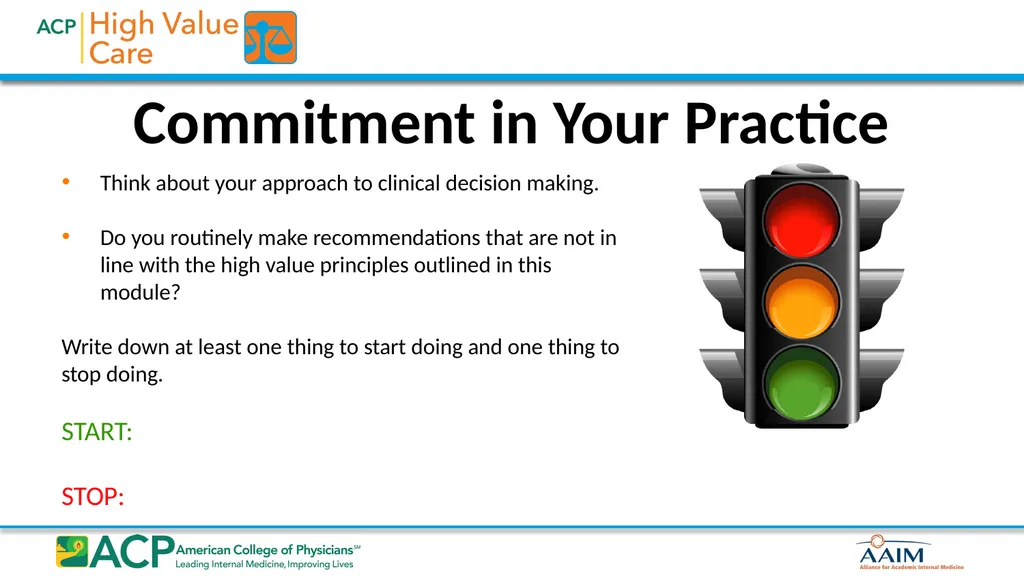
Commitment in Your Practice Think about your approach to clinical decision making.
Do you routinely make recommendations that are not in line with the high value principles outlined in this module?
Write down at least one thing to start doing and one thing to stop doing.
START:
STOP:<br>
Do you routinely make recommendations that are not in line with the high value principles outlined in this module?
Write down at least one thing to start doing and one thing to stop doing.
START:
STOP:<br>
33
References Glaser AN. High Yield Biostatistics, 3rd ed. Philadelphia:, PA: Lippincott Williams and Wilkins; 2005.
Wilt TJ, Harris RP, Qaseem A; High Value Care Task Force of the American College of Physicians. Screening for cancer: advice for high-value care from the American College of Physicians. Ann Intern Med. 2015 May 19;162(10):718-25. [PMID: 25984847]
Owens DK, Qaseem A, Chou R, Shekelle P; Clinical Guidelines Committee of the American College of Physicians. High-value, cost-conscious health care: concepts for clinicians to evaluate the benefits, harms, and costs of medical interventions. Ann Intern Med. 2011 Feb 1;154(3):174-80. [PMID: 21282697]
Institute of Medicine. The Healthcare Imperative: Lowering Costs and Improving Outcomes: Workshop Series Summary. Washington, DC: National Academics Press; 2010.
Moynihan R, Doust J, Henry D. Preventing overdiagnosis: how to stop harming the healthy. BMJ. 2012 May 28;344:e3502. [PMID: 22645185]
Welch HG, Schwartz L, Woloshin S. Overdiagnosed: Making People Sick in the Pursuit of Health. Boston, MA: Beacon Press; 2011.
Moriates C, Arora V, Shah, N. Understanding Value-Based Healthcare. New York, NY: McGraw-Hill Education; 2015.<br>
Wilt TJ, Harris RP, Qaseem A; High Value Care Task Force of the American College of Physicians. Screening for cancer: advice for high-value care from the American College of Physicians. Ann Intern Med. 2015 May 19;162(10):718-25. [PMID: 25984847]
Owens DK, Qaseem A, Chou R, Shekelle P; Clinical Guidelines Committee of the American College of Physicians. High-value, cost-conscious health care: concepts for clinicians to evaluate the benefits, harms, and costs of medical interventions. Ann Intern Med. 2011 Feb 1;154(3):174-80. [PMID: 21282697]
Institute of Medicine. The Healthcare Imperative: Lowering Costs and Improving Outcomes: Workshop Series Summary. Washington, DC: National Academics Press; 2010.
Moynihan R, Doust J, Henry D. Preventing overdiagnosis: how to stop harming the healthy. BMJ. 2012 May 28;344:e3502. [PMID: 22645185]
Welch HG, Schwartz L, Woloshin S. Overdiagnosed: Making People Sick in the Pursuit of Health. Boston, MA: Beacon Press; 2011.
Moriates C, Arora V, Shah, N. Understanding Value-Based Healthcare. New York, NY: McGraw-Hill Education; 2015.<br>