
Board financial overview OWASP Foundation, Inc. |

Description: Board financial overview OWASP Foundation, Inc. July 2026 Financial snapshot as of July 31, 2026 2.24M Cash on hand (down 241K in July) 5.3 Months of cash on hand 5.65:1 Current ratio 3.29M Total net assets YEAR-TO-DATE RESULTS 790K
Related Topics
Download Presentation
"Board financial overview OWASP Foundation, Inc. |" is the property of its rightful owner. Permission is granted to download and print the materials on this website for personal, non-commercial use only, and to display it on your personal computer provided you do not modify the materials and that you retain all copyright notices contained in the materials. By downloading content from our website, you accept the terms of this agreement.
Presentation Transcript
slide1. Board financial overview OWASP Foundation, Inc. | July 2026<br>
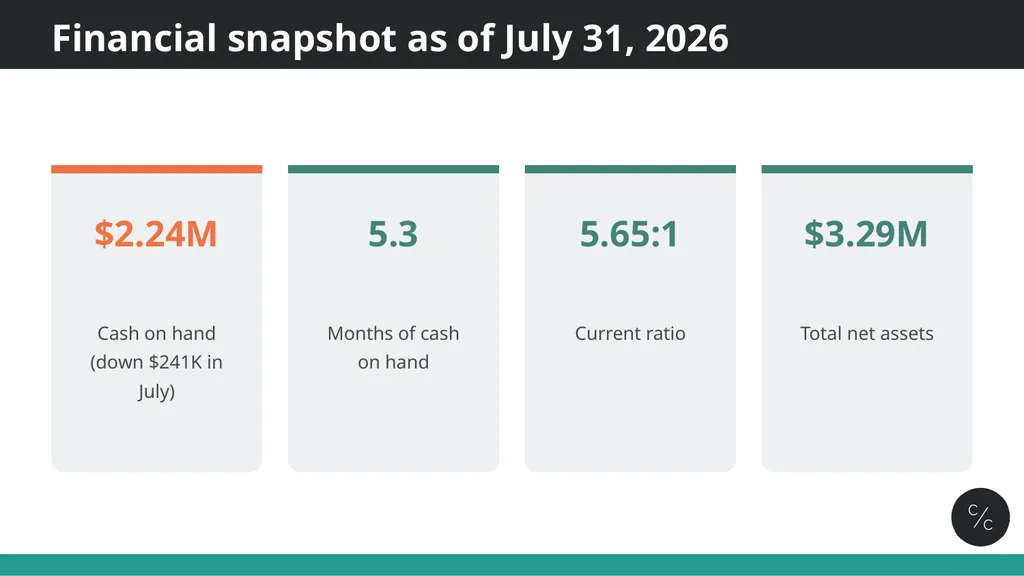
slide2. Financial snapshot as of July 31, 2026 $2.24M Cash on hand (down $241K in July) 5.3 Months of cash on hand 5.65:1 Current ratio $3.29M Total net assets<br>
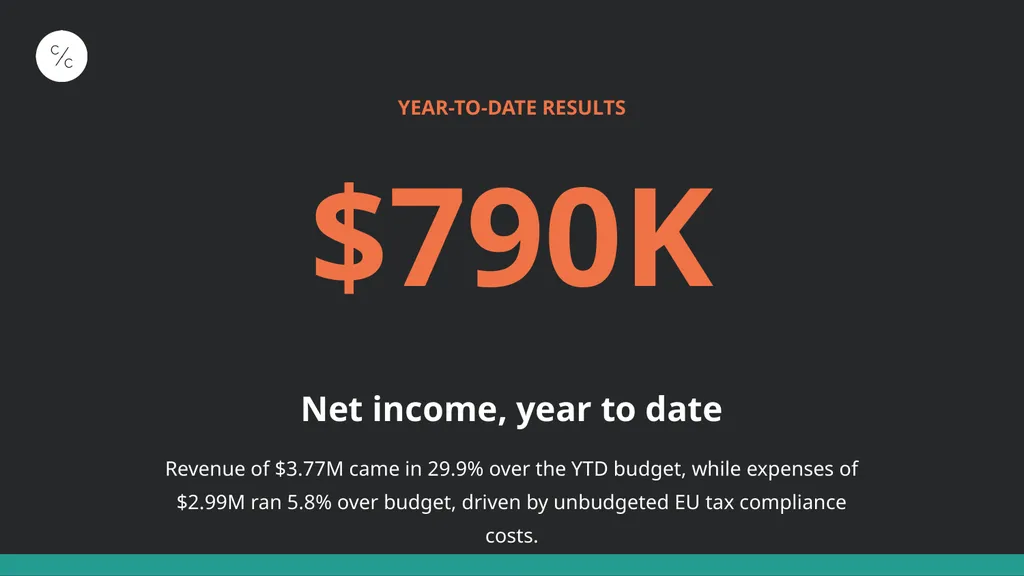
slide3. YEAR-TO-DATE RESULTS $790K Net income, year to date Revenue of $3.77M came in 29.9% over the YTD budget, while expenses of $2.99M ran 5.8% over budget, driven by unbudgeted EU tax compliance costs.<br>
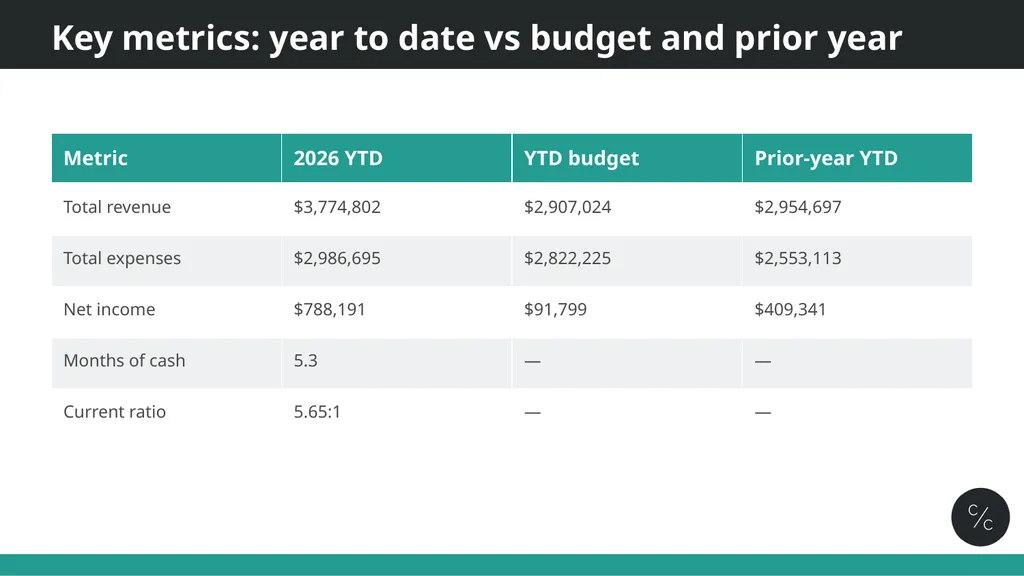
slide4. Key metrics: year to date vs budget and prior year<br>
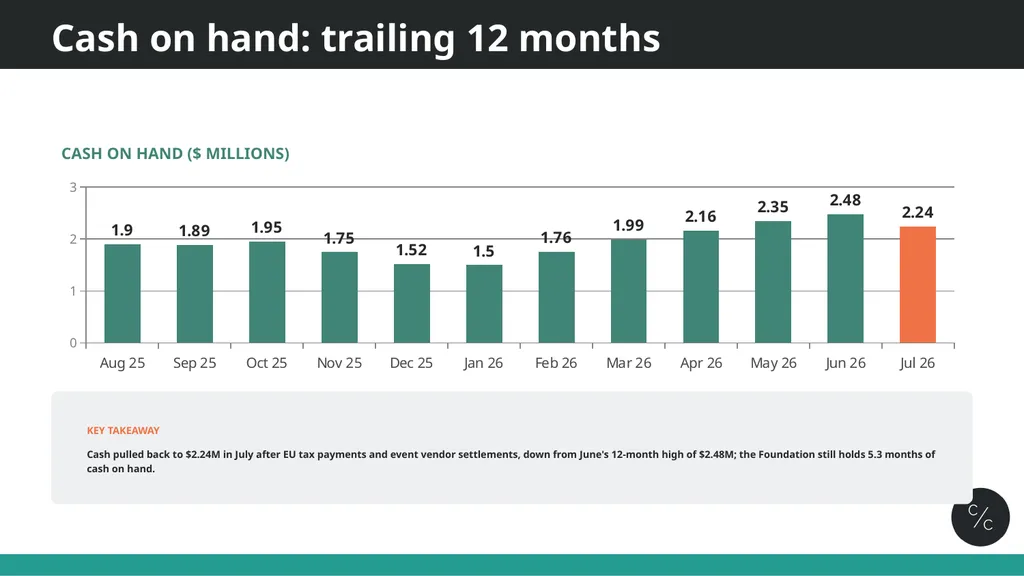
slide5. Cash on hand: trailing 12 months CASH ON HAND ($ MILLIONS) KEY TAKEAWAY
Cash pulled back to $2.24M in July after EU tax payments and event vendor settlements, down from June's 12-month high of $2.48M; the Foundation still holds 5.3 months of cash on hand.<br>
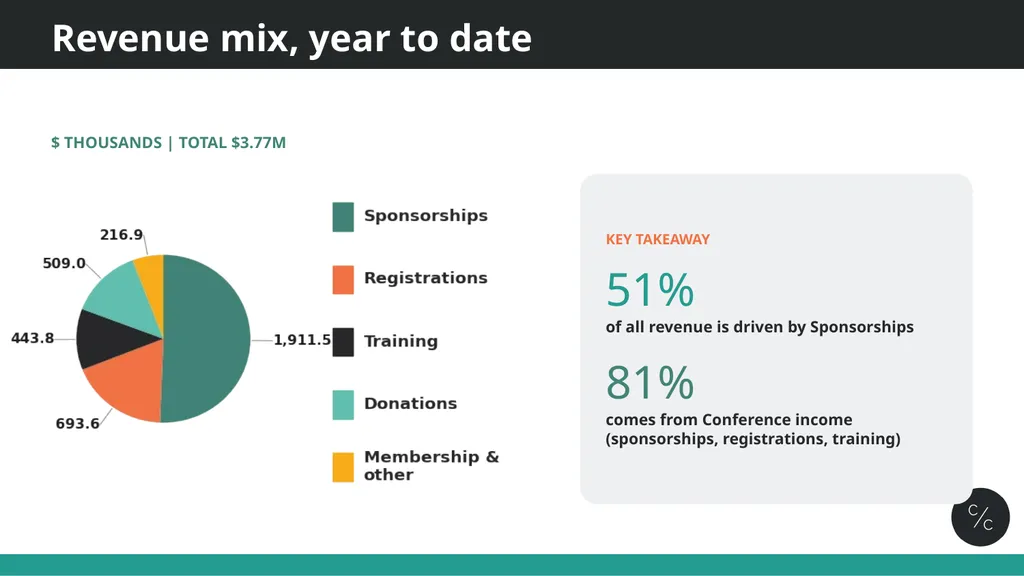
slide6. Revenue mix, year to date $ THOUSANDS | TOTAL $3.77M KEY TAKEAWAY
51%
of all revenue is driven by Sponsorships
81%
comes from Conference income (sponsorships, registrations, training)<br>
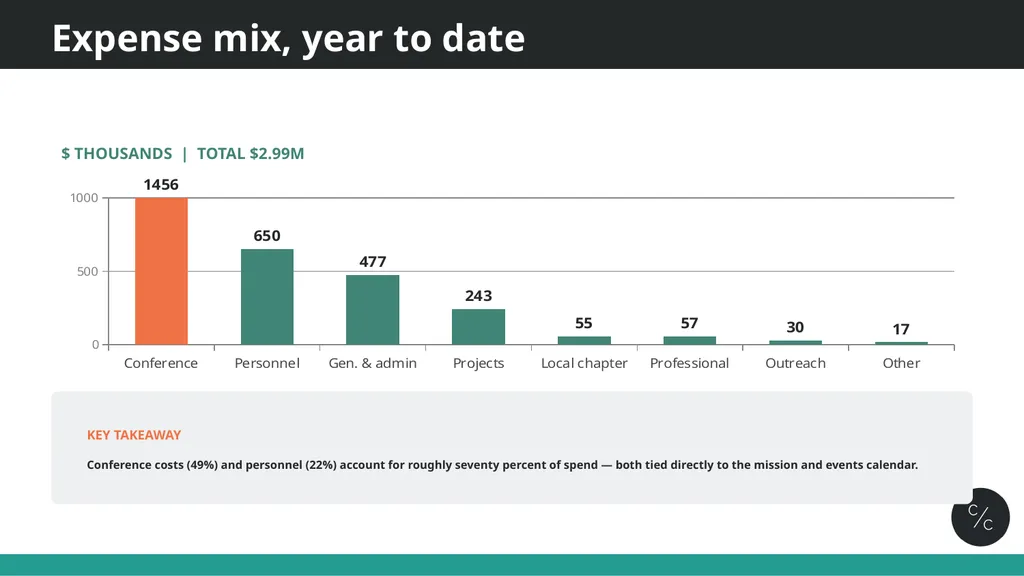
slide7. Expense mix, year to date $ THOUSANDS | TOTAL $2.99M KEY TAKEAWAY
Conference costs (49%) and personnel (22%) account for roughly seventy percent of spend — both tied directly to the mission and events calendar.<br>
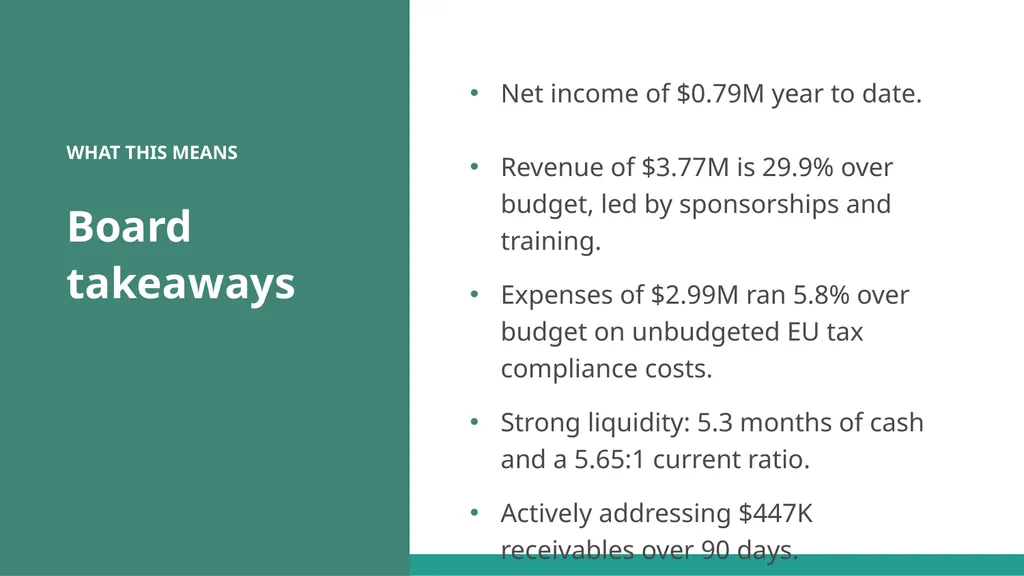
slide8. WHAT THIS MEANS Board takeaways Net income of $0.79M year to date.
Revenue of $3.77M is 29.9% over budget, led by sponsorships and training.
Expenses of $2.99M ran 5.8% over budget on unbudgeted EU tax compliance costs.
Strong liquidity: 5.3 months of cash and a 5.65:1 current ratio.
Actively addressing $447K receivables over 90 days.<br>
slide9. Thank you Prepared by The Charity CFO | July 2026<br>
slide2. Financial snapshot as of July 31, 2026 $2.24M Cash on hand (down $241K in July) 5.3 Months of cash on hand 5.65:1 Current ratio $3.29M Total net assets<br>
slide3. YEAR-TO-DATE RESULTS $790K Net income, year to date Revenue of $3.77M came in 29.9% over the YTD budget, while expenses of $2.99M ran 5.8% over budget, driven by unbudgeted EU tax compliance costs.<br>
slide4. Key metrics: year to date vs budget and prior year<br>
slide5. Cash on hand: trailing 12 months CASH ON HAND ($ MILLIONS) KEY TAKEAWAY
Cash pulled back to $2.24M in July after EU tax payments and event vendor settlements, down from June's 12-month high of $2.48M; the Foundation still holds 5.3 months of cash on hand.<br>
slide6. Revenue mix, year to date $ THOUSANDS | TOTAL $3.77M KEY TAKEAWAY
51%
of all revenue is driven by Sponsorships
81%
comes from Conference income (sponsorships, registrations, training)<br>
slide7. Expense mix, year to date $ THOUSANDS | TOTAL $2.99M KEY TAKEAWAY
Conference costs (49%) and personnel (22%) account for roughly seventy percent of spend — both tied directly to the mission and events calendar.<br>
slide8. WHAT THIS MEANS Board takeaways Net income of $0.79M year to date.
Revenue of $3.77M is 29.9% over budget, led by sponsorships and training.
Expenses of $2.99M ran 5.8% over budget on unbudgeted EU tax compliance costs.
Strong liquidity: 5.3 months of cash and a 5.65:1 current ratio.
Actively addressing $447K receivables over 90 days.<br>
slide9. Thank you Prepared by The Charity CFO | July 2026<br>