
Bridging the gap between planned & actual

Description: Bridging the gap between planned actual performance ( Anabtawi Group) Team Members Abdulkareem Gh. Odeh Muthanna Hajj Riham Sabbah Rimaa Odeh Haneen Anabtawi Project Supervisor: ENG.Tamer Haddad Outline Introduction Problem Statement
Related Topics
Download Presentation
"Bridging the gap between planned & actual" is the property of its rightful owner. Permission is granted to download and print the materials on this website for personal, non-commercial use only, and to display it on your personal computer provided you do not modify the materials and that you retain all copyright notices contained in the materials. By downloading content from our website, you accept the terms of this agreement.
Presentation Transcript
slide1. Bridging the gap between planned & actual performance ( Anabtawi Group)<br>
slide2. Team Members Abdulkareem Gh. Odeh
Muthanna Hajj
Riham Sabbah
Rima`a Odeh
Haneen Anabtawi
* Project Supervisor: ENG.Tamer Haddad<br>
slide3. Outline Introduction
Problem Statement
Overview Performance Management
Methodology
Data Analysis
Discussion
Recommendation<br>
slide4. Introduction Anabtawi Group is one of the first companies to operate in Palestine. Its beginnings go back to 1963 when Anabtawi General Trade Company was established.
In addition to the Palestinian Quality Certificate awarded by the Palestinian Specifications & Standards Authority, the company was awarded the Organic goods production certificate and the ISO 22000 food safety certificate for its production of Palestinian olive oil to become the first company in the world to obtain this certificate in the field of olive oil storage and packing.<br>
slide5. Problem Statement Anabtawi group has been encountered mismatching between the set and actual targets in production, sales and marketing departments. This mismatching adversely affects the organizational performance of the group.<br>
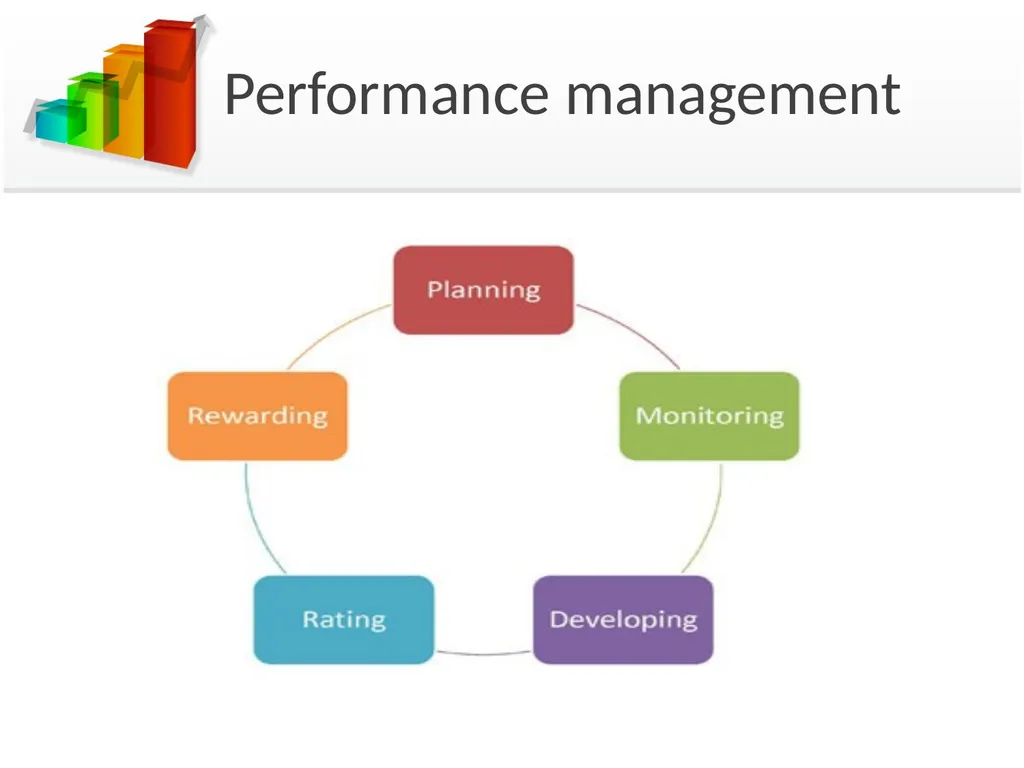
slide6. Performance management Performance management is basically a system of different processes that combine to create an effective workforce within the company that can effectively reach to the business goals .Performance management involves much more than just assigning ratings. It is a continuous cycle that involves:<br>
slide7. Performance management<br>
slide8. Methodology Reading and Research
Visits and Observation
Data collection and analysis
Checking the objectives on (SMART) criteria
Gap Analysis
Description for root causes of the problem by using cause and effect diagram<br>
slide9. Data Collection & Analysis Reading & Research:
Includes a searching process by internet ,scientific articles, case studies and other resources that are related to performance management.
The objective of this stage is to get a knowledge and experience in this field to be able to perform best work and gain the best results.<br>
slide10. Data Collection & Analysis Visits & Observations :
We was visited the internal supply chain departments in the factory to recognize and understand the mechanism of work, so that we record notes for every department in order to configure the general perception about the activities of departments and functions to do preliminary analysis of information.<br>
slide11. Data Collection & Analysis Data Collection and Analysis:
In this stage we start to collect information in different ways (meetings, observations ,interviews and surveys).
Then the data was separated for each department and analyzed to get preliminary notes about performance of internal supply chain departments to start searching about the causes of deviation.<br>
slide12. Data Collection & Analysis Surveys<br>
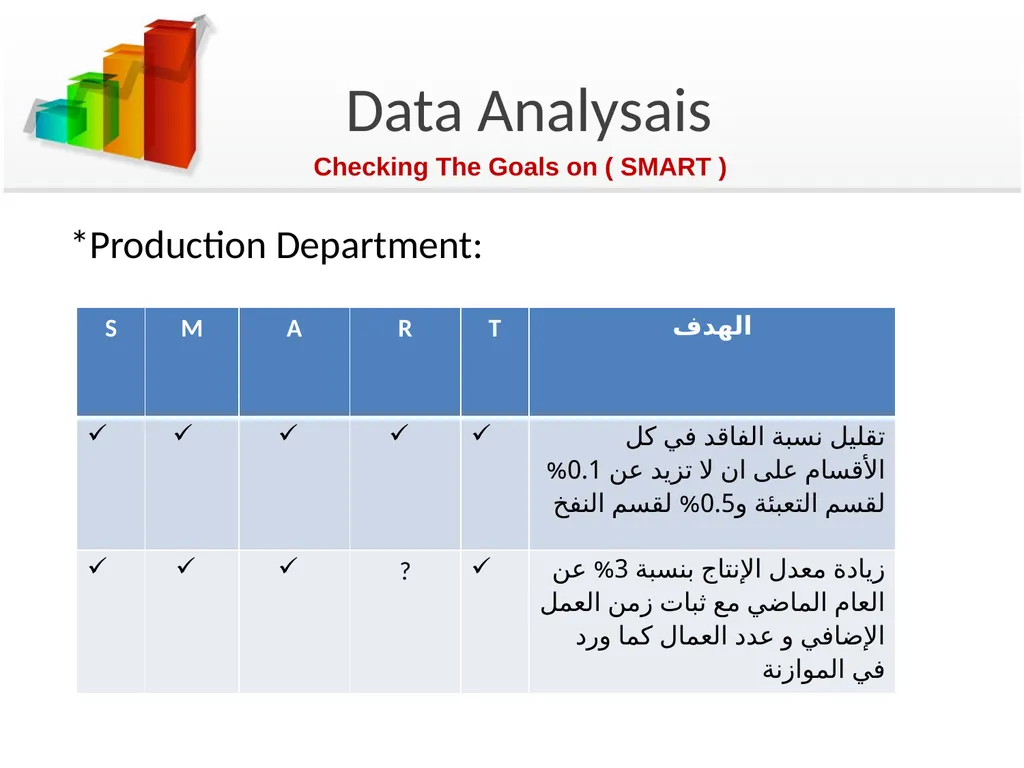
slide13. Data Analysais *Production Department: Checking The Goals on ( SMART )<br>
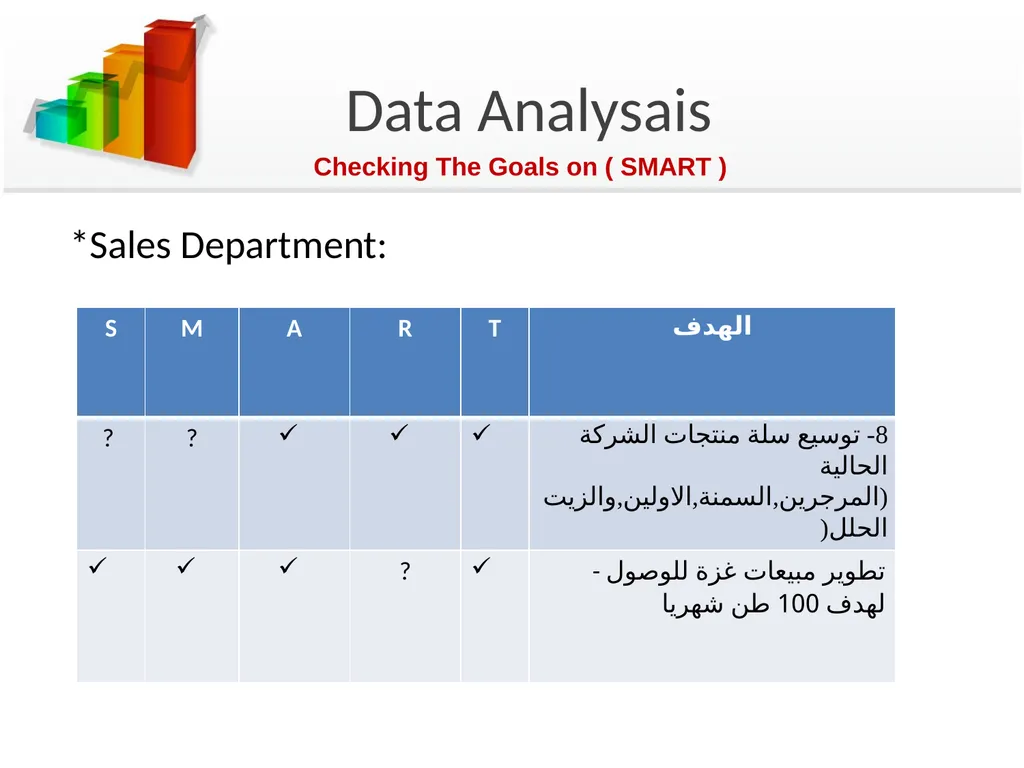
slide14. Data Analysais *Sales Department: Checking The Goals on ( SMART )<br>
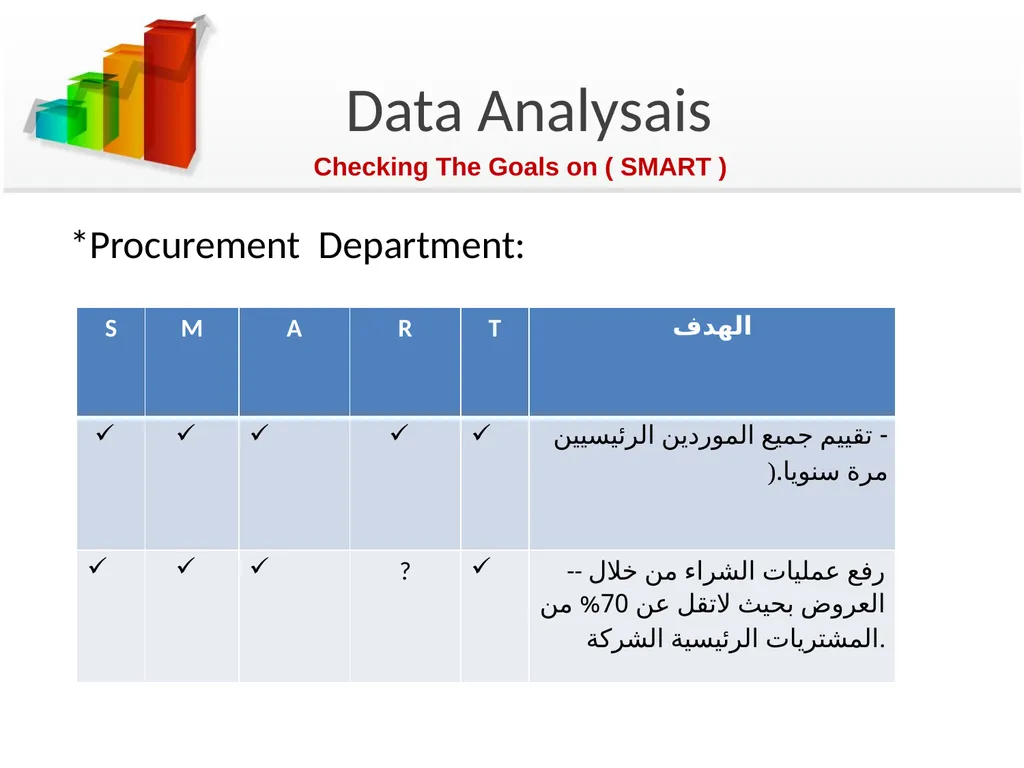
slide15. Data Analysais *Procurement Department: Checking The Goals on ( SMART )<br>
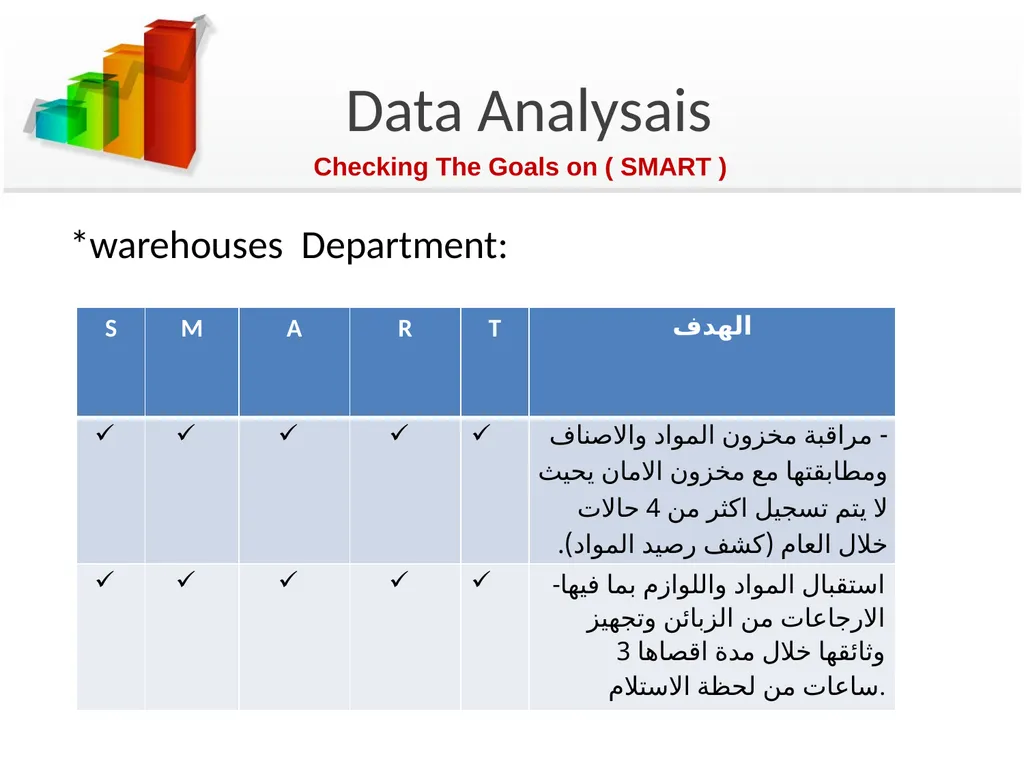
slide16. Data Analysais *warehouses Department: Checking The Goals on ( SMART )<br>
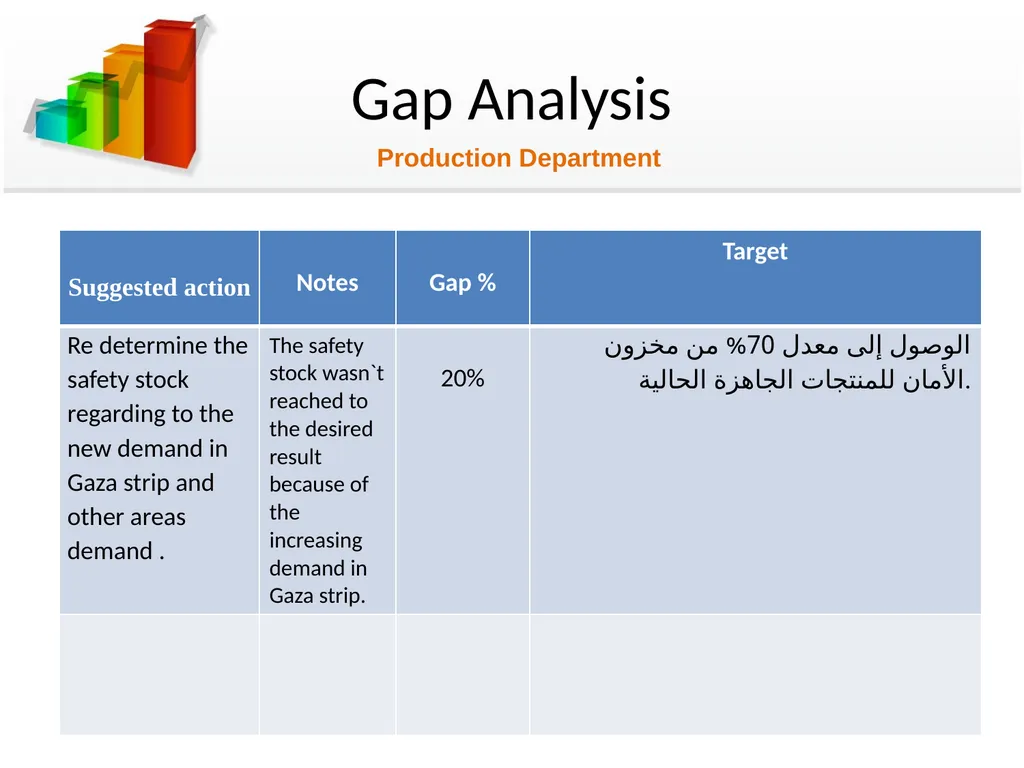
slide17. Gap Analysis Production Department<br>
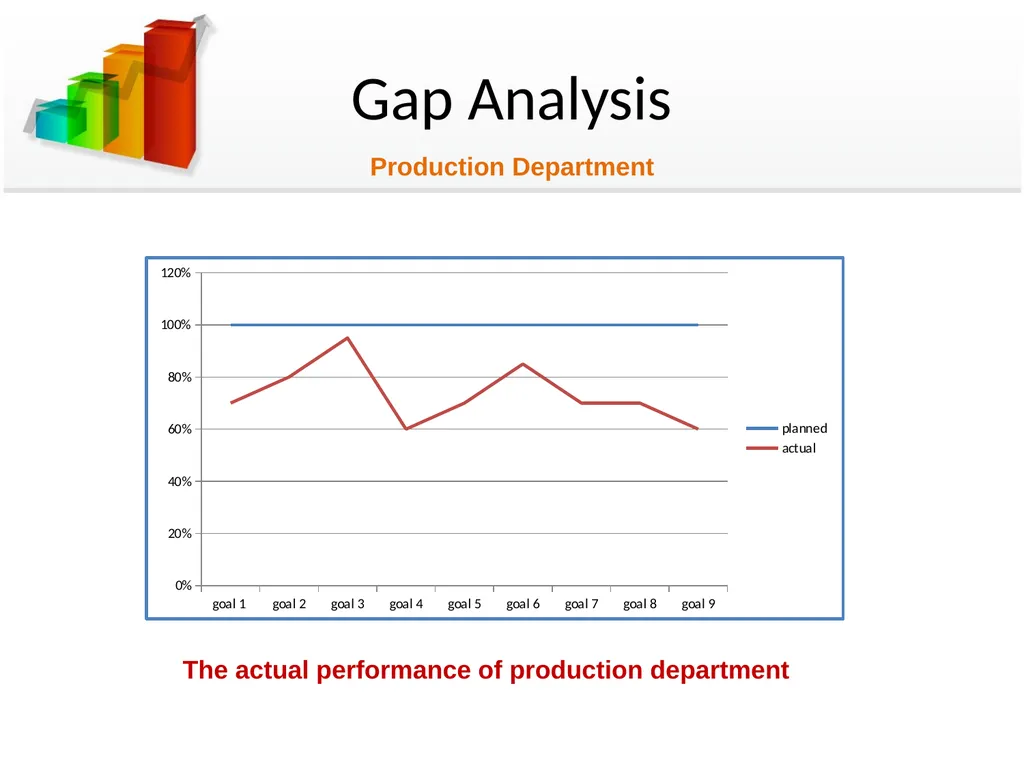
slide18. Gap Analysis The actual performance of production department Production Department<br>
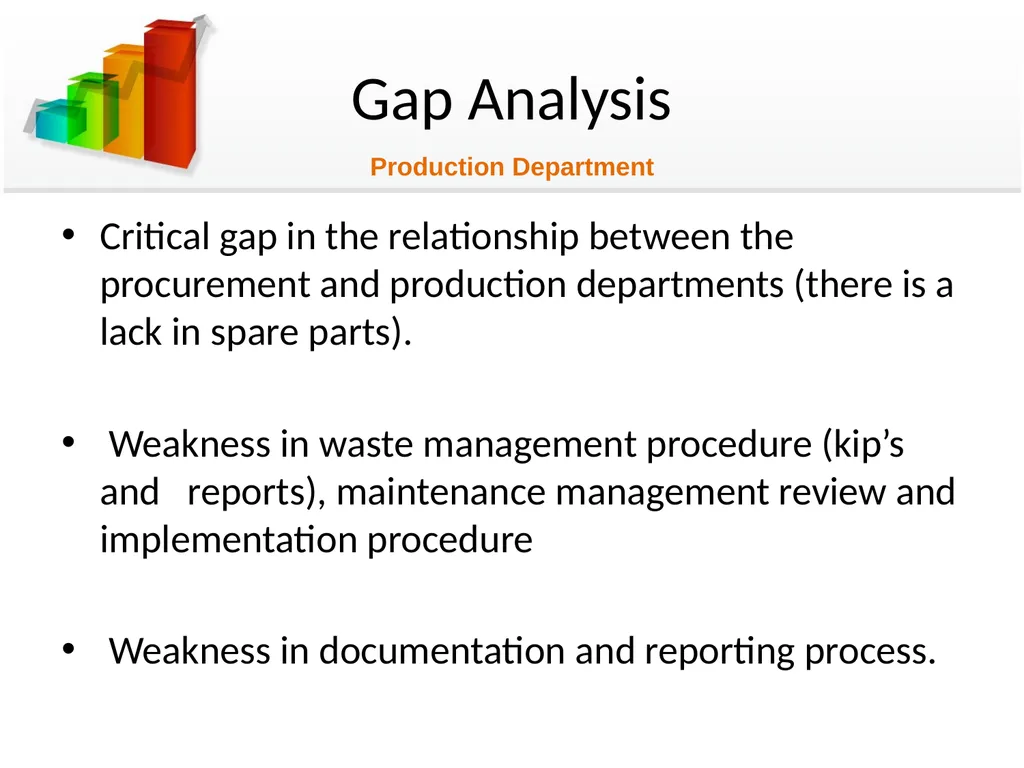
slide19. Gap Analysis Critical gap in the relationship between the procurement and production departments (there is a lack in spare parts).
Weakness in waste management procedure (kip’s and reports), maintenance management review and implementation procedure
Weakness in documentation and reporting process. Production Department<br>
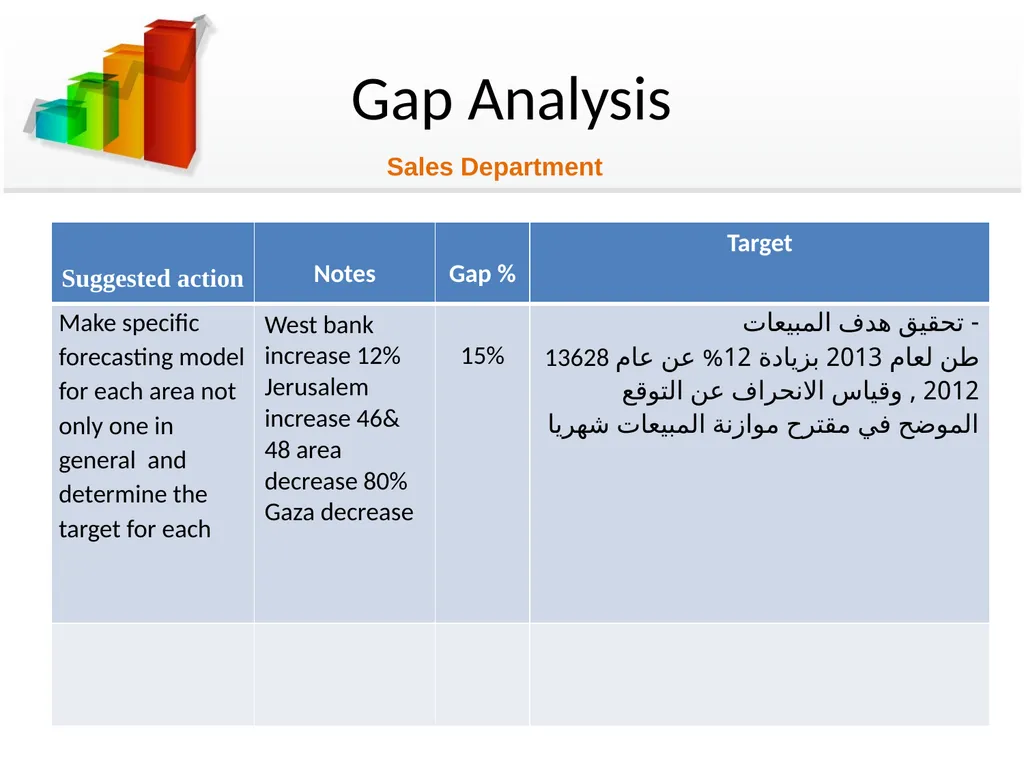
slide20. Gap Analysis Sales Department<br>
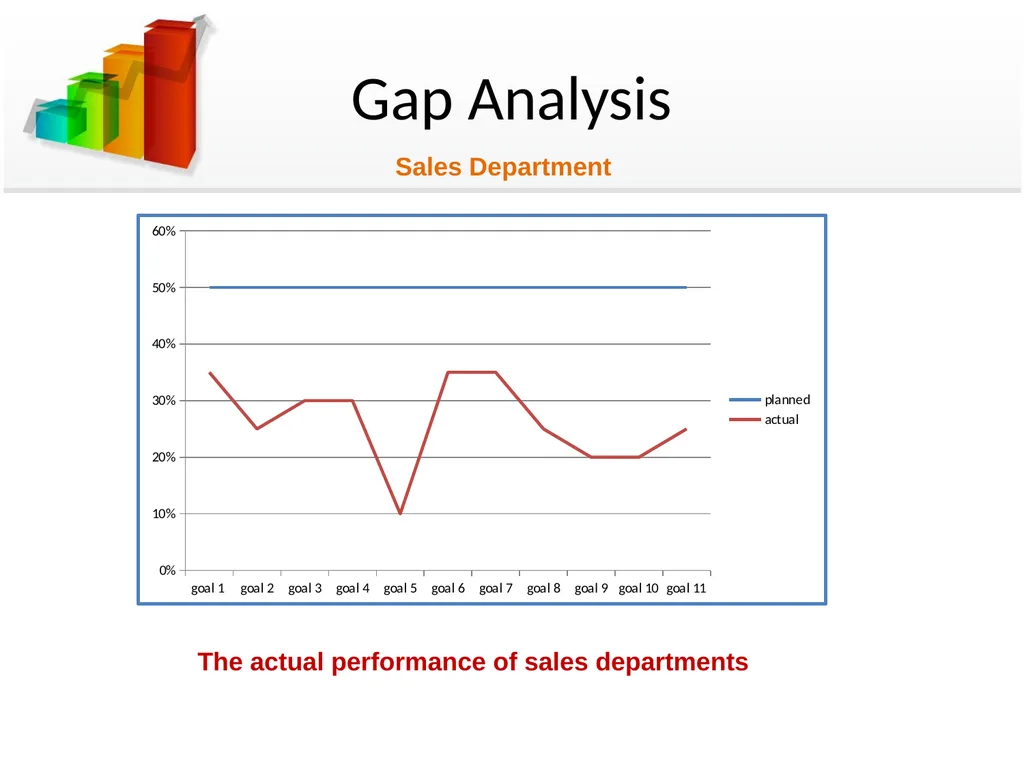
slide21. Gap Analysis Sales Department The actual performance of sales departments<br>
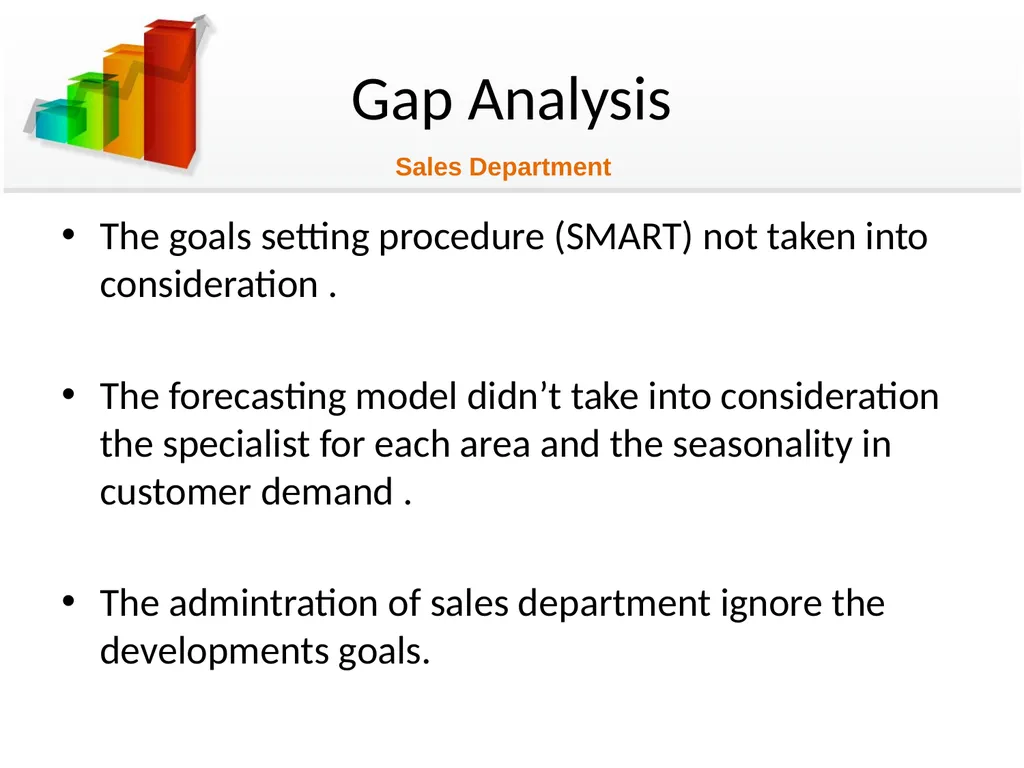
slide22. Gap Analysis The goals setting procedure (SMART) not taken into consideration .
The forecasting model didn’t take into consideration the specialist for each area and the seasonality in customer demand .
The admintration of sales department ignore the developments goals. Sales Department<br>
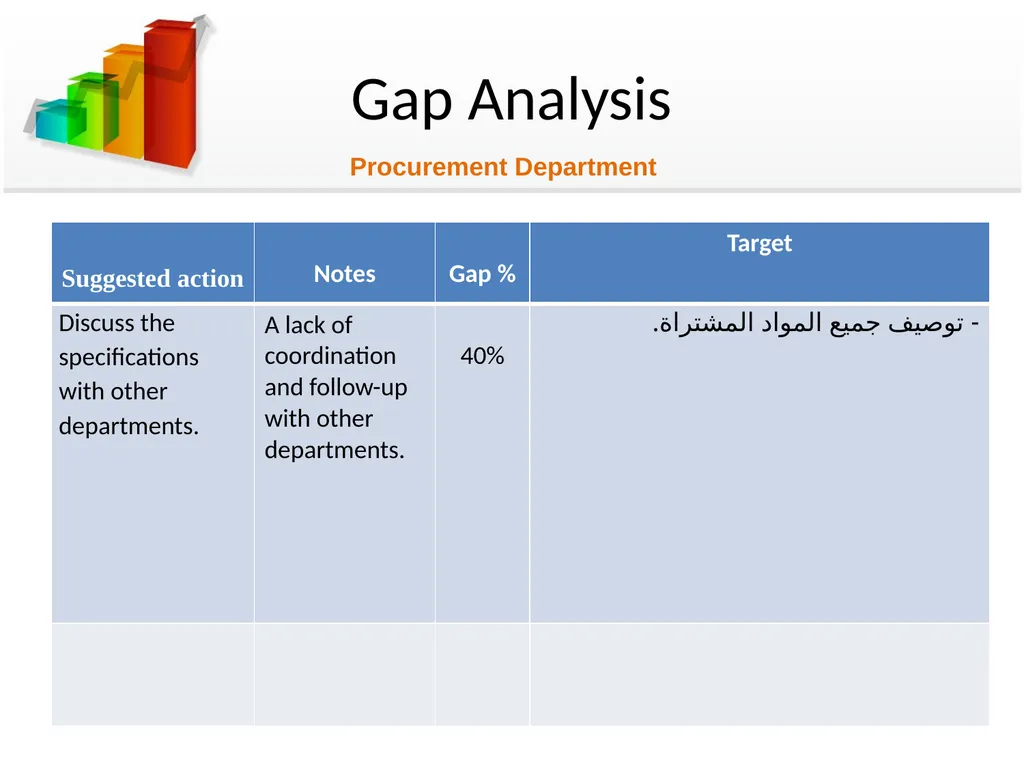
slide23. Gap Analysis Procurement Department<br>
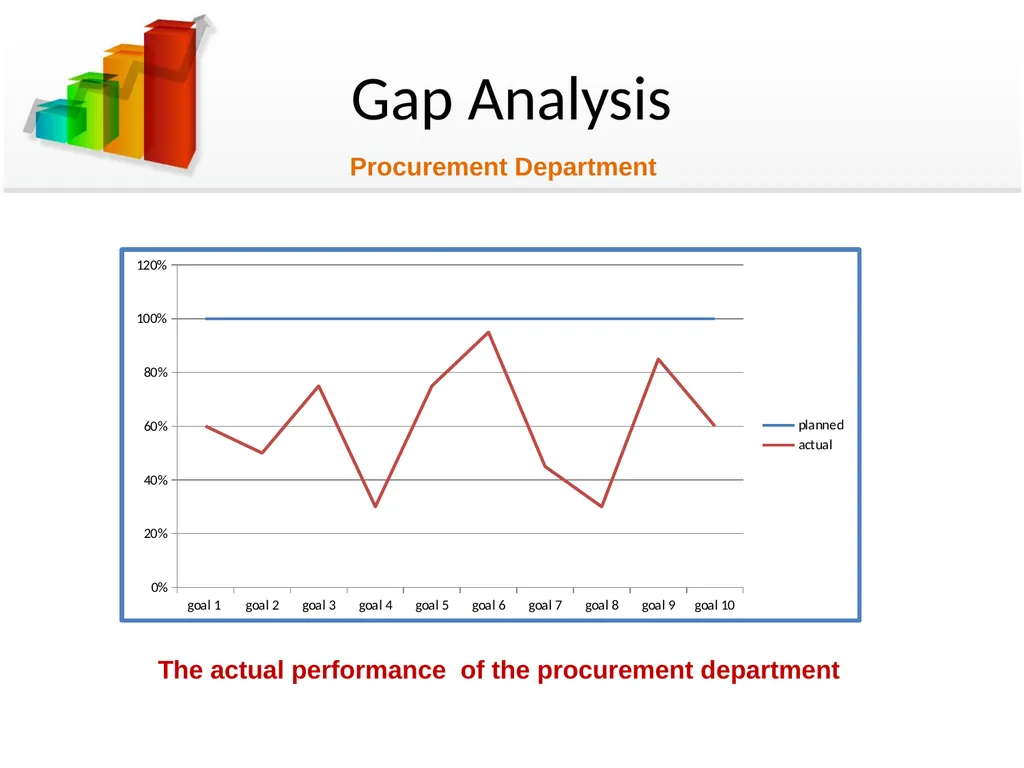
slide24. Gap Analysis Procurement Department The actual performance of the procurement department<br>
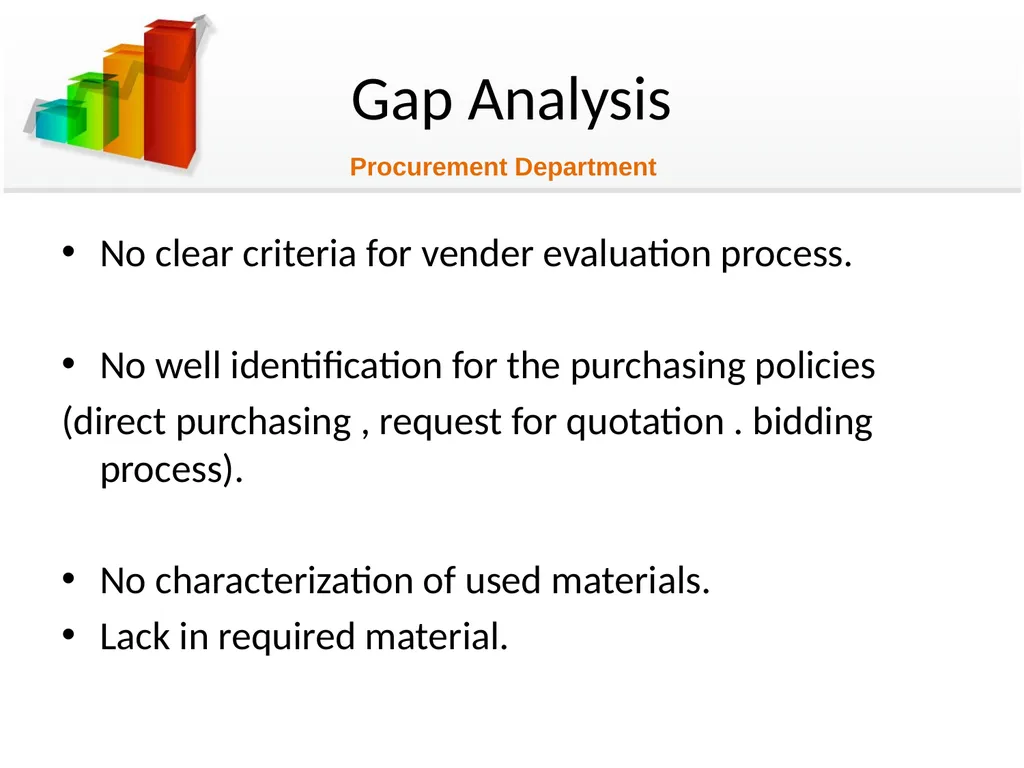
slide25. Gap Analysis No clear criteria for vender evaluation process.
No well identification for the purchasing policies
(direct purchasing , request for quotation . bidding process).
No characterization of used materials.
Lack in required material. Procurement Department<br>
slide26. Gap Analysis Warehouse Department<br>
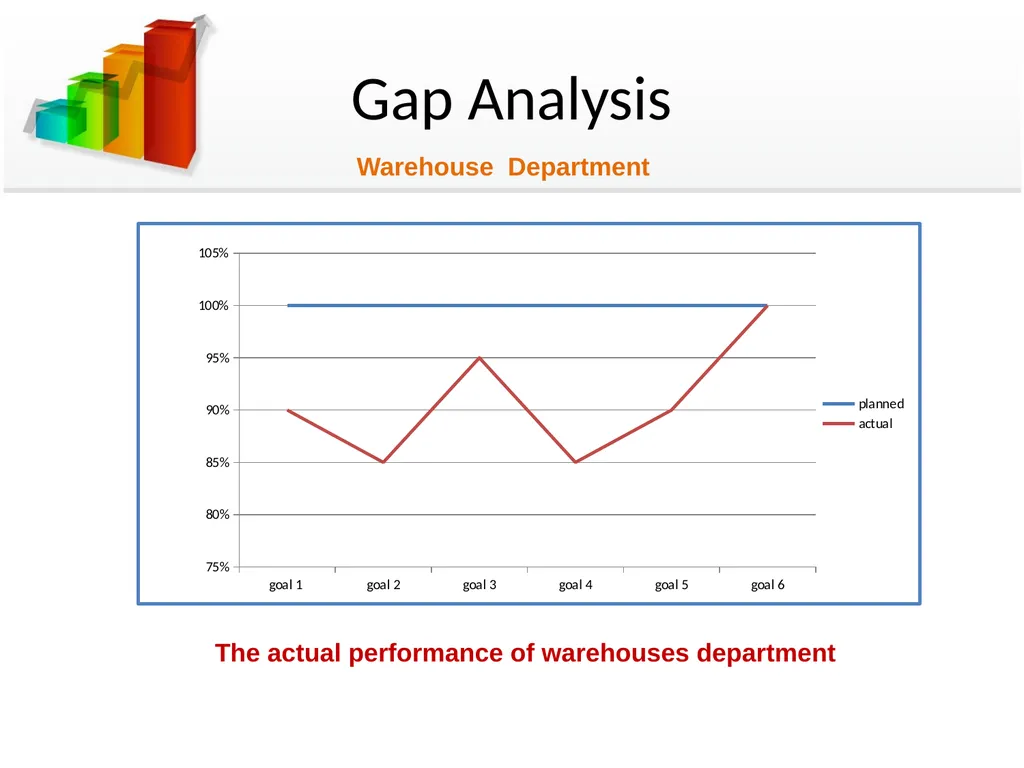
slide27. Gap Analysis Warehouse Department The actual performance of warehouses department<br>
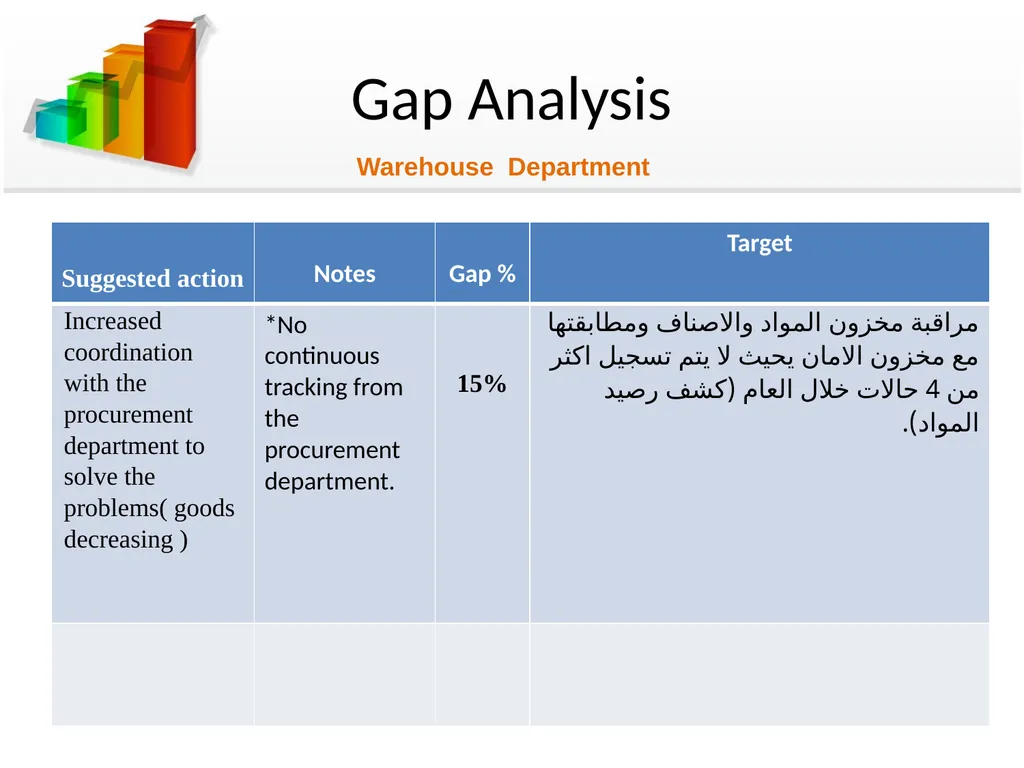
slide28. Gap Analysis Warehouse management performance seems in good level.
There is some needs to improve this and improve the relationship with the procurement management .
develop a coding system to make the ordering process more easy and reliable. Warehouse Department<br>
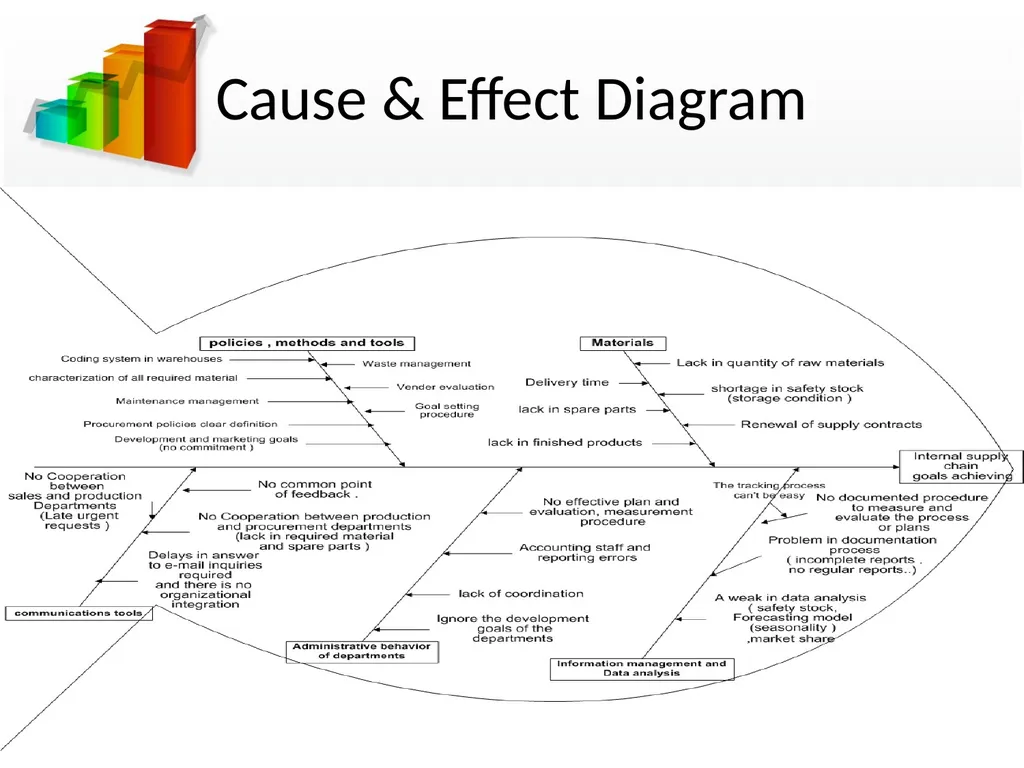
slide29. Cause & Effect Diagram<br>
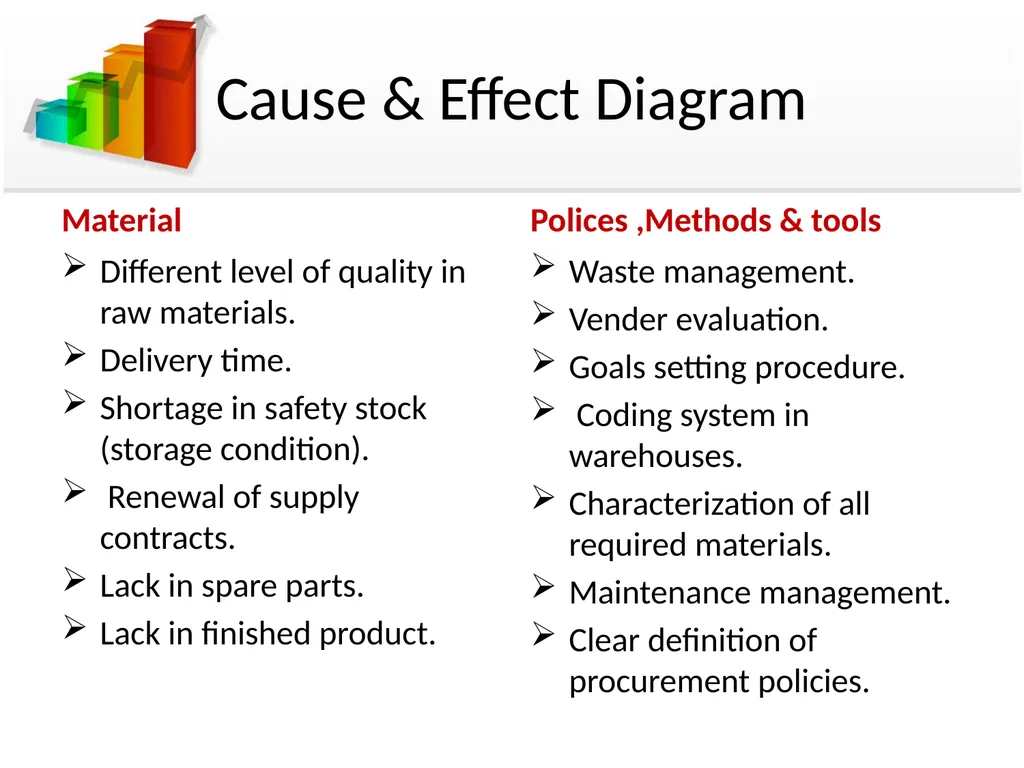
slide30. Cause & Effect Diagram Material Different level of quality in raw materials.
Delivery time.
Shortage in safety stock (storage condition).
Renewal of supply contracts.
Lack in spare parts.
Lack in finished product. Polices ,Methods & tools Waste management.
Vender evaluation.
Goals setting procedure.
Coding system in warehouses.
Characterization of all required materials.
Maintenance management.
Clear definition of procurement policies.<br>
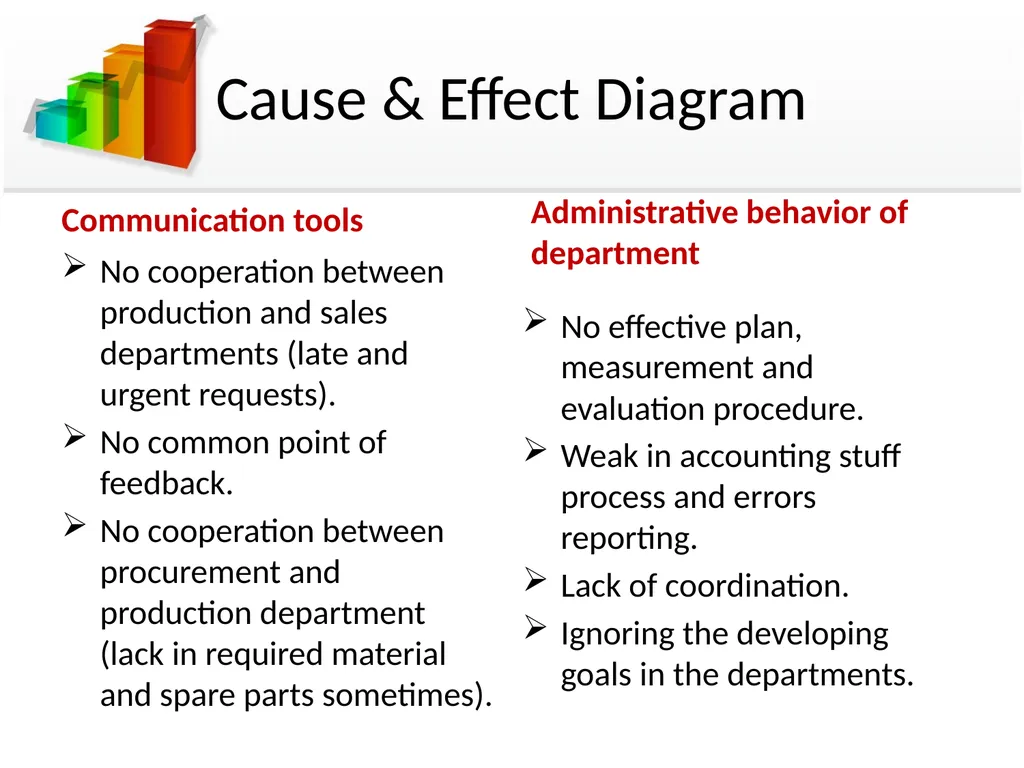
slide31. Cause & Effect Diagram Communication tools No cooperation between production and sales departments (late and urgent requests).
No common point of feedback.
No cooperation between procurement and production department (lack in required material and spare parts sometimes). Administrative behavior of department No effective plan, measurement and evaluation procedure.
Weak in accounting stuff process and errors reporting.
Lack of coordination.
Ignoring the developing goals in the departments.<br>
slide32. Cause & Effect Diagram *Information management and data analysis:
No documented procedure to measure and evaluate the processes or planes.
The tracking process can’t be easy (lack in reports).
A weak in documentation process (incomplete reports and not regular).
A weak in data analysis (safety stock, forecasting model –seasonality- and market share).<br>
slide33. Recommandations *Production :
Improve the coordination process between the sales , production and procurement departments.
Develop an effective maintenance plan with implementation scheduling and determine the spare parts needed.
improve a suitable KPI`s to determine the waste and losses in the production area.
Provide a measurement devices to measure the quantity of the oil entered to the production line to make the KPI`s more effective<br>
slide34. Recommendation *Sales :
Improve the documentation process and data analysis.
Develop an efficient forecasting model.
Perform periodic studies for the market share and updating the data regularly.
Documented feedback system.
Update the marketing plan for each area individually and set a procedure to measure and evaluate these plans.
Develop the relationships between sales department with procurement and production departments.
Try to Use customer relationship management (CRM) system if possible.<br>
slide35. Recommendation *Procurement :
Adopting a person from each department to characterize the required material and set the required specifications and also take it as a reference in vender evaluation process.
Design clear criteria to evaluate the vendors with take into consideration the required specifications.
Adopting the purchasing polices and determines the range for each (Direct purchasing, request for quotation which need a vendor list and bidding process).
Renewal of supplier contract<br>
slide36. Recommendation *Warehouses :
Develop a coding system to increase the efficiency of management process in the inventory.<br>
slide37. General Recommendation Improve the documentation process in the company at all .
Improve the communications between the departments to increase the coordination between them.
Develop the administrative behavior for the head of each department by given them a training courses to show the importance of administration process and set a development targets.<br>
slide2. Team Members Abdulkareem Gh. Odeh
Muthanna Hajj
Riham Sabbah
Rima`a Odeh
Haneen Anabtawi
* Project Supervisor: ENG.Tamer Haddad<br>
slide3. Outline Introduction
Problem Statement
Overview Performance Management
Methodology
Data Analysis
Discussion
Recommendation<br>
slide4. Introduction Anabtawi Group is one of the first companies to operate in Palestine. Its beginnings go back to 1963 when Anabtawi General Trade Company was established.
In addition to the Palestinian Quality Certificate awarded by the Palestinian Specifications & Standards Authority, the company was awarded the Organic goods production certificate and the ISO 22000 food safety certificate for its production of Palestinian olive oil to become the first company in the world to obtain this certificate in the field of olive oil storage and packing.<br>
slide5. Problem Statement Anabtawi group has been encountered mismatching between the set and actual targets in production, sales and marketing departments. This mismatching adversely affects the organizational performance of the group.<br>
slide6. Performance management Performance management is basically a system of different processes that combine to create an effective workforce within the company that can effectively reach to the business goals .Performance management involves much more than just assigning ratings. It is a continuous cycle that involves:<br>
slide7. Performance management<br>
slide8. Methodology Reading and Research
Visits and Observation
Data collection and analysis
Checking the objectives on (SMART) criteria
Gap Analysis
Description for root causes of the problem by using cause and effect diagram<br>
slide9. Data Collection & Analysis Reading & Research:
Includes a searching process by internet ,scientific articles, case studies and other resources that are related to performance management.
The objective of this stage is to get a knowledge and experience in this field to be able to perform best work and gain the best results.<br>
slide10. Data Collection & Analysis Visits & Observations :
We was visited the internal supply chain departments in the factory to recognize and understand the mechanism of work, so that we record notes for every department in order to configure the general perception about the activities of departments and functions to do preliminary analysis of information.<br>
slide11. Data Collection & Analysis Data Collection and Analysis:
In this stage we start to collect information in different ways (meetings, observations ,interviews and surveys).
Then the data was separated for each department and analyzed to get preliminary notes about performance of internal supply chain departments to start searching about the causes of deviation.<br>
slide12. Data Collection & Analysis Surveys<br>
slide13. Data Analysais *Production Department: Checking The Goals on ( SMART )<br>
slide14. Data Analysais *Sales Department: Checking The Goals on ( SMART )<br>
slide15. Data Analysais *Procurement Department: Checking The Goals on ( SMART )<br>
slide16. Data Analysais *warehouses Department: Checking The Goals on ( SMART )<br>
slide17. Gap Analysis Production Department<br>
slide18. Gap Analysis The actual performance of production department Production Department<br>
slide19. Gap Analysis Critical gap in the relationship between the procurement and production departments (there is a lack in spare parts).
Weakness in waste management procedure (kip’s and reports), maintenance management review and implementation procedure
Weakness in documentation and reporting process. Production Department<br>
slide20. Gap Analysis Sales Department<br>
slide21. Gap Analysis Sales Department The actual performance of sales departments<br>
slide22. Gap Analysis The goals setting procedure (SMART) not taken into consideration .
The forecasting model didn’t take into consideration the specialist for each area and the seasonality in customer demand .
The admintration of sales department ignore the developments goals. Sales Department<br>
slide23. Gap Analysis Procurement Department<br>
slide24. Gap Analysis Procurement Department The actual performance of the procurement department<br>
slide25. Gap Analysis No clear criteria for vender evaluation process.
No well identification for the purchasing policies
(direct purchasing , request for quotation . bidding process).
No characterization of used materials.
Lack in required material. Procurement Department<br>
slide26. Gap Analysis Warehouse Department<br>
slide27. Gap Analysis Warehouse Department The actual performance of warehouses department<br>
slide28. Gap Analysis Warehouse management performance seems in good level.
There is some needs to improve this and improve the relationship with the procurement management .
develop a coding system to make the ordering process more easy and reliable. Warehouse Department<br>
slide29. Cause & Effect Diagram<br>
slide30. Cause & Effect Diagram Material Different level of quality in raw materials.
Delivery time.
Shortage in safety stock (storage condition).
Renewal of supply contracts.
Lack in spare parts.
Lack in finished product. Polices ,Methods & tools Waste management.
Vender evaluation.
Goals setting procedure.
Coding system in warehouses.
Characterization of all required materials.
Maintenance management.
Clear definition of procurement policies.<br>
slide31. Cause & Effect Diagram Communication tools No cooperation between production and sales departments (late and urgent requests).
No common point of feedback.
No cooperation between procurement and production department (lack in required material and spare parts sometimes). Administrative behavior of department No effective plan, measurement and evaluation procedure.
Weak in accounting stuff process and errors reporting.
Lack of coordination.
Ignoring the developing goals in the departments.<br>
slide32. Cause & Effect Diagram *Information management and data analysis:
No documented procedure to measure and evaluate the processes or planes.
The tracking process can’t be easy (lack in reports).
A weak in documentation process (incomplete reports and not regular).
A weak in data analysis (safety stock, forecasting model –seasonality- and market share).<br>
slide33. Recommandations *Production :
Improve the coordination process between the sales , production and procurement departments.
Develop an effective maintenance plan with implementation scheduling and determine the spare parts needed.
improve a suitable KPI`s to determine the waste and losses in the production area.
Provide a measurement devices to measure the quantity of the oil entered to the production line to make the KPI`s more effective<br>
slide34. Recommendation *Sales :
Improve the documentation process and data analysis.
Develop an efficient forecasting model.
Perform periodic studies for the market share and updating the data regularly.
Documented feedback system.
Update the marketing plan for each area individually and set a procedure to measure and evaluate these plans.
Develop the relationships between sales department with procurement and production departments.
Try to Use customer relationship management (CRM) system if possible.<br>
slide35. Recommendation *Procurement :
Adopting a person from each department to characterize the required material and set the required specifications and also take it as a reference in vender evaluation process.
Design clear criteria to evaluate the vendors with take into consideration the required specifications.
Adopting the purchasing polices and determines the range for each (Direct purchasing, request for quotation which need a vendor list and bidding process).
Renewal of supplier contract<br>
slide36. Recommendation *Warehouses :
Develop a coding system to increase the efficiency of management process in the inventory.<br>
slide37. General Recommendation Improve the documentation process in the company at all .
Improve the communications between the departments to increase the coordination between them.
Develop the administrative behavior for the head of each department by given them a training courses to show the importance of administration process and set a development targets.<br>