
Bubble Economics David Laibson Econometric Society
TG
Published · 67 slides · 0 views

1 / 1



Description
Bubble Economics David Laibson Econometric Society Meetings Boston University June 4, 2009 The Japanese Bubble Bubble Definition: A bubble occurs when an asset trades above its fundamental value. Another way of saying it: A bubble occurs
Related Topics
Share
Embed code
Download this presentation From Below
"Bubble Economics David Laibson Econometric Society" is the property of its rightful owner. Permission is granted to download and print the materials on this website for personal, non-commercial use only, and to display it on your personal computer provided you do not modify the materials and that you retain all copyright notices contained in the materials. By downloading content from our website, you accept the terms of this agreement.
Presentation Transcript
01
Bubble Economics David Laibson
Econometric Society Meetings
Boston University
June 4, 2009<br>
Econometric Society Meetings
Boston University
June 4, 2009<br>
02
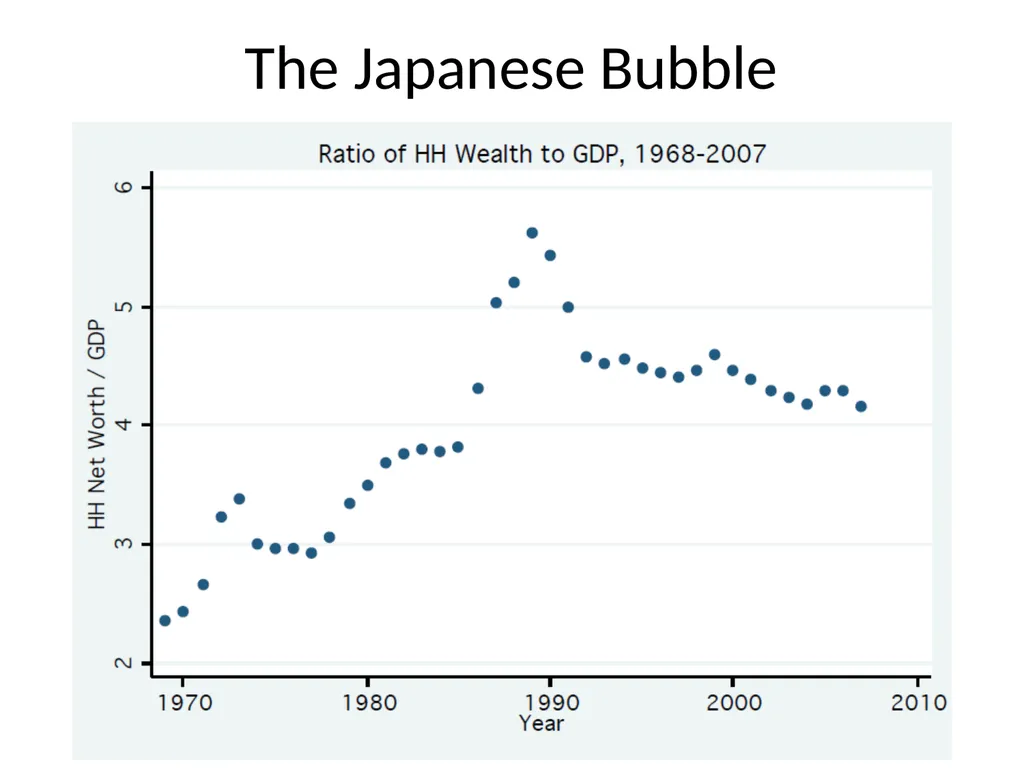
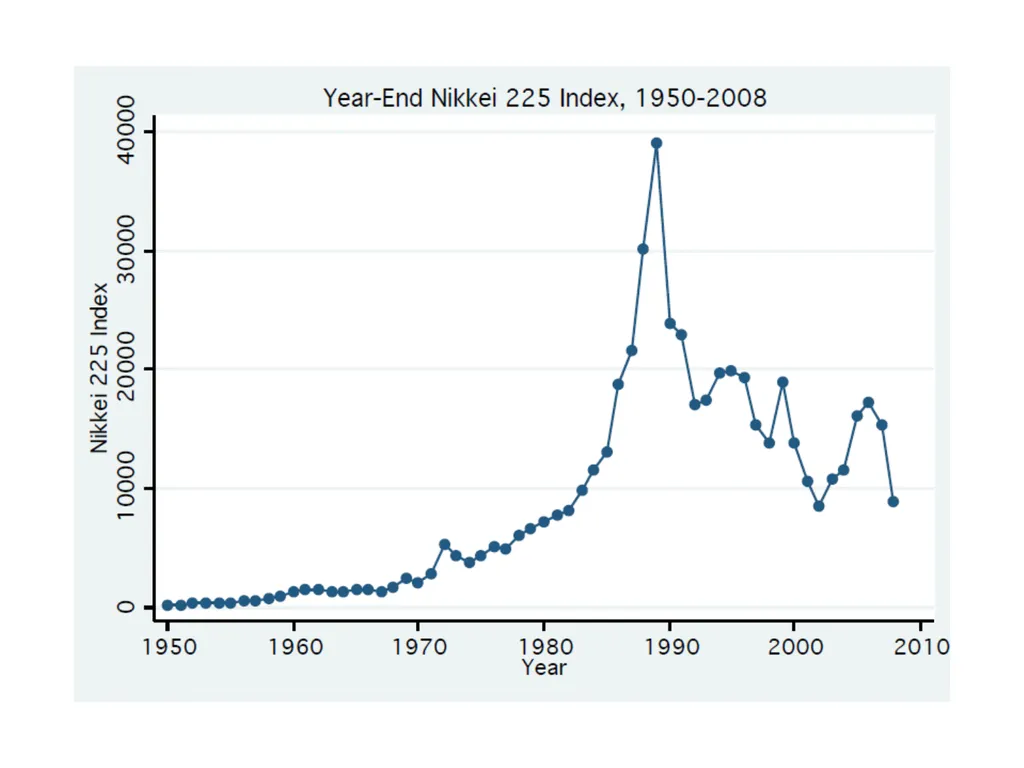
The Japanese Bubble<br>
03
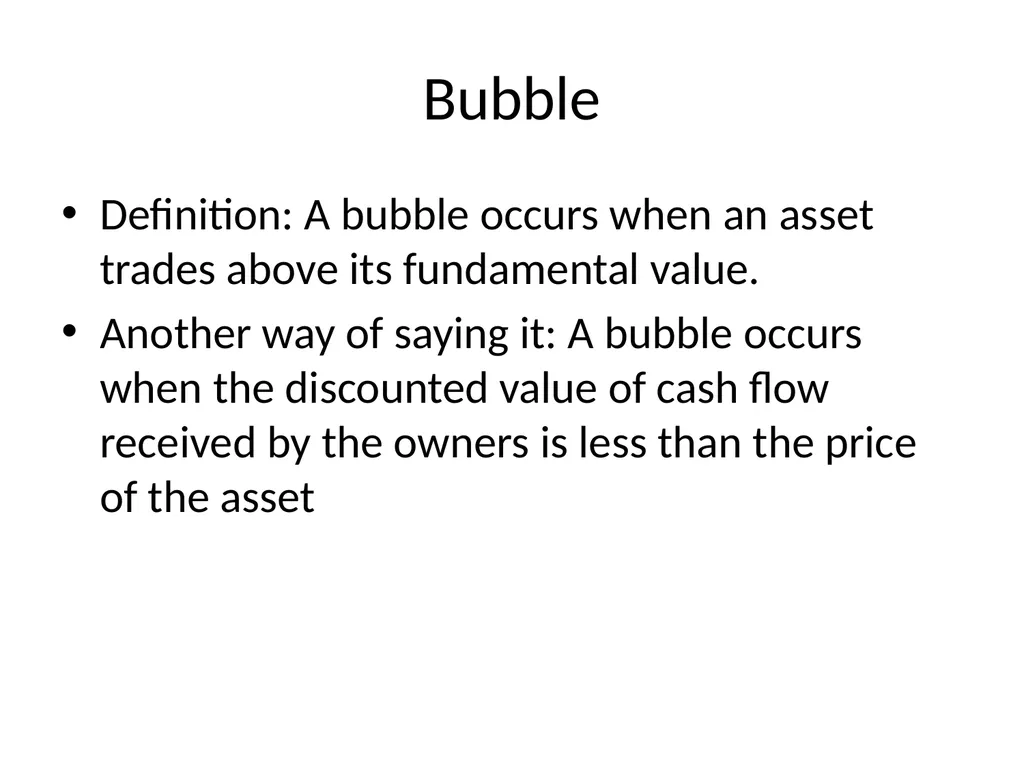
Bubble Definition: A bubble occurs when an asset trades above its fundamental value.
Another way of saying it: A bubble occurs when the discounted value of cash flow received by the owners is less than the price of the asset<br>
Another way of saying it: A bubble occurs when the discounted value of cash flow received by the owners is less than the price of the asset<br>
04
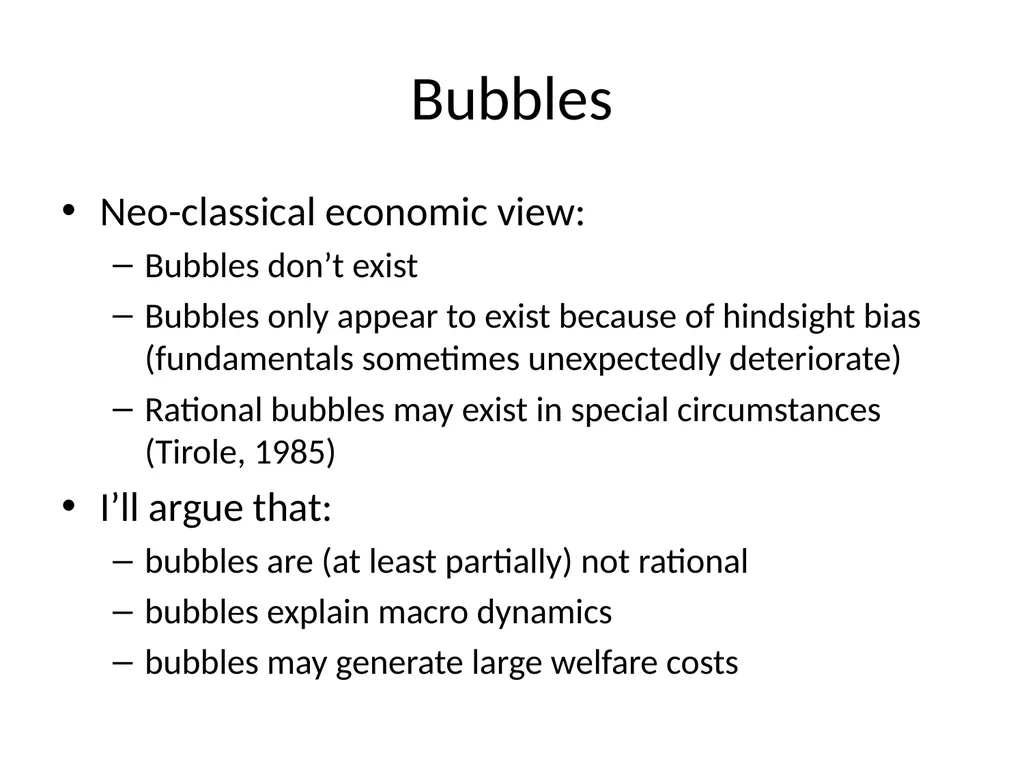
Bubbles Neo-classical economic view:
Bubbles don’t exist
Bubbles only appear to exist because of hindsight bias (fundamentals sometimes unexpectedly deteriorate)
Rational bubbles may exist in special circumstances (Tirole, 1985)
I’ll argue that:
bubbles are (at least partially) not rational
bubbles explain macro dynamics
bubbles may generate large welfare costs<br>
Bubbles don’t exist
Bubbles only appear to exist because of hindsight bias (fundamentals sometimes unexpectedly deteriorate)
Rational bubbles may exist in special circumstances (Tirole, 1985)
I’ll argue that:
bubbles are (at least partially) not rational
bubbles explain macro dynamics
bubbles may generate large welfare costs<br>
05
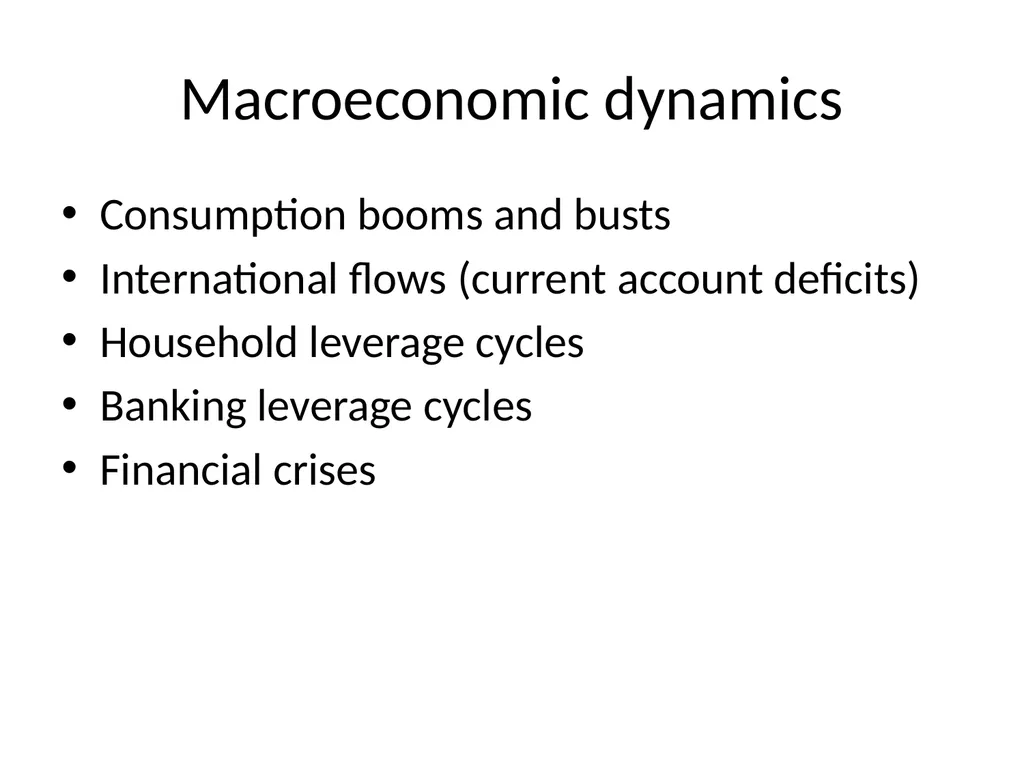
Macroeconomic dynamics Consumption booms and busts
International flows (current account deficits)
Household leverage cycles
Banking leverage cycles
Financial crises<br>
International flows (current account deficits)
Household leverage cycles
Banking leverage cycles
Financial crises<br>
06
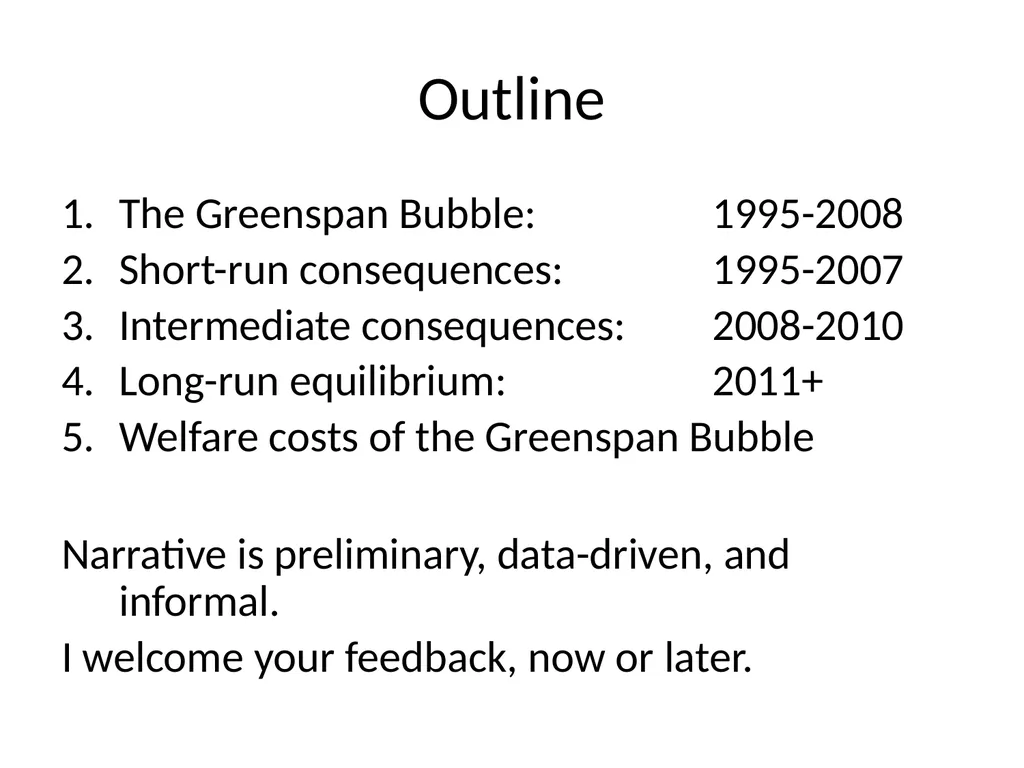
Outline The Greenspan Bubble: 1995-2008
Short-run consequences: 1995-2007
Intermediate consequences: 2008-2010
Long-run equilibrium: 2011+
Welfare costs of the Greenspan Bubble
Narrative is preliminary, data-driven, and informal.
I welcome your feedback, now or later.<br>
Short-run consequences: 1995-2007
Intermediate consequences: 2008-2010
Long-run equilibrium: 2011+
Welfare costs of the Greenspan Bubble
Narrative is preliminary, data-driven, and informal.
I welcome your feedback, now or later.<br>
07
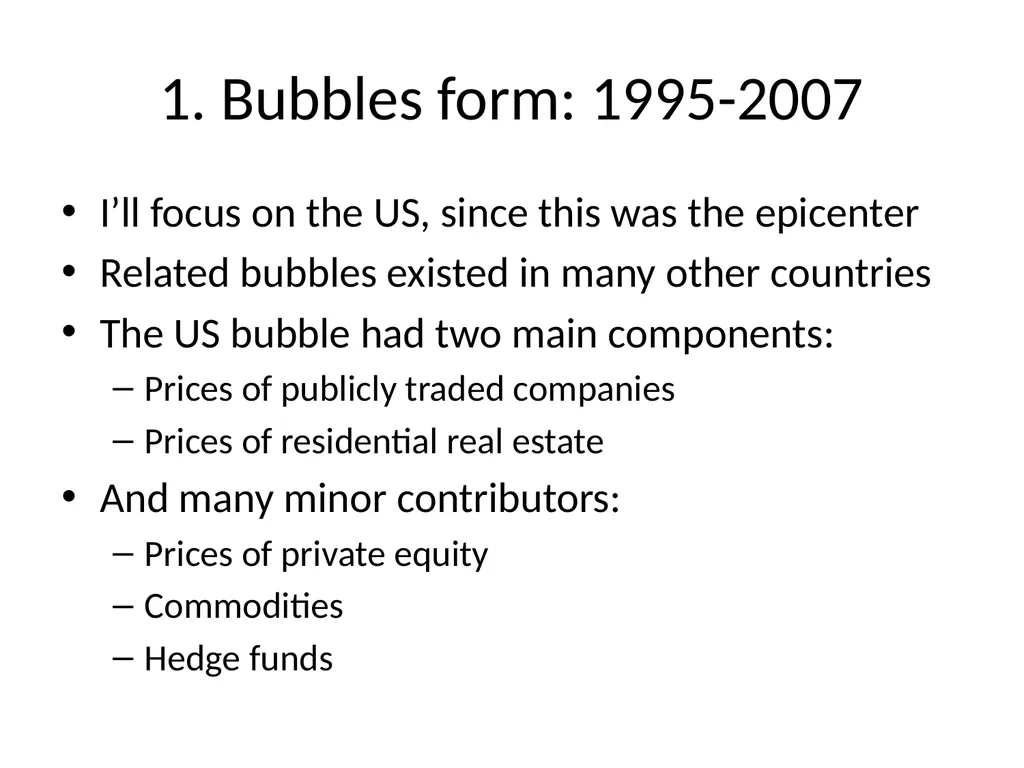
1. Bubbles form: 1995-2007 I’ll focus on the US, since this was the epicenter
Related bubbles existed in many other countries
The US bubble had two main components:
Prices of publicly traded companies
Prices of residential real estate
And many minor contributors:
Prices of private equity
Commodities
Hedge funds<br>
Related bubbles existed in many other countries
The US bubble had two main components:
Prices of publicly traded companies
Prices of residential real estate
And many minor contributors:
Prices of private equity
Commodities
Hedge funds<br>
08
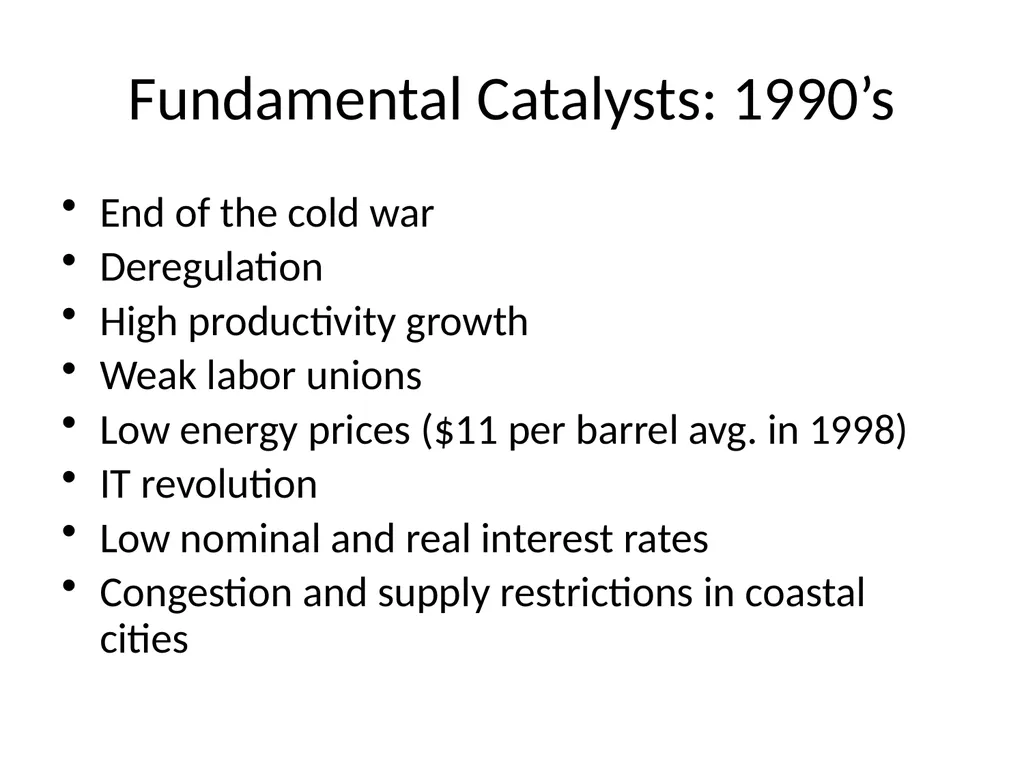
Fundamental Catalysts: 1990’s End of the cold war
Deregulation
High productivity growth
Weak labor unions
Low energy prices ($11 per barrel avg. in 1998)
IT revolution
Low nominal and real interest rates
Congestion and supply restrictions in coastal cities<br>
Deregulation
High productivity growth
Weak labor unions
Low energy prices ($11 per barrel avg. in 1998)
IT revolution
Low nominal and real interest rates
Congestion and supply restrictions in coastal cities<br>
09
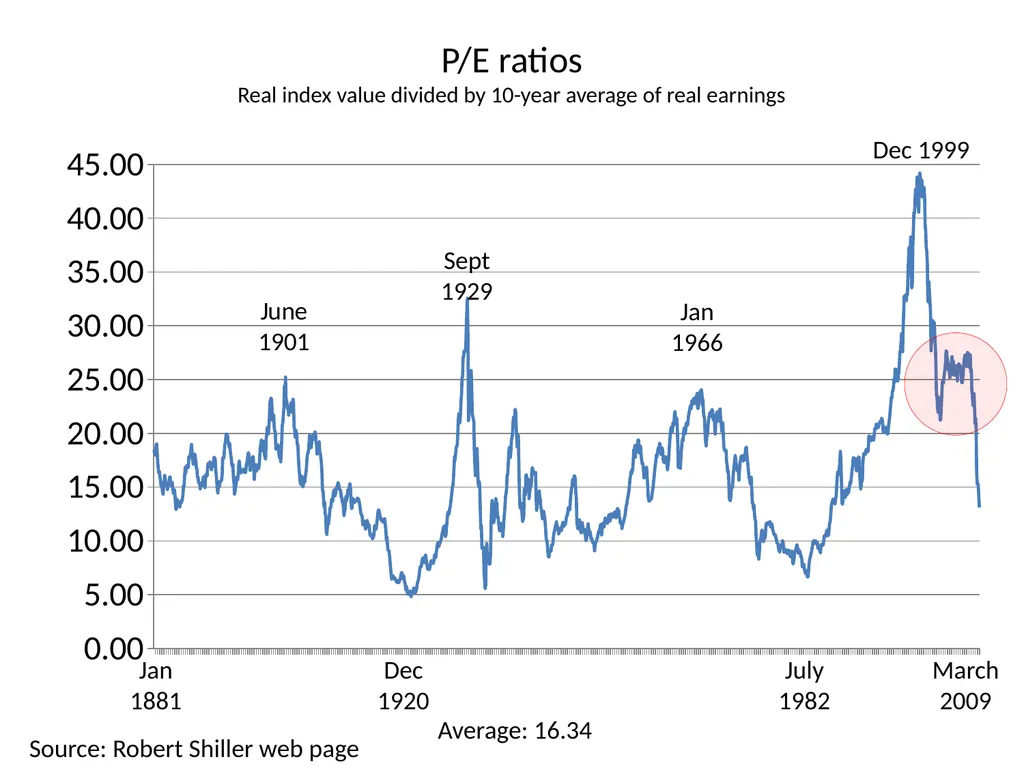
P/E ratios: Cambell and Shiller (1998a,b)
Real index value divided by 10-year average of real earnings Jan
1881 Dec
1920 Sept
1929 July
1982 Jan
1966 Dec 1999 March
2009 Average: 16.34 Source: Robert Shiller web page<br>
1881 Dec
1920 Sept
1929 July
1982 Jan
1966 Dec 1999 March
2009 Average: 16.34 Source: Robert Shiller web page<br>
10
11 Dot com bubble
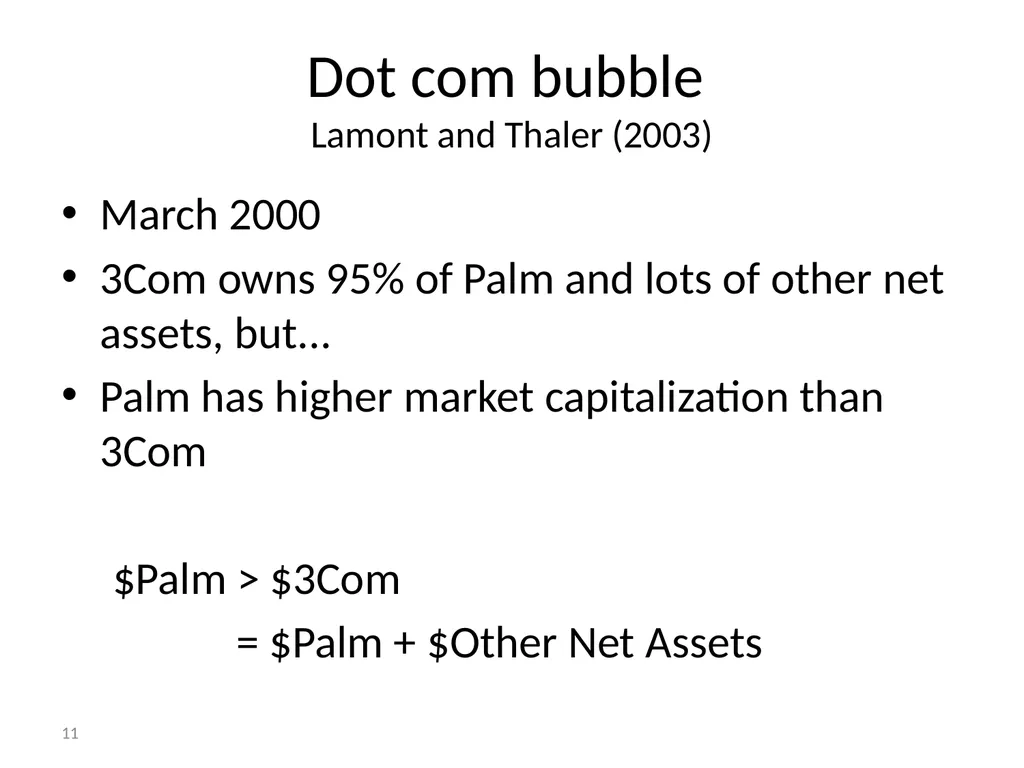
Lamont and Thaler (2003) March 2000
3Com owns 95% of Palm and lots of other net assets, but...
Palm has higher market capitalization than 3Com
$Palm > $3Com
= $Palm + $Other Net Assets<br>
3Com owns 95% of Palm and lots of other net assets, but...
Palm has higher market capitalization than 3Com
$Palm > $3Com
= $Palm + $Other Net Assets<br>
11
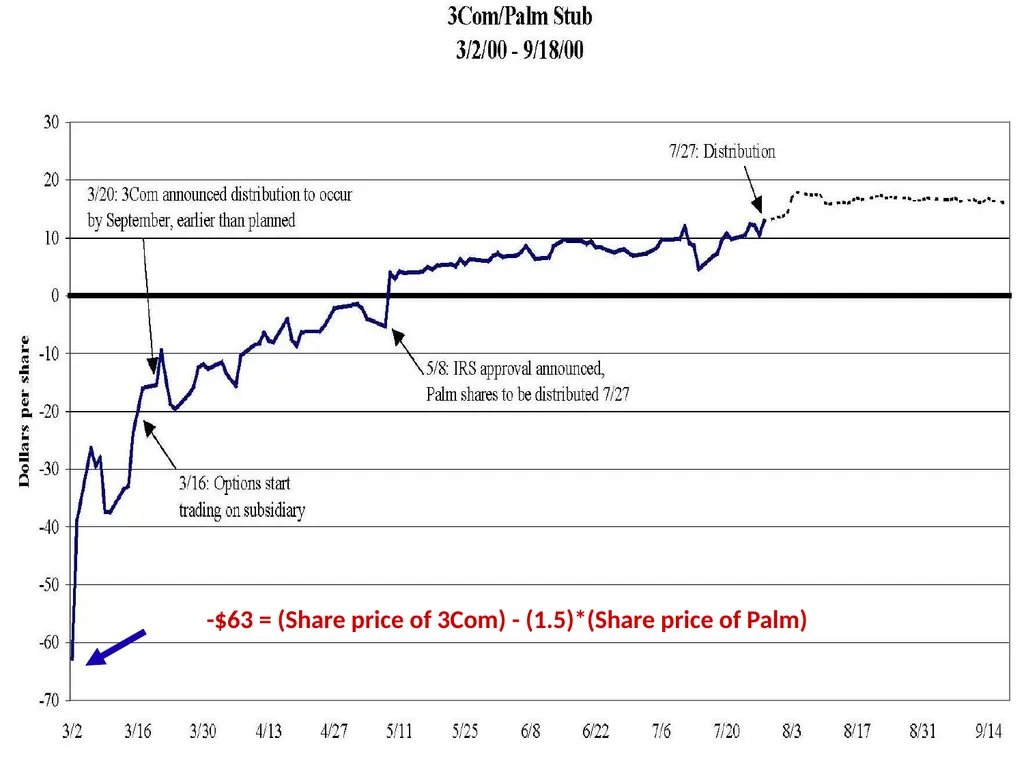
12 -$63 = (Share price of 3Com) - (1.5)*(Share price of Palm)<br>
12
P/E ratios
Real index value divided by 10-year average of real earnings Jan
1881 Dec
1920 Sept
1929 July
1982 Jan
1966 Dec 1999 March
2009 Average: 16.34 Source: Robert Shiller web page<br>
1881 Dec
1920 Sept
1929 July
1982 Jan
1966 Dec 1999 March
2009 Average: 16.34 Source: Robert Shiller web page<br>
13
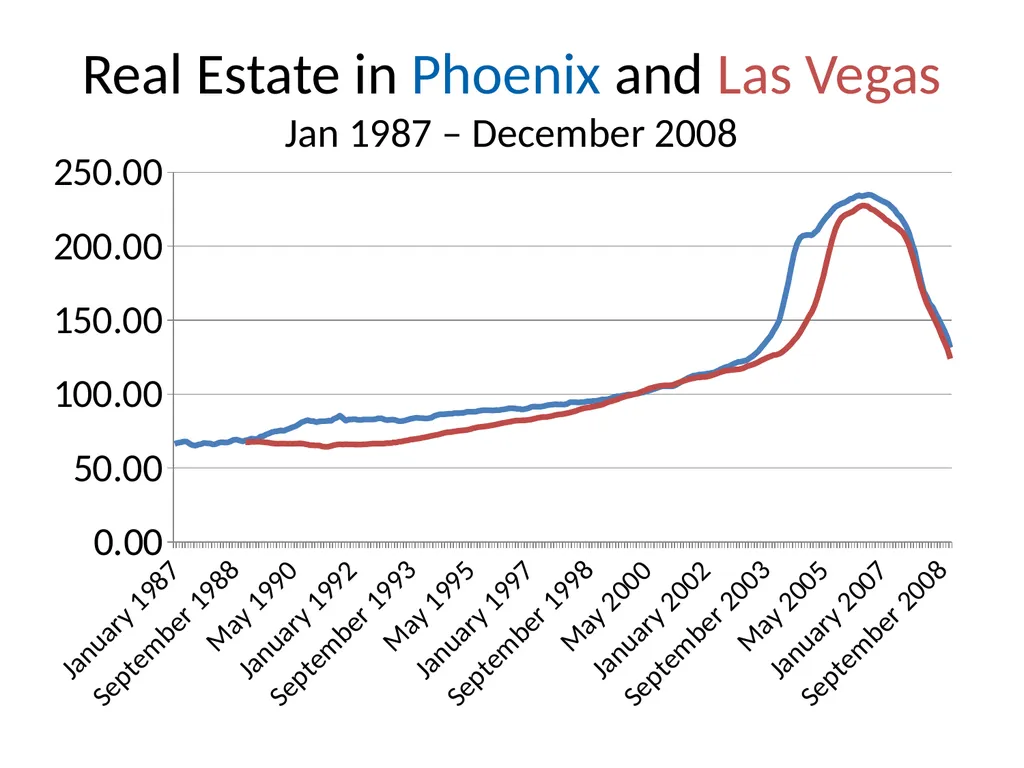
Real Estate in Phoenix and Las Vegas
Jan 1987 – December 2008<br>
14
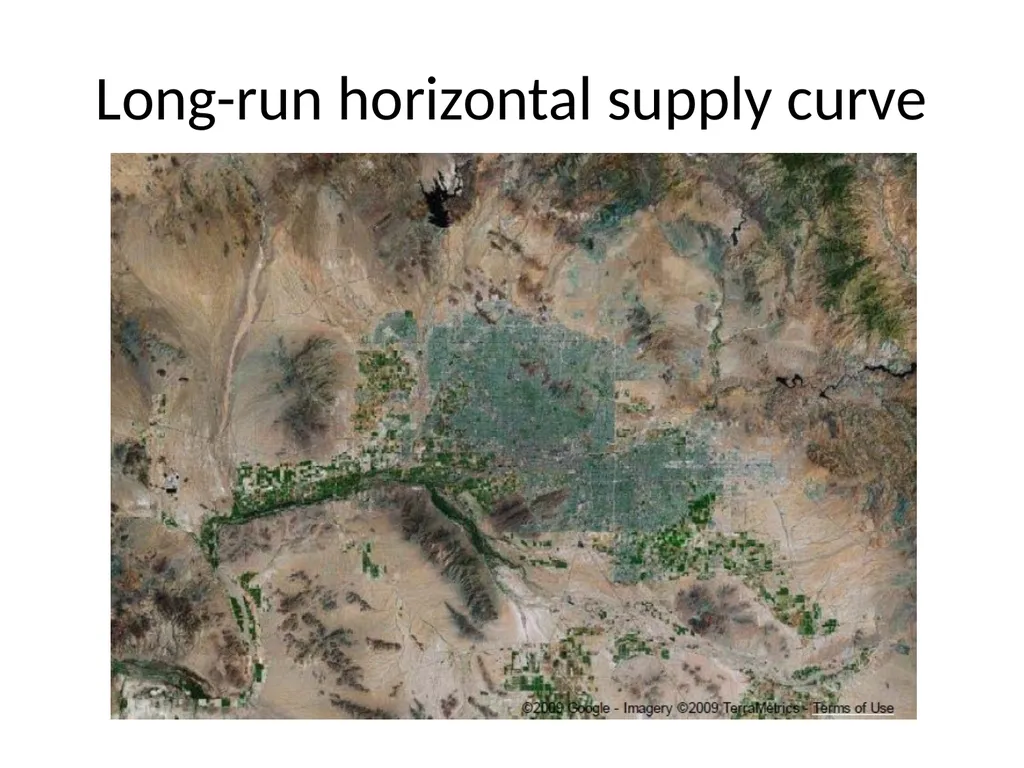
Long-run horizontal supply curve Phoenix<br>
15
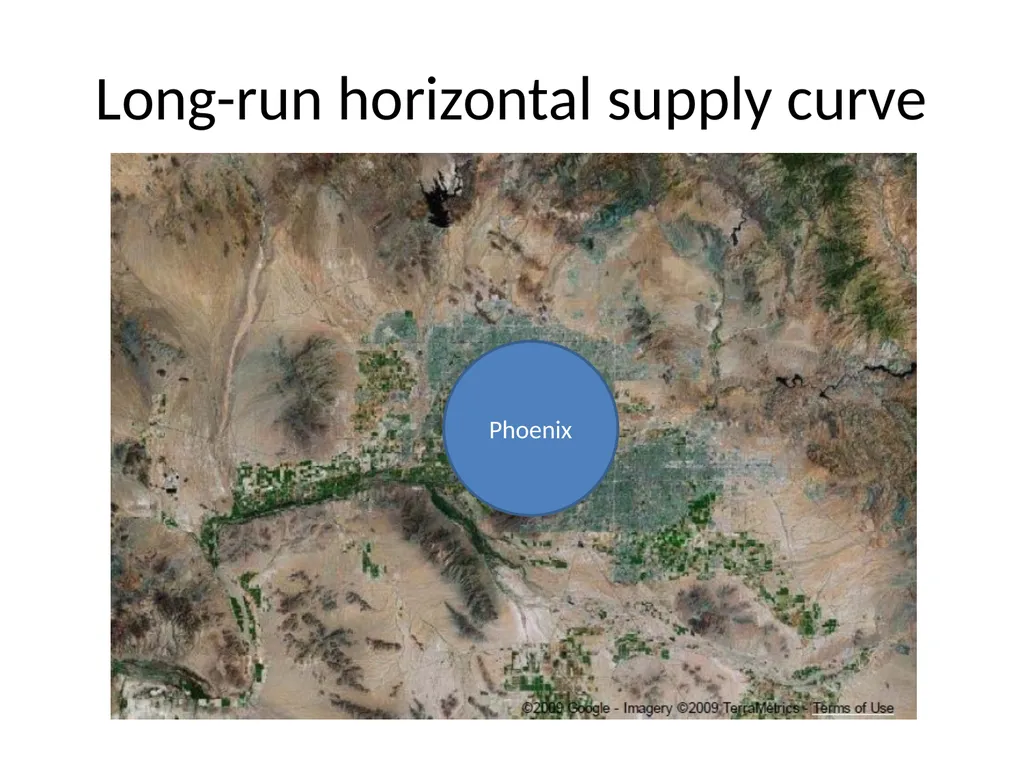
Long-run horizontal supply curve Phoenix<br>
16
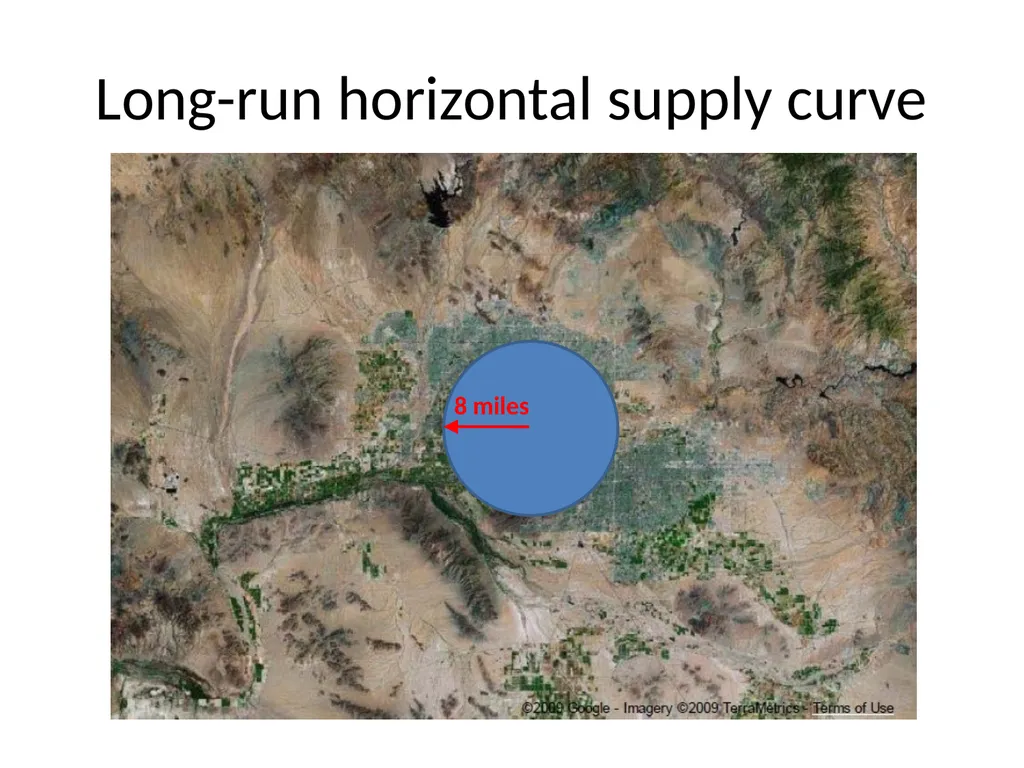
Long-run horizontal supply curve 8 miles<br>
17
Demand Bubble
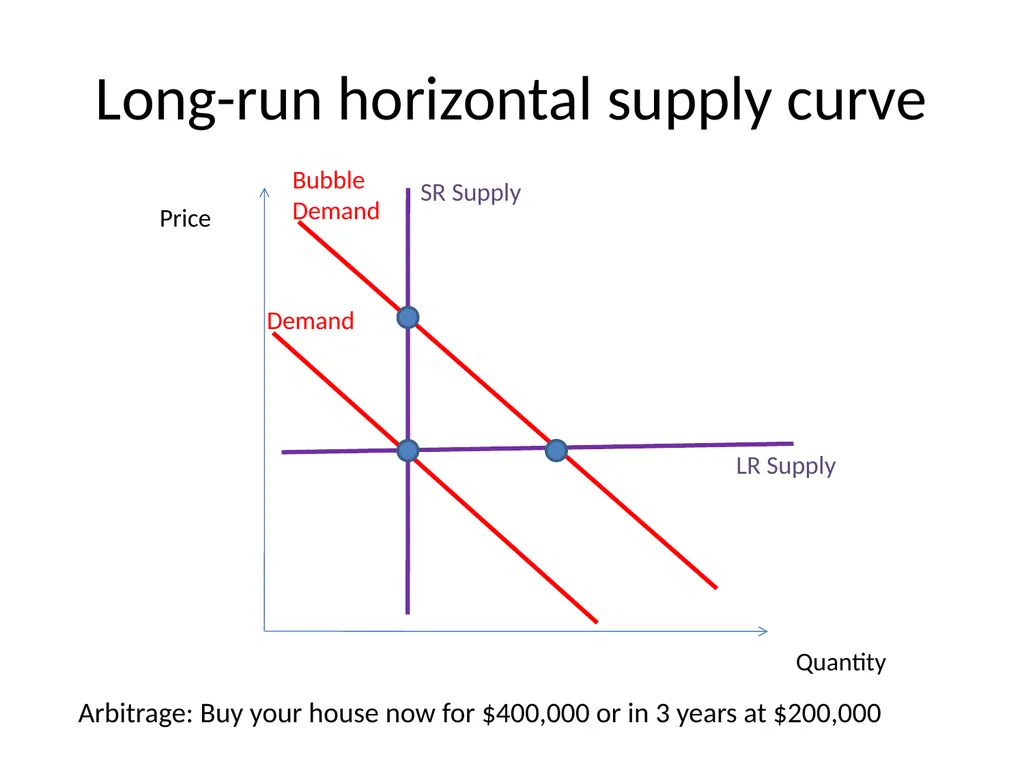
Demand Long-run horizontal supply curve LR Supply SR Supply Arbitrage: Buy your house now for $400,000 or in 3 years at $200,000 Price Quantity<br>
Demand Long-run horizontal supply curve LR Supply SR Supply Arbitrage: Buy your house now for $400,000 or in 3 years at $200,000 Price Quantity<br>
18
Demand Bubble
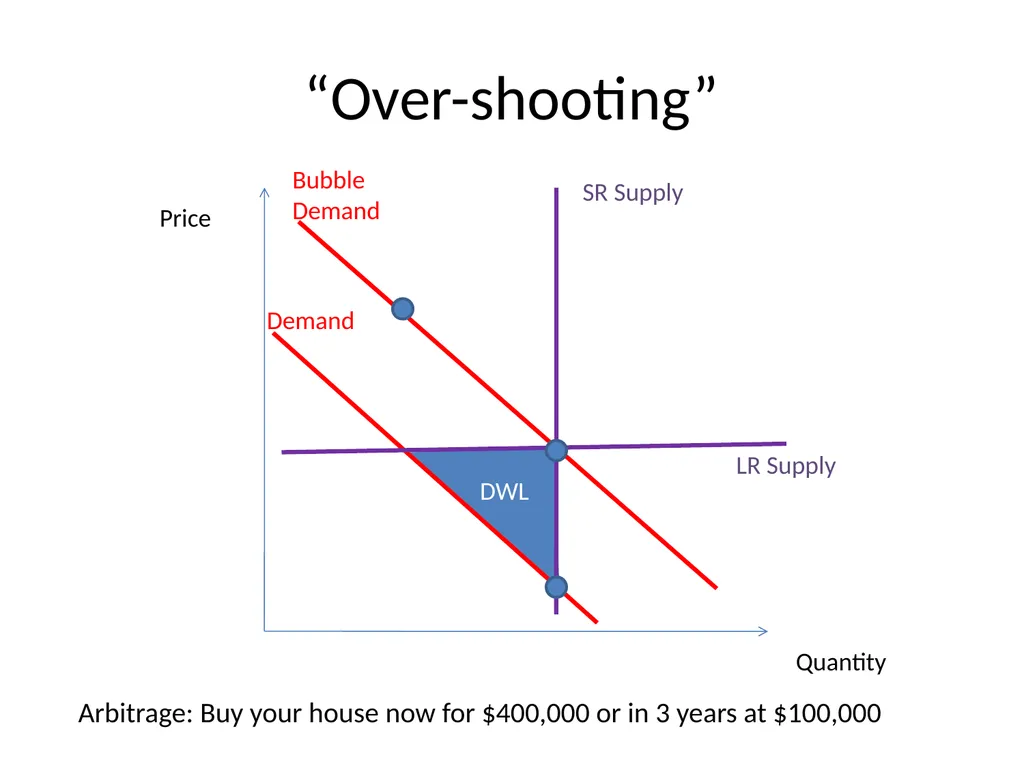
Demand “Over-shooting” LR Supply SR Supply Arbitrage: Buy your house now for $400,000 or in 3 years at $100,000 Price Quantity DWL<br>
Demand “Over-shooting” LR Supply SR Supply Arbitrage: Buy your house now for $400,000 or in 3 years at $100,000 Price Quantity DWL<br>
19
S&P 500 Case-Shiller Index
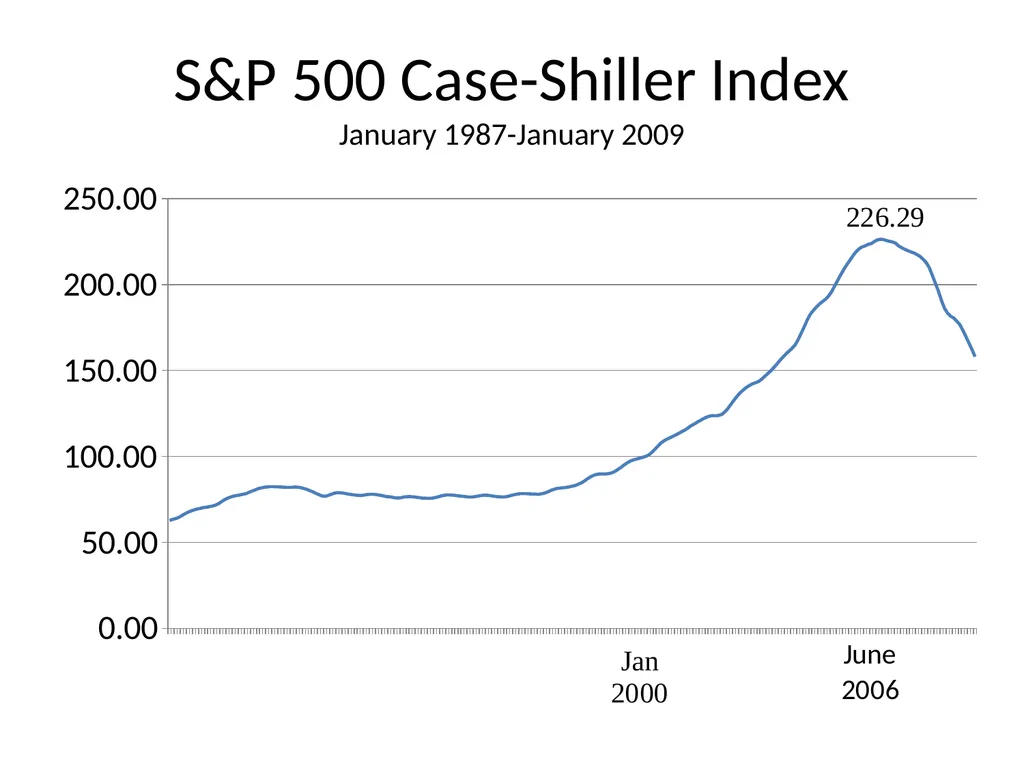
January 1987-January 2009<br>
20
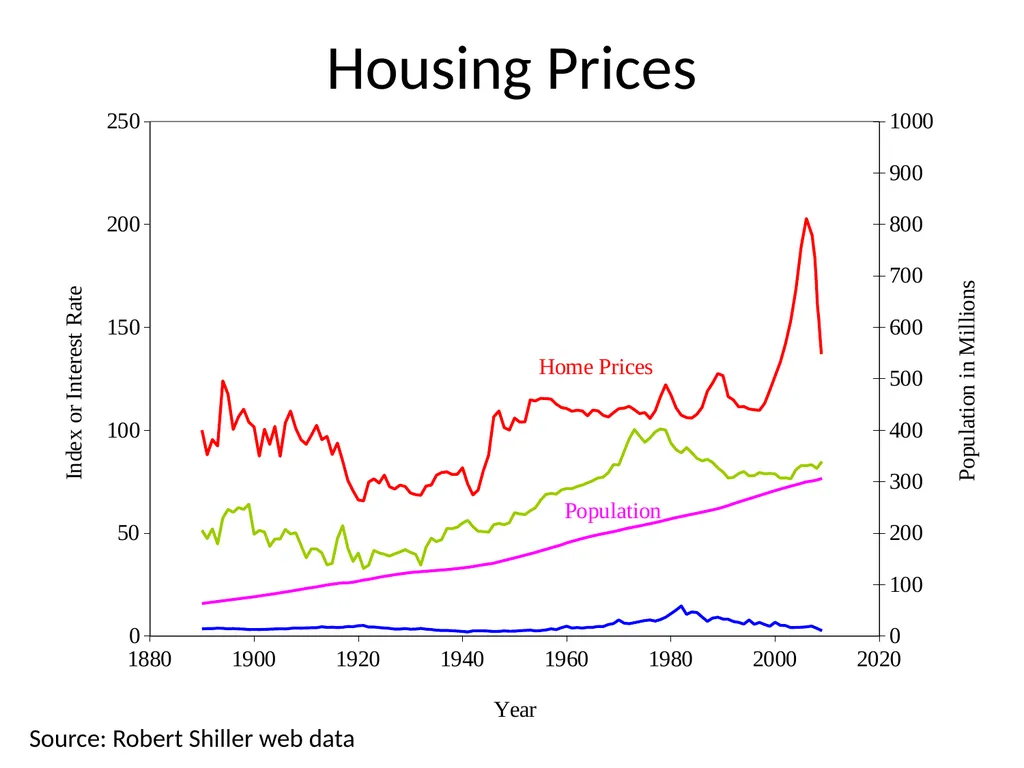
Housing Prices Source: Robert Shiller web data<br>
21
Household net worth
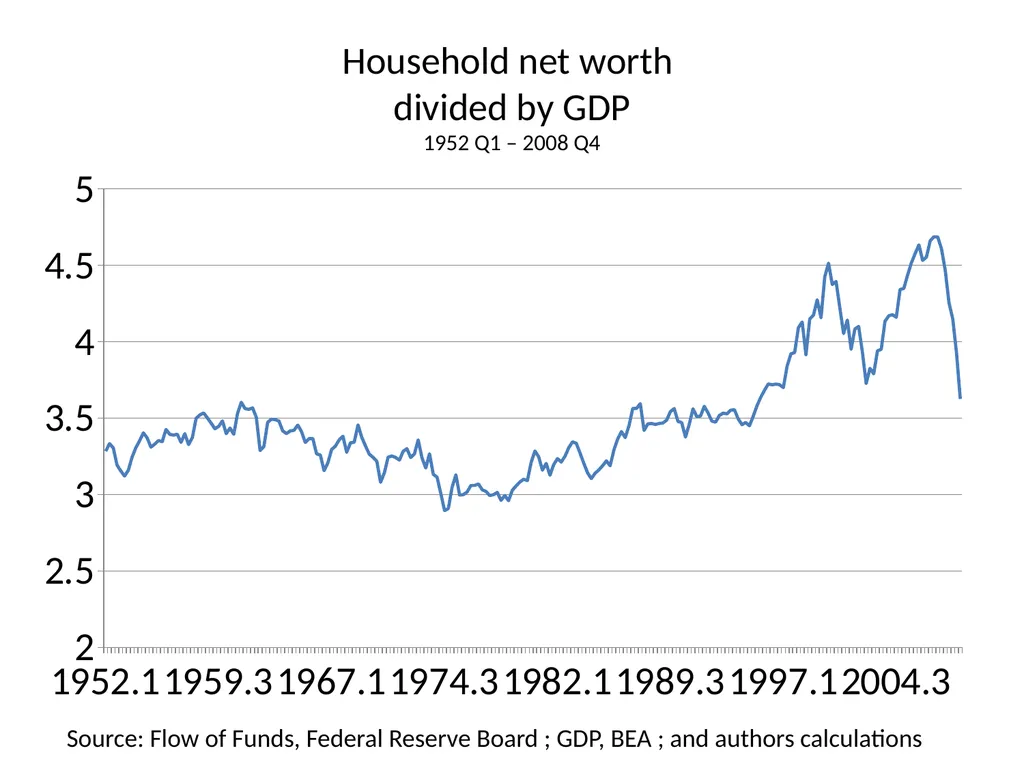
divided by GDP
1952 Q1 – 2008 Q4 Source: Flow of Funds, Federal Reserve Board ; GDP, BEA ; and authors calculations<br>
22
Estimates of magnitude
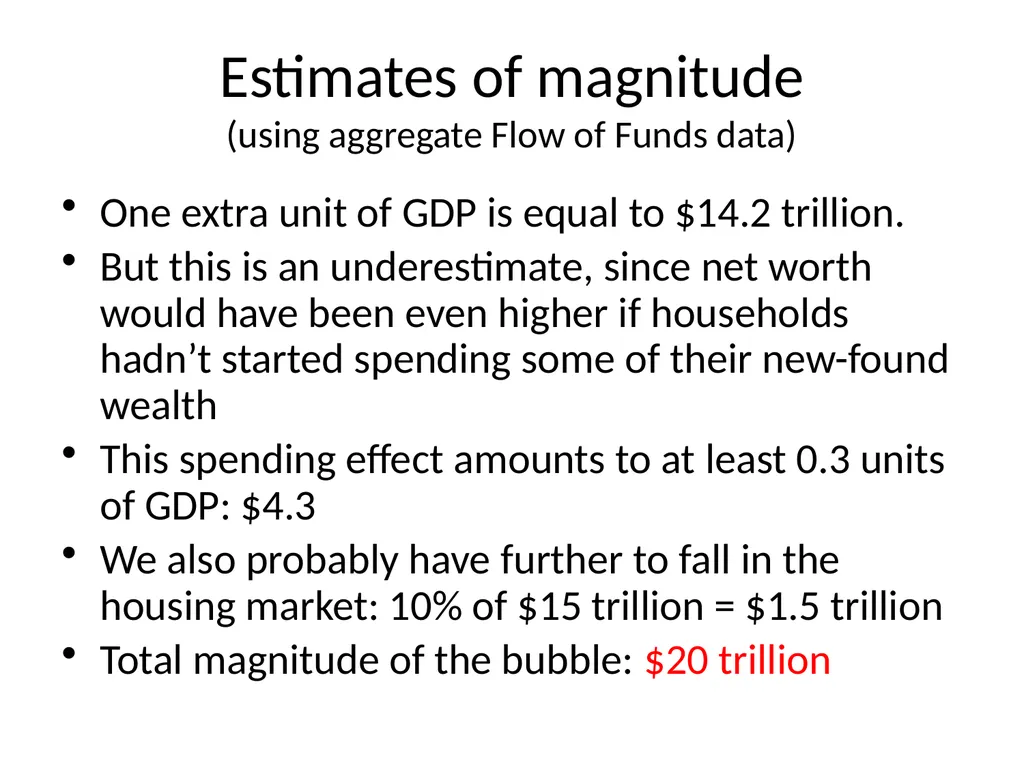
(using aggregate Flow of Funds data) One extra unit of GDP is equal to $14.2 trillion.
But this is an underestimate, since net worth would have been even higher if households hadn’t started spending some of their new-found wealth
This spending effect amounts to at least 0.3 units of GDP: $4.3
We also probably have further to fall in the housing market: 10% of $15 trillion = $1.5 trillion
Total magnitude of the bubble: $20 trillion<br>
But this is an underestimate, since net worth would have been even higher if households hadn’t started spending some of their new-found wealth
This spending effect amounts to at least 0.3 units of GDP: $4.3
We also probably have further to fall in the housing market: 10% of $15 trillion = $1.5 trillion
Total magnitude of the bubble: $20 trillion<br>
23
Estimates of magnitude
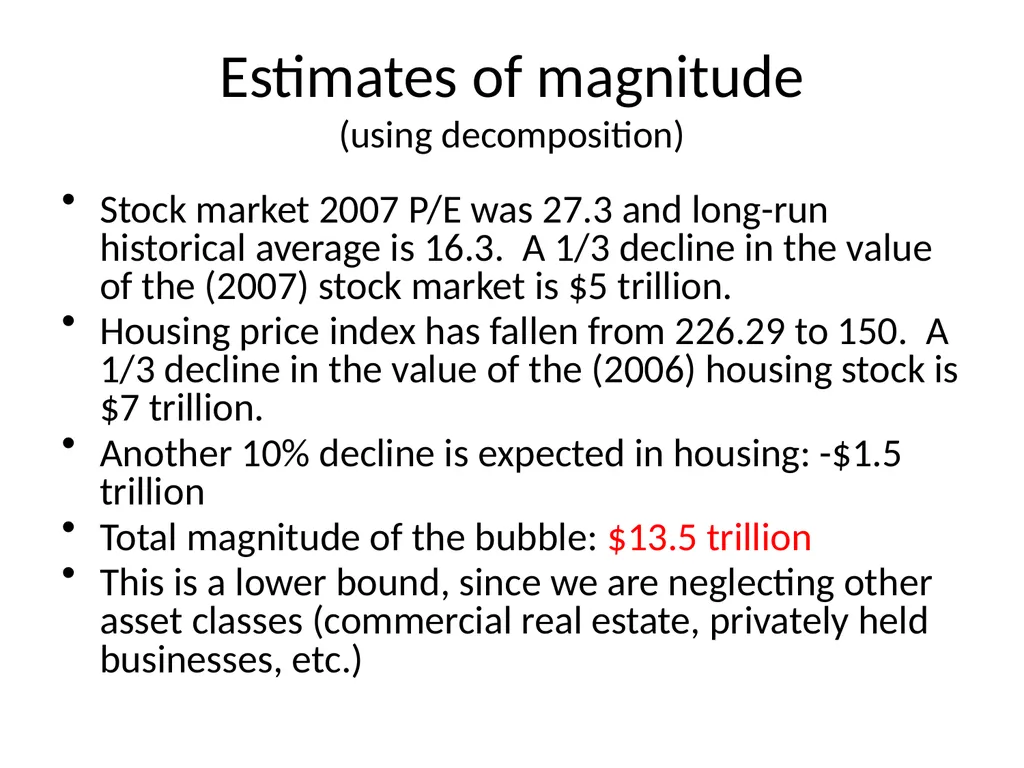
(using decomposition) Stock market 2007 P/E was 27.3 and long-run historical average is 16.3. A 1/3 decline in the value of the (2007) stock market is $5 trillion.
Housing price index has fallen from 226.29 to 150. A 1/3 decline in the value of the (2006) housing stock is $7 trillion.
Another 10% decline is expected in housing: -$1.5 trillion
Total magnitude of the bubble: $13.5 trillion
This is a lower bound, since we are neglecting other asset classes (commercial real estate, privately held businesses, etc.)<br>
Housing price index has fallen from 226.29 to 150. A 1/3 decline in the value of the (2006) housing stock is $7 trillion.
Another 10% decline is expected in housing: -$1.5 trillion
Total magnitude of the bubble: $13.5 trillion
This is a lower bound, since we are neglecting other asset classes (commercial real estate, privately held businesses, etc.)<br>
24
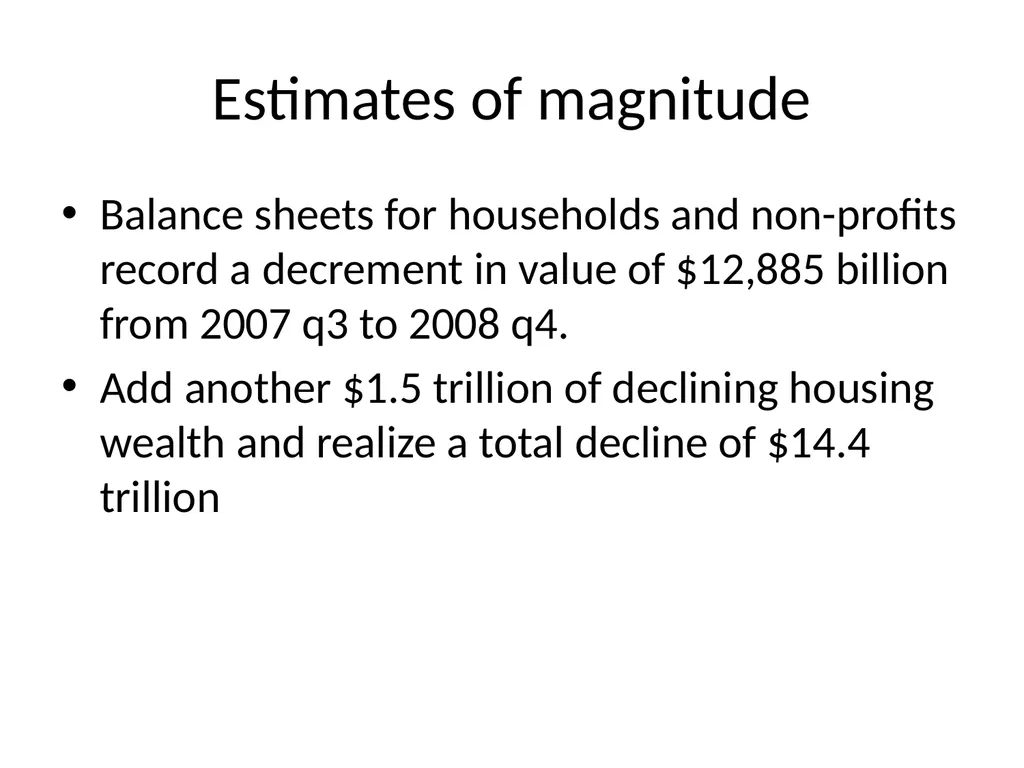
Estimates of magnitude Balance sheets for households and non-profits record a decrement in value of $12,885 billion from 2007 q3 to 2008 q4.
Add another $1.5 trillion of declining housing wealth and realize a total decline of $14.4 trillion<br>
Add another $1.5 trillion of declining housing wealth and realize a total decline of $14.4 trillion<br>
25
How can we be sure these were bubbles? We can’t.
But recall Palm and 3Com
And recall Phoenix/Las Vegas house prices.<br>
But recall Palm and 3Com
And recall Phoenix/Las Vegas house prices.<br>
26
Psychological foundations of bubbles Extrapolation
Return chasing
Herding (rational and irrational)
Overconfidence
Over-optimism<br>
Return chasing
Herding (rational and irrational)
Overconfidence
Over-optimism<br>
27
28 Psychological foundations of bubbles Extrapolation – it’s a generally useful heuristic
LaPorta (2003)
Companies with high historical earnings growth have negative earnings surprises
Companies with low historical earnings growth have positive earnings surprises<br>
LaPorta (2003)
Companies with high historical earnings growth have negative earnings surprises
Companies with low historical earnings growth have positive earnings surprises<br>
28
29 Psychological foundations of bubbles Return chasing
One standard deviation increase in an investor’s idiosyncratic 401(k) rate of return during the current year increases her 401(k) savings rate at year-end by 0.13 percentage points (Choi, Laibson, Madrian, and Metrick, 2009)
Depression babies avoid stocks in the 1960’s and “Oil shock babies” avoid stocks in the 1990’s (Malmendier and Nagel, 2009)
Brokerage investors repurchase individual stocks they previously sold for a gain while shunning individual stocks they previously sold for a loss (Barber, Odean, and Strahilevetz, 2004)
Finnish investors are more likely to subscribe to future IPOs if they experienced high returns in their prior IPO subscriptions (Kaustia and Knüpfer, 2008)<br>
One standard deviation increase in an investor’s idiosyncratic 401(k) rate of return during the current year increases her 401(k) savings rate at year-end by 0.13 percentage points (Choi, Laibson, Madrian, and Metrick, 2009)
Depression babies avoid stocks in the 1960’s and “Oil shock babies” avoid stocks in the 1990’s (Malmendier and Nagel, 2009)
Brokerage investors repurchase individual stocks they previously sold for a gain while shunning individual stocks they previously sold for a loss (Barber, Odean, and Strahilevetz, 2004)
Finnish investors are more likely to subscribe to future IPOs if they experienced high returns in their prior IPO subscriptions (Kaustia and Knüpfer, 2008)<br>
29
30 Wishful thinking
e.g., Weinstein (1980)
Believe optimistic scenarios if they are plausible
70% of drivers believe they are in the top 30%
Good economic news is viewed uncritically and bad economic news is viewed skeptically Psychological foundations of bubbles<br>
e.g., Weinstein (1980)
Believe optimistic scenarios if they are plausible
70% of drivers believe they are in the top 30%
Good economic news is viewed uncritically and bad economic news is viewed skeptically Psychological foundations of bubbles<br>
30
31 Social proof:
It must be right, if everyone else is doing it
e.g., Asch (1954) Solomon Asch paradigm
7 male college students in the room
“task involving visual judgment”
One card contains a single line
Another card contains three lines Psychological foundations of bubbles<br>
7 male college students in the room
“task involving visual judgment”
One card contains a single line
Another card contains three lines Psychological foundations of bubbles<br>
31
32 Social proof continued a. b. c. Which line on the left is the same as the line on the right?<br>
32
33 Social proof continued Task: pick out the matching line
Easy task: error rate for a lone subject is <1%
In actual experiment, 6 of the 7 subjects are fakes
In some trials the fakes respond erroneously
Error rate of real subject during such trials is 36.8%<br>
Easy task: error rate for a lone subject is <1%
In actual experiment, 6 of the 7 subjects are fakes
In some trials the fakes respond erroneously
Error rate of real subject during such trials is 36.8%<br>
33
34 Overconfidence Overconfidence (2nd moment)
Alpert and Raiffa (1982)
How many births occurred in these randomly chosen states in 2004?
California, Illinois, Mississippi, North Carolina, Texas, Wyoming
Now provide a 99% confidence interval for each state.
In other words, for each state pick two numbers (low and high) so that there is a 99% chance that the true value of the number of births lies in that interval. Psychological foundations of bubbles<br>
Alpert and Raiffa (1982)
How many births occurred in these randomly chosen states in 2004?
California, Illinois, Mississippi, North Carolina, Texas, Wyoming
Now provide a 99% confidence interval for each state.
In other words, for each state pick two numbers (low and high) so that there is a 99% chance that the true value of the number of births lies in that interval. Psychological foundations of bubbles<br>
34
35 Number of births in 2004<br>
35
36<br>
36
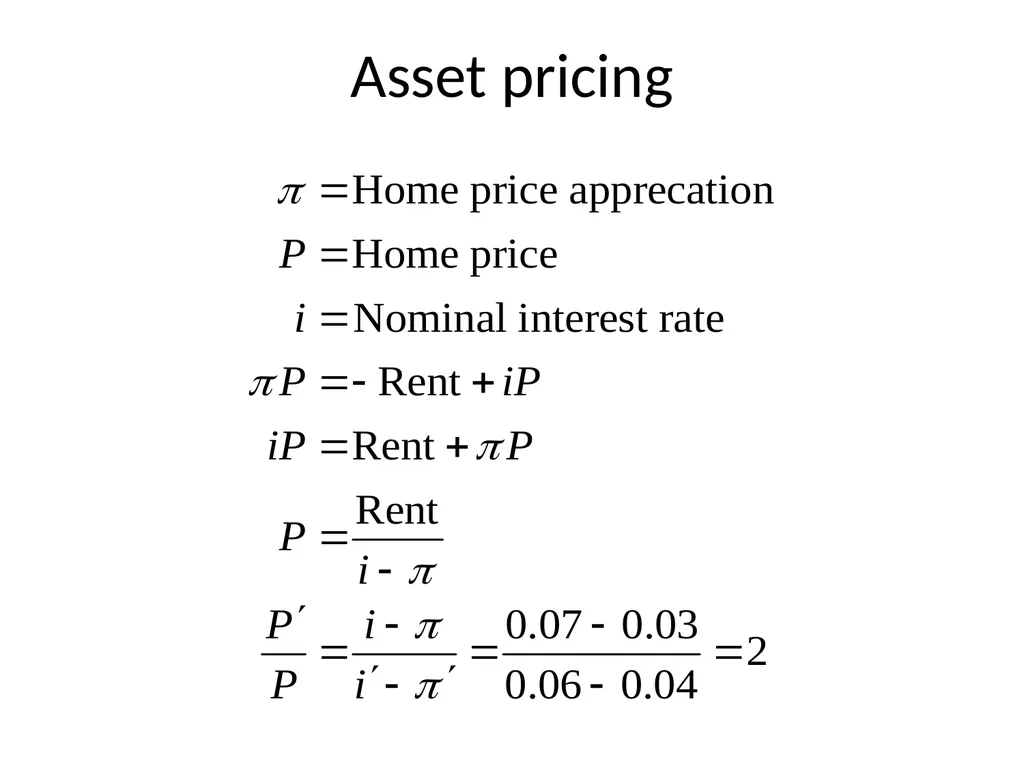
Asset pricing<br>
37
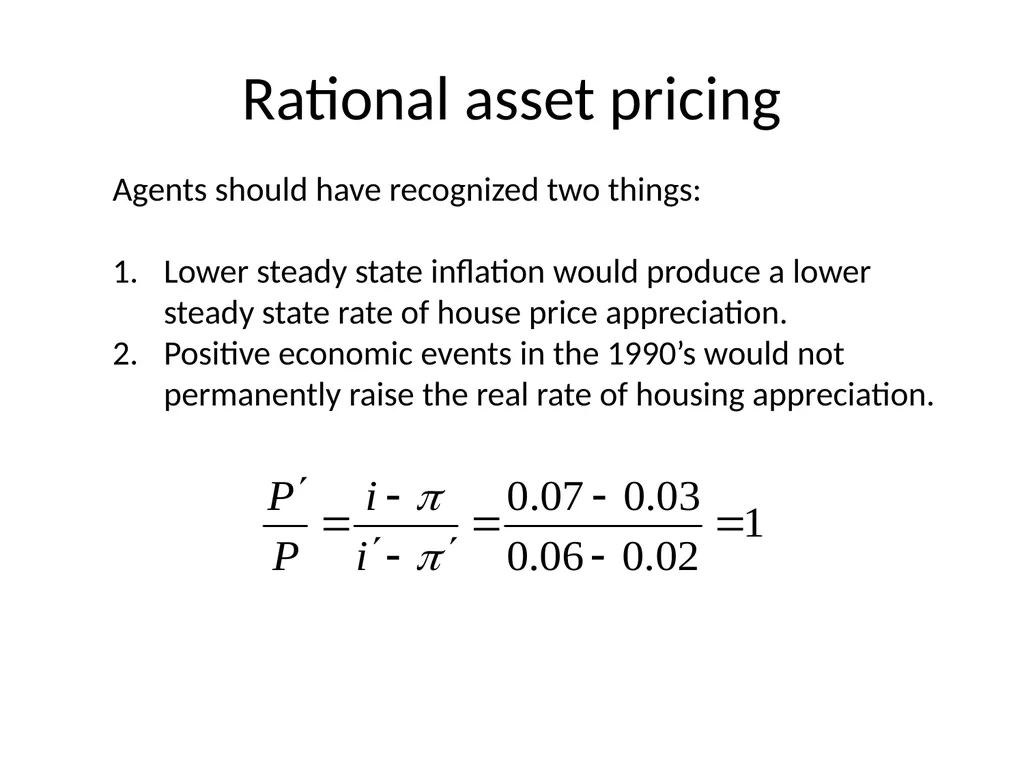
Rational asset pricing Agents should have recognized two things:
Lower steady state inflation would produce a lower steady state rate of house price appreciation.
Positive economic events in the 1990’s would not permanently raise the real rate of housing appreciation.<br>
Lower steady state inflation would produce a lower steady state rate of house price appreciation.
Positive economic events in the 1990’s would not permanently raise the real rate of housing appreciation.<br>
38
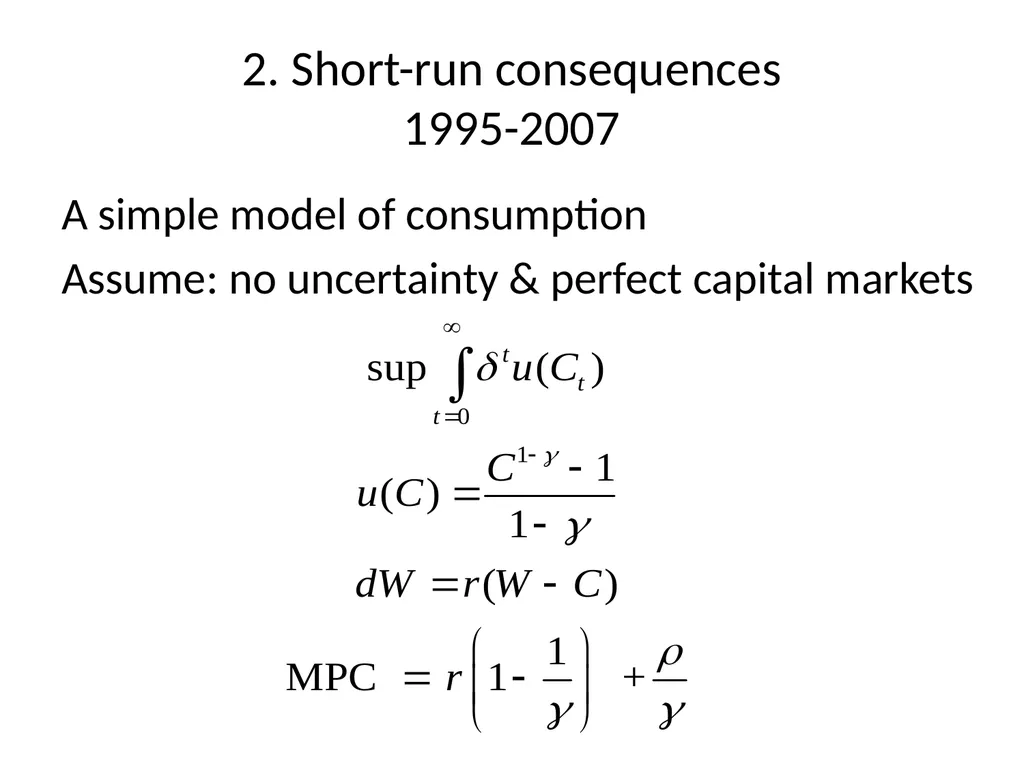
2. Short-run consequences
1995-2007 A simple model of consumption
Assume: no uncertainty & perfect capital markets<br>
Assume: no uncertainty & perfect capital markets<br>
39
Manipulate expressions to yield consumption function<br>
40
Special cases<br>
41
Calibrate Discount rate (-lnδ)? 1%-10%
Risk-free real interest rate (-lnR)? 2%-5%
Coefficient of relative risk aversion (γ)? 0.5-5
Let’s pick a benchmark case:
δ = 0.95
γ = 1
So λ = 0.05 (marginal propensity to consume)<br>
Risk-free real interest rate (-lnR)? 2%-5%
Coefficient of relative risk aversion (γ)? 0.5-5
Let’s pick a benchmark case:
δ = 0.95
γ = 1
So λ = 0.05 (marginal propensity to consume)<br>
42
2. Short-run consequences
1995-2007 A simple model of consumption
Assume: no uncertainty & perfect capital markets<br>
Assume: no uncertainty & perfect capital markets<br>
43
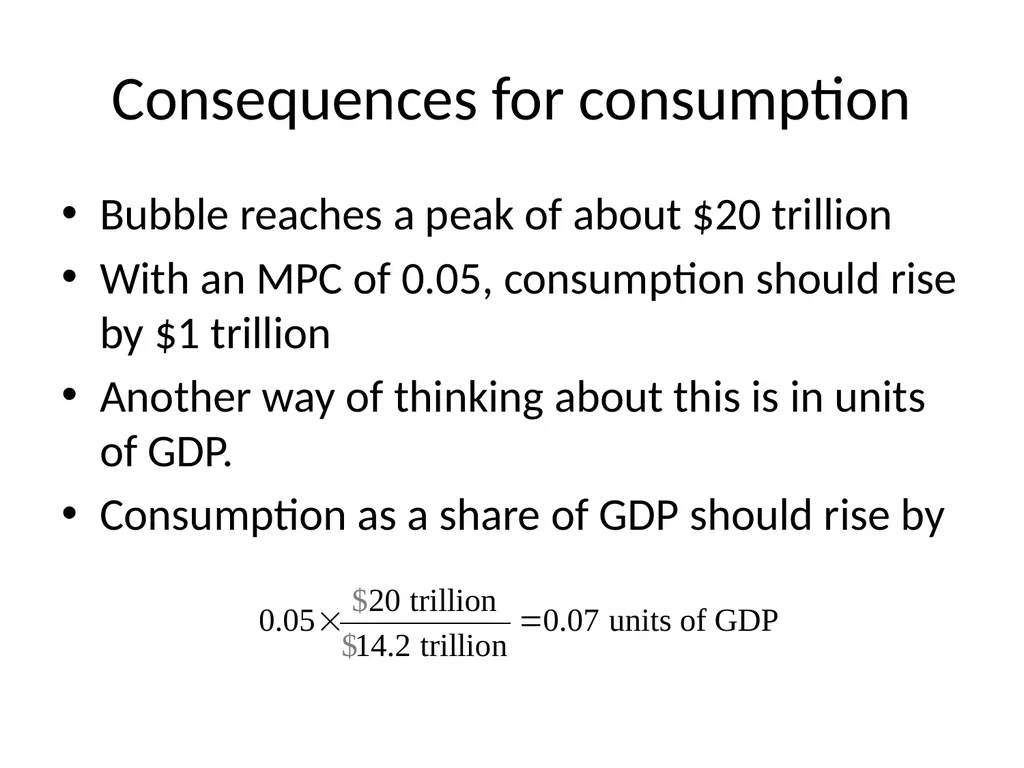
Consequences for consumption Bubble reaches a peak of about $20 trillion
With an MPC of 0.05, consumption should rise by $1 trillion
Another way of thinking about this is in units of GDP.
Consumption as a share of GDP should rise by<br>
With an MPC of 0.05, consumption should rise by $1 trillion
Another way of thinking about this is in units of GDP.
Consumption as a share of GDP should rise by<br>
44
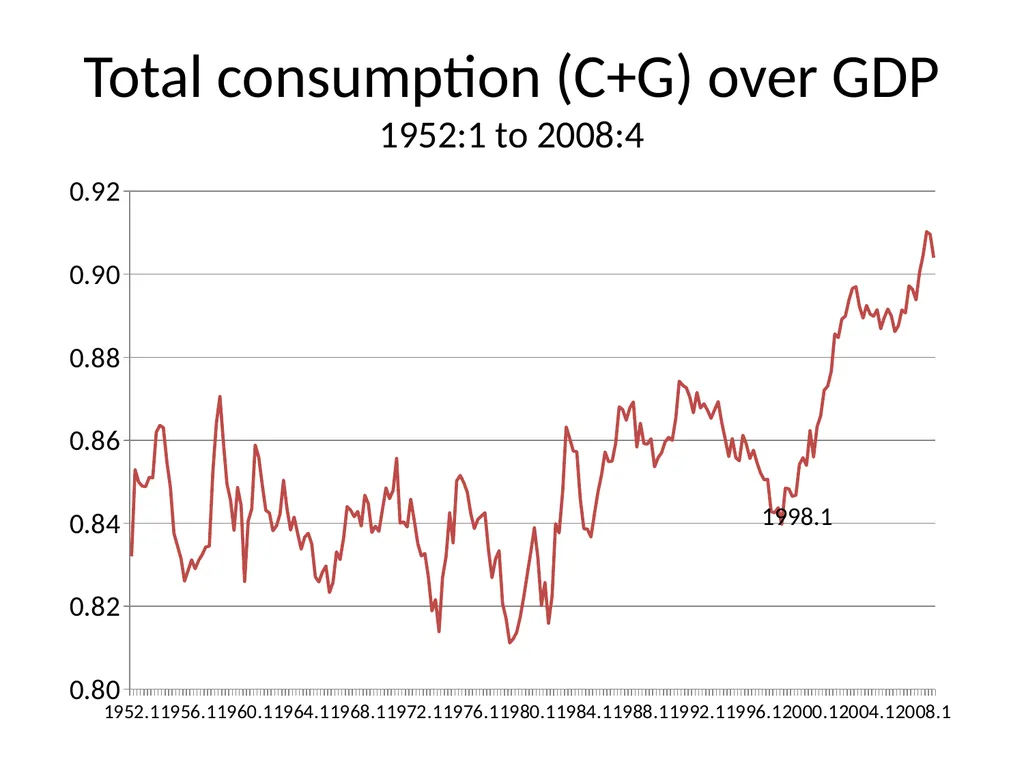
Total consumption (C+G) over GDP
1952:1 to 2008:4 1998.1<br>
45
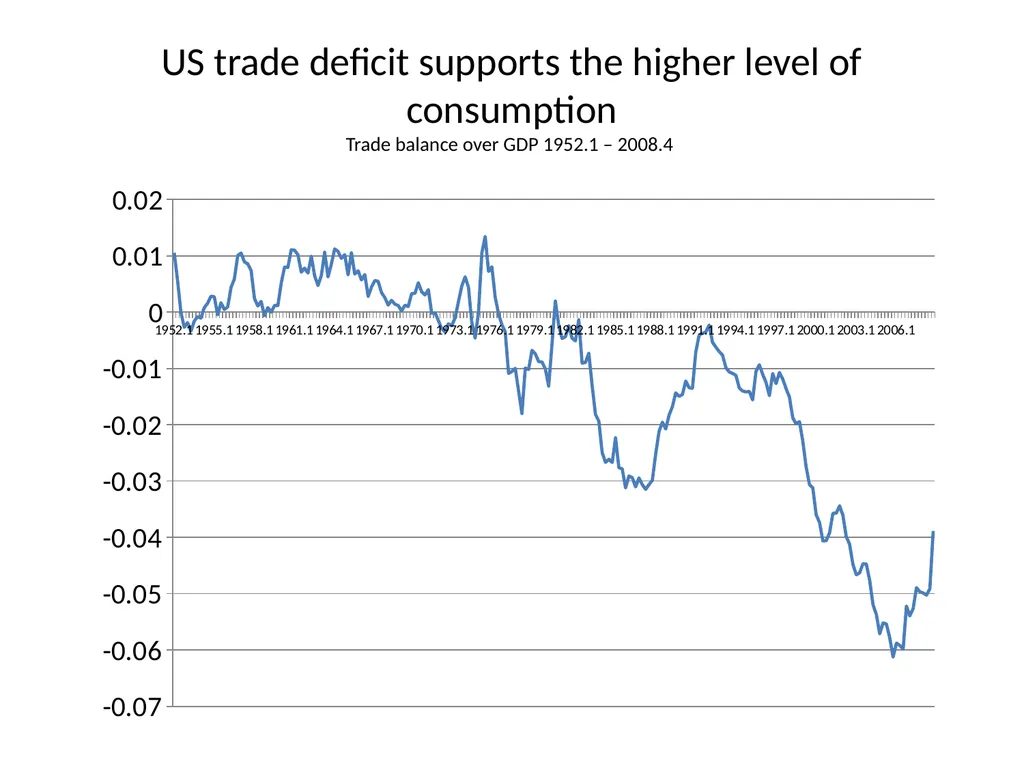
US trade deficit supports the higher level of consumption
Trade balance over GDP 1952.1 – 2008.4<br>
46
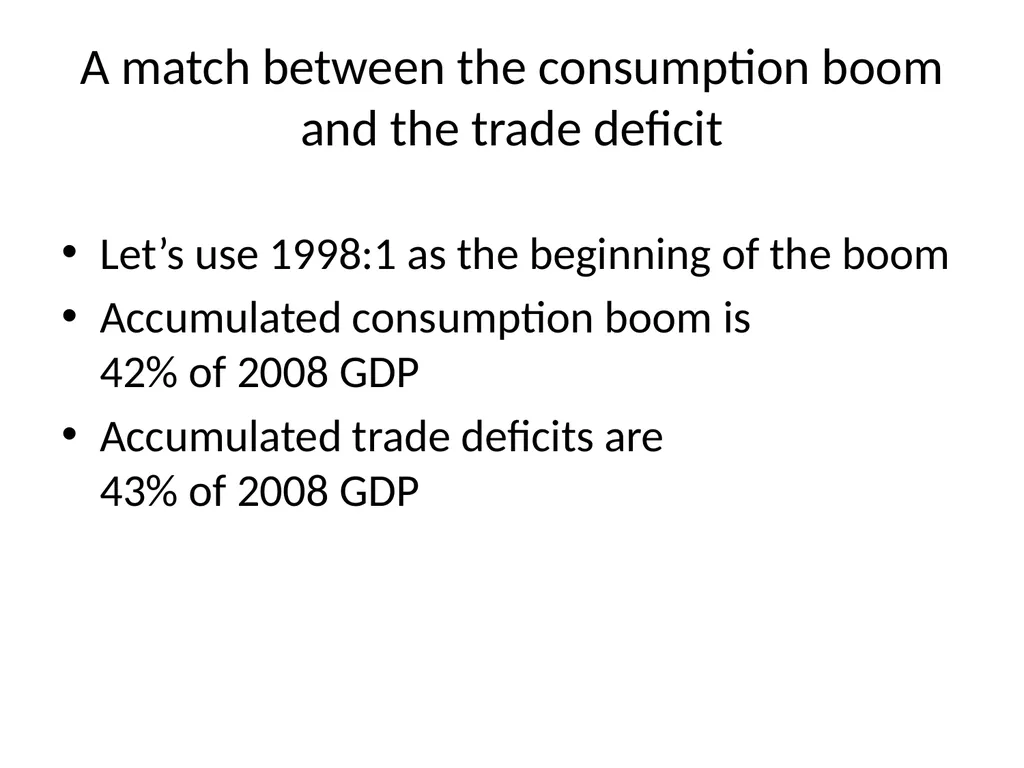
A match between the consumption boom and the trade deficit Let’s use 1998:1 as the beginning of the boom
Accumulated consumption boom is 42% of 2008 GDP
Accumulated trade deficits are 43% of 2008 GDP<br>
Accumulated consumption boom is 42% of 2008 GDP
Accumulated trade deficits are 43% of 2008 GDP<br>
47
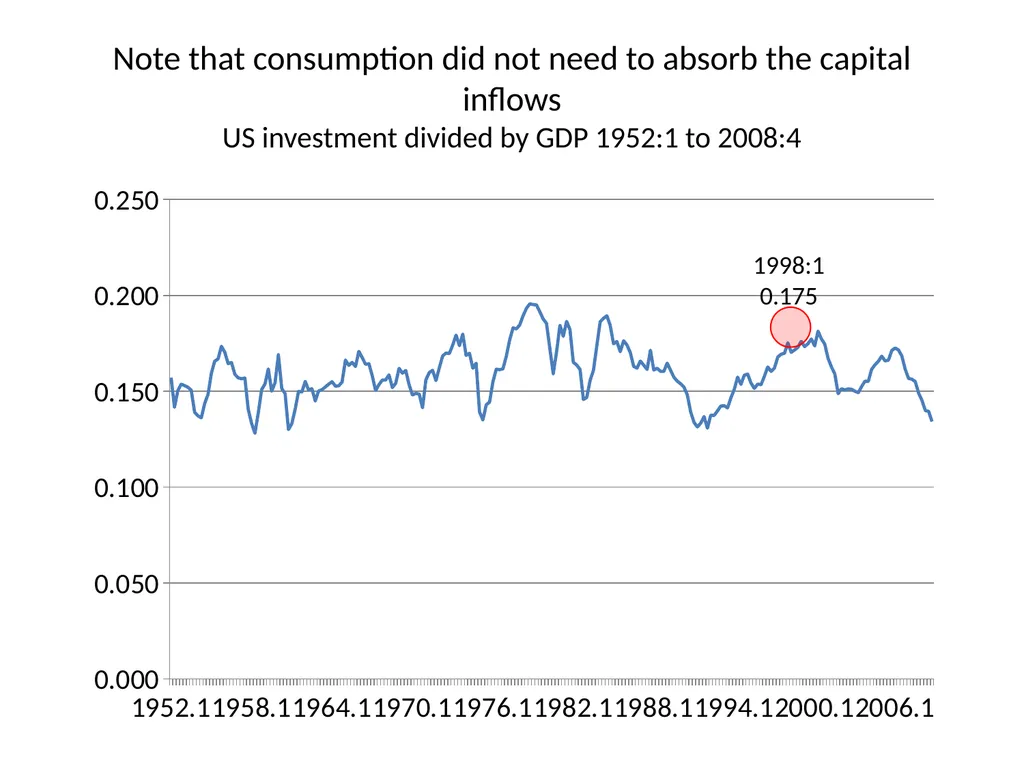
Note that consumption did not need to absorb the capital inflows
US investment divided by GDP 1952:1 to 2008:4 1998:1
0.175<br>
0.175<br>
48
Alternative explanation:
Bernanke’s (2005) global savings glut? A large increase in desired savings in the developing world was the cause of the trade imbalances and the consumption boom.
In my view, the “global savings glut” theory does not make sense.
Three critiques.<br>
In my view, the “global savings glut” theory does not make sense.
Three critiques.<br>
49
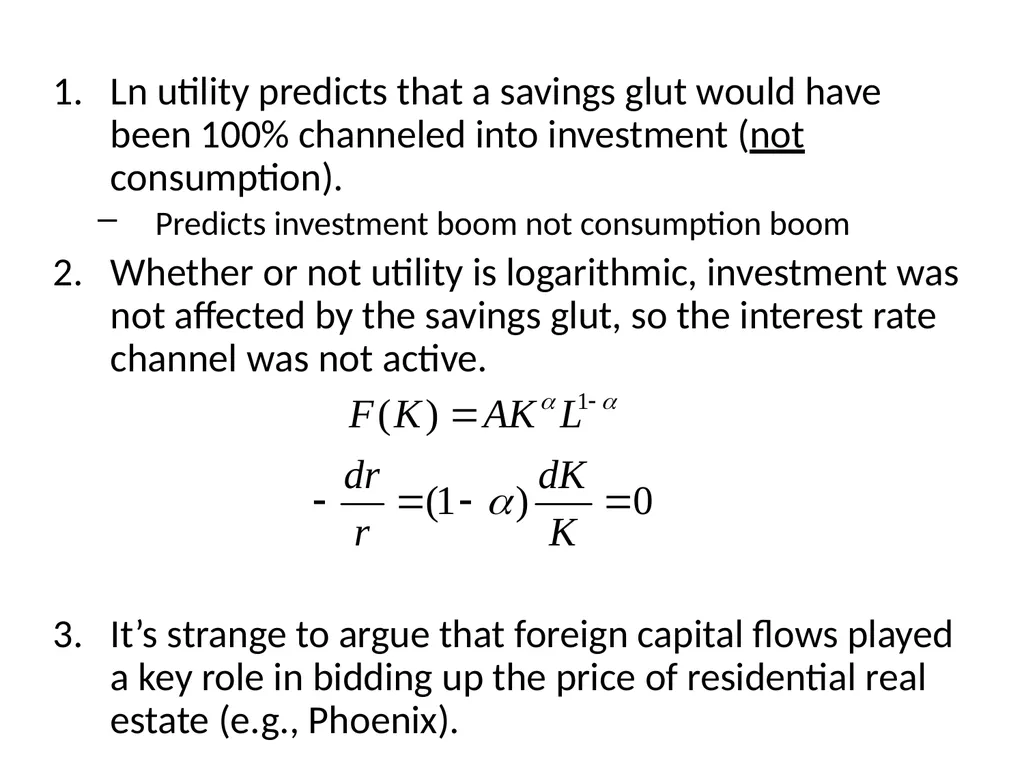
Ln utility predicts that a savings glut would have been 100% channeled into investment (not consumption).
Predicts investment boom not consumption boom
Whether or not utility is logarithmic, investment was not affected by the savings glut, so the interest rate channel was not active.
It’s strange to argue that foreign capital flows played a key role in bidding up the price of residential real estate (e.g., Phoenix).<br>
Predicts investment boom not consumption boom
Whether or not utility is logarithmic, investment was not affected by the savings glut, so the interest rate channel was not active.
It’s strange to argue that foreign capital flows played a key role in bidding up the price of residential real estate (e.g., Phoenix).<br>
50
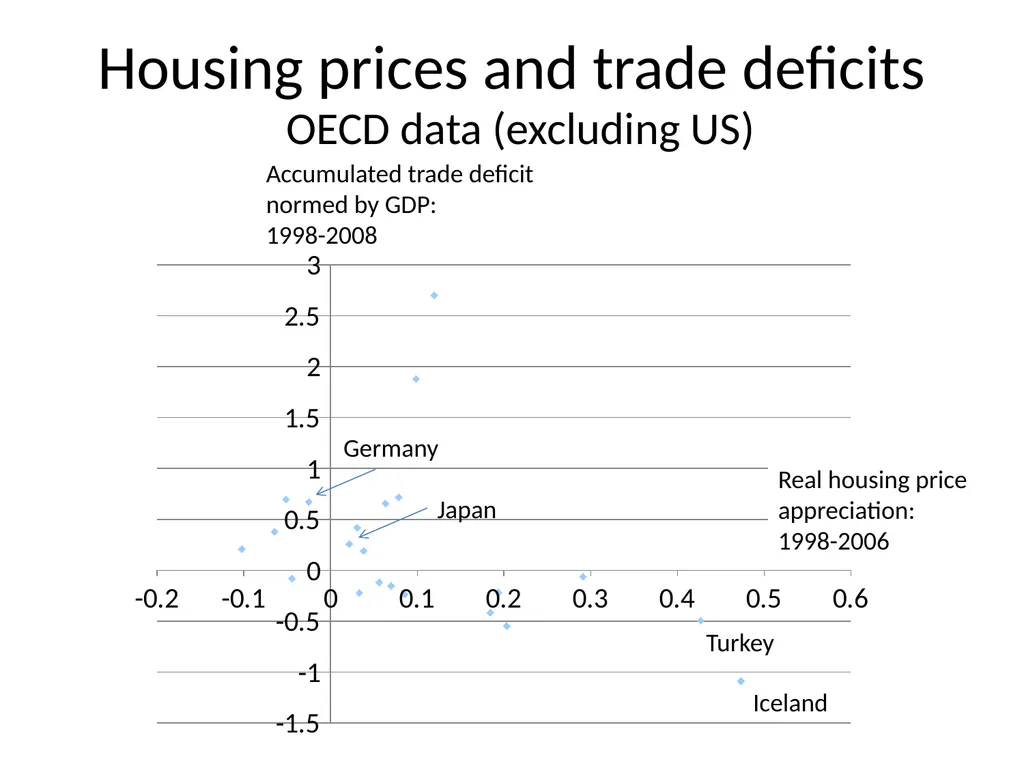
Housing prices and trade deficits Real housing price appreciation: 1998-2006 Accumulated trade deficit normed by GDP:
1998-2008 Iceland Turkey OECD data (excluding US) Japan Germany<br>
1998-2008 Iceland Turkey OECD data (excluding US) Japan Germany<br>
51
Technical slide Accumulated excess consumption: take 1998:1 as benchmark C/GDP ratio. Then take all future excesses (using the ratio as the predicted level) and accumulate. Then divide by GDP in 2008.
Trade deficits are just summed up.<br>
Trade deficits are just summed up.<br>
52
3. Intermediate term consequences
2008-2010 Household leverage
Leverage in financial sector<br>
Leverage in financial sector<br>
53
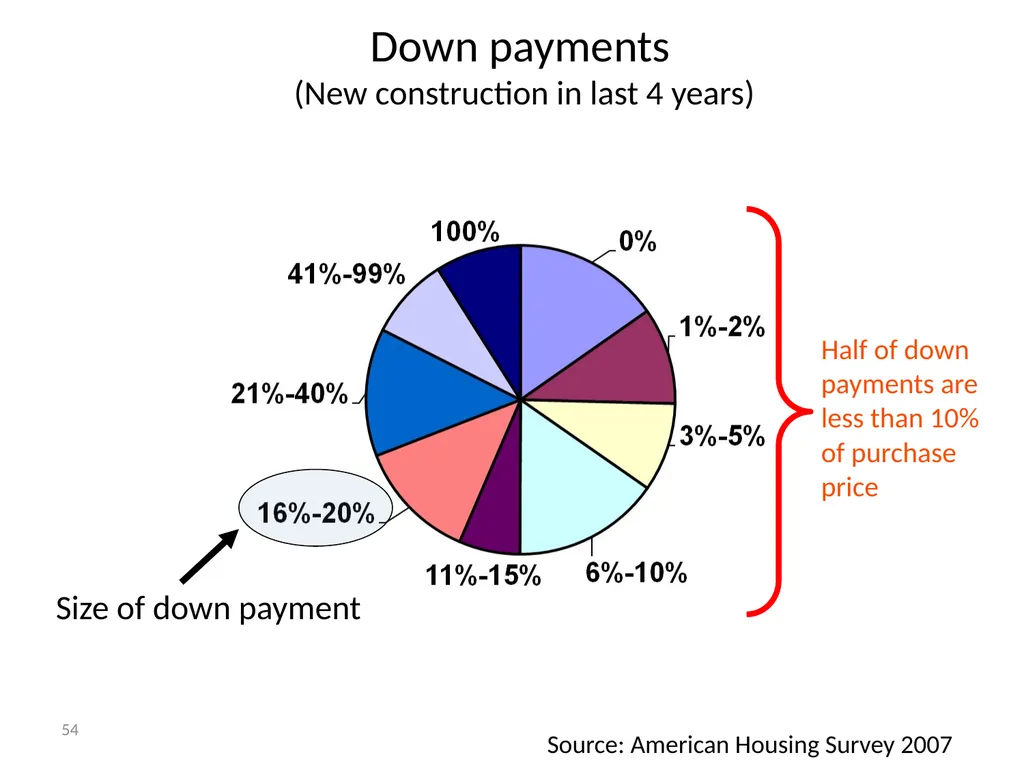
54 Source: American Housing Survey 2007 Down payments
(New construction in last 4 years) Half of down payments are less than 10% of purchase price Size of down payment<br>
54
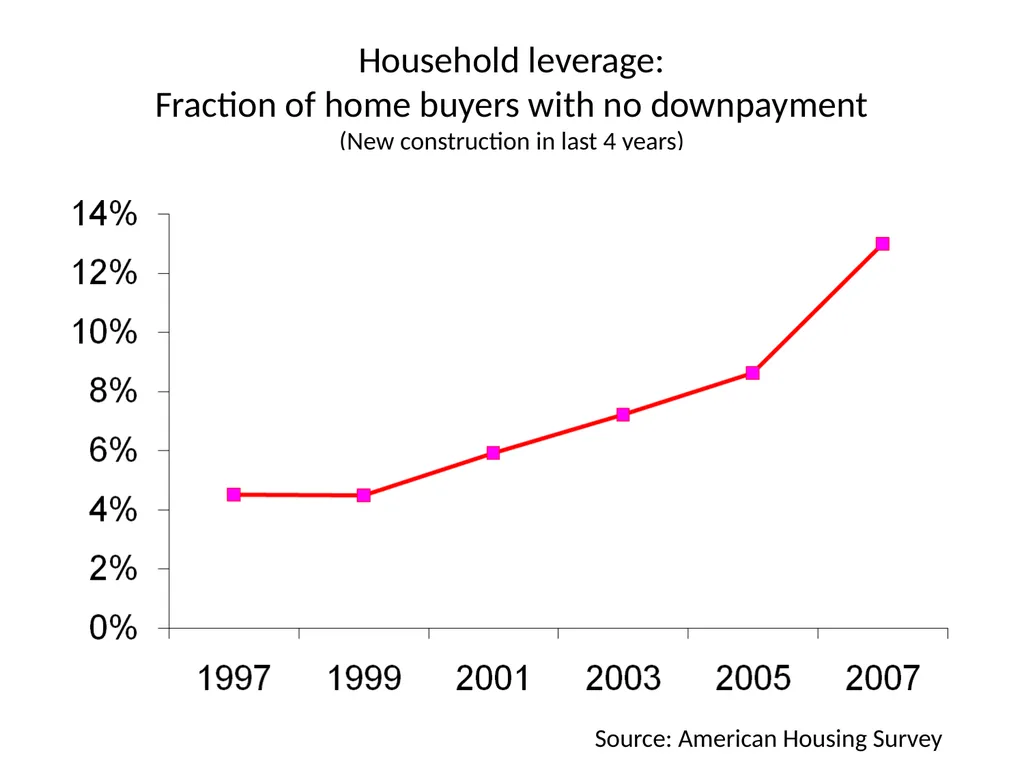
55 Household leverage:
Fraction of home buyers with no downpayment
(New construction in last 4 years) Source: American Housing Survey<br>
55
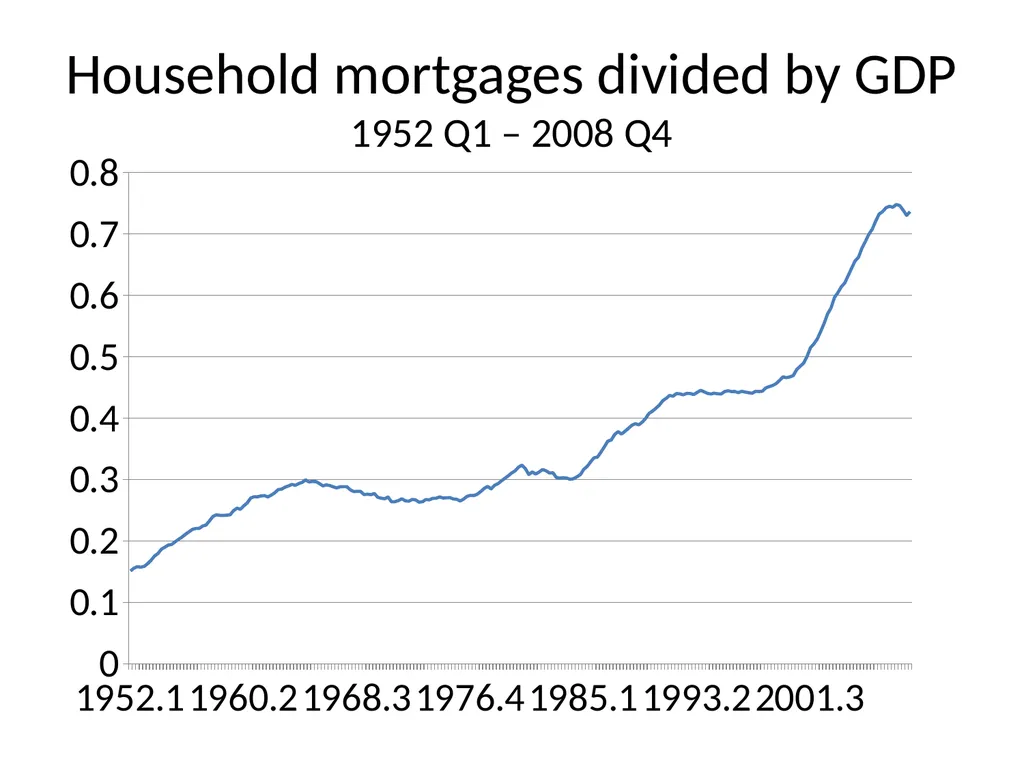
Household mortgages divided by GDP
1952 Q1 – 2008 Q4<br>
56
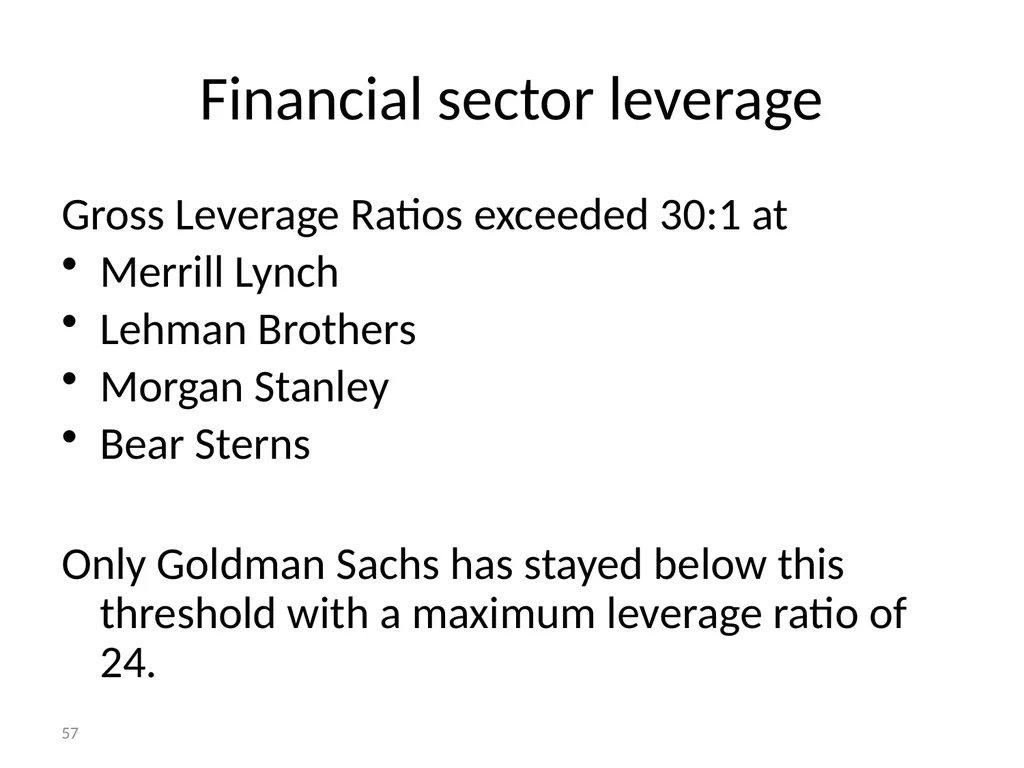
57 Financial sector leverage Gross Leverage Ratios exceeded 30:1 at
Merrill Lynch
Lehman Brothers
Morgan Stanley
Bear Sterns
Only Goldman Sachs has stayed below this threshold with a maximum leverage ratio of 24.<br>
Merrill Lynch
Lehman Brothers
Morgan Stanley
Bear Sterns
Only Goldman Sachs has stayed below this threshold with a maximum leverage ratio of 24.<br>
57
Why so much leverage? Why were households so leveraged?
Belief that housing would appreciate
Natural channel to fund consumption boom
Why were banks so leveraged?
Belief that tranched asset-backed securities were really AAA (e.g., CDO’s)
Implicit belief that national housing prices would appreciate (or at least stabilize)<br>
Belief that housing would appreciate
Natural channel to fund consumption boom
Why were banks so leveraged?
Belief that tranched asset-backed securities were really AAA (e.g., CDO’s)
Implicit belief that national housing prices would appreciate (or at least stabilize)<br>
58
Alan Greenspan “While local economies may experience significant speculative price imbalances, a national severe price distortion seems most unlikely in the United States, given its size and diversity.” (October, 2004)
If home prices do decline, that “likely would not have substantial macroeconomic implications.” (June, 2005)
Though housing prices are likely to be lower than the year before, “I think the worst of this may well be over.” (October, 2006)
See also Gerardi et al (BPEA, 2008)<br>
If home prices do decline, that “likely would not have substantial macroeconomic implications.” (June, 2005)
Though housing prices are likely to be lower than the year before, “I think the worst of this may well be over.” (October, 2006)
See also Gerardi et al (BPEA, 2008)<br>
59
4. Long-run equilibrium Model characterizes household response to a bubble’s arrival and then to the bubble’s collapse
Same model as above
No liquidity constraint
Certainty (for simplicity)
CRRA<br>
Same model as above
No liquidity constraint
Certainty (for simplicity)
CRRA<br>
60
Special case Interest rate = discount rate
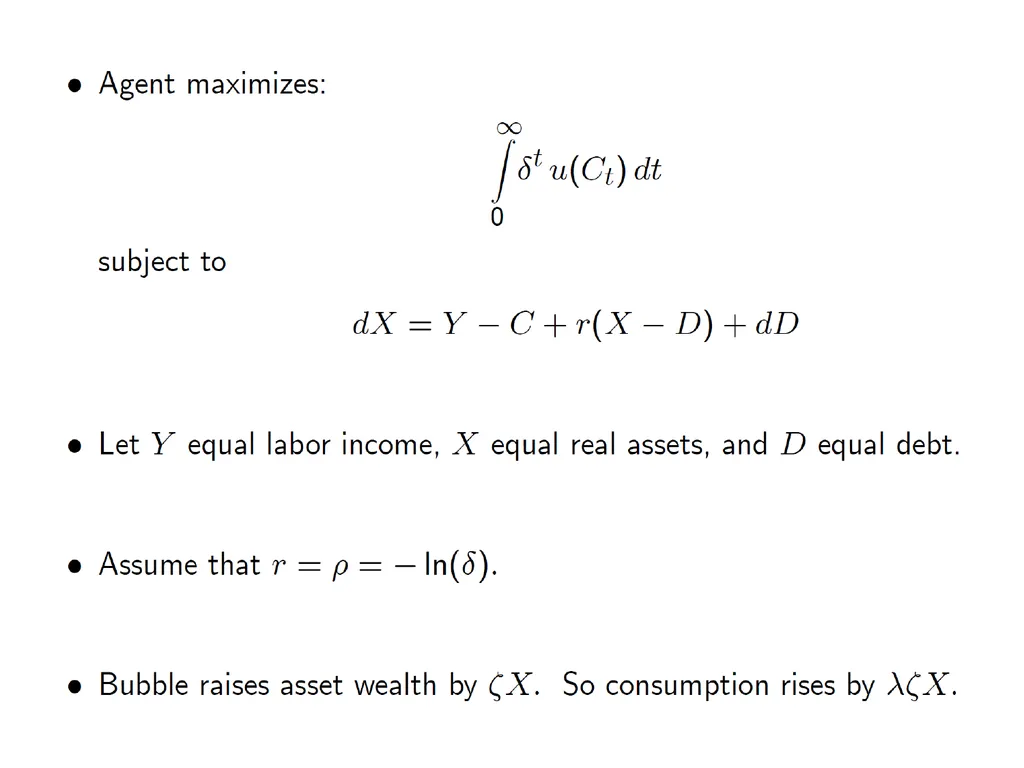
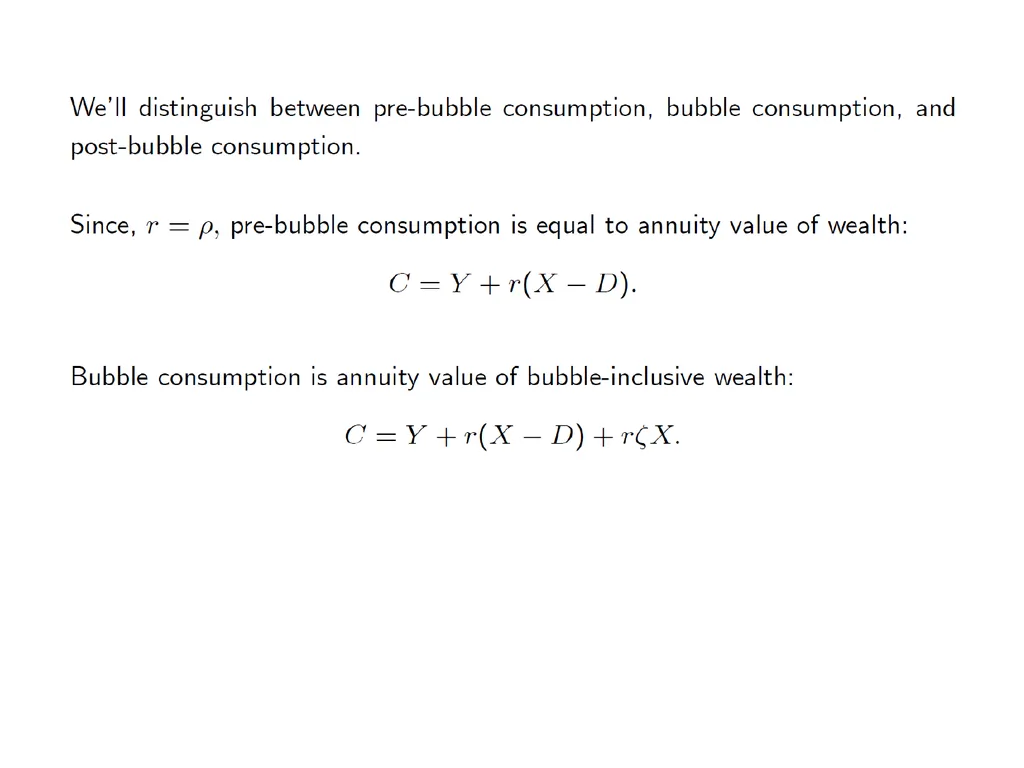
Three assets: human capital, real assets, debt
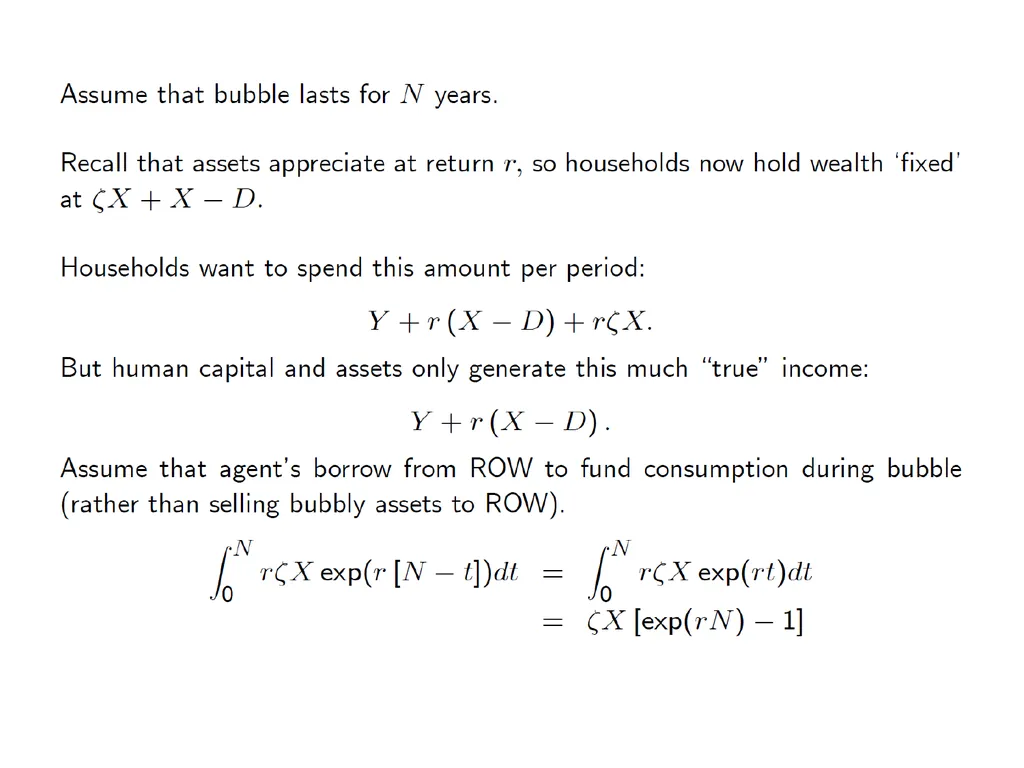
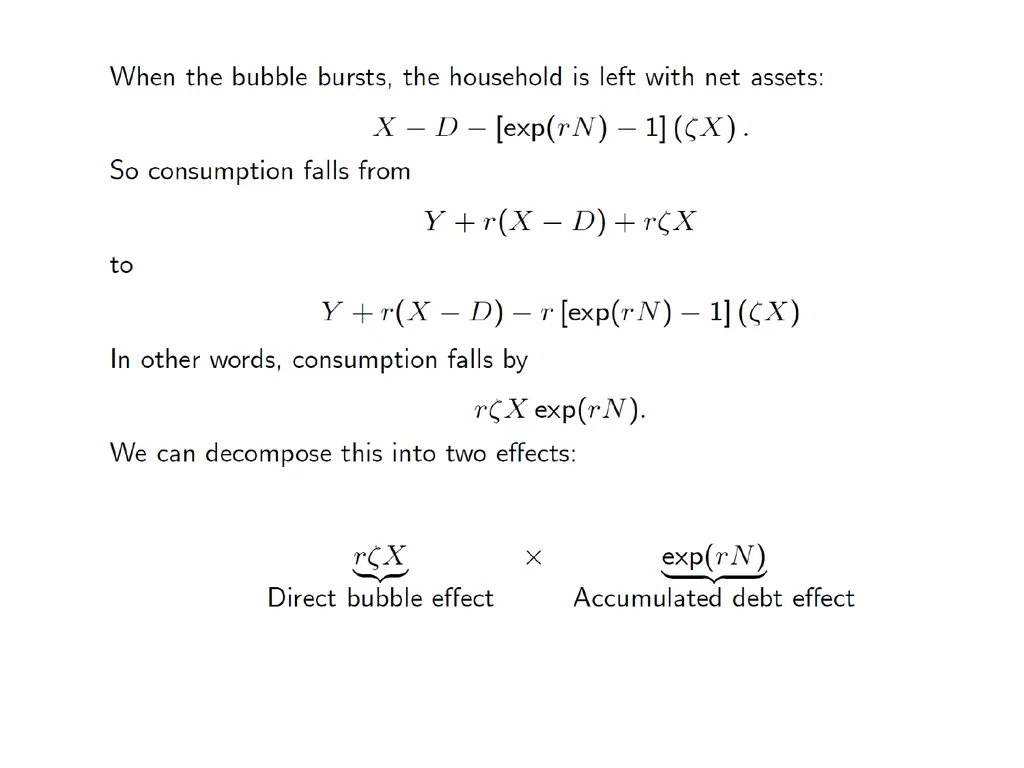
Households fund consumption boom by borrowing from ROW
All assets appreciate at required rate of return until bubble collapses<br>
Three assets: human capital, real assets, debt
Households fund consumption boom by borrowing from ROW
All assets appreciate at required rate of return until bubble collapses<br>
61
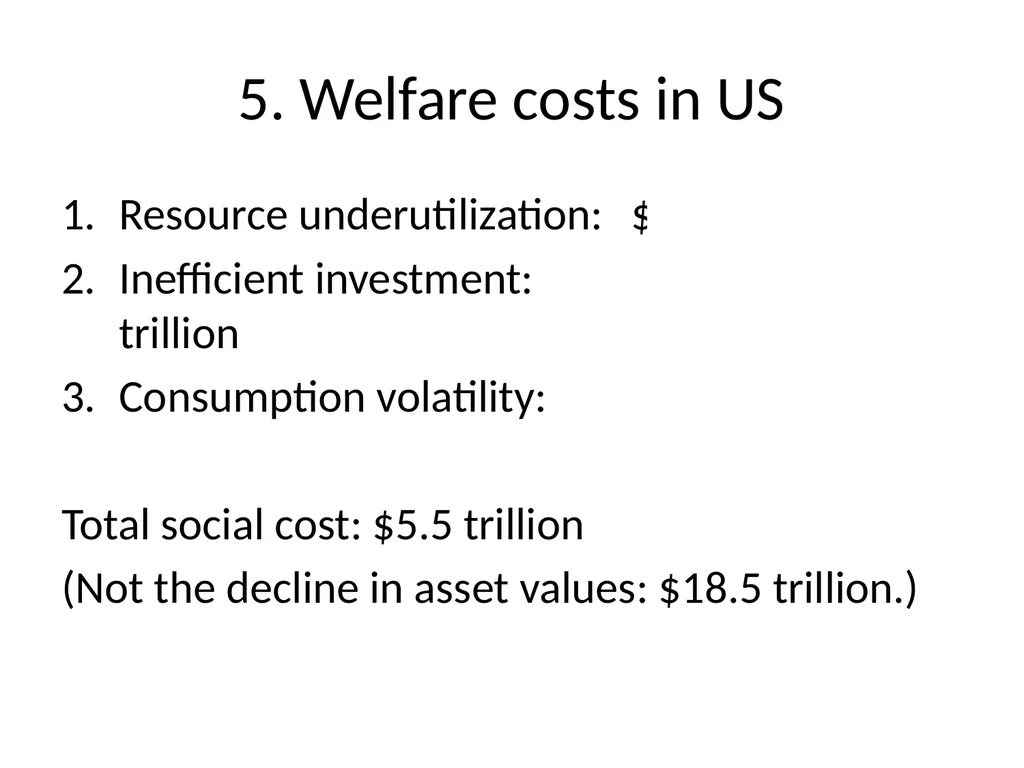
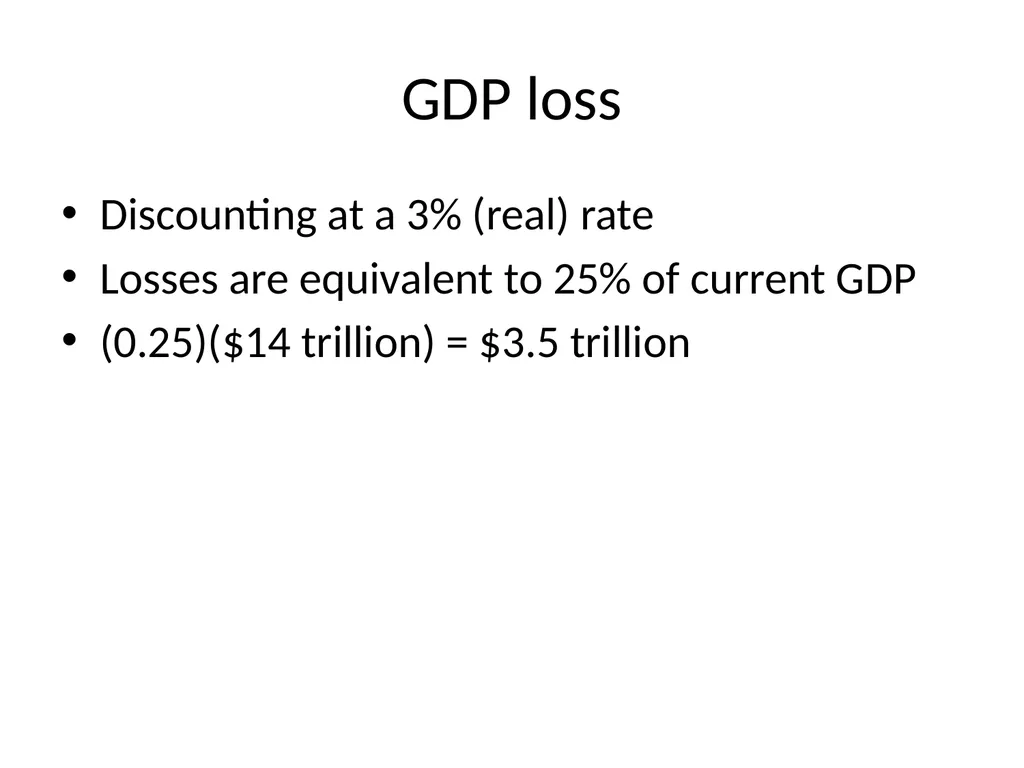
5. Welfare costs in US Resource underutilization: $3.5 trillion
Inefficient investment: <$0.25 trillion
Consumption volatility: $1.8 trillion
Total social cost: $5.5 trillion
(Not the decline in asset values: $18.5 trillion.)<br>
Inefficient investment: <$0.25 trillion
Consumption volatility: $1.8 trillion
Total social cost: $5.5 trillion
(Not the decline in asset values: $18.5 trillion.)<br>
62
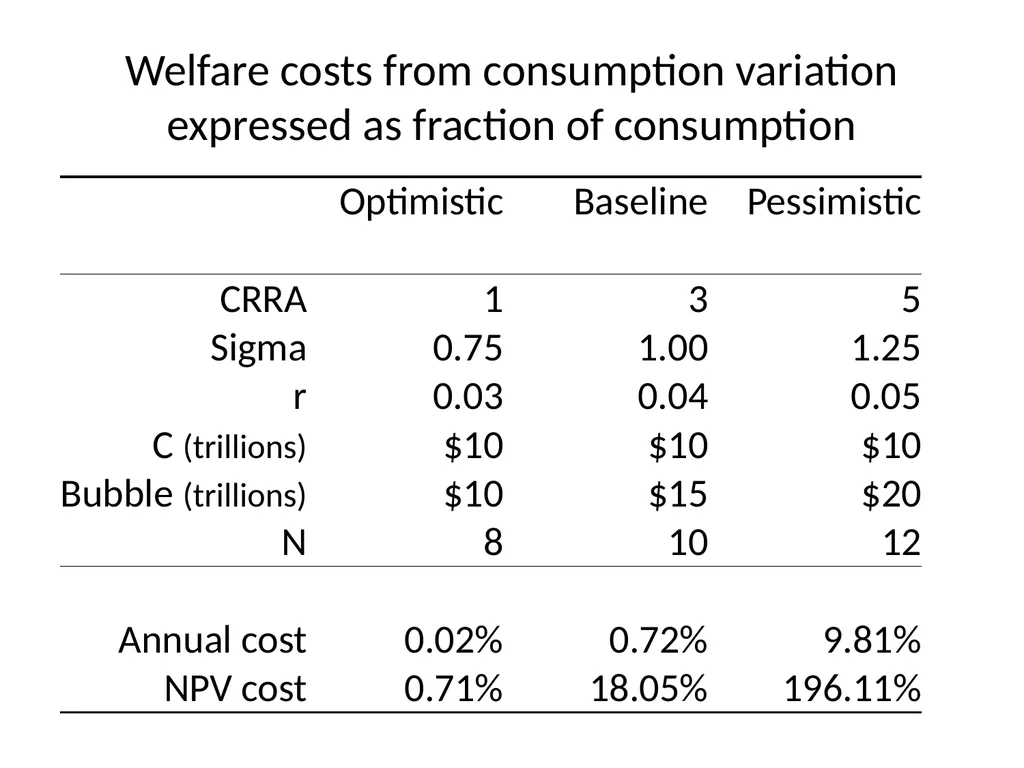
Welfare costs from consumption variation expressed as fraction of consumption<br>
63
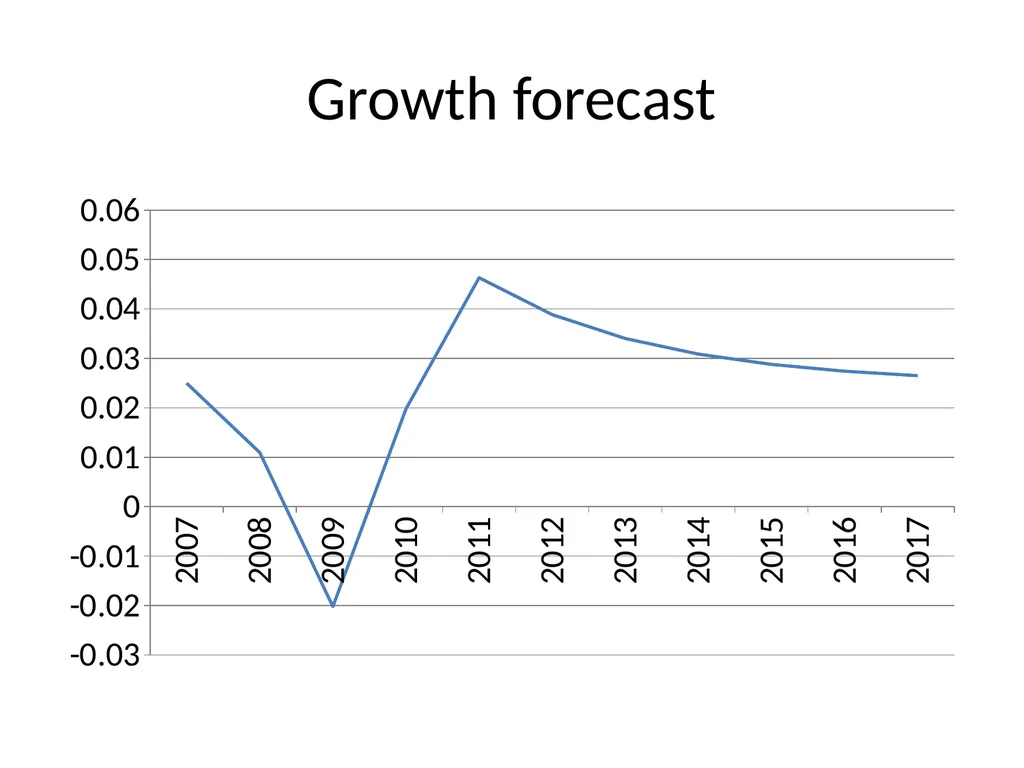
Growth forecast<br>
64
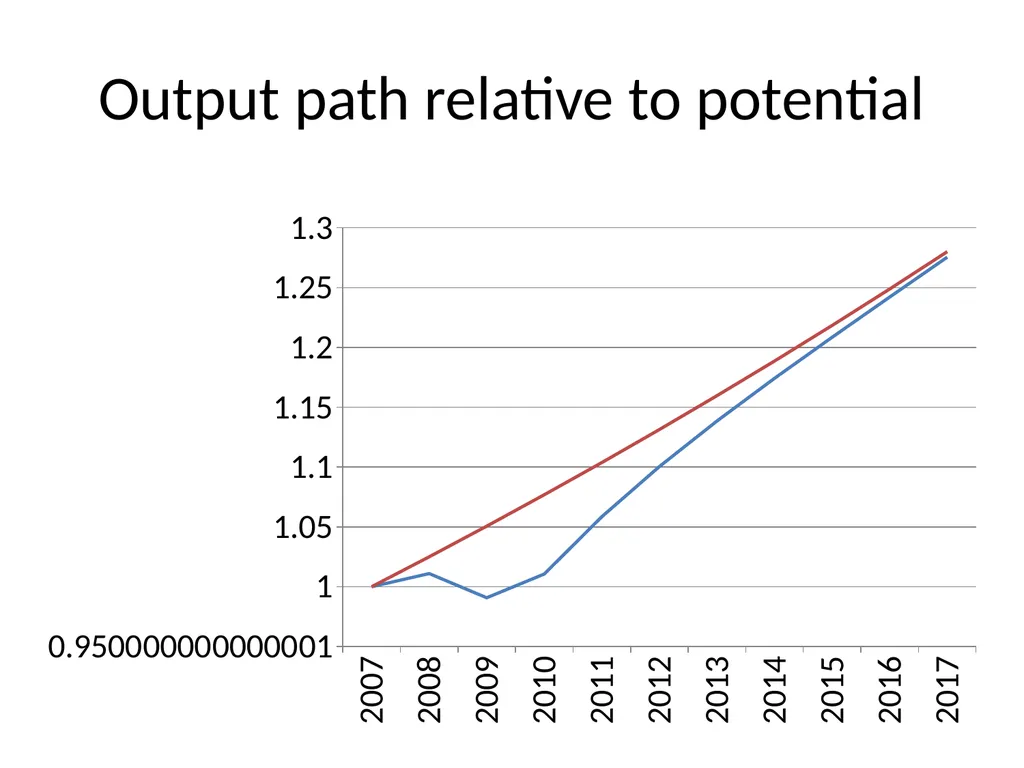
Output path relative to potential<br>
65
GDP loss Discounting at a 3% (real) rate
Losses are equivalent to 25% of current GDP
(0.25)($14 trillion) = $3.5 trillion<br>
Losses are equivalent to 25% of current GDP
(0.25)($14 trillion) = $3.5 trillion<br>
66
Why might a Madoff victim be angry, even if she lost no money?<br>
67
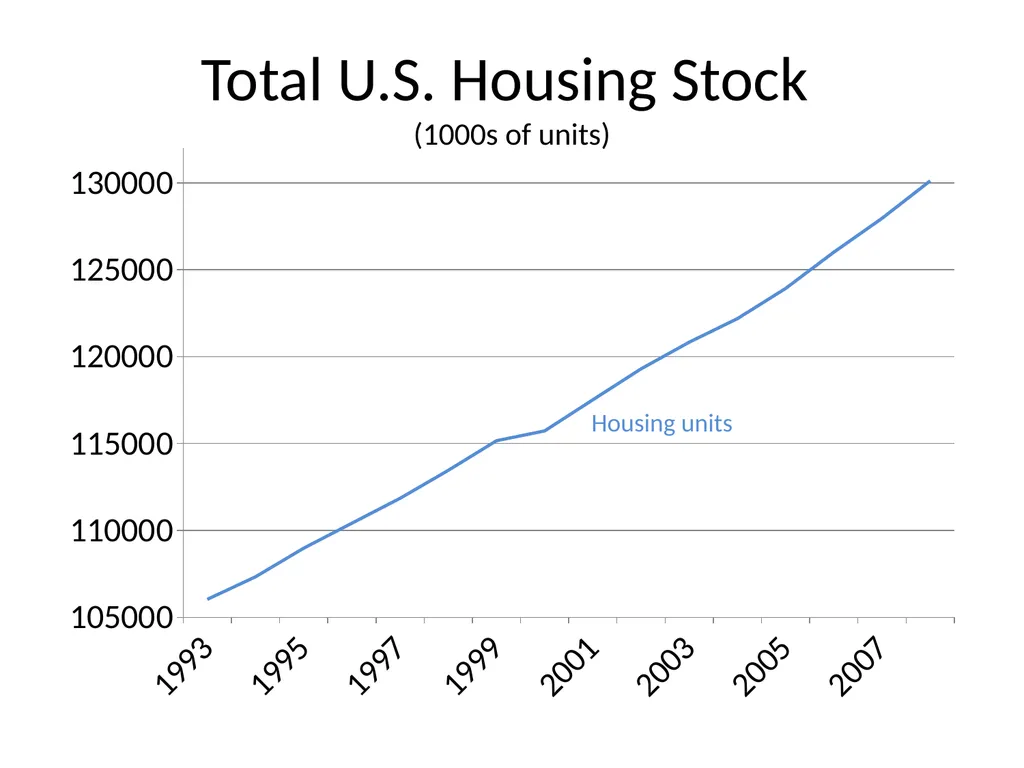
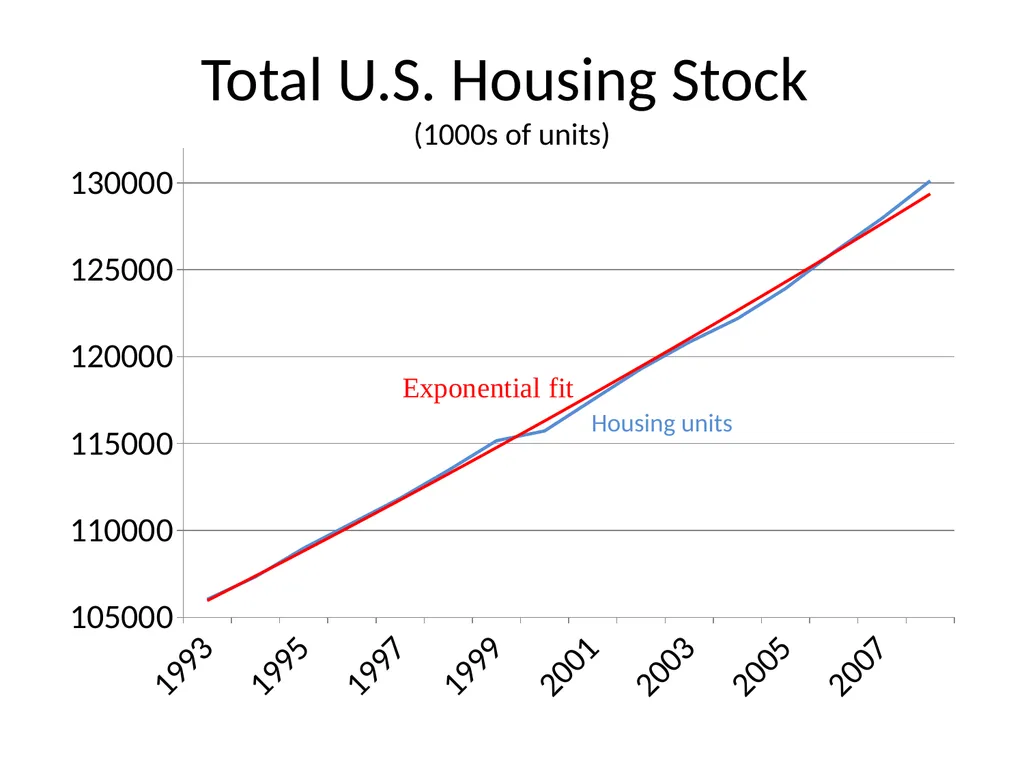
Total U.S. Housing Stock
(1000s of units) Housing units<br>
68
Total U.S. Housing Stock
(1000s of units) Housing units<br>
69
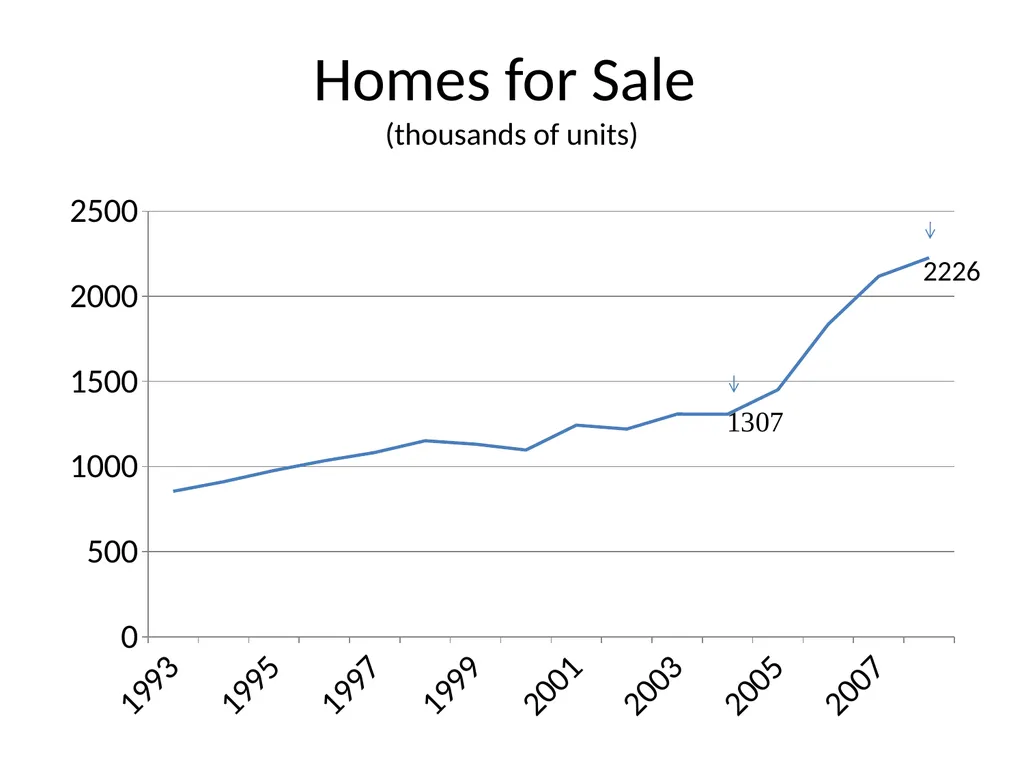
Homes for Sale
(thousands of units) 2226<br>
70
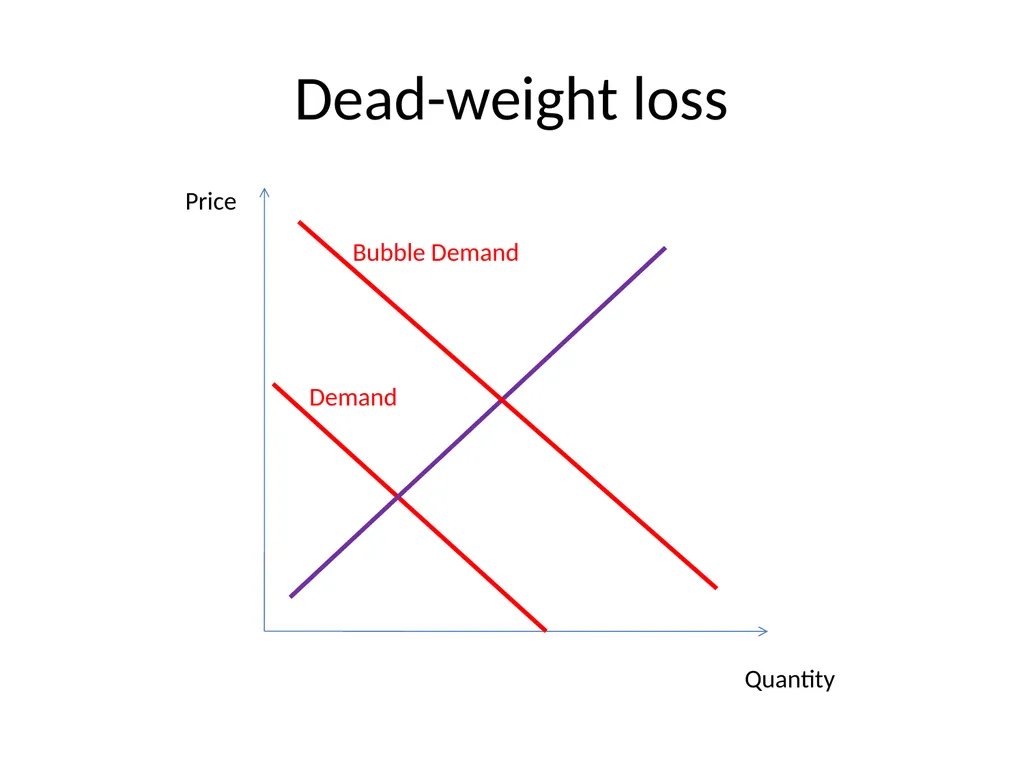
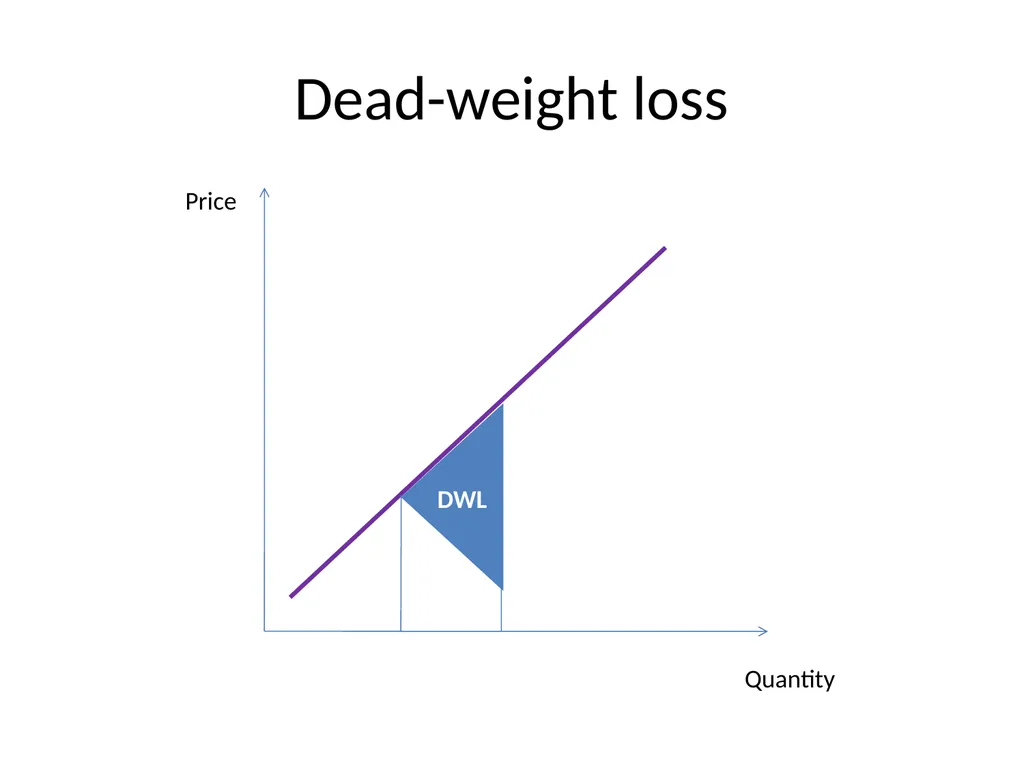
Dead-weight loss Demand Bubble Demand<br>
71
Dead-weight loss Demand Bubble Demand Price Quantity<br>
72
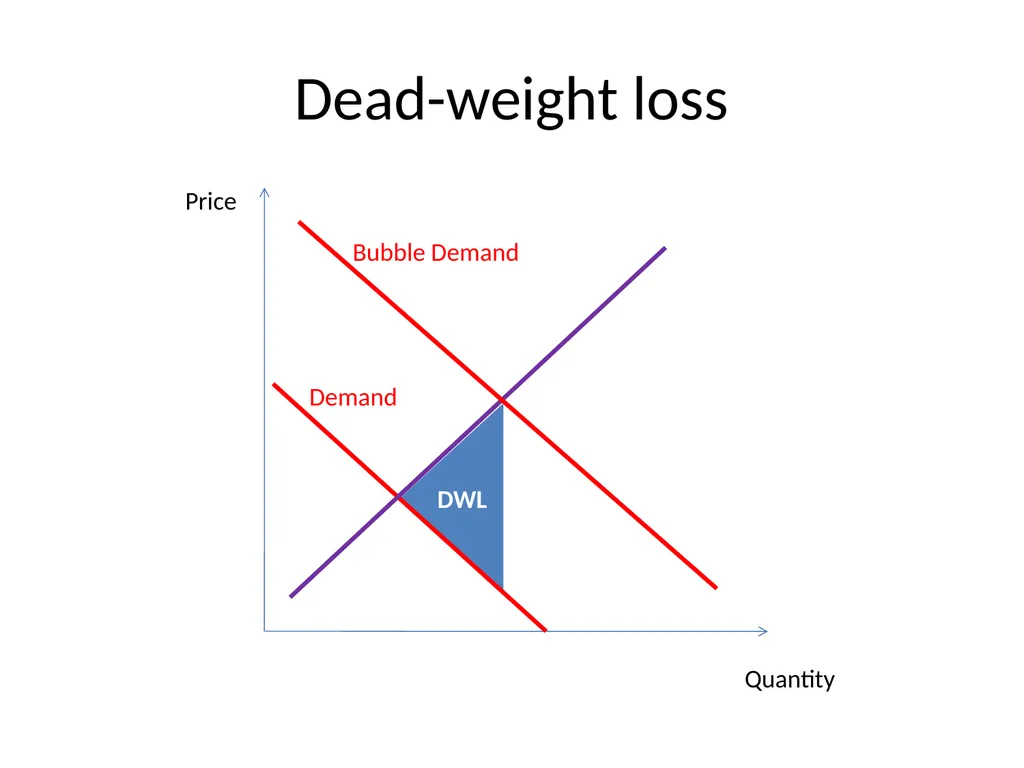
Dead-weight loss Demand Bubble Demand DWL Price Quantity<br>
73
Dead-weight loss DWL Price Quantity<br>
74
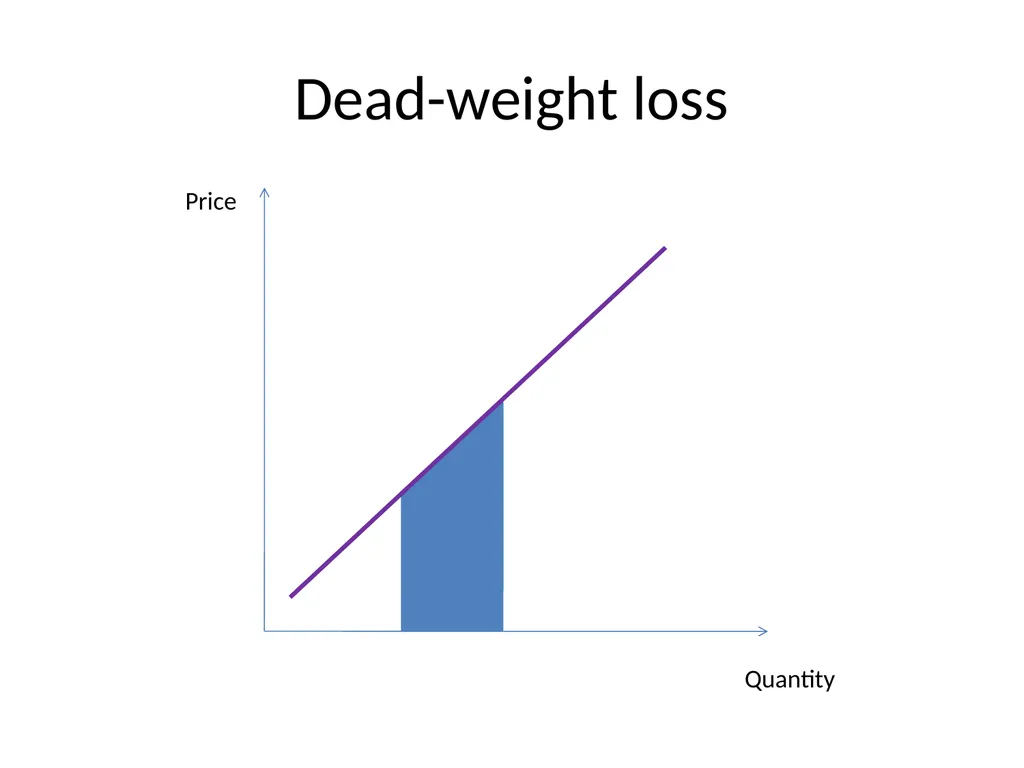
Dead-weight loss Price Quantity<br>
75
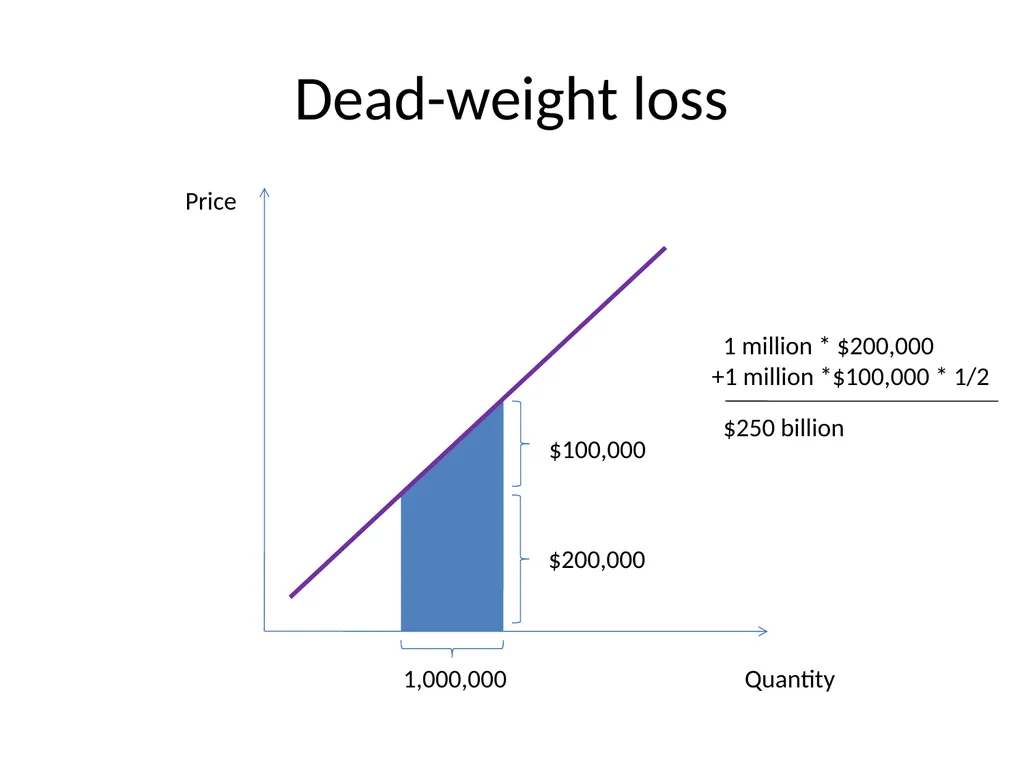
Dead-weight loss Price Quantity $200,000 $100,000 1,000,000 1 million * $200,000
+1 million *$100,000 * 1/2
$250 billion<br>
+1 million *$100,000 * 1/2
$250 billion<br>
76
Three themes Bubble economics may provide a cohesive explanation of the economic events of the past decade
More cohesive than the “savings glut” narrative
The welfare costs are large
But don’t come from excessive capital formation<br>
More cohesive than the “savings glut” narrative
The welfare costs are large
But don’t come from excessive capital formation<br>