business intelligence and analytics systems What is Business Intelligence? Business Intelligence (BI) refers to the technologies, applications, and practices for the collection, integration, analysis, and presentation of business
"business intelligence and analytics systems What" is the property of its rightful owner. Permission is granted to
download and print the materials on this website for personal, non-commercial use only, and to display it
on your personal computer provided you do not modify the materials and that you retain all copyright
notices contained in the materials. By downloading content from our website, you accept the terms of this
agreement.
Presentation Transcript
01
business intelligence and analytics systems<br>
02
What is Business Intelligence? Business Intelligence (BI) refers to the technologies, applications, and practices for the collection, integration, analysis, and presentation of business information.
It provides organizations with valuable insights to make informed decisions and improve performance<br>
03
Key Components of BI Systems Data Warehouse – A central repository of integrated data from various sources.
Data Mining – The process of discovering patterns and trends in large datasets.
Reporting and Visualization – Presenting data in a meaningful and interactive way.
Analytics – Using statistical and mathematical techniques to analyze data and generate insights.
Dashboard – A visual display of key performance indicators (KPIs) and metrics.
ETL (Extract, Transform, Load) – The process of extracting data from multiple sources, transforming it into a consistent format, and loading it into a data warehouse<br>
04
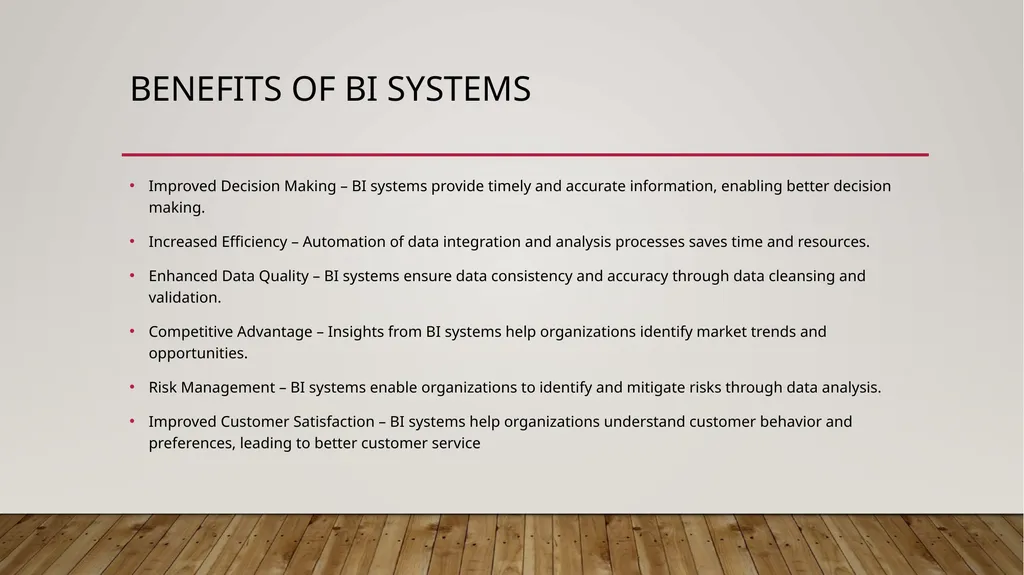
Benefits of BI Systems Improved Decision Making – BI systems provide timely and accurate information, enabling better decision making.
Increased Efficiency – Automation of data integration and analysis processes saves time and resources.
Enhanced Data Quality – BI systems ensure data consistency and accuracy through data cleansing and validation.
Competitive Advantage – Insights from BI systems help organizations identify market trends and opportunities.
Risk Management – BI systems enable organizations to identify and mitigate risks through data analysis.
Improved Customer Satisfaction – BI systems help organizations understand customer behavior and preferences, leading to better customer service<br>
05
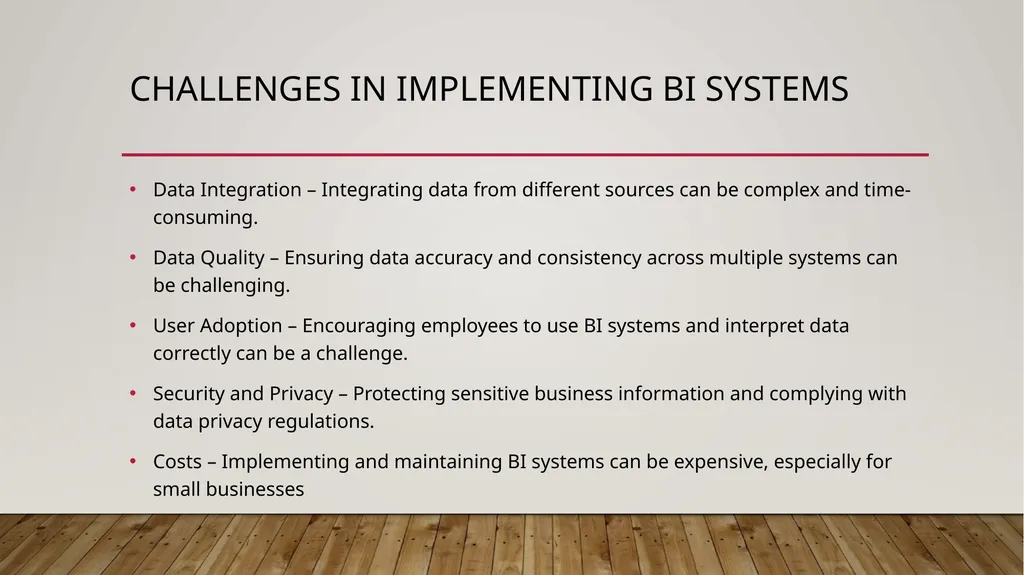
Challenges in Implementing BI Systems Data Integration – Integrating data from different sources can be complex and time-consuming.
Data Quality – Ensuring data accuracy and consistency across multiple systems can be challenging.
User Adoption – Encouraging employees to use BI systems and interpret data correctly can be a challenge.
Security and Privacy – Protecting sensitive business information and complying with data privacy regulations.
Costs – Implementing and maintaining BI systems can be expensive, especially for small businesses<br>
06
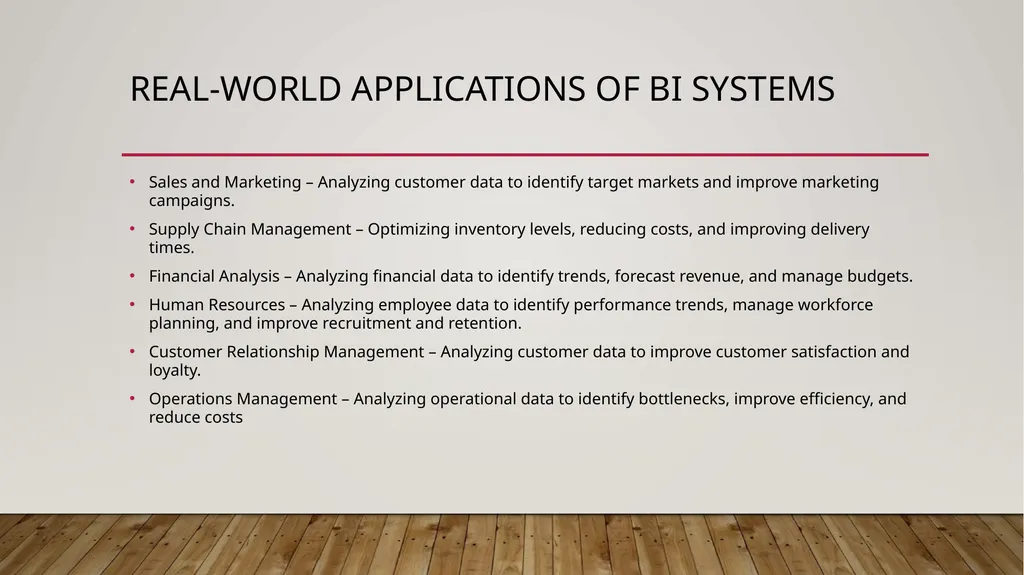
Real-World Applications of BI Systems Sales and Marketing – Analyzing customer data to identify target markets and improve marketing campaigns.
Supply Chain Management – Optimizing inventory levels, reducing costs, and improving delivery times.
Financial Analysis – Analyzing financial data to identify trends, forecast revenue, and manage budgets.
Human Resources – Analyzing employee data to identify performance trends, manage workforce planning, and improve recruitment and retention.
Customer Relationship Management – Analyzing customer data to improve customer satisfaction and loyalty.
Operations Management – Analyzing operational data to identify bottlenecks, improve efficiency, and reduce costs<br>
07
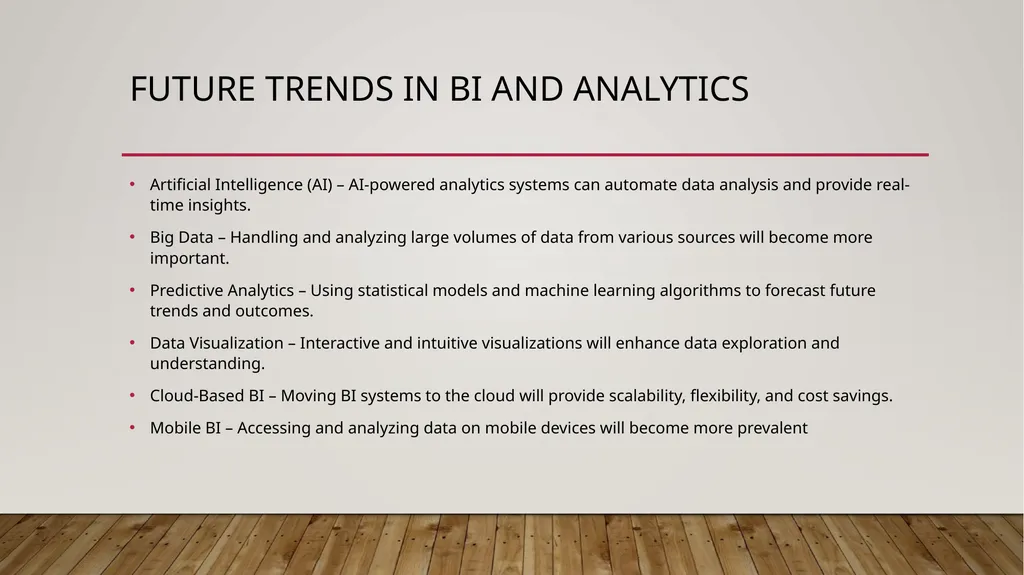
Future Trends in BI and Analytics Artificial Intelligence (AI) – AI-powered analytics systems can automate data analysis and provide real-time insights.
Big Data – Handling and analyzing large volumes of data from various sources will become more important.
Predictive Analytics – Using statistical models and machine learning algorithms to forecast future trends and outcomes.
Data Visualization – Interactive and intuitive visualizations will enhance data exploration and understanding.
Cloud-Based BI – Moving BI systems to the cloud will provide scalability, flexibility, and cost savings.
Mobile BI – Accessing and analyzing data on mobile devices will become more prevalent<br>