
Business Strategy for Lawyers Chapter 1: Framework

Description: Business Strategy for Lawyers Chapter 1: Framework Prof. Amitai Aviram Aviramillinois.edu University of Illinois College of Law Copyright Amitai Aviram. All Rights Reserved S14D Framework Overview of Chapter 1 Introduction to BSL What is
Related Topics
Download Presentation
"Business Strategy for Lawyers Chapter 1: Framework" is the property of its rightful owner. Permission is granted to download and print the materials on this website for personal, non-commercial use only, and to display it on your personal computer provided you do not modify the materials and that you retain all copyright notices contained in the materials. By downloading content from our website, you accept the terms of this agreement.
Presentation Transcript
slide1. Business Strategy for Lawyers
Chapter 1:
Framework Prof. Amitai Aviram
Aviram@illinois.edu
University of Illinois College of Law
Copyright © Amitai Aviram. All Rights Reserved
S14D<br>
slide2. Framework Overview of Chapter 1 Introduction to BSL
What is business strategy?
Business intelligence
The value pool © Amitai Aviram. All rights reserved. 2<br>
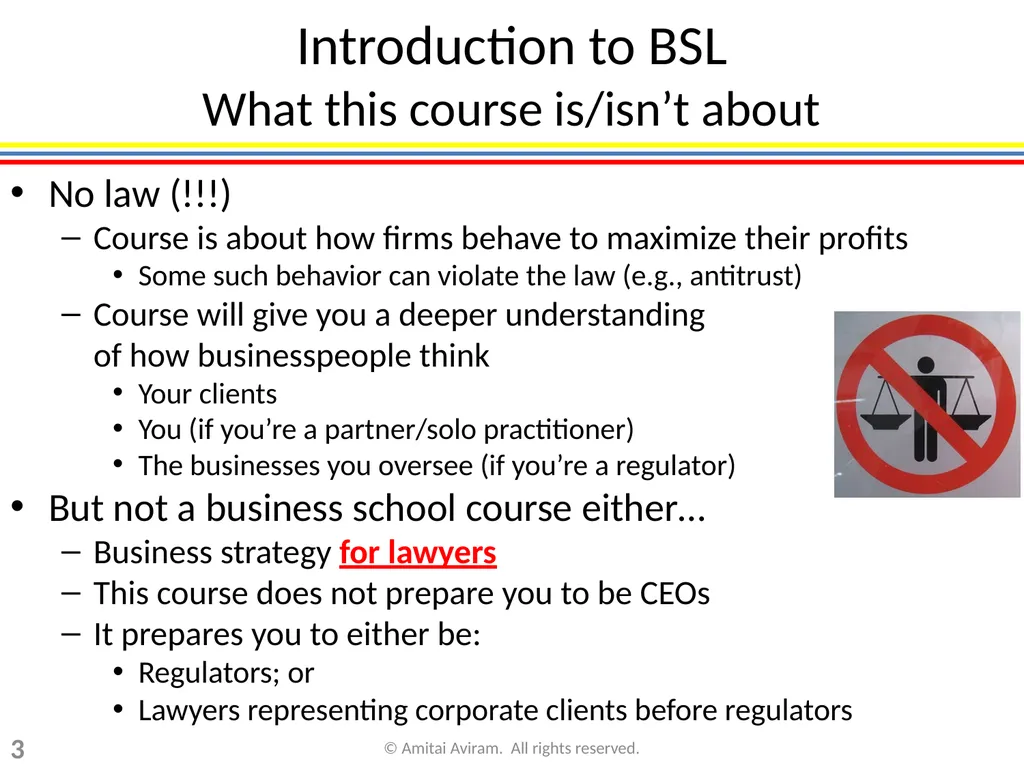
slide3. Introduction to BSL What this course is/isn’t about No law (!!!)
Course is about how firms behave to maximize their profits
Some such behavior can violate the law (e.g., antitrust)
Course will give you a deeper understanding of how businesspeople think
Your clients
You (if you’re a partner/solo practitioner)
The businesses you oversee (if you’re a regulator)
But not a business school course either…
Business strategy for lawyers
This course does not prepare you to be CEOs
It prepares you to either be:
Regulators; or
Lawyers representing corporate clients before regulators 3 © Amitai Aviram. All rights reserved.<br>
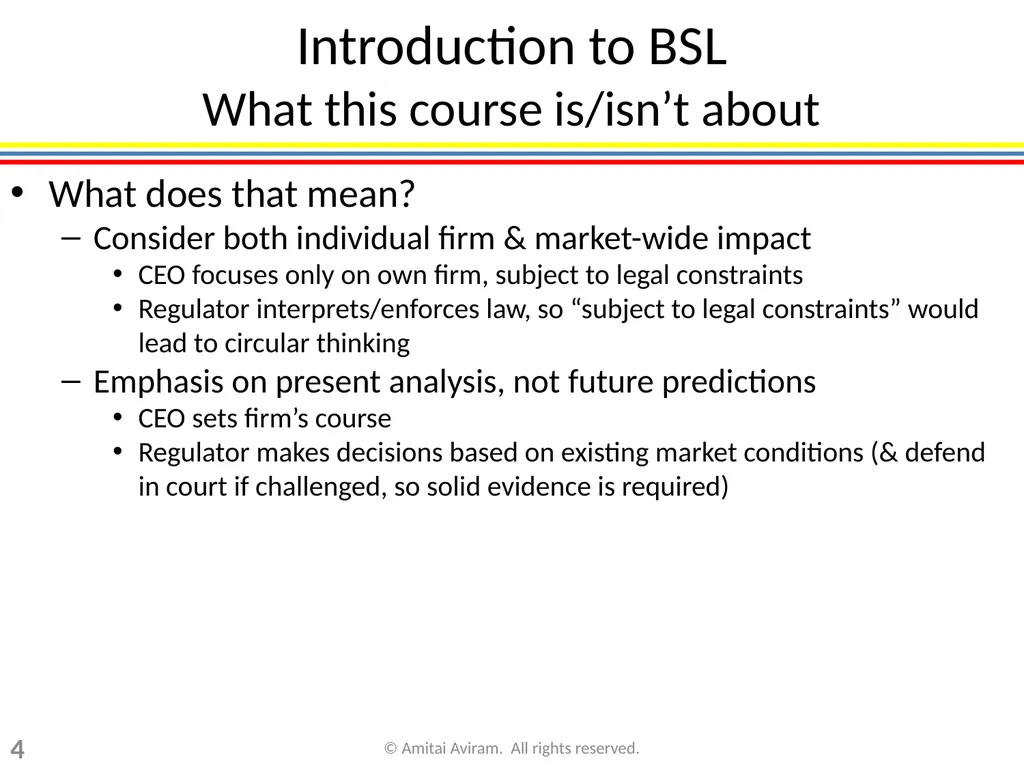
slide4. Introduction to BSL What this course is/isn’t about What does that mean?
Consider both individual firm & market-wide impact
CEO focuses only on own firm, subject to legal constraints
Regulator interprets/enforces law, so “subject to legal constraints” would lead to circular thinking
Emphasis on present analysis, not future predictions
CEO sets firm’s course
Regulator makes decisions based on existing market conditions (& defend in court if challenged, so solid evidence is required) 4 © Amitai Aviram. All rights reserved.<br>
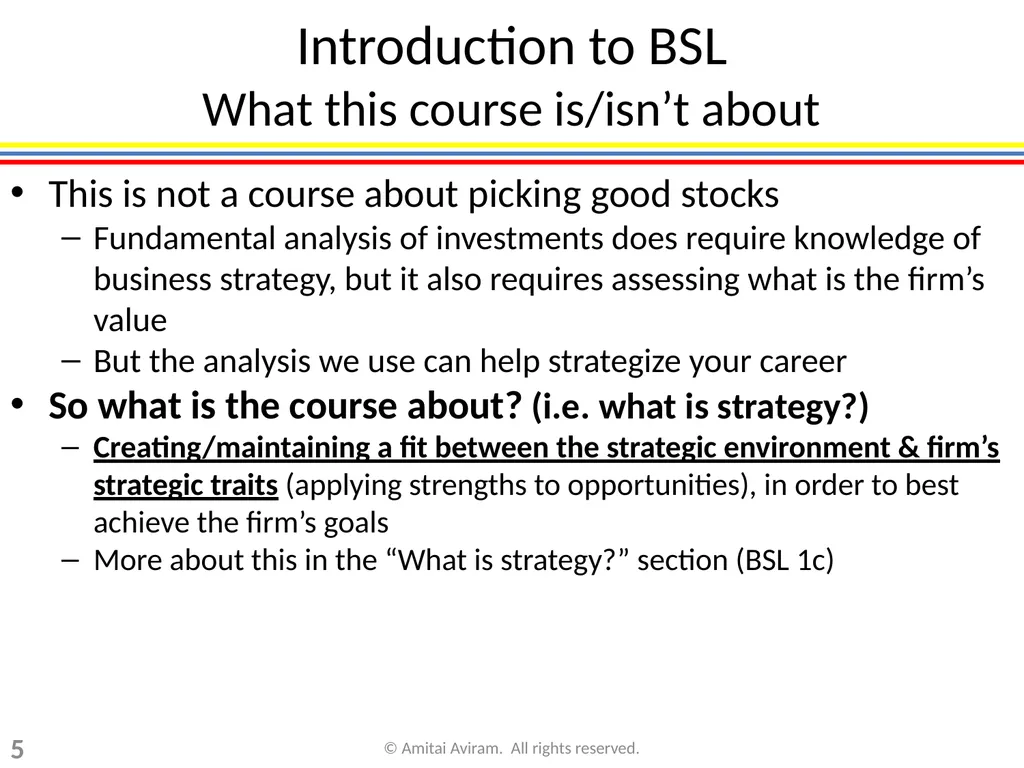
slide5. Introduction to BSL What this course is/isn’t about This is not a course about picking good stocks
Fundamental analysis of investments does require knowledge of business strategy, but it also requires assessing what is the firm’s value
But the analysis we use can help strategize your career
So what is the course about? (i.e. what is strategy?)
Creating/maintaining a fit between the strategic environment & firm’s strategic traits (applying strengths to opportunities), in order to best achieve the firm’s goals
More about this in the “What is strategy?” section (BSL 1c) 5 © Amitai Aviram. All rights reserved.<br>
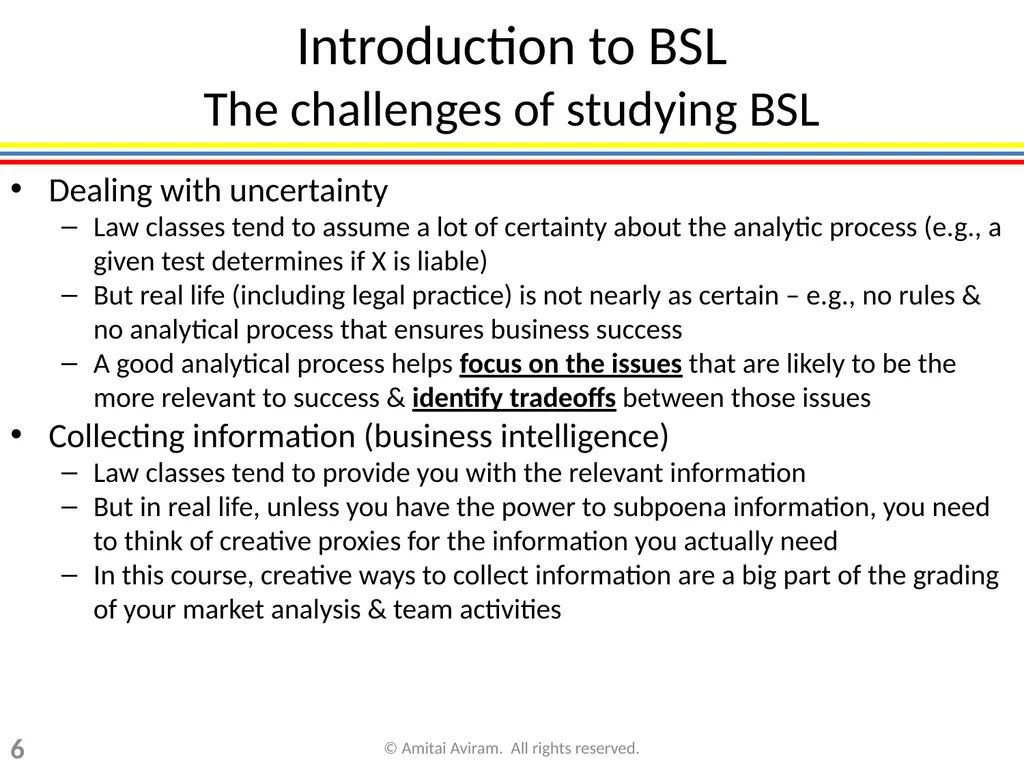
slide6. Introduction to BSL The challenges of studying BSL Dealing with uncertainty
Law classes tend to assume a lot of certainty about the analytic process (e.g., a given test determines if X is liable)
But real life (including legal practice) is not nearly as certain – e.g., no rules & no analytical process that ensures business success
A good analytical process helps focus on the issues that are likely to be the more relevant to success & identify tradeoffs between those issues
Collecting information (business intelligence)
Law classes tend to provide you with the relevant information
But in real life, unless you have the power to subpoena information, you need to think of creative proxies for the information you actually need
In this course, creative ways to collect information are a big part of the grading of your market analysis & team activities 6 © Amitai Aviram. All rights reserved.<br>
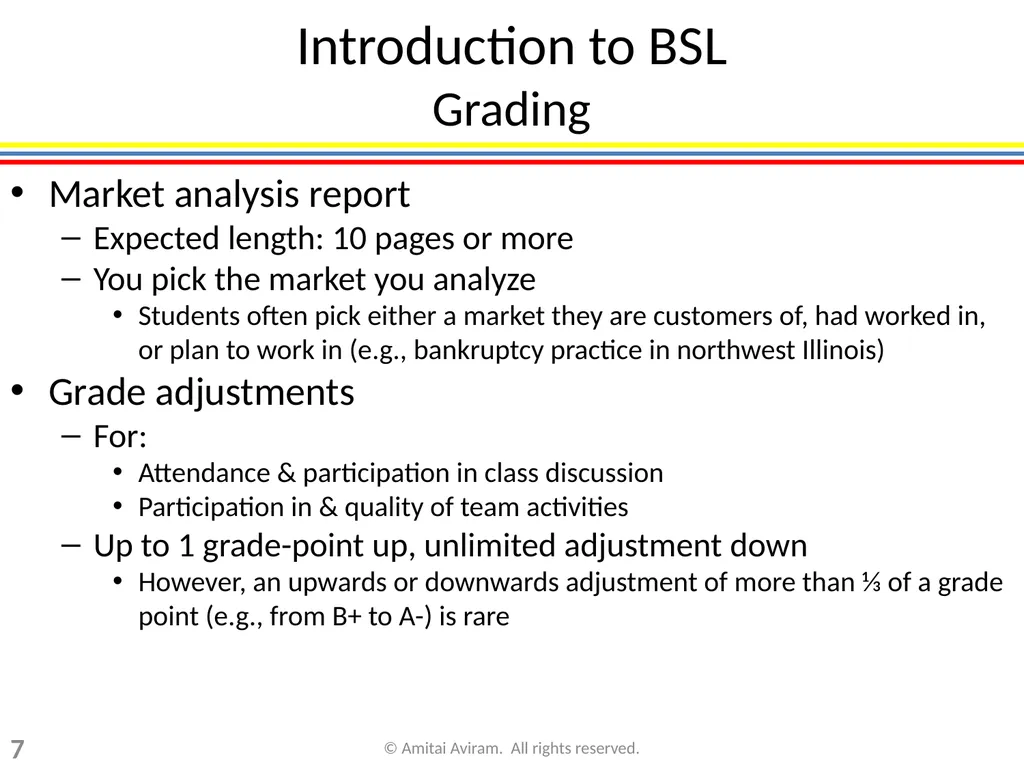
slide7. Introduction to BSL Grading Market analysis report
Expected length: 10 pages or more
You pick the market you analyze
Students often pick either a market they are customers of, had worked in, or plan to work in (e.g., bankruptcy practice in northwest Illinois)
Grade adjustments
For:
Attendance & participation in class discussion
Participation in & quality of team activities
Up to 1 grade-point up, unlimited adjustment down
However, an upwards or downwards adjustment of more than ⅓ of a grade point (e.g., from B+ to A-) is rare 7 © Amitai Aviram. All rights reserved.<br>
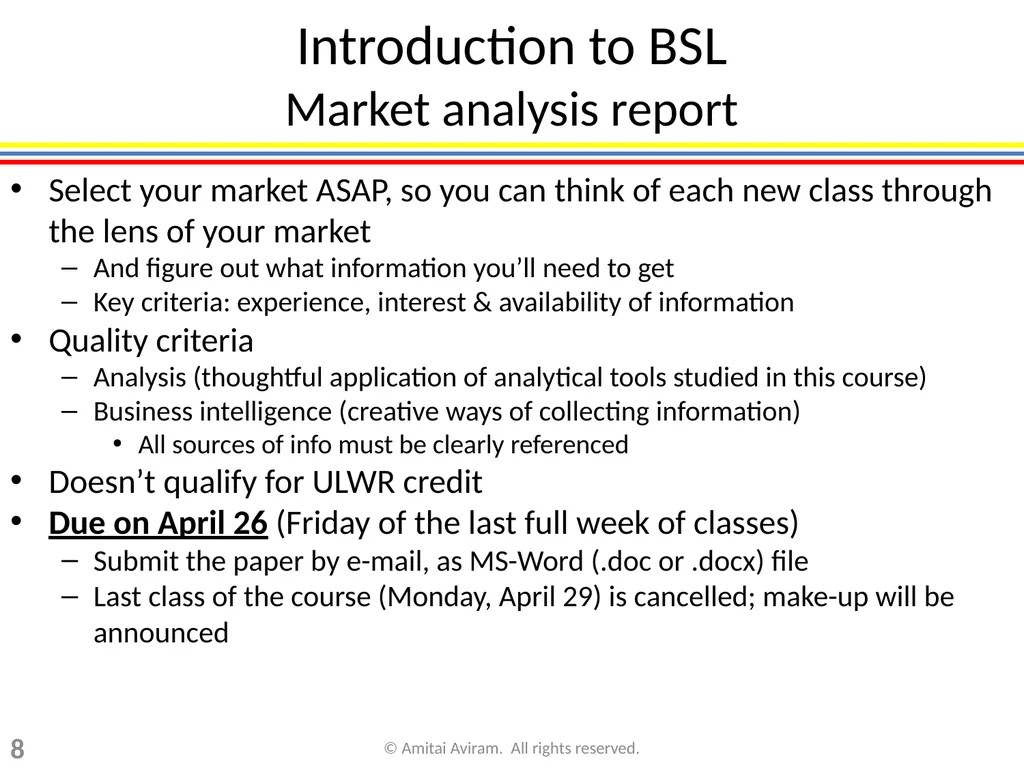
slide8. Introduction to BSL Market analysis report Select your market ASAP, so you can think of each new class through the lens of your market
And figure out what information you’ll need to get
Key criteria: experience, interest & availability of information
Quality criteria
Analysis (thoughtful application of analytical tools studied in this course)
Business intelligence (creative ways of collecting information)
All sources of info must be clearly referenced
Doesn’t qualify for ULWR credit
Due on April 26 (Friday of the last full week of classes)
Submit the paper by e-mail, as MS-Word (.doc or .docx) file
Last class of the course (Monday, April 29) is cancelled; make-up will be announced 8 © Amitai Aviram. All rights reserved.<br>
slide9. Introduction to BSL Getting more information Slides, course outline & syllabus are posted and regularly updated on my website
http://www.law.illinois.edu/aviram/
Talking to me outside of class
Please e-mail prior to meeting with me
Suggest when you would like to meet (not limited to office hours)
Describe what you want to talk about
E-mail: aviram@illinois.edu
Room 326 9 © Amitai Aviram. All rights reserved.<br>
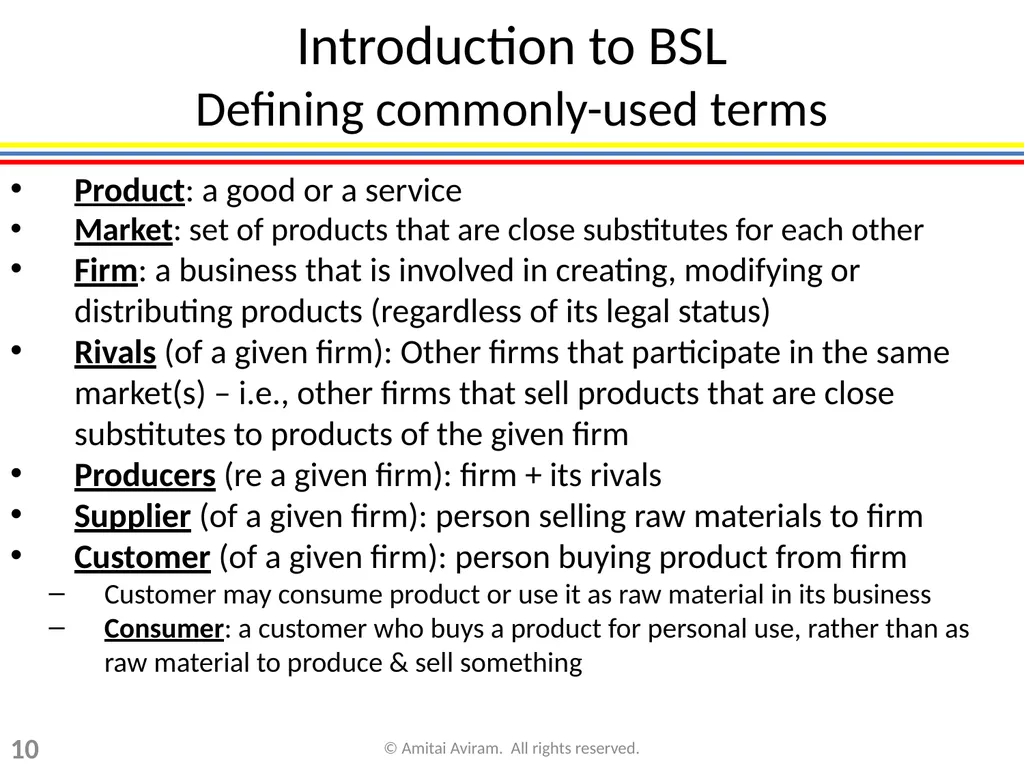
slide10. Introduction to BSL Defining commonly-used terms Product: a good or a service
Market: set of products that are close substitutes for each other
Firm: a business that is involved in creating, modifying or distributing products (regardless of its legal status)
Rivals (of a given firm): Other firms that participate in the same market(s) – i.e., other firms that sell products that are close substitutes to products of the given firm
Producers (re a given firm): firm + its rivals
Supplier (of a given firm): person selling raw materials to firm
Customer (of a given firm): person buying product from firm
Customer may consume product or use it as raw material in its business
Consumer: a customer who buys a product for personal use, rather than as raw material to produce & sell something 10 © Amitai Aviram. All rights reserved.<br>
slide11. Framework Overview of Chapter 1 Introduction to BSL
What is business strategy?
Business intelligence
The value pool © Amitai Aviram. All rights reserved. 11<br>
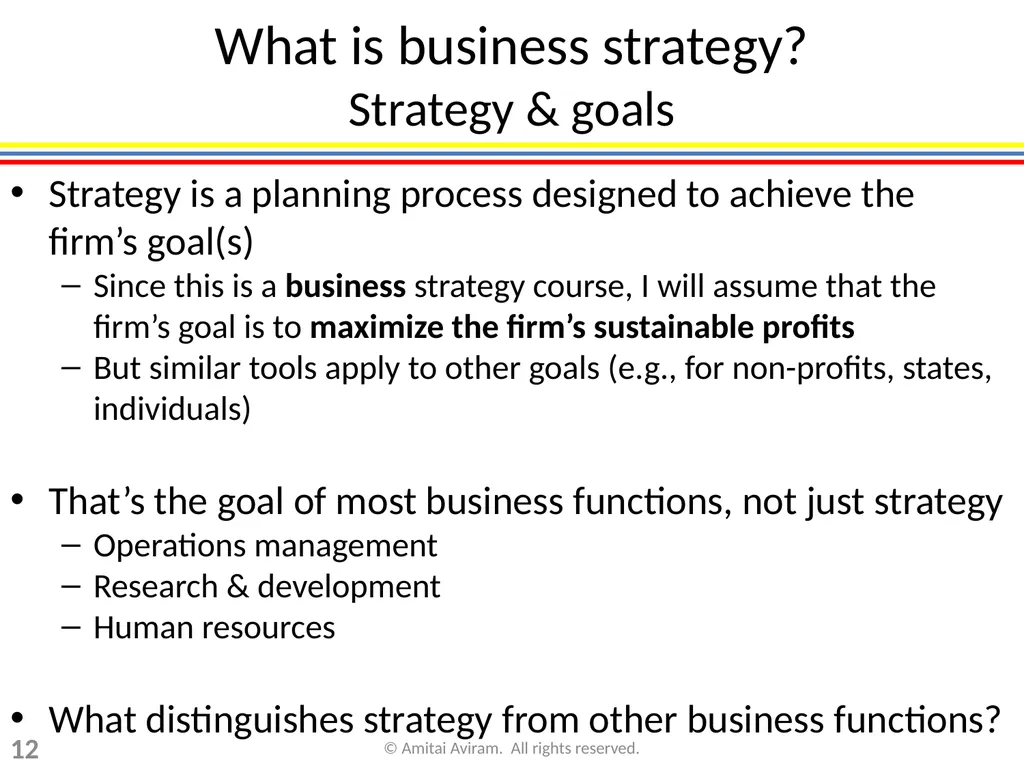
slide12. What is business strategy? Strategy & goals Strategy is a planning process designed to achieve the firm’s goal(s)
Since this is a business strategy course, I will assume that the firm’s goal is to maximize the firm’s sustainable profits
But similar tools apply to other goals (e.g., for non-profits, states, individuals)
That’s the goal of most business functions, not just strategy
Operations management
Research & development
Human resources
What distinguishes strategy from other business functions? 12 © Amitai Aviram. All rights reserved.<br>
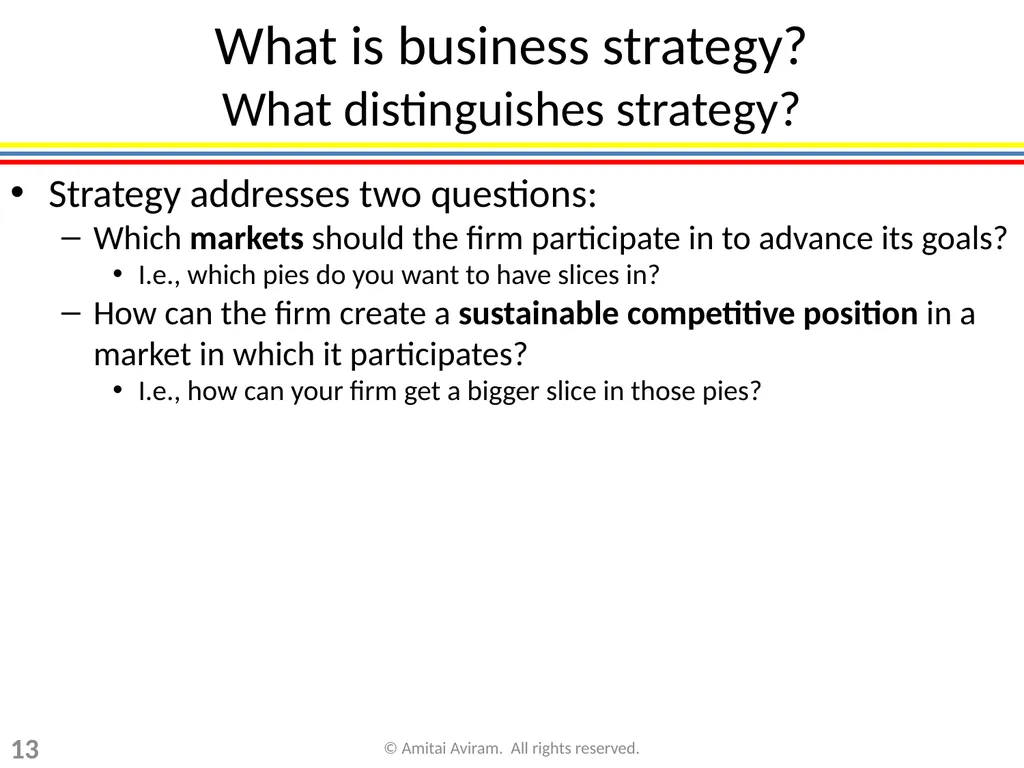
slide13. What is business strategy? What distinguishes strategy? Strategy addresses two questions:
Which markets should the firm participate in to advance its goals?
I.e., which pies do you want to have slices in?
How can the firm create a sustainable competitive position in a market in which it participates?
I.e., how can your firm get a bigger slice in those pies? 13 © Amitai Aviram. All rights reserved.<br>
slide14. What is business strategy? Which markets? Abstract answer to the first question (which markets to participate in): markets with
A large or growing value pool (the total amount of value created by the business activities)
In a benign strategic environment
Strategic environment: the set of economic constraints that determines how much of the value of a business activity is captured by market participants (firm & rivals) rather than other actors (customers & suppliers) 14 © Amitai Aviram. All rights reserved.<br>
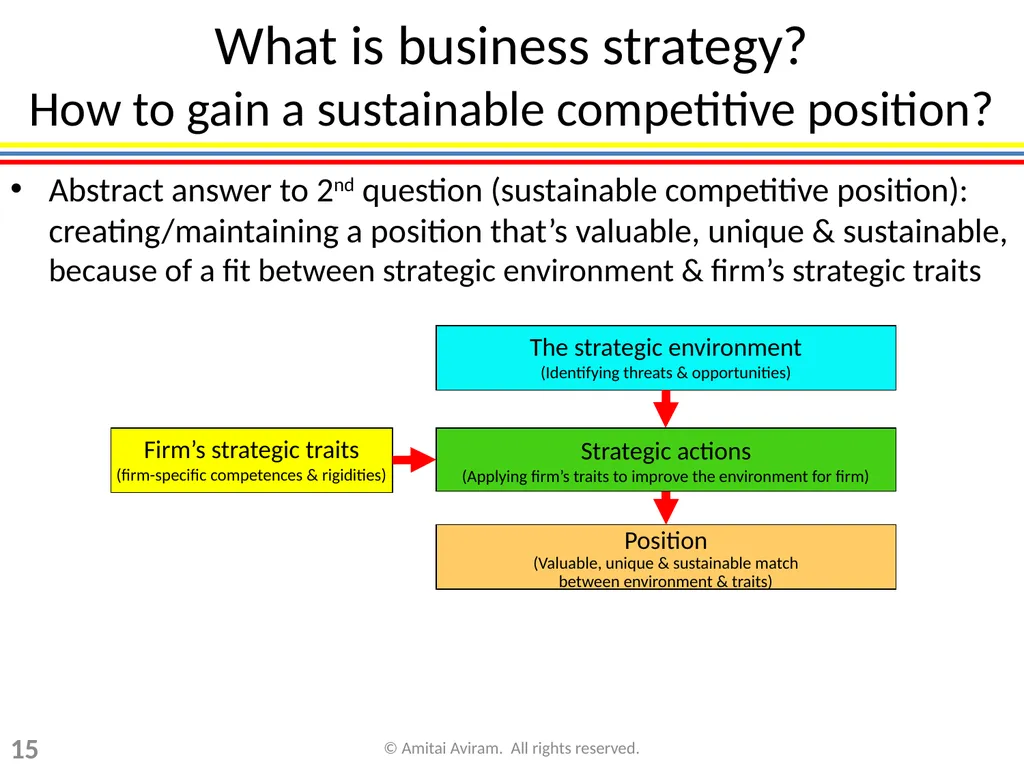
slide15. What is business strategy? How to gain a sustainable competitive position? Abstract answer to 2nd question (sustainable competitive position): creating/maintaining a position that’s valuable, unique & sustainable, because of a fit between strategic environment & firm’s strategic traits The strategic environment (Identifying threats & opportunities) Position (Valuable, unique & sustainable match between environment & traits) Strategic actions (Applying firm’s traits to improve the environment for firm) Firm’s strategic traits (firm-specific competences & rigidities) 15 © Amitai Aviram. All rights reserved.<br>
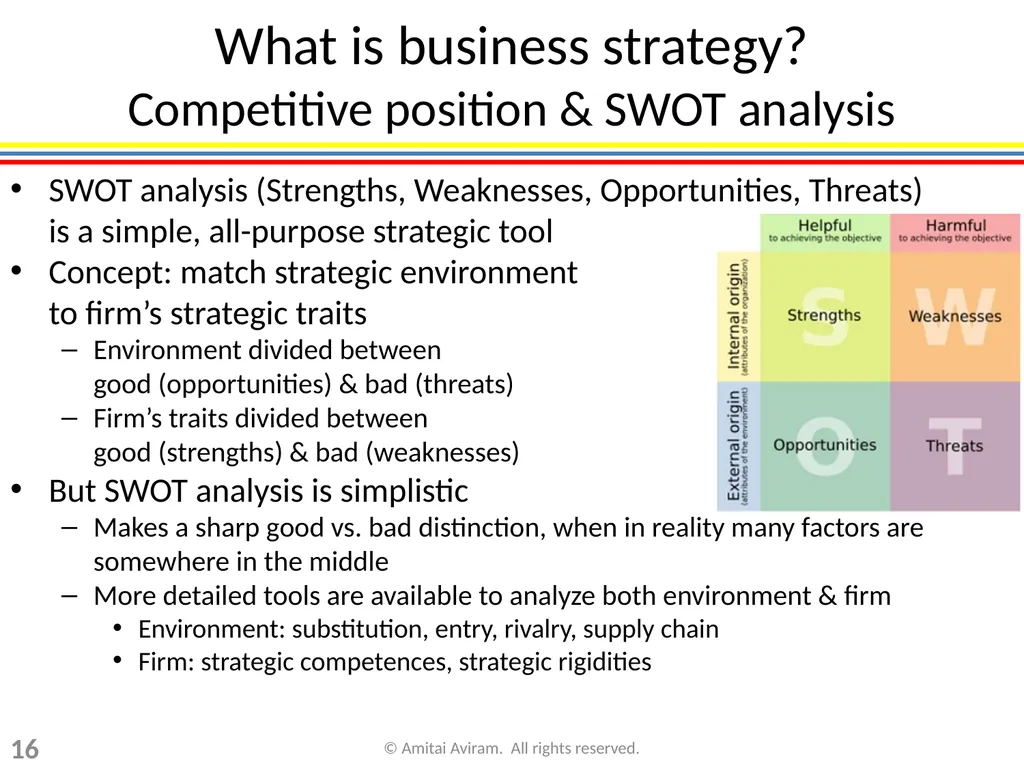
slide16. What is business strategy? Competitive position & SWOT analysis SWOT analysis (Strengths, Weaknesses, Opportunities, Threats) is a simple, all-purpose strategic tool
Concept: match strategic environment to firm’s strategic traits
Environment divided between good (opportunities) & bad (threats)
Firm’s traits divided between good (strengths) & bad (weaknesses)
But SWOT analysis is simplistic
Makes a sharp good vs. bad distinction, when in reality many factors are somewhere in the middle
More detailed tools are available to analyze both environment & firm
Environment: substitution, entry, rivalry, supply chain
Firm: strategic competences, strategic rigidities 16 © Amitai Aviram. All rights reserved.<br>
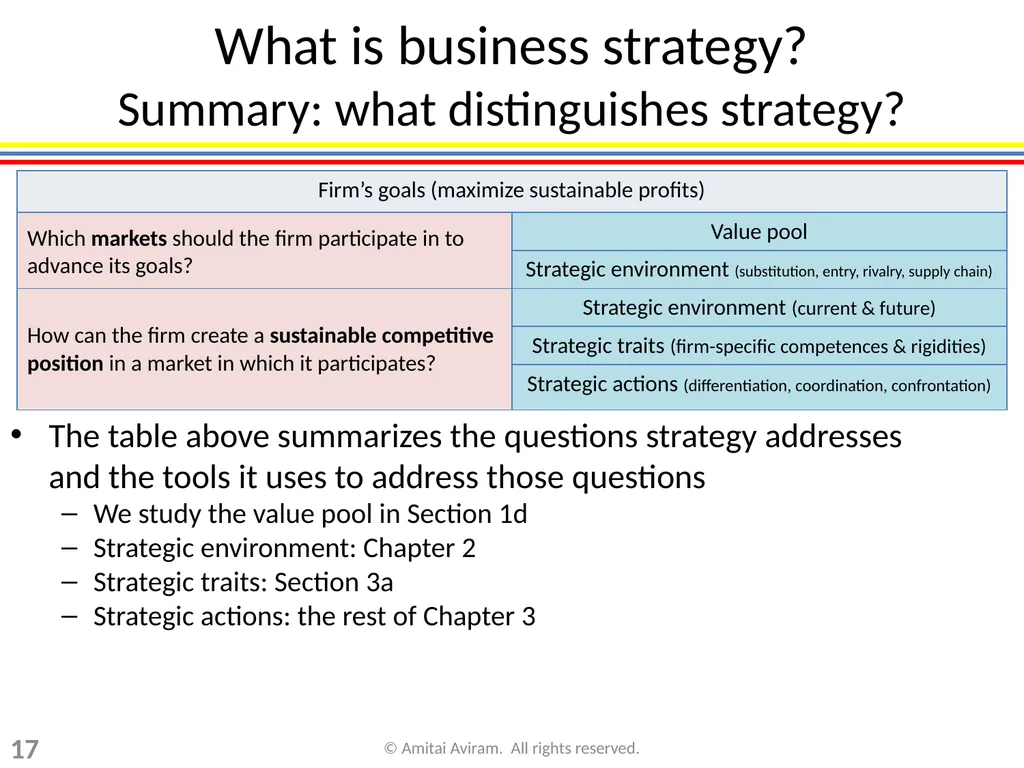
slide17. What is business strategy? Summary: what distinguishes strategy? The table above summarizes the questions strategy addresses and the tools it uses to address those questions
We study the value pool in Section 1d
Strategic environment: Chapter 2
Strategic traits: Section 3a
Strategic actions: the rest of Chapter 3 17 © Amitai Aviram. All rights reserved.<br>
slide18. Framework Overview of Chapter 1 Introduction to BSL
What is business strategy?
Business intelligence
The value pool © Amitai Aviram. All rights reserved. 18<br>
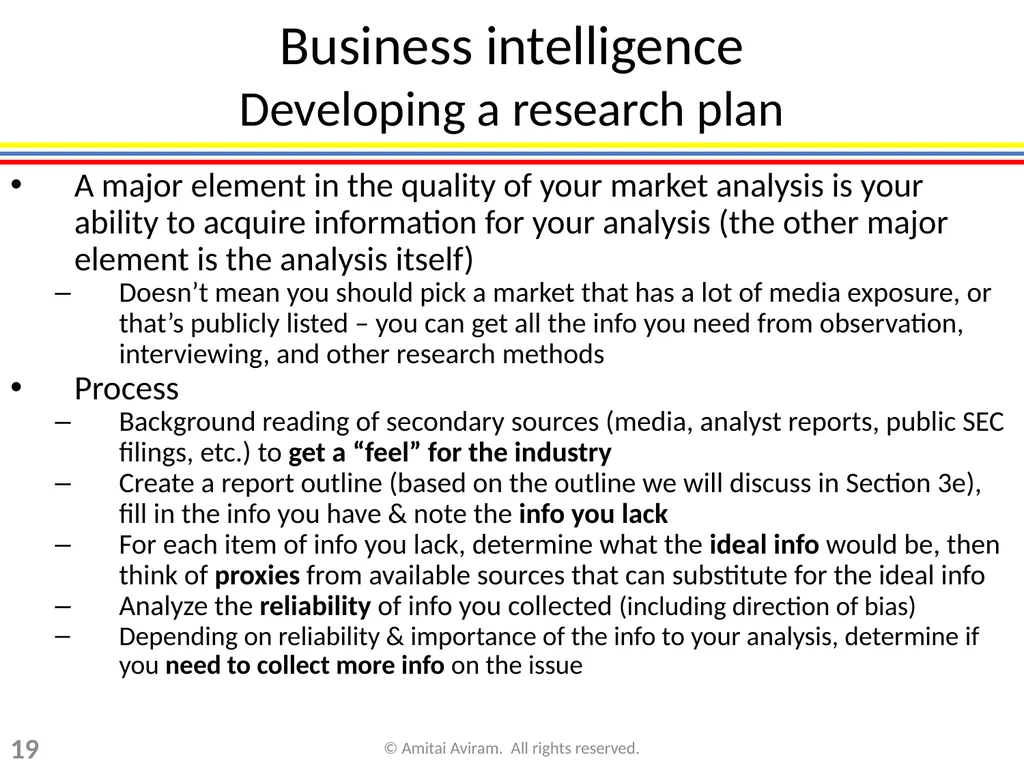
slide19. Business intelligence Developing a research plan A major element in the quality of your market analysis is your ability to acquire information for your analysis (the other major element is the analysis itself)
Doesn’t mean you should pick a market that has a lot of media exposure, or that’s publicly listed – you can get all the info you need from observation, interviewing, and other research methods
Process
Background reading of secondary sources (media, analyst reports, public SEC filings, etc.) to get a “feel” for the industry
Create a report outline (based on the outline we will discuss in Section 3e), fill in the info you have & note the info you lack
For each item of info you lack, determine what the ideal info would be, then think of proxies from available sources that can substitute for the ideal info
Analyze the reliability of info you collected (including direction of bias)
Depending on reliability & importance of the info to your analysis, determine if you need to collect more info on the issue 19 © Amitai Aviram. All rights reserved.<br>
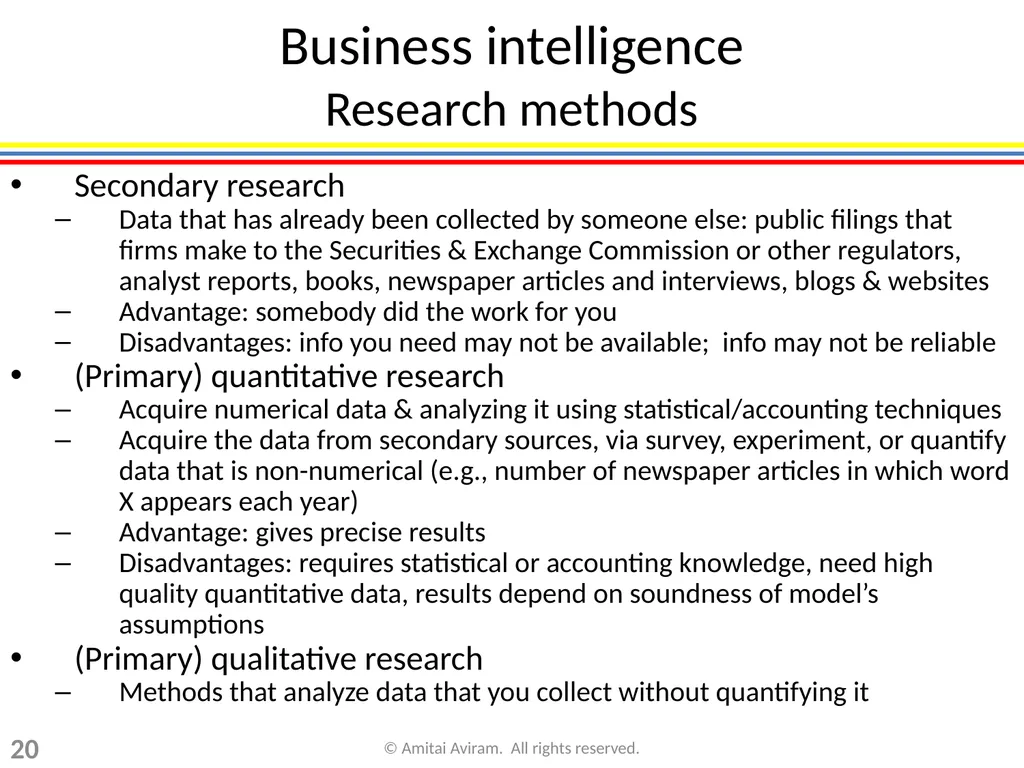
slide20. Business intelligence Research methods Secondary research
Data that has already been collected by someone else: public filings that firms make to the Securities & Exchange Commission or other regulators, analyst reports, books, newspaper articles and interviews, blogs & websites
Advantage: somebody did the work for you
Disadvantages: info you need may not be available; info may not be reliable
(Primary) quantitative research
Acquire numerical data & analyzing it using statistical/accounting techniques
Acquire the data from secondary sources, via survey, experiment, or quantify data that is non-numerical (e.g., number of newspaper articles in which word X appears each year)
Advantage: gives precise results
Disadvantages: requires statistical or accounting knowledge, need high quality quantitative data, results depend on soundness of model’s assumptions
(Primary) qualitative research
Methods that analyze data that you collect without quantifying it 20 © Amitai Aviram. All rights reserved.<br>
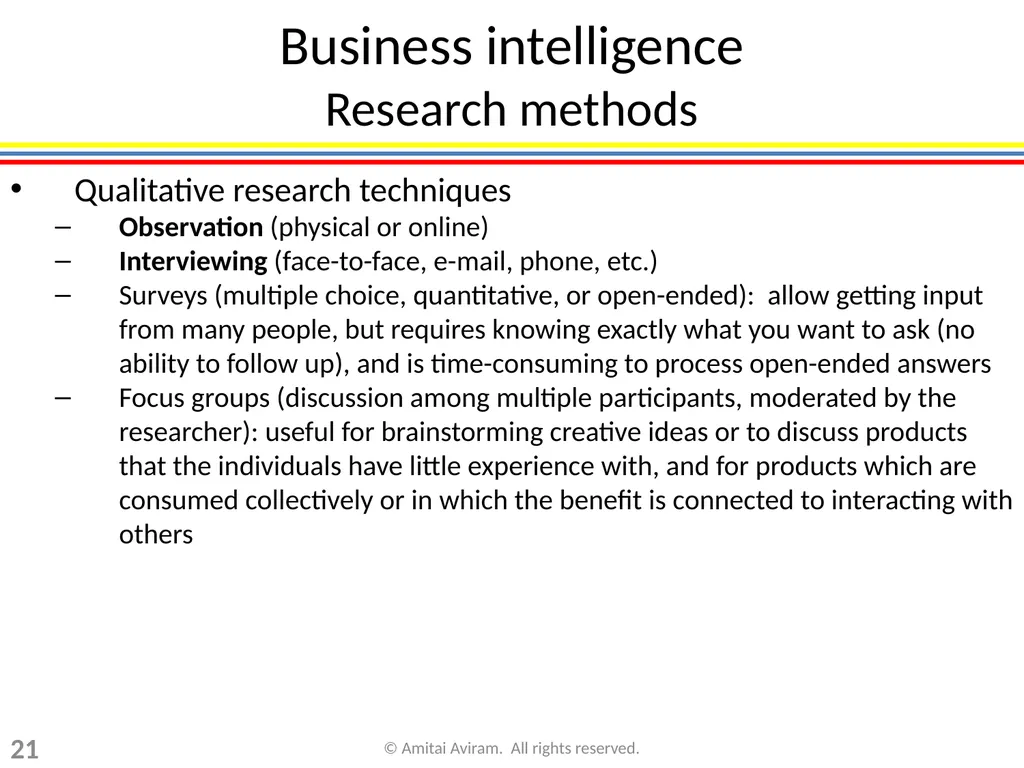
slide21. Business intelligence Research methods Qualitative research techniques
Observation (physical or online)
Interviewing (face-to-face, e-mail, phone, etc.)
Surveys (multiple choice, quantitative, or open-ended): allow getting input from many people, but requires knowing exactly what you want to ask (no ability to follow up), and is time-consuming to process open-ended answers
Focus groups (discussion among multiple participants, moderated by the researcher): useful for brainstorming creative ideas or to discuss products that the individuals have little experience with, and for products which are consumed collectively or in which the benefit is connected to interacting with others 21 © Amitai Aviram. All rights reserved.<br>
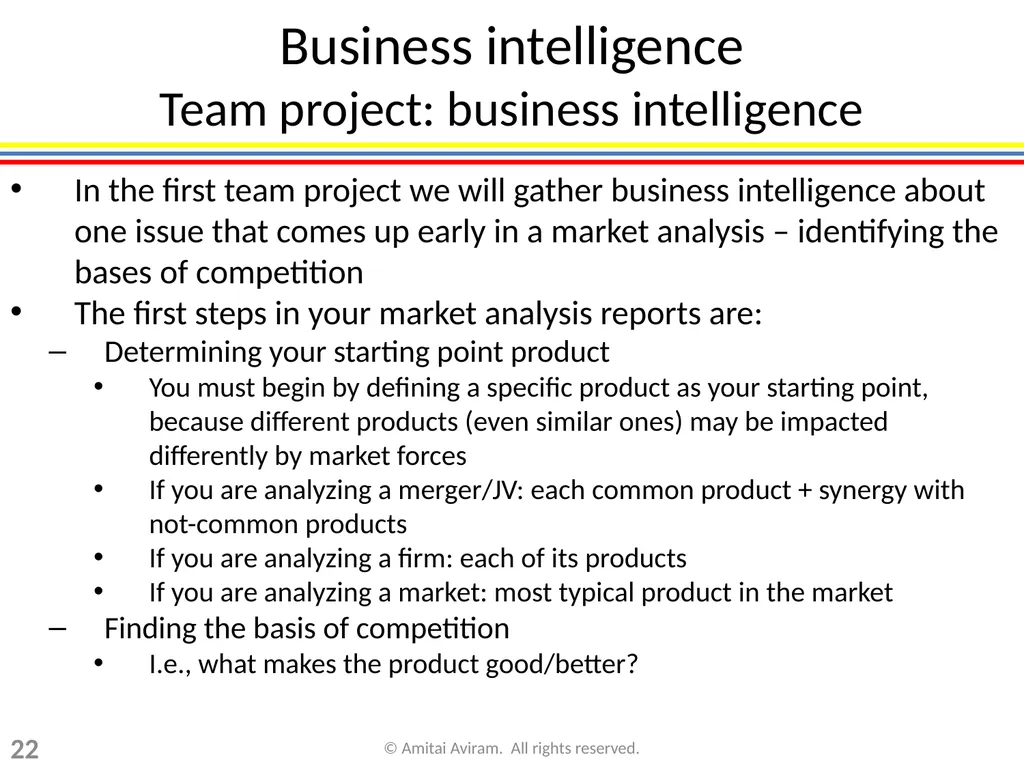
slide22. Business intelligence Team project: business intelligence In the first team project we will gather business intelligence about one issue that comes up early in a market analysis – identifying the bases of competition
The first steps in your market analysis reports are:
Determining your starting point product
You must begin by defining a specific product as your starting point, because different products (even similar ones) may be impacted differently by market forces
If you are analyzing a merger/JV: each common product + synergy with not-common products
If you are analyzing a firm: each of its products
If you are analyzing a market: most typical product in the market
Finding the basis of competition
I.e., what makes the product good/better? 22 © Amitai Aviram. All rights reserved.<br>
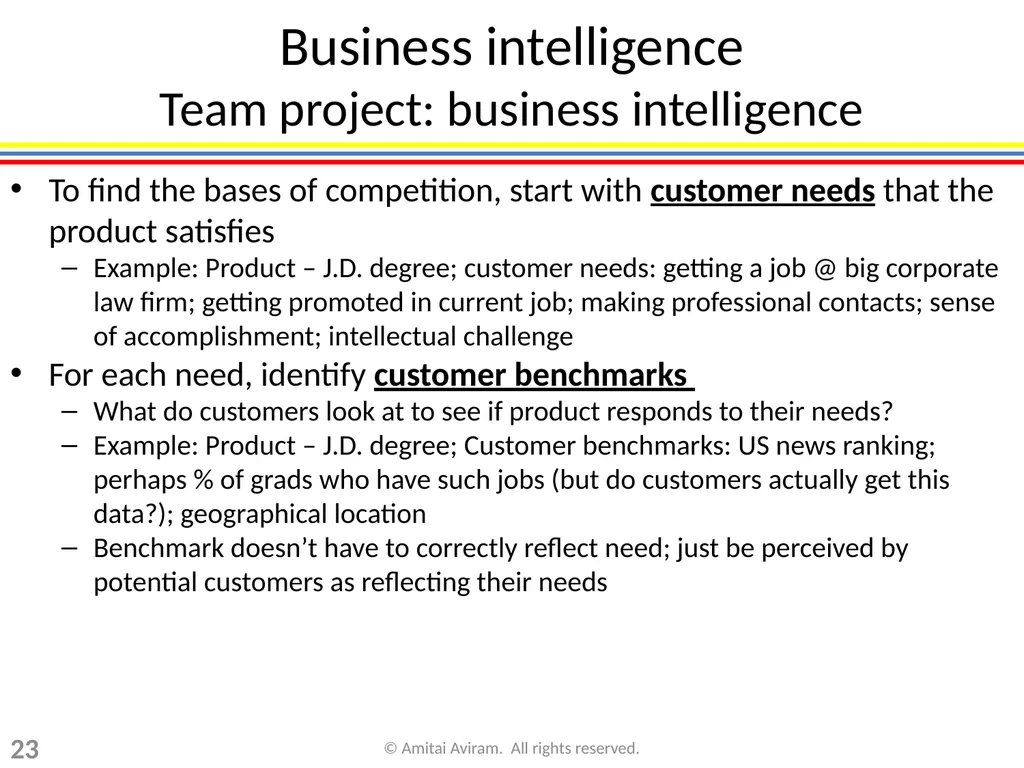
slide23. Business intelligence Team project: business intelligence To find the bases of competition, start with customer needs that the product satisfies
Example: Product – J.D. degree; customer needs: getting a job @ big corporate law firm; getting promoted in current job; making professional contacts; sense of accomplishment; intellectual challenge
For each need, identify customer benchmarks
What do customers look at to see if product responds to their needs?
Example: Product – J.D. degree; Customer benchmarks: US news ranking; perhaps % of grads who have such jobs (but do customers actually get this data?); geographical location
Benchmark doesn’t have to correctly reflect need; just be perceived by potential customers as reflecting their needs 23 © Amitai Aviram. All rights reserved.<br>
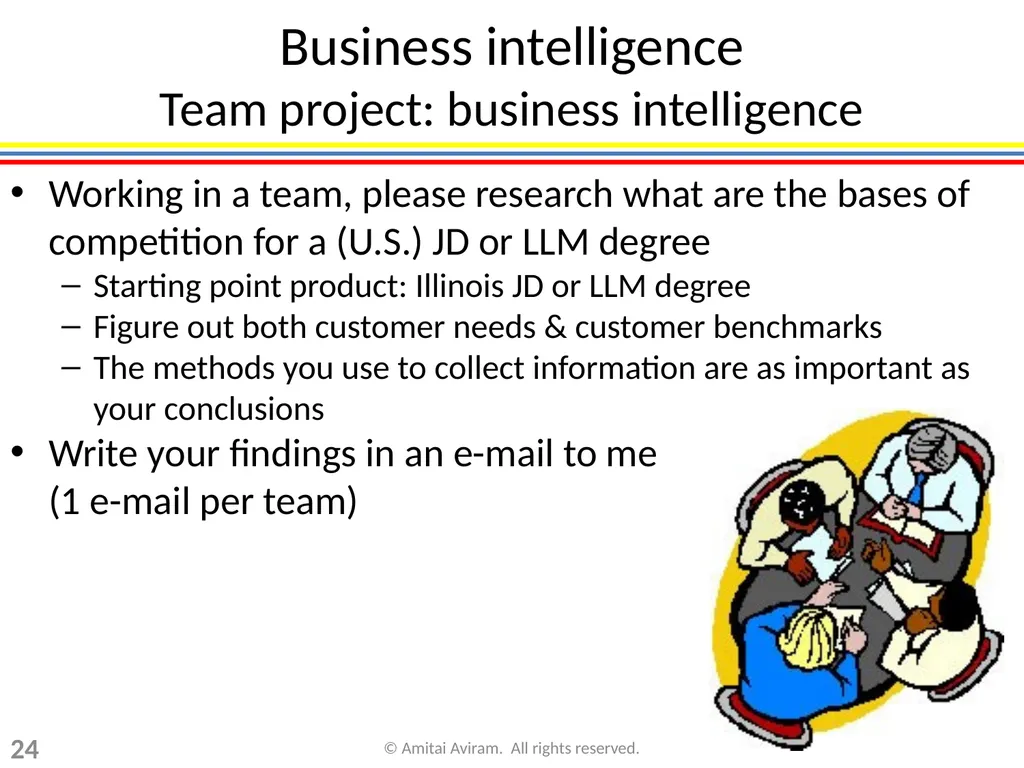
slide24. Business intelligence Team project: business intelligence Working in a team, please research what are the bases of competition for a (U.S.) JD or LLM degree
Starting point product: Illinois JD or LLM degree
Figure out both customer needs & customer benchmarks
The methods you use to collect information are as important as your conclusions
Write your findings in an e-mail to me (1 e-mail per team) 24 © Amitai Aviram. All rights reserved.<br>
slide25. Framework Overview of Chapter 1 Introduction to BSL
What is business strategy?
Business intelligence
The value pool © Amitai Aviram. All rights reserved. 25<br>
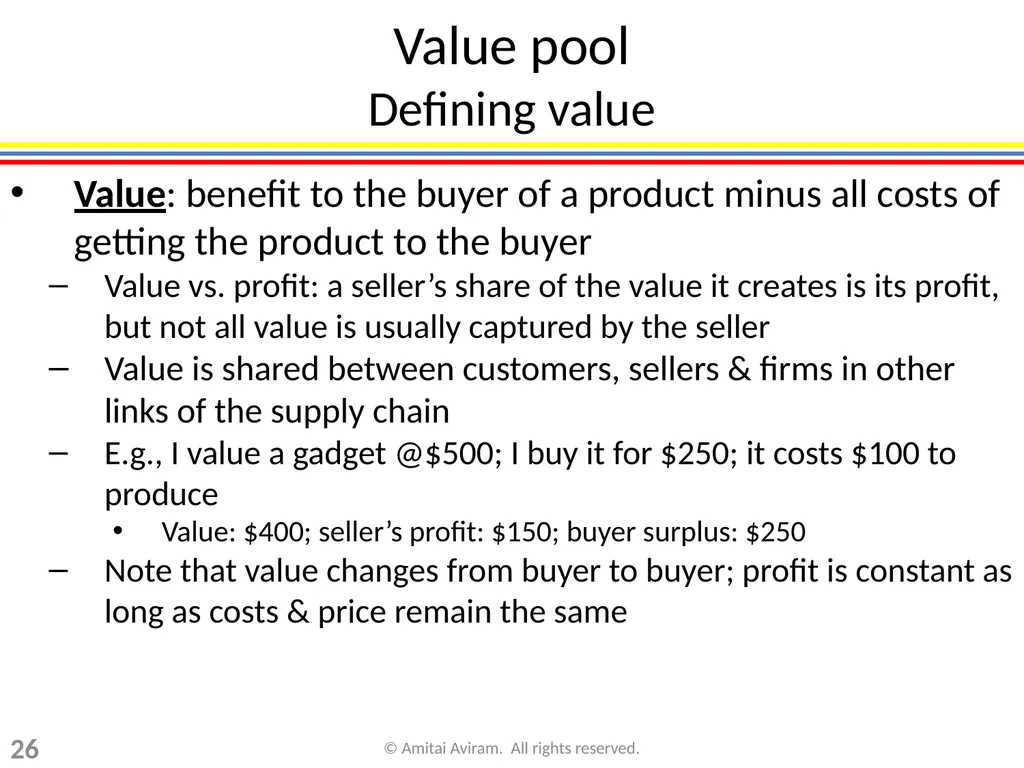
slide26. Value pool Defining value Value: benefit to the buyer of a product minus all costs of getting the product to the buyer
Value vs. profit: a seller’s share of the value it creates is its profit, but not all value is usually captured by the seller
Value is shared between customers, sellers & firms in other links of the supply chain
E.g., I value a gadget @$500; I buy it for $250; it costs $100 to produce
Value: $400; seller’s profit: $150; buyer surplus: $250
Note that value changes from buyer to buyer; profit is constant as long as costs & price remain the same 26 © Amitai Aviram. All rights reserved.<br>
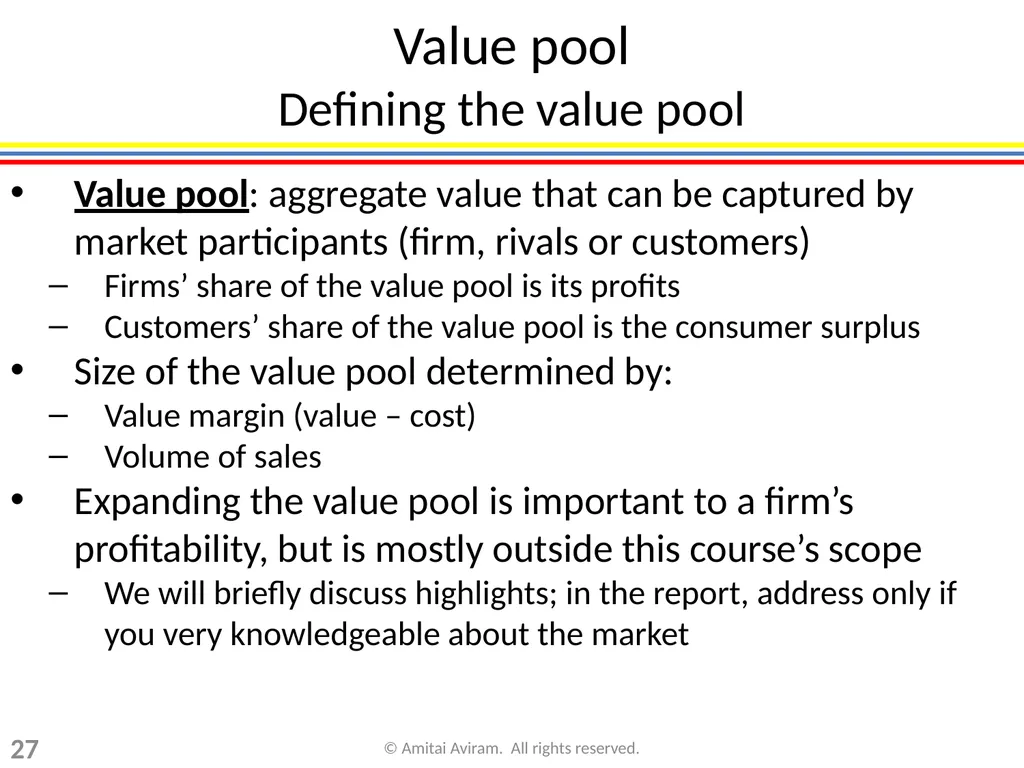
slide27. Value pool Defining the value pool Value pool: aggregate value that can be captured by market participants (firm, rivals or customers)
Firms’ share of the value pool is its profits
Customers’ share of the value pool is the consumer surplus
Size of the value pool determined by:
Value margin (value – cost)
Volume of sales
Expanding the value pool is important to a firm’s profitability, but is mostly outside this course’s scope
We will briefly discuss highlights; in the report, address only if you very knowledgeable about the market 27 © Amitai Aviram. All rights reserved.<br>
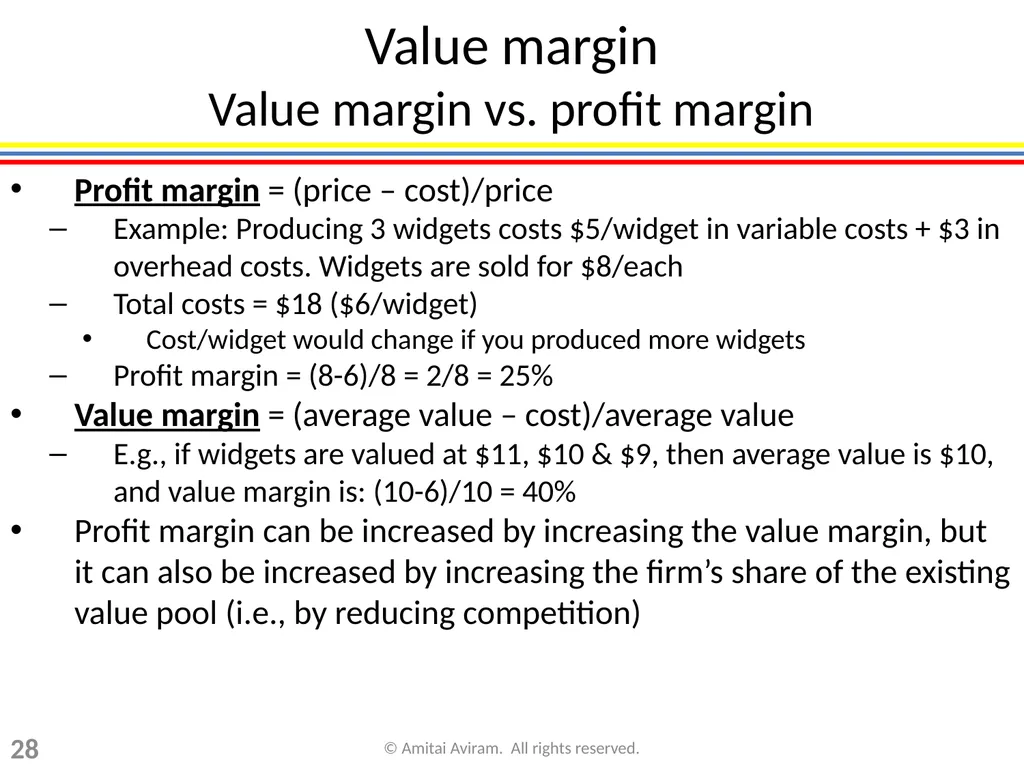
slide28. Value margin Value margin vs. profit margin Profit margin = (price – cost)/price
Example: Producing 3 widgets costs $5/widget in variable costs + $3 in overhead costs. Widgets are sold for $8/each
Total costs = $18 ($6/widget)
Cost/widget would change if you produced more widgets
Profit margin = (8-6)/8 = 2/8 = 25%
Value margin = (average value – cost)/average value
E.g., if widgets are valued at $11, $10 & $9, then average value is $10, and value margin is: (10-6)/10 = 40%
Profit margin can be increased by increasing the value margin, but it can also be increased by increasing the firm’s share of the existing value pool (i.e., by reducing competition) 28 © Amitai Aviram. All rights reserved.<br>
slide29. Value margin Increasing the value margin Adding value
Engineering: add features, improve product performance, etc.
Marketing: change customer perceptions of product’s value
Cutting cost
Operations management: exploit economies of scale & scope, improve efficiency of the production processes
Financial management: cashflow synergies, diversification, fin. engineering
Value margin is also affected by spillover effects from other markets in supply chain; e.g.,
Adding value: crude oil was originally refined into kerosene for lighting. Invention of the car added value (and volume) to crude oil, because it could be refined into gasoline
Cutting cost: technological changes in mining that lower cost of iron ore can increase value margin for producing steel 29 © Amitai Aviram. All rights reserved.<br>
slide30. Value margin Cashflow synergies Fast-growing businesses require large investments
Firm must first invest/take losses and only later recoup profits, so these businesses result in a negative cashflow
E.g., eBooks, smart phones, internet search engines
Why invest in a business with negative cashflow?
Other markets have low growth prospects, but generate a stable stream of income
E.g., many cable operators, newspapers, utility companies
Financial costs can be reduced by matching activity in cash-using markets & cash-generating markets
Why does this reduce financial costs? Can’t the firm borrow cash or issue shares to raise cash rather than generate it? 30 © Amitai Aviram. All rights reserved.<br>
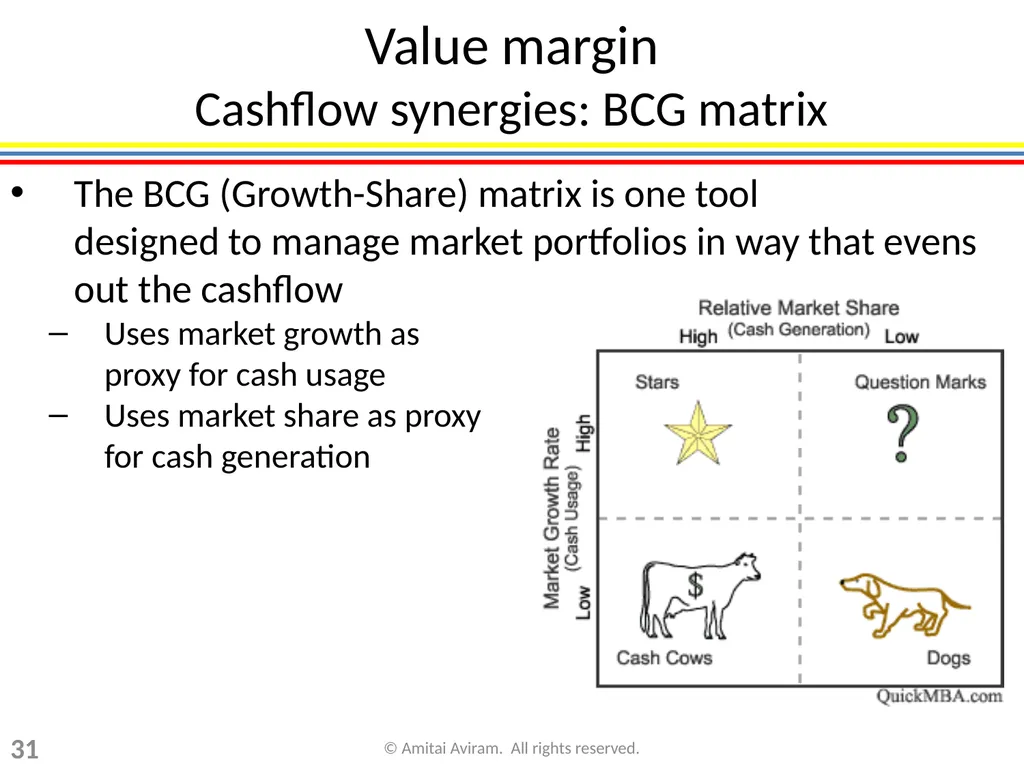
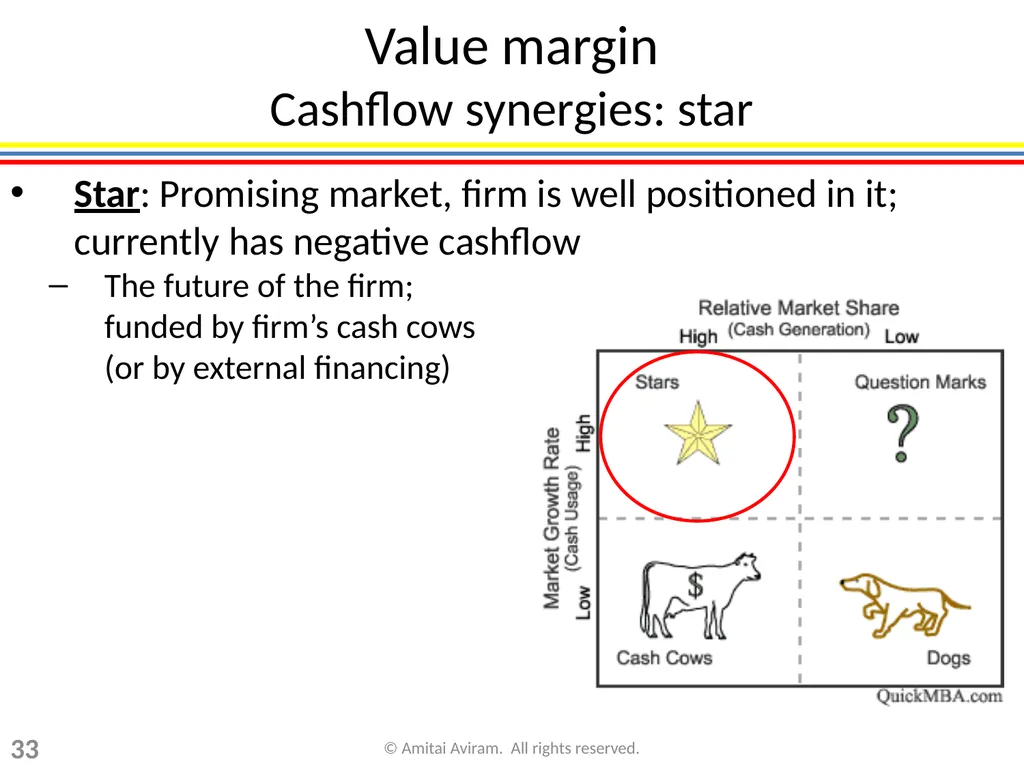
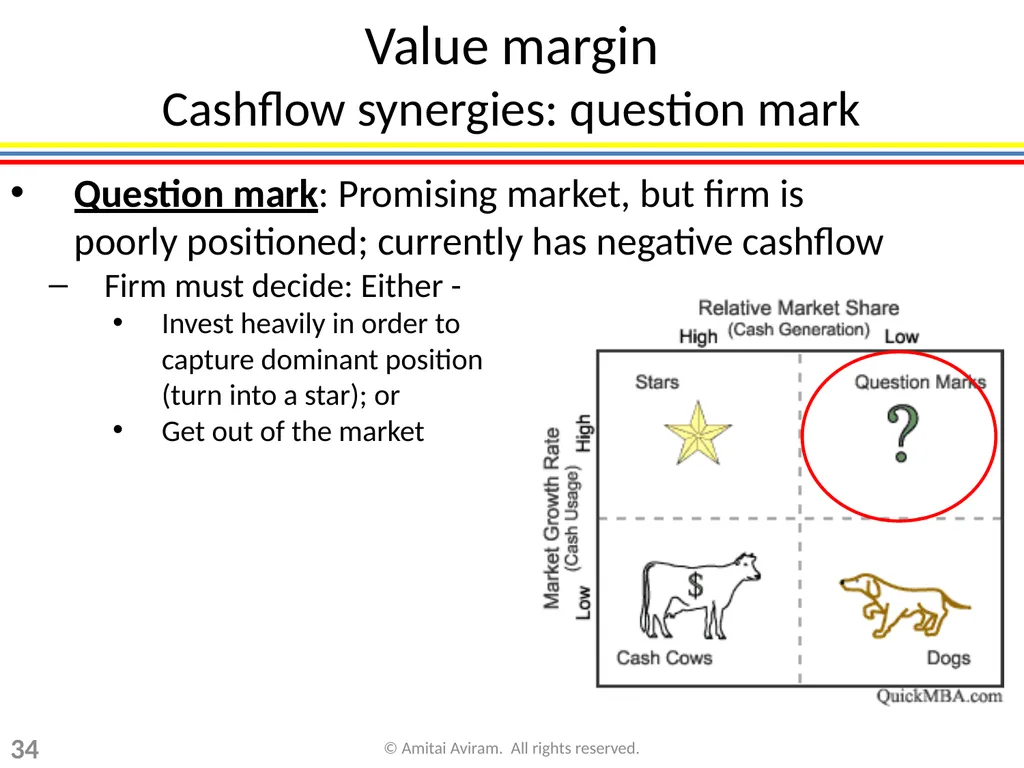
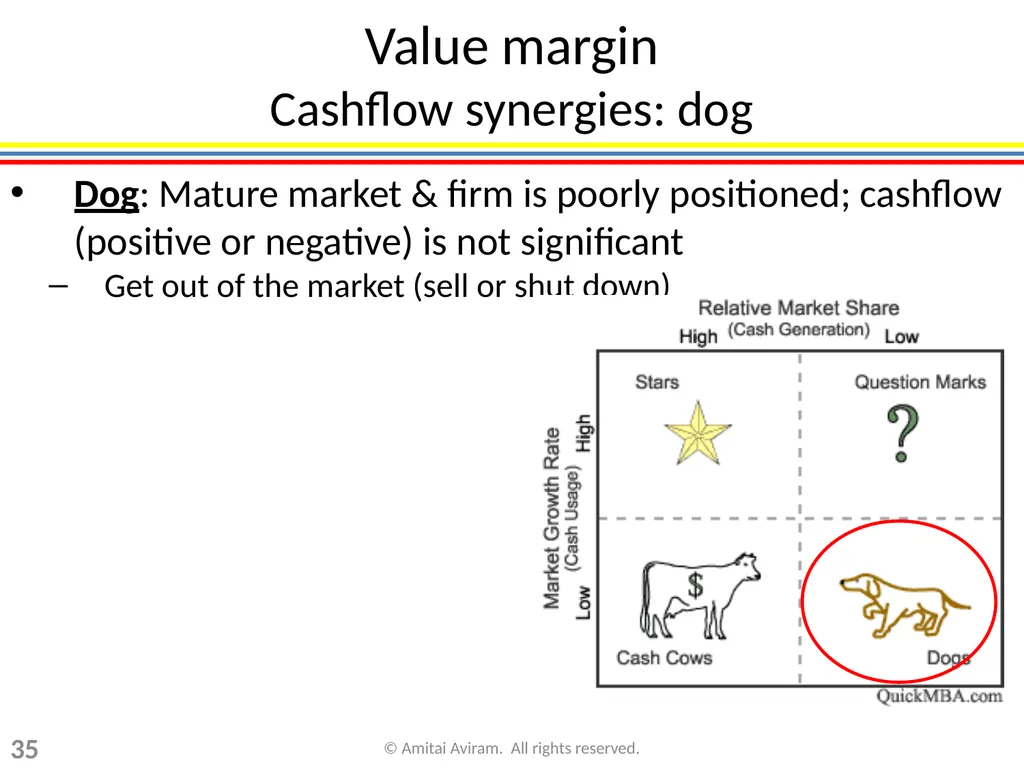
slide31. Value margin Cashflow synergies: BCG matrix The BCG (Growth-Share) matrix is one tool designed to manage market portfolios in way that evens out the cashflow
Uses market growth as proxy for cash usage
Uses market share as proxy for cash generation 31 © Amitai Aviram. All rights reserved.<br>
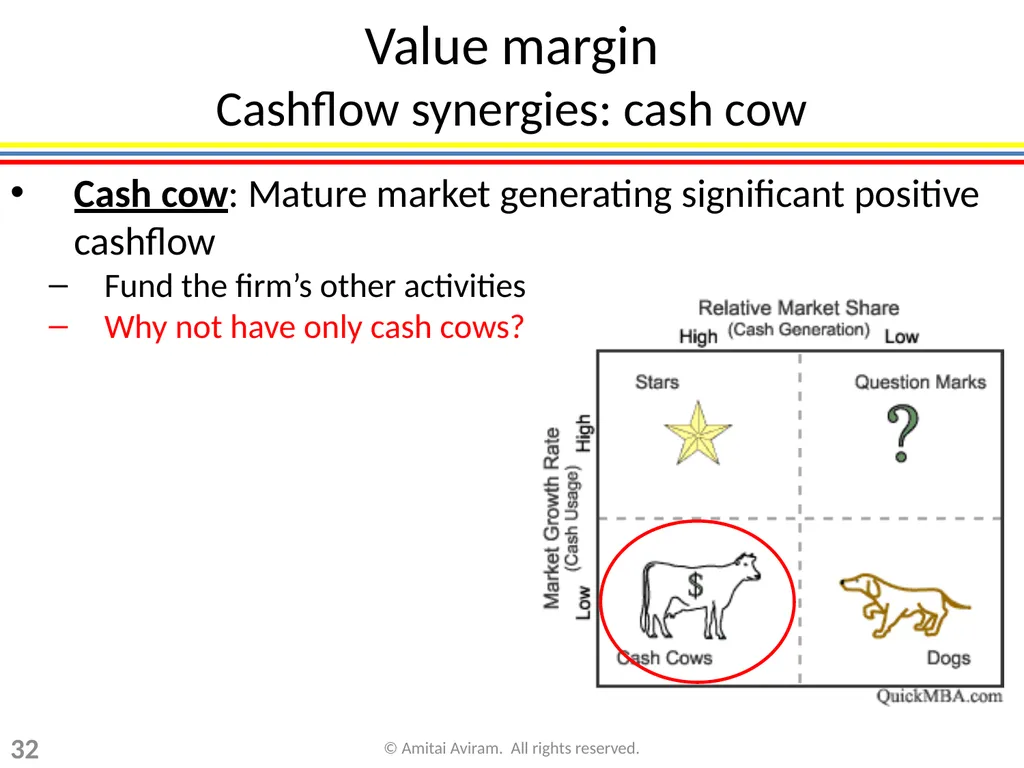
slide32. Value margin Cashflow synergies: cash cow Cash cow: Mature market generating significant positive cashflow
Fund the firm’s other activities
Why not have only cash cows? 32 © Amitai Aviram. All rights reserved.<br>
slide33. Value margin Cashflow synergies: star Star: Promising market, firm is well positioned in it; currently has negative cashflow
The future of the firm; funded by firm’s cash cows (or by external financing) 33 © Amitai Aviram. All rights reserved.<br>
slide34. Value margin Cashflow synergies: question mark Question mark: Promising market, but firm is poorly positioned; currently has negative cashflow
Firm must decide: Either -
Invest heavily in order to capture dominant position (turn into a star); or
Get out of the market 34 © Amitai Aviram. All rights reserved.<br>
slide35. Value margin Cashflow synergies: dog Dog: Mature market & firm is poorly positioned; cashflow (positive or negative) is not significant
Get out of the market (sell or shut down) 35 © Amitai Aviram. All rights reserved.<br>
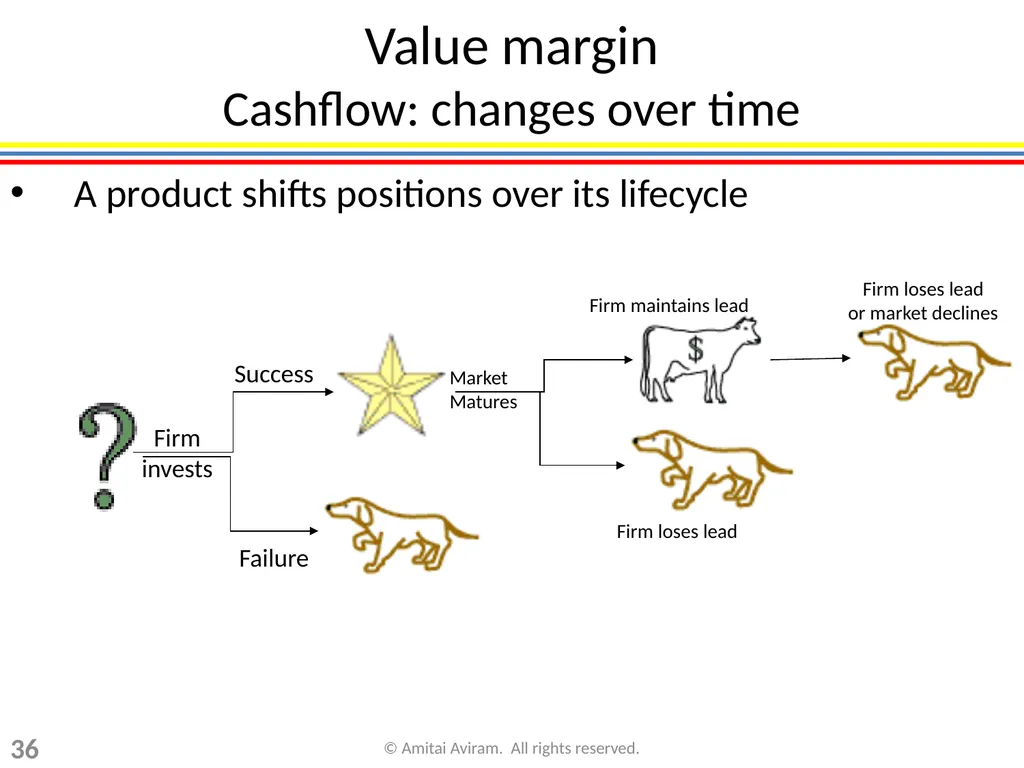
slide36. Value margin Cashflow: changes over time A product shifts positions over its lifecycle Firm invests Success Failure Market Matures Firm maintains lead Firm loses lead Firm loses lead or market declines 36 © Amitai Aviram. All rights reserved.<br>
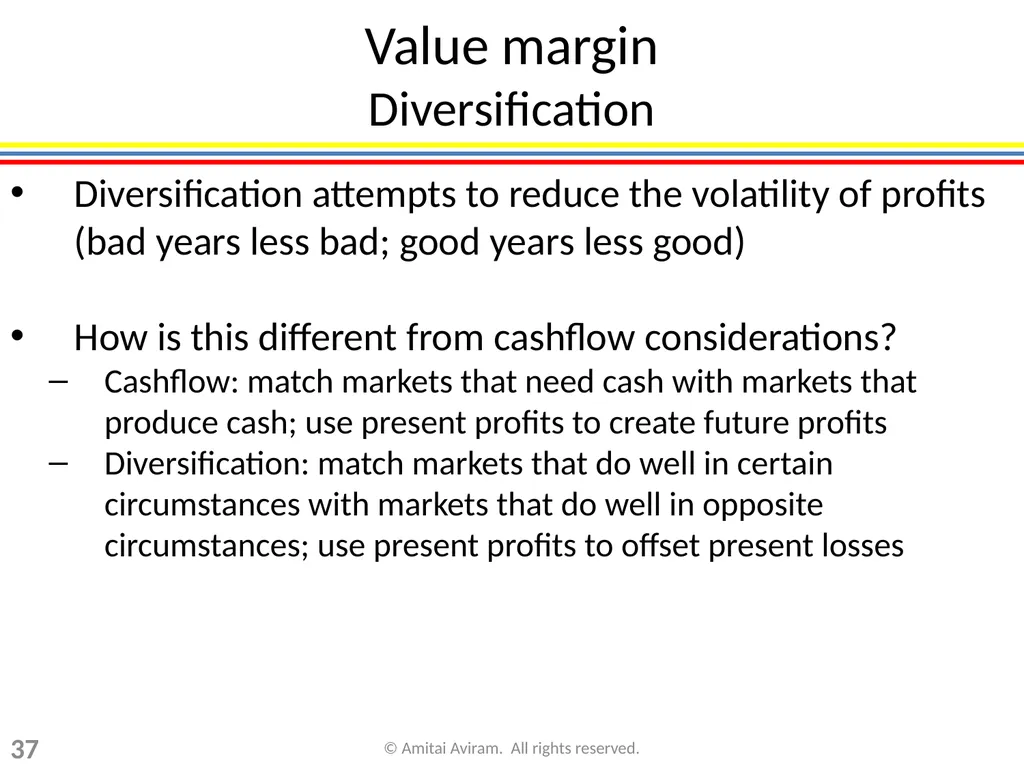
slide37. Value margin Diversification Diversification attempts to reduce the volatility of profits (bad years less bad; good years less good)
How is this different from cashflow considerations?
Cashflow: match markets that need cash with markets that produce cash; use present profits to create future profits
Diversification: match markets that do well in certain circumstances with markets that do well in opposite circumstances; use present profits to offset present losses 37 © Amitai Aviram. All rights reserved.<br>
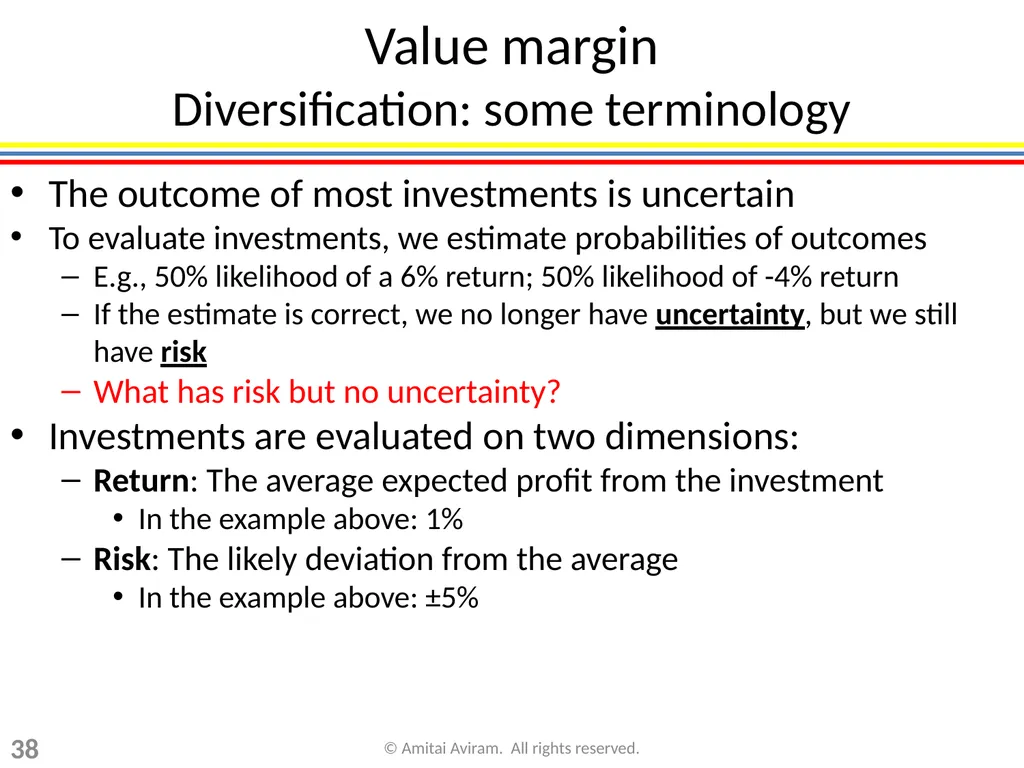
slide38. Value margin Diversification: some terminology The outcome of most investments is uncertain
To evaluate investments, we estimate probabilities of outcomes
E.g., 50% likelihood of a 6% return; 50% likelihood of -4% return
If the estimate is correct, we no longer have uncertainty, but we still have risk
What has risk but no uncertainty?
Investments are evaluated on two dimensions:
Return: The average expected profit from the investment
In the example above: 1%
Risk: The likely deviation from the average
In the example above: ±5% 38 © Amitai Aviram. All rights reserved.<br>
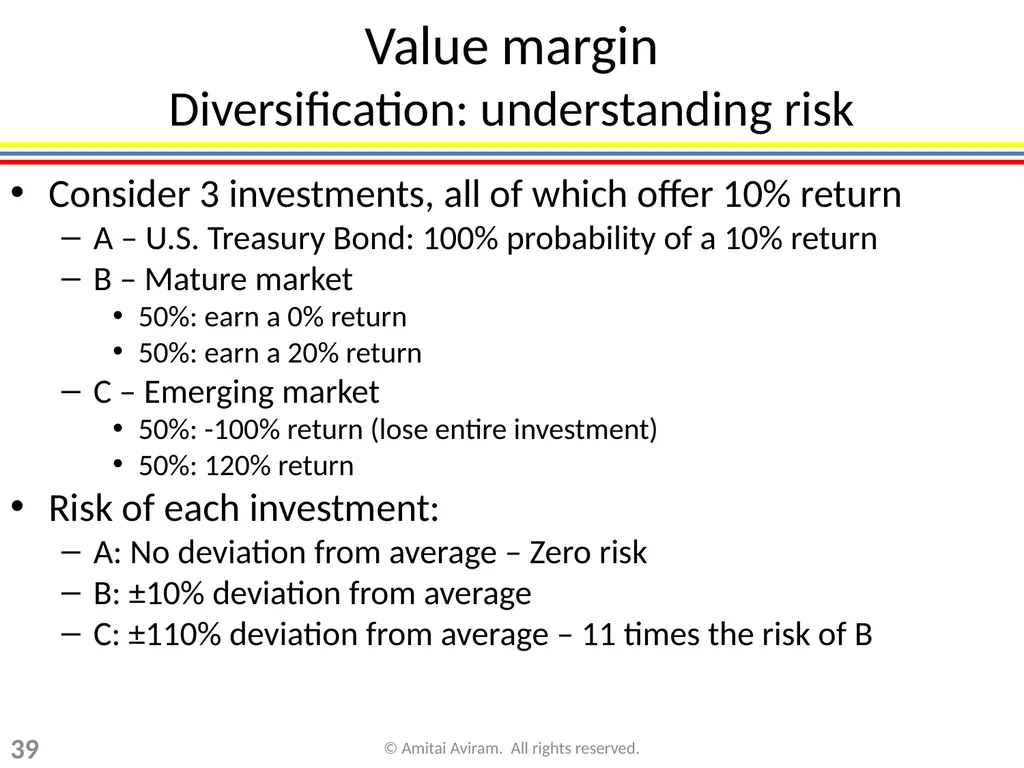
slide39. Value margin Diversification: understanding risk Consider 3 investments, all of which offer 10% return
A – U.S. Treasury Bond: 100% probability of a 10% return
B – Mature market
50%: earn a 0% return
50%: earn a 20% return
C – Emerging market
50%: -100% return (lose entire investment)
50%: 120% return
Risk of each investment:
A: No deviation from average – Zero risk
B: ±10% deviation from average
C: ±110% deviation from average – 11 times the risk of B 39 © Amitai Aviram. All rights reserved.<br>
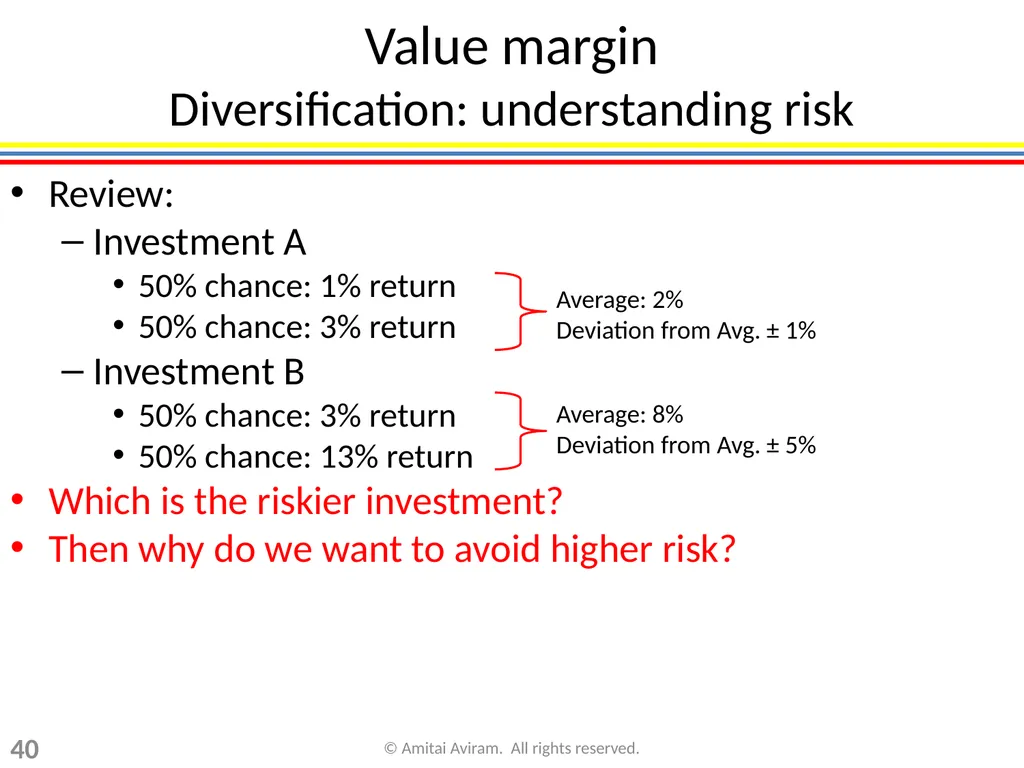
slide40. Value margin Diversification: understanding risk Review:
Investment A
50% chance: 1% return
50% chance: 3% return
Investment B
50% chance: 3% return
50% chance: 13% return
Which is the riskier investment?
Then why do we want to avoid higher risk? Average: 2%
Deviation from Avg. ± 1% Average: 8%
Deviation from Avg. ± 5% 40 © Amitai Aviram. All rights reserved.<br>
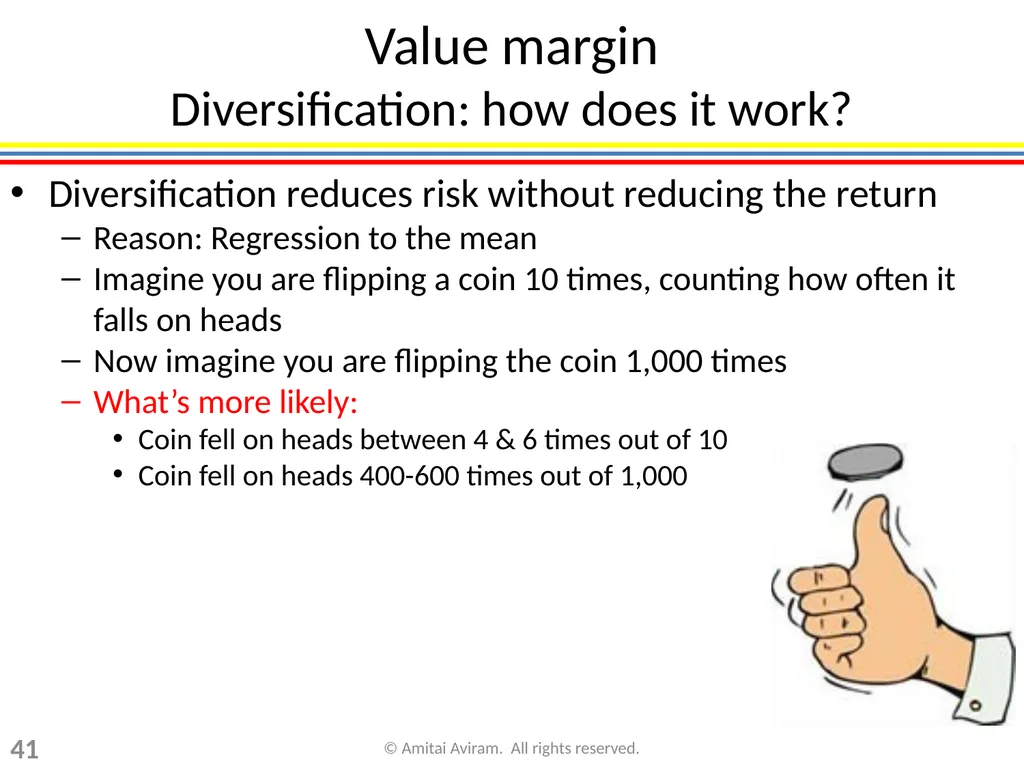
slide41. Value margin Diversification: how does it work? Diversification reduces risk without reducing the return
Reason: Regression to the mean
Imagine you are flipping a coin 10 times, counting how often it falls on heads
Now imagine you are flipping the coin 1,000 times
What’s more likely:
Coin fell on heads between 4 & 6 times out of 10
Coin fell on heads 400-600 times out of 1,000 41 © Amitai Aviram. All rights reserved.<br>
slide42. Value margin Diversification: how does it work? Jane owns 10 shares of Acme. Having just heard that she needs to diversify, she buys another 990 Acme shares. Did she reduce her risk? 42 © Amitai Aviram. All rights reserved.<br>
slide43. Value margin Diversification: correlation Additional “bets” diversify only to the extent that they are not correlated with the existing bets
Correlation: The observation that when there’s a change in A, there’s a change in B 43 © Amitai Aviram. All rights reserved.<br>
slide44. Value margin Diversification: full correlation Two Acme shares: whenever there’s a change in the price of one share, there’s an identical change in the other share – correlation between the shares is 1 (fully correlated)
Splitting your funds between these two investments does not diversify at all
Acme share & Ajax share: Ajax owns 30% of Acme’s shares, owns no other assets & has no other business – correlation is 1
Again, splitting funds between these two investments offers no diversification 44 © Amitai Aviram. All rights reserved.<br>
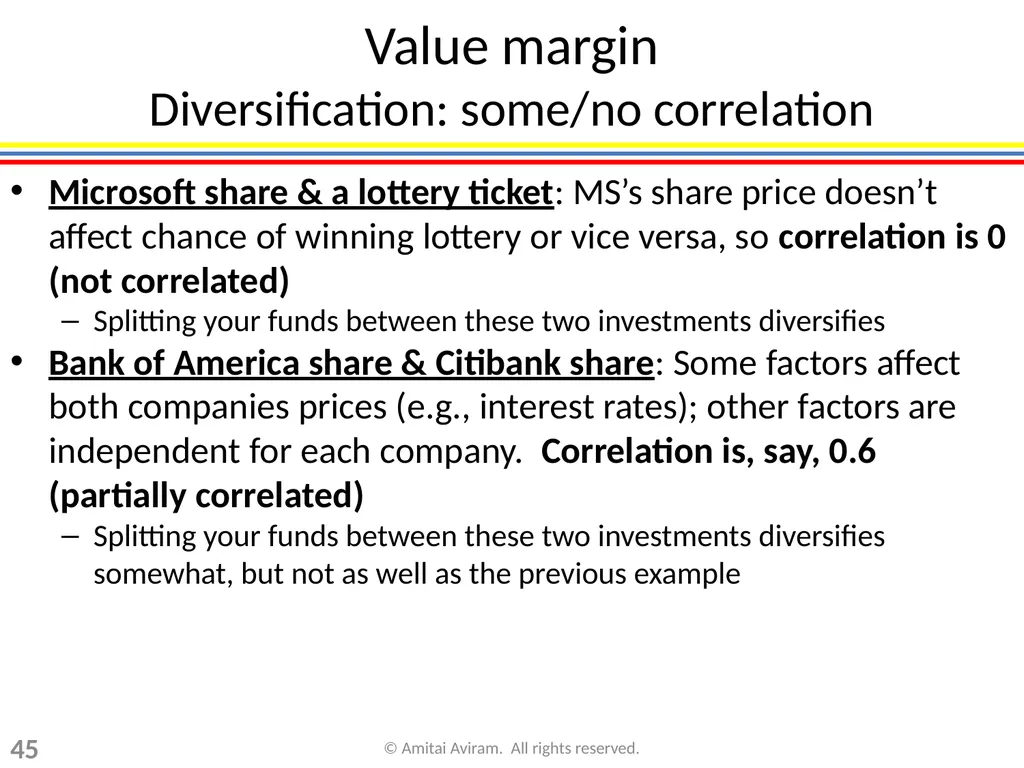
slide45. Value margin Diversification: some/no correlation Microsoft share & a lottery ticket: MS’s share price doesn’t affect chance of winning lottery or vice versa, so correlation is 0 (not correlated)
Splitting your funds between these two investments diversifies
Bank of America share & Citibank share: Some factors affect both companies prices (e.g., interest rates); other factors are independent for each company. Correlation is, say, 0.6 (partially correlated)
Splitting your funds between these two investments diversifies somewhat, but not as well as the previous example 45 © Amitai Aviram. All rights reserved.<br>
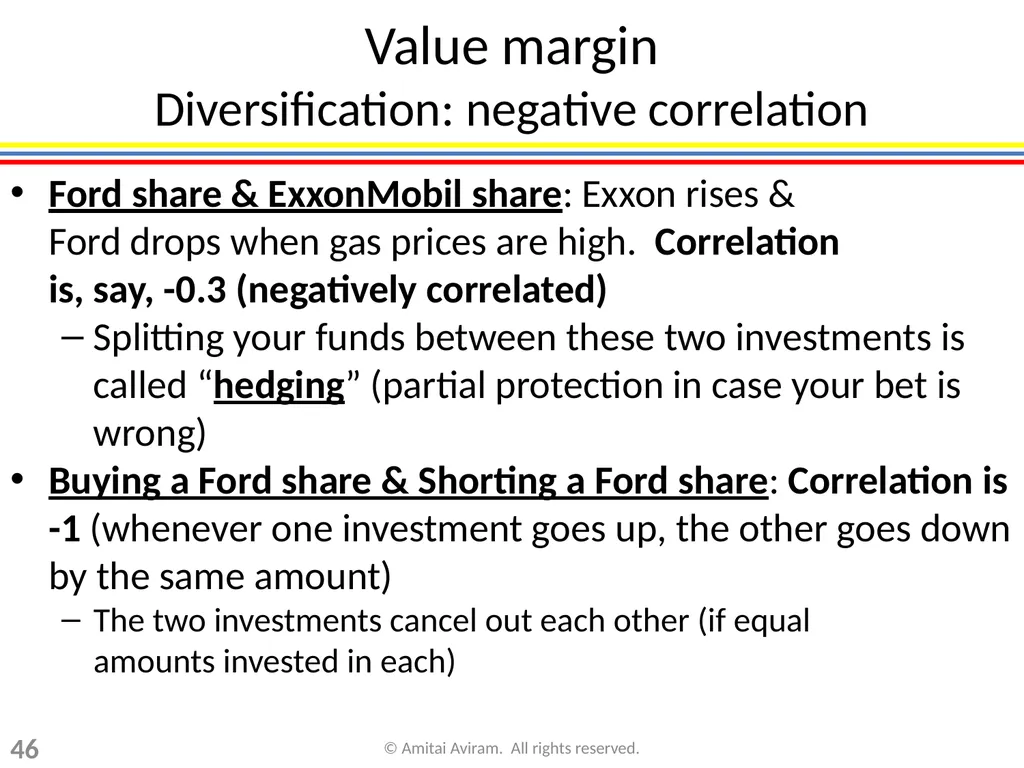
slide46. Value margin Diversification: negative correlation Ford share & ExxonMobil share: Exxon rises & Ford drops when gas prices are high. Correlation is, say, -0.3 (negatively correlated)
Splitting your funds between these two investments is called “hedging” (partial protection in case your bet is wrong)
Buying a Ford share & Shorting a Ford share: Correlation is -1 (whenever one investment goes up, the other goes down by the same amount)
The two investments cancel out each other (if equal amounts invested in each) 46 © Amitai Aviram. All rights reserved.<br>
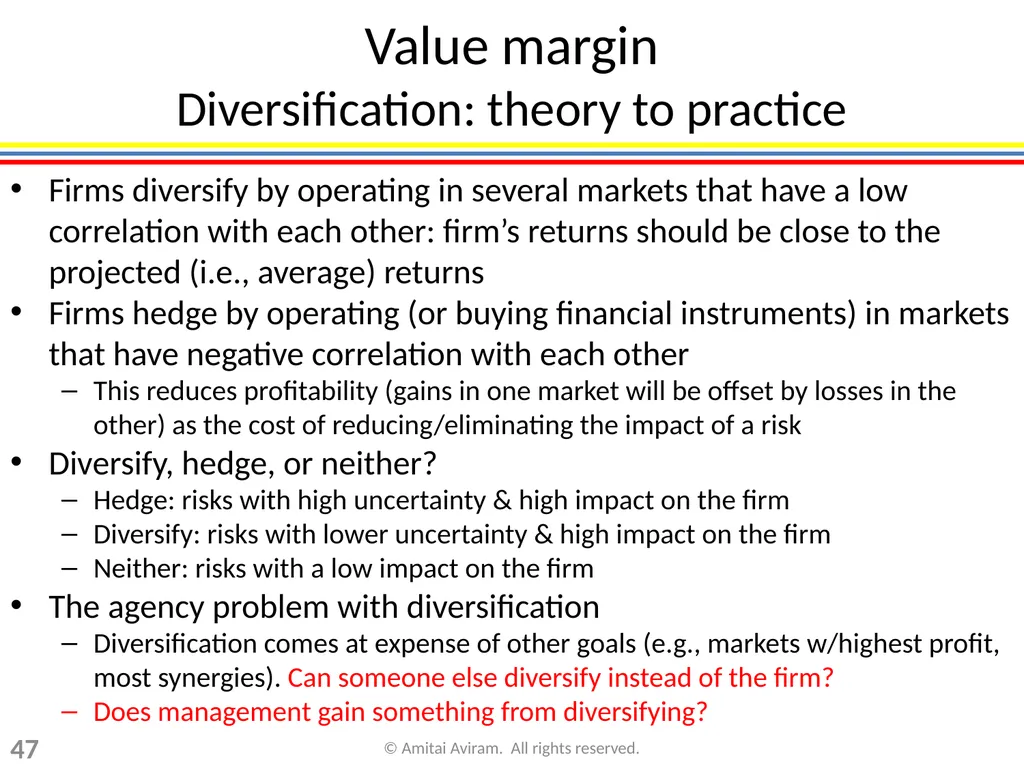
slide47. Value margin Diversification: theory to practice Firms diversify by operating in several markets that have a low correlation with each other: firm’s returns should be close to the projected (i.e., average) returns
Firms hedge by operating (or buying financial instruments) in markets that have negative correlation with each other
This reduces profitability (gains in one market will be offset by losses in the other) as the cost of reducing/eliminating the impact of a risk
Diversify, hedge, or neither?
Hedge: risks with high uncertainty & high impact on the firm
Diversify: risks with lower uncertainty & high impact on the firm
Neither: risks with a low impact on the firm
The agency problem with diversification
Diversification comes at expense of other goals (e.g., markets w/highest profit, most synergies). Can someone else diversify instead of the firm?
Does management gain something from diversifying? 47 © Amitai Aviram. All rights reserved.<br>
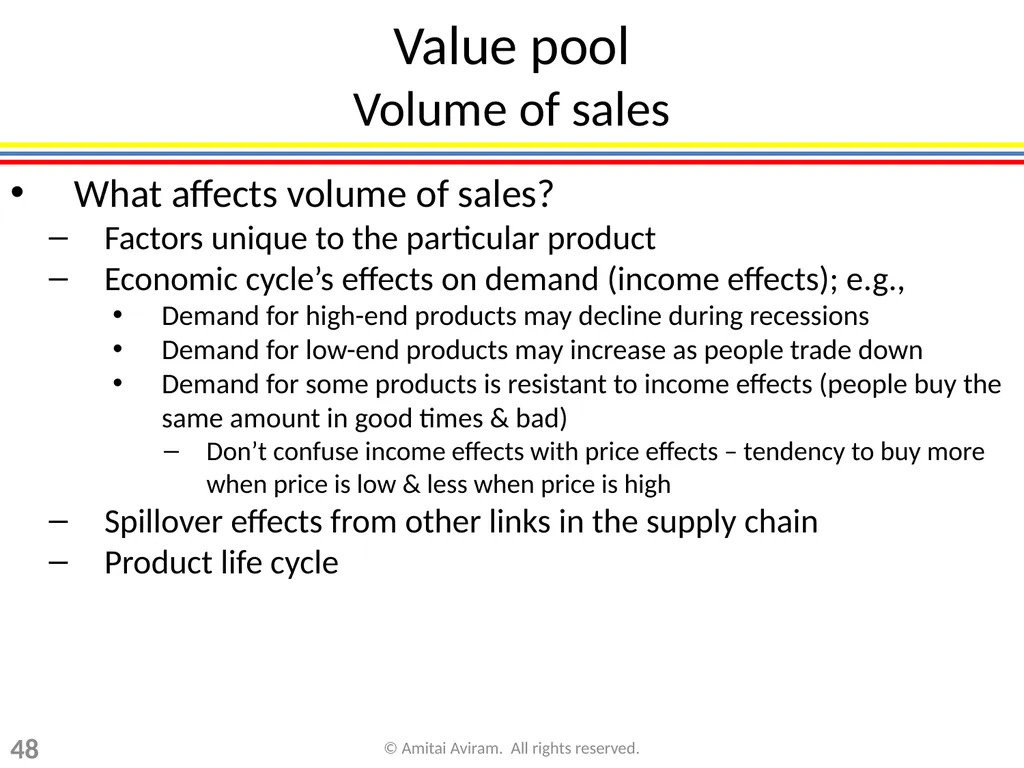
slide48. Value pool Volume of sales What affects volume of sales?
Factors unique to the particular product
Economic cycle’s effects on demand (income effects); e.g.,
Demand for high-end products may decline during recessions
Demand for low-end products may increase as people trade down
Demand for some products is resistant to income effects (people buy the same amount in good times & bad)
Don’t confuse income effects with price effects – tendency to buy more when price is low & less when price is high
Spillover effects from other links in the supply chain
Product life cycle 48 © Amitai Aviram. All rights reserved.<br>
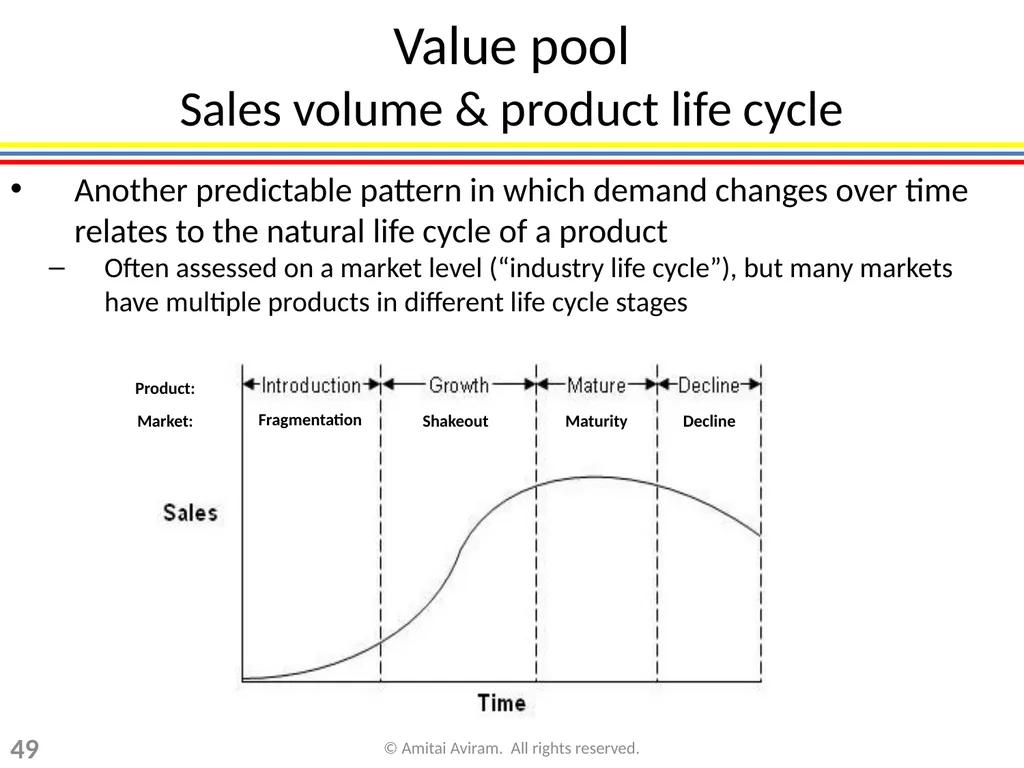
slide49. Value pool Sales volume & product life cycle Another predictable pattern in which demand changes over time relates to the natural life cycle of a product
Often assessed on a market level (“industry life cycle”), but many markets have multiple products in different life cycle stages Fragmentation Shakeout Maturity Decline Market: Product: 49 © Amitai Aviram. All rights reserved.<br>
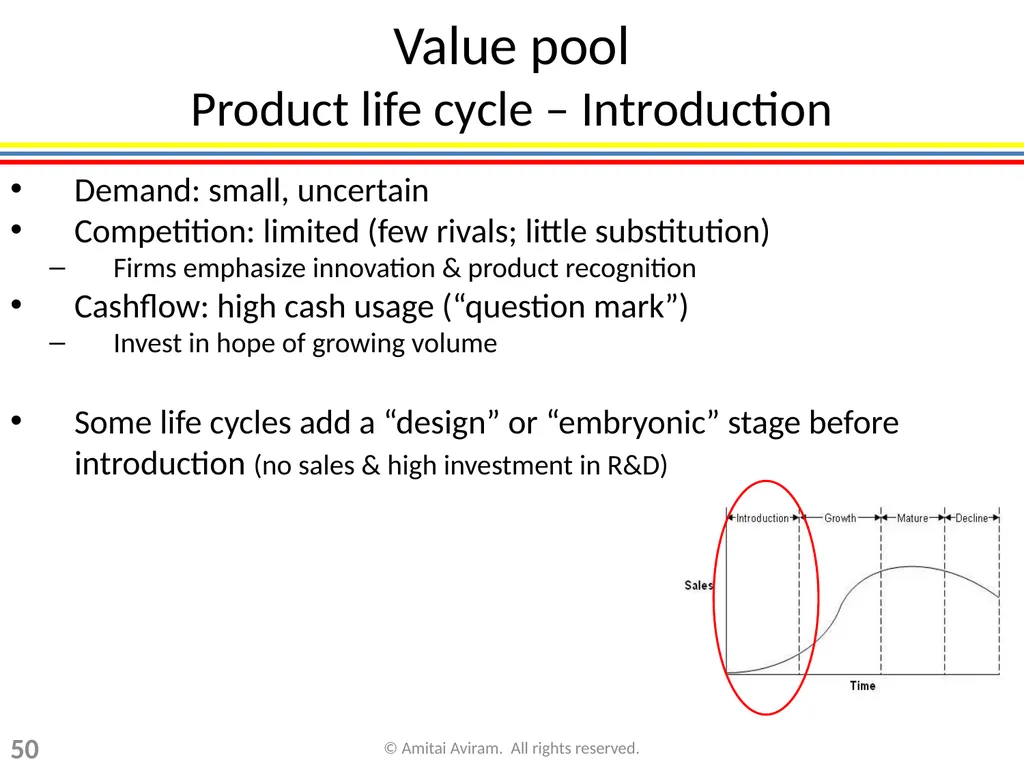
slide50. Value pool Product life cycle – Introduction Demand: small, uncertain
Competition: limited (few rivals; little substitution)
Firms emphasize innovation & product recognition
Cashflow: high cash usage (“question mark”)
Invest in hope of growing volume
Some life cycles add a “design” or “embryonic” stage before introduction (no sales & high investment in R&D) 50 © Amitai Aviram. All rights reserved.<br>
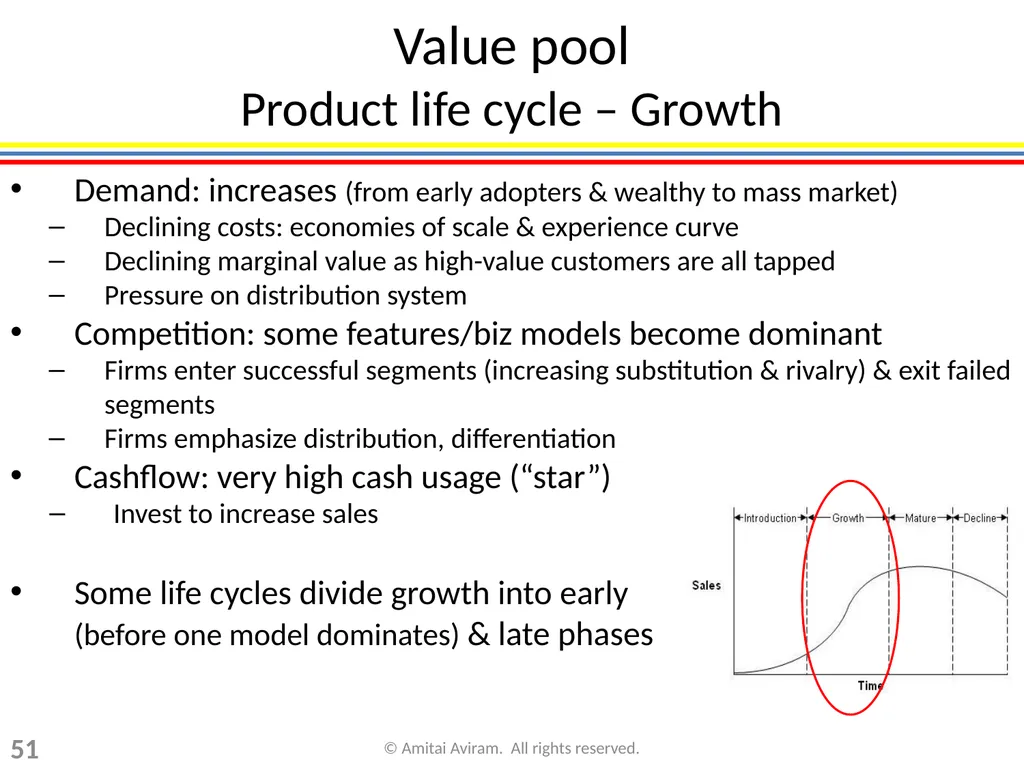
slide51. Value pool Product life cycle – Growth Demand: increases (from early adopters & wealthy to mass market)
Declining costs: economies of scale & experience curve
Declining marginal value as high-value customers are all tapped
Pressure on distribution system
Competition: some features/biz models become dominant
Firms enter successful segments (increasing substitution & rivalry) & exit failed segments
Firms emphasize distribution, differentiation
Cashflow: very high cash usage (“star”)
Invest to increase sales
Some life cycles divide growth into early (before one model dominates) & late phases 51 © Amitai Aviram. All rights reserved.<br>
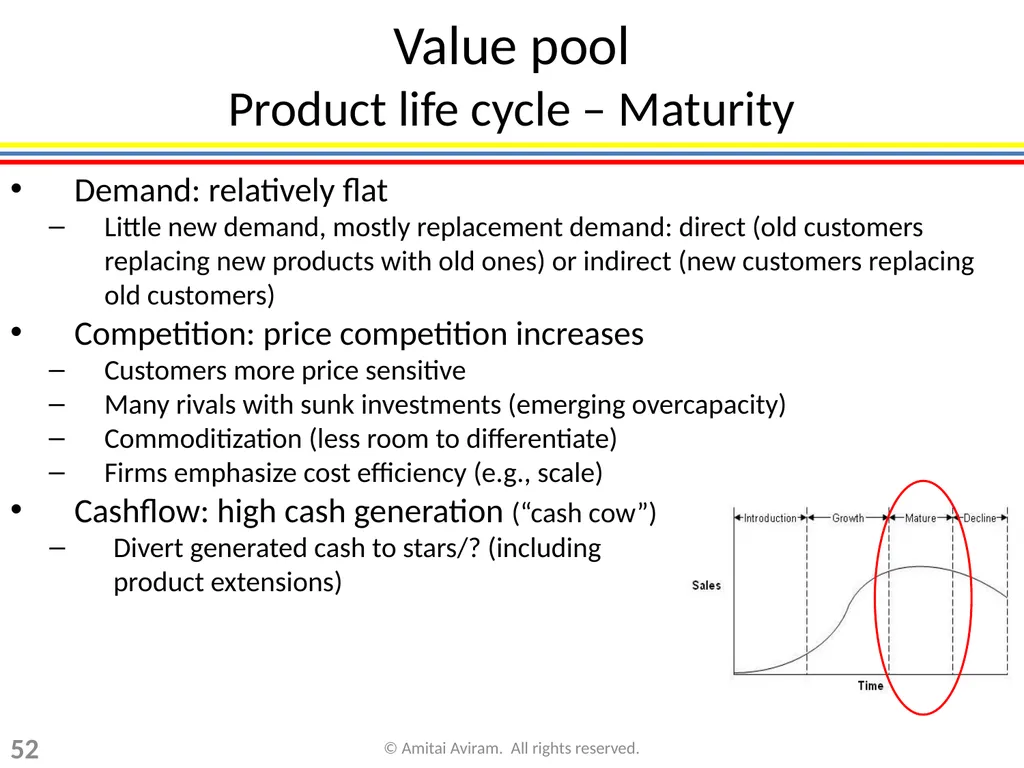
slide52. Value pool Product life cycle – Maturity Demand: relatively flat
Little new demand, mostly replacement demand: direct (old customers replacing new products with old ones) or indirect (new customers replacing old customers)
Competition: price competition increases
Customers more price sensitive
Many rivals with sunk investments (emerging overcapacity)
Commoditization (less room to differentiate)
Firms emphasize cost efficiency (e.g., scale)
Cashflow: high cash generation (“cash cow”)
Divert generated cash to stars/? (including product extensions) 52 © Amitai Aviram. All rights reserved.<br>
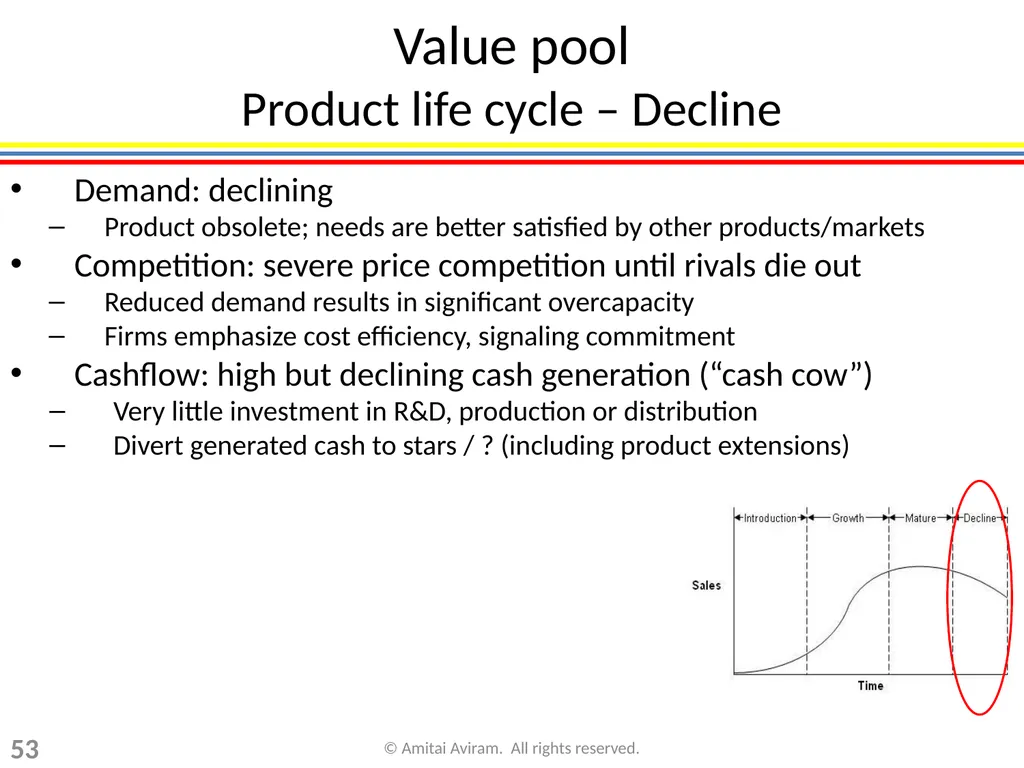
slide53. Value pool Product life cycle – Decline Demand: declining
Product obsolete; needs are better satisfied by other products/markets
Competition: severe price competition until rivals die out
Reduced demand results in significant overcapacity
Firms emphasize cost efficiency, signaling commitment
Cashflow: high but declining cash generation (“cash cow”)
Very little investment in R&D, production or distribution
Divert generated cash to stars / ? (including product extensions) 53 © Amitai Aviram. All rights reserved.<br>
Aviram@illinois.edu
University of Illinois College of Law
Copyright © Amitai Aviram. All Rights Reserved
S14D<br>
slide2. Framework Overview of Chapter 1 Introduction to BSL
What is business strategy?
Business intelligence
The value pool © Amitai Aviram. All rights reserved. 2<br>
slide3. Introduction to BSL What this course is/isn’t about No law (!!!)
Course is about how firms behave to maximize their profits
Some such behavior can violate the law (e.g., antitrust)
Course will give you a deeper understanding of how businesspeople think
Your clients
You (if you’re a partner/solo practitioner)
The businesses you oversee (if you’re a regulator)
But not a business school course either…
Business strategy for lawyers
This course does not prepare you to be CEOs
It prepares you to either be:
Regulators; or
Lawyers representing corporate clients before regulators 3 © Amitai Aviram. All rights reserved.<br>
slide4. Introduction to BSL What this course is/isn’t about What does that mean?
Consider both individual firm & market-wide impact
CEO focuses only on own firm, subject to legal constraints
Regulator interprets/enforces law, so “subject to legal constraints” would lead to circular thinking
Emphasis on present analysis, not future predictions
CEO sets firm’s course
Regulator makes decisions based on existing market conditions (& defend in court if challenged, so solid evidence is required) 4 © Amitai Aviram. All rights reserved.<br>
slide5. Introduction to BSL What this course is/isn’t about This is not a course about picking good stocks
Fundamental analysis of investments does require knowledge of business strategy, but it also requires assessing what is the firm’s value
But the analysis we use can help strategize your career
So what is the course about? (i.e. what is strategy?)
Creating/maintaining a fit between the strategic environment & firm’s strategic traits (applying strengths to opportunities), in order to best achieve the firm’s goals
More about this in the “What is strategy?” section (BSL 1c) 5 © Amitai Aviram. All rights reserved.<br>
slide6. Introduction to BSL The challenges of studying BSL Dealing with uncertainty
Law classes tend to assume a lot of certainty about the analytic process (e.g., a given test determines if X is liable)
But real life (including legal practice) is not nearly as certain – e.g., no rules & no analytical process that ensures business success
A good analytical process helps focus on the issues that are likely to be the more relevant to success & identify tradeoffs between those issues
Collecting information (business intelligence)
Law classes tend to provide you with the relevant information
But in real life, unless you have the power to subpoena information, you need to think of creative proxies for the information you actually need
In this course, creative ways to collect information are a big part of the grading of your market analysis & team activities 6 © Amitai Aviram. All rights reserved.<br>
slide7. Introduction to BSL Grading Market analysis report
Expected length: 10 pages or more
You pick the market you analyze
Students often pick either a market they are customers of, had worked in, or plan to work in (e.g., bankruptcy practice in northwest Illinois)
Grade adjustments
For:
Attendance & participation in class discussion
Participation in & quality of team activities
Up to 1 grade-point up, unlimited adjustment down
However, an upwards or downwards adjustment of more than ⅓ of a grade point (e.g., from B+ to A-) is rare 7 © Amitai Aviram. All rights reserved.<br>
slide8. Introduction to BSL Market analysis report Select your market ASAP, so you can think of each new class through the lens of your market
And figure out what information you’ll need to get
Key criteria: experience, interest & availability of information
Quality criteria
Analysis (thoughtful application of analytical tools studied in this course)
Business intelligence (creative ways of collecting information)
All sources of info must be clearly referenced
Doesn’t qualify for ULWR credit
Due on April 26 (Friday of the last full week of classes)
Submit the paper by e-mail, as MS-Word (.doc or .docx) file
Last class of the course (Monday, April 29) is cancelled; make-up will be announced 8 © Amitai Aviram. All rights reserved.<br>
slide9. Introduction to BSL Getting more information Slides, course outline & syllabus are posted and regularly updated on my website
http://www.law.illinois.edu/aviram/
Talking to me outside of class
Please e-mail prior to meeting with me
Suggest when you would like to meet (not limited to office hours)
Describe what you want to talk about
E-mail: aviram@illinois.edu
Room 326 9 © Amitai Aviram. All rights reserved.<br>
slide10. Introduction to BSL Defining commonly-used terms Product: a good or a service
Market: set of products that are close substitutes for each other
Firm: a business that is involved in creating, modifying or distributing products (regardless of its legal status)
Rivals (of a given firm): Other firms that participate in the same market(s) – i.e., other firms that sell products that are close substitutes to products of the given firm
Producers (re a given firm): firm + its rivals
Supplier (of a given firm): person selling raw materials to firm
Customer (of a given firm): person buying product from firm
Customer may consume product or use it as raw material in its business
Consumer: a customer who buys a product for personal use, rather than as raw material to produce & sell something 10 © Amitai Aviram. All rights reserved.<br>
slide11. Framework Overview of Chapter 1 Introduction to BSL
What is business strategy?
Business intelligence
The value pool © Amitai Aviram. All rights reserved. 11<br>
slide12. What is business strategy? Strategy & goals Strategy is a planning process designed to achieve the firm’s goal(s)
Since this is a business strategy course, I will assume that the firm’s goal is to maximize the firm’s sustainable profits
But similar tools apply to other goals (e.g., for non-profits, states, individuals)
That’s the goal of most business functions, not just strategy
Operations management
Research & development
Human resources
What distinguishes strategy from other business functions? 12 © Amitai Aviram. All rights reserved.<br>
slide13. What is business strategy? What distinguishes strategy? Strategy addresses two questions:
Which markets should the firm participate in to advance its goals?
I.e., which pies do you want to have slices in?
How can the firm create a sustainable competitive position in a market in which it participates?
I.e., how can your firm get a bigger slice in those pies? 13 © Amitai Aviram. All rights reserved.<br>
slide14. What is business strategy? Which markets? Abstract answer to the first question (which markets to participate in): markets with
A large or growing value pool (the total amount of value created by the business activities)
In a benign strategic environment
Strategic environment: the set of economic constraints that determines how much of the value of a business activity is captured by market participants (firm & rivals) rather than other actors (customers & suppliers) 14 © Amitai Aviram. All rights reserved.<br>
slide15. What is business strategy? How to gain a sustainable competitive position? Abstract answer to 2nd question (sustainable competitive position): creating/maintaining a position that’s valuable, unique & sustainable, because of a fit between strategic environment & firm’s strategic traits The strategic environment (Identifying threats & opportunities) Position (Valuable, unique & sustainable match between environment & traits) Strategic actions (Applying firm’s traits to improve the environment for firm) Firm’s strategic traits (firm-specific competences & rigidities) 15 © Amitai Aviram. All rights reserved.<br>
slide16. What is business strategy? Competitive position & SWOT analysis SWOT analysis (Strengths, Weaknesses, Opportunities, Threats) is a simple, all-purpose strategic tool
Concept: match strategic environment to firm’s strategic traits
Environment divided between good (opportunities) & bad (threats)
Firm’s traits divided between good (strengths) & bad (weaknesses)
But SWOT analysis is simplistic
Makes a sharp good vs. bad distinction, when in reality many factors are somewhere in the middle
More detailed tools are available to analyze both environment & firm
Environment: substitution, entry, rivalry, supply chain
Firm: strategic competences, strategic rigidities 16 © Amitai Aviram. All rights reserved.<br>
slide17. What is business strategy? Summary: what distinguishes strategy? The table above summarizes the questions strategy addresses and the tools it uses to address those questions
We study the value pool in Section 1d
Strategic environment: Chapter 2
Strategic traits: Section 3a
Strategic actions: the rest of Chapter 3 17 © Amitai Aviram. All rights reserved.<br>
slide18. Framework Overview of Chapter 1 Introduction to BSL
What is business strategy?
Business intelligence
The value pool © Amitai Aviram. All rights reserved. 18<br>
slide19. Business intelligence Developing a research plan A major element in the quality of your market analysis is your ability to acquire information for your analysis (the other major element is the analysis itself)
Doesn’t mean you should pick a market that has a lot of media exposure, or that’s publicly listed – you can get all the info you need from observation, interviewing, and other research methods
Process
Background reading of secondary sources (media, analyst reports, public SEC filings, etc.) to get a “feel” for the industry
Create a report outline (based on the outline we will discuss in Section 3e), fill in the info you have & note the info you lack
For each item of info you lack, determine what the ideal info would be, then think of proxies from available sources that can substitute for the ideal info
Analyze the reliability of info you collected (including direction of bias)
Depending on reliability & importance of the info to your analysis, determine if you need to collect more info on the issue 19 © Amitai Aviram. All rights reserved.<br>
slide20. Business intelligence Research methods Secondary research
Data that has already been collected by someone else: public filings that firms make to the Securities & Exchange Commission or other regulators, analyst reports, books, newspaper articles and interviews, blogs & websites
Advantage: somebody did the work for you
Disadvantages: info you need may not be available; info may not be reliable
(Primary) quantitative research
Acquire numerical data & analyzing it using statistical/accounting techniques
Acquire the data from secondary sources, via survey, experiment, or quantify data that is non-numerical (e.g., number of newspaper articles in which word X appears each year)
Advantage: gives precise results
Disadvantages: requires statistical or accounting knowledge, need high quality quantitative data, results depend on soundness of model’s assumptions
(Primary) qualitative research
Methods that analyze data that you collect without quantifying it 20 © Amitai Aviram. All rights reserved.<br>
slide21. Business intelligence Research methods Qualitative research techniques
Observation (physical or online)
Interviewing (face-to-face, e-mail, phone, etc.)
Surveys (multiple choice, quantitative, or open-ended): allow getting input from many people, but requires knowing exactly what you want to ask (no ability to follow up), and is time-consuming to process open-ended answers
Focus groups (discussion among multiple participants, moderated by the researcher): useful for brainstorming creative ideas or to discuss products that the individuals have little experience with, and for products which are consumed collectively or in which the benefit is connected to interacting with others 21 © Amitai Aviram. All rights reserved.<br>
slide22. Business intelligence Team project: business intelligence In the first team project we will gather business intelligence about one issue that comes up early in a market analysis – identifying the bases of competition
The first steps in your market analysis reports are:
Determining your starting point product
You must begin by defining a specific product as your starting point, because different products (even similar ones) may be impacted differently by market forces
If you are analyzing a merger/JV: each common product + synergy with not-common products
If you are analyzing a firm: each of its products
If you are analyzing a market: most typical product in the market
Finding the basis of competition
I.e., what makes the product good/better? 22 © Amitai Aviram. All rights reserved.<br>
slide23. Business intelligence Team project: business intelligence To find the bases of competition, start with customer needs that the product satisfies
Example: Product – J.D. degree; customer needs: getting a job @ big corporate law firm; getting promoted in current job; making professional contacts; sense of accomplishment; intellectual challenge
For each need, identify customer benchmarks
What do customers look at to see if product responds to their needs?
Example: Product – J.D. degree; Customer benchmarks: US news ranking; perhaps % of grads who have such jobs (but do customers actually get this data?); geographical location
Benchmark doesn’t have to correctly reflect need; just be perceived by potential customers as reflecting their needs 23 © Amitai Aviram. All rights reserved.<br>
slide24. Business intelligence Team project: business intelligence Working in a team, please research what are the bases of competition for a (U.S.) JD or LLM degree
Starting point product: Illinois JD or LLM degree
Figure out both customer needs & customer benchmarks
The methods you use to collect information are as important as your conclusions
Write your findings in an e-mail to me (1 e-mail per team) 24 © Amitai Aviram. All rights reserved.<br>
slide25. Framework Overview of Chapter 1 Introduction to BSL
What is business strategy?
Business intelligence
The value pool © Amitai Aviram. All rights reserved. 25<br>
slide26. Value pool Defining value Value: benefit to the buyer of a product minus all costs of getting the product to the buyer
Value vs. profit: a seller’s share of the value it creates is its profit, but not all value is usually captured by the seller
Value is shared between customers, sellers & firms in other links of the supply chain
E.g., I value a gadget @$500; I buy it for $250; it costs $100 to produce
Value: $400; seller’s profit: $150; buyer surplus: $250
Note that value changes from buyer to buyer; profit is constant as long as costs & price remain the same 26 © Amitai Aviram. All rights reserved.<br>
slide27. Value pool Defining the value pool Value pool: aggregate value that can be captured by market participants (firm, rivals or customers)
Firms’ share of the value pool is its profits
Customers’ share of the value pool is the consumer surplus
Size of the value pool determined by:
Value margin (value – cost)
Volume of sales
Expanding the value pool is important to a firm’s profitability, but is mostly outside this course’s scope
We will briefly discuss highlights; in the report, address only if you very knowledgeable about the market 27 © Amitai Aviram. All rights reserved.<br>
slide28. Value margin Value margin vs. profit margin Profit margin = (price – cost)/price
Example: Producing 3 widgets costs $5/widget in variable costs + $3 in overhead costs. Widgets are sold for $8/each
Total costs = $18 ($6/widget)
Cost/widget would change if you produced more widgets
Profit margin = (8-6)/8 = 2/8 = 25%
Value margin = (average value – cost)/average value
E.g., if widgets are valued at $11, $10 & $9, then average value is $10, and value margin is: (10-6)/10 = 40%
Profit margin can be increased by increasing the value margin, but it can also be increased by increasing the firm’s share of the existing value pool (i.e., by reducing competition) 28 © Amitai Aviram. All rights reserved.<br>
slide29. Value margin Increasing the value margin Adding value
Engineering: add features, improve product performance, etc.
Marketing: change customer perceptions of product’s value
Cutting cost
Operations management: exploit economies of scale & scope, improve efficiency of the production processes
Financial management: cashflow synergies, diversification, fin. engineering
Value margin is also affected by spillover effects from other markets in supply chain; e.g.,
Adding value: crude oil was originally refined into kerosene for lighting. Invention of the car added value (and volume) to crude oil, because it could be refined into gasoline
Cutting cost: technological changes in mining that lower cost of iron ore can increase value margin for producing steel 29 © Amitai Aviram. All rights reserved.<br>
slide30. Value margin Cashflow synergies Fast-growing businesses require large investments
Firm must first invest/take losses and only later recoup profits, so these businesses result in a negative cashflow
E.g., eBooks, smart phones, internet search engines
Why invest in a business with negative cashflow?
Other markets have low growth prospects, but generate a stable stream of income
E.g., many cable operators, newspapers, utility companies
Financial costs can be reduced by matching activity in cash-using markets & cash-generating markets
Why does this reduce financial costs? Can’t the firm borrow cash or issue shares to raise cash rather than generate it? 30 © Amitai Aviram. All rights reserved.<br>
slide31. Value margin Cashflow synergies: BCG matrix The BCG (Growth-Share) matrix is one tool designed to manage market portfolios in way that evens out the cashflow
Uses market growth as proxy for cash usage
Uses market share as proxy for cash generation 31 © Amitai Aviram. All rights reserved.<br>
slide32. Value margin Cashflow synergies: cash cow Cash cow: Mature market generating significant positive cashflow
Fund the firm’s other activities
Why not have only cash cows? 32 © Amitai Aviram. All rights reserved.<br>
slide33. Value margin Cashflow synergies: star Star: Promising market, firm is well positioned in it; currently has negative cashflow
The future of the firm; funded by firm’s cash cows (or by external financing) 33 © Amitai Aviram. All rights reserved.<br>
slide34. Value margin Cashflow synergies: question mark Question mark: Promising market, but firm is poorly positioned; currently has negative cashflow
Firm must decide: Either -
Invest heavily in order to capture dominant position (turn into a star); or
Get out of the market 34 © Amitai Aviram. All rights reserved.<br>
slide35. Value margin Cashflow synergies: dog Dog: Mature market & firm is poorly positioned; cashflow (positive or negative) is not significant
Get out of the market (sell or shut down) 35 © Amitai Aviram. All rights reserved.<br>
slide36. Value margin Cashflow: changes over time A product shifts positions over its lifecycle Firm invests Success Failure Market Matures Firm maintains lead Firm loses lead Firm loses lead or market declines 36 © Amitai Aviram. All rights reserved.<br>
slide37. Value margin Diversification Diversification attempts to reduce the volatility of profits (bad years less bad; good years less good)
How is this different from cashflow considerations?
Cashflow: match markets that need cash with markets that produce cash; use present profits to create future profits
Diversification: match markets that do well in certain circumstances with markets that do well in opposite circumstances; use present profits to offset present losses 37 © Amitai Aviram. All rights reserved.<br>
slide38. Value margin Diversification: some terminology The outcome of most investments is uncertain
To evaluate investments, we estimate probabilities of outcomes
E.g., 50% likelihood of a 6% return; 50% likelihood of -4% return
If the estimate is correct, we no longer have uncertainty, but we still have risk
What has risk but no uncertainty?
Investments are evaluated on two dimensions:
Return: The average expected profit from the investment
In the example above: 1%
Risk: The likely deviation from the average
In the example above: ±5% 38 © Amitai Aviram. All rights reserved.<br>
slide39. Value margin Diversification: understanding risk Consider 3 investments, all of which offer 10% return
A – U.S. Treasury Bond: 100% probability of a 10% return
B – Mature market
50%: earn a 0% return
50%: earn a 20% return
C – Emerging market
50%: -100% return (lose entire investment)
50%: 120% return
Risk of each investment:
A: No deviation from average – Zero risk
B: ±10% deviation from average
C: ±110% deviation from average – 11 times the risk of B 39 © Amitai Aviram. All rights reserved.<br>
slide40. Value margin Diversification: understanding risk Review:
Investment A
50% chance: 1% return
50% chance: 3% return
Investment B
50% chance: 3% return
50% chance: 13% return
Which is the riskier investment?
Then why do we want to avoid higher risk? Average: 2%
Deviation from Avg. ± 1% Average: 8%
Deviation from Avg. ± 5% 40 © Amitai Aviram. All rights reserved.<br>
slide41. Value margin Diversification: how does it work? Diversification reduces risk without reducing the return
Reason: Regression to the mean
Imagine you are flipping a coin 10 times, counting how often it falls on heads
Now imagine you are flipping the coin 1,000 times
What’s more likely:
Coin fell on heads between 4 & 6 times out of 10
Coin fell on heads 400-600 times out of 1,000 41 © Amitai Aviram. All rights reserved.<br>
slide42. Value margin Diversification: how does it work? Jane owns 10 shares of Acme. Having just heard that she needs to diversify, she buys another 990 Acme shares. Did she reduce her risk? 42 © Amitai Aviram. All rights reserved.<br>
slide43. Value margin Diversification: correlation Additional “bets” diversify only to the extent that they are not correlated with the existing bets
Correlation: The observation that when there’s a change in A, there’s a change in B 43 © Amitai Aviram. All rights reserved.<br>
slide44. Value margin Diversification: full correlation Two Acme shares: whenever there’s a change in the price of one share, there’s an identical change in the other share – correlation between the shares is 1 (fully correlated)
Splitting your funds between these two investments does not diversify at all
Acme share & Ajax share: Ajax owns 30% of Acme’s shares, owns no other assets & has no other business – correlation is 1
Again, splitting funds between these two investments offers no diversification 44 © Amitai Aviram. All rights reserved.<br>
slide45. Value margin Diversification: some/no correlation Microsoft share & a lottery ticket: MS’s share price doesn’t affect chance of winning lottery or vice versa, so correlation is 0 (not correlated)
Splitting your funds between these two investments diversifies
Bank of America share & Citibank share: Some factors affect both companies prices (e.g., interest rates); other factors are independent for each company. Correlation is, say, 0.6 (partially correlated)
Splitting your funds between these two investments diversifies somewhat, but not as well as the previous example 45 © Amitai Aviram. All rights reserved.<br>
slide46. Value margin Diversification: negative correlation Ford share & ExxonMobil share: Exxon rises & Ford drops when gas prices are high. Correlation is, say, -0.3 (negatively correlated)
Splitting your funds between these two investments is called “hedging” (partial protection in case your bet is wrong)
Buying a Ford share & Shorting a Ford share: Correlation is -1 (whenever one investment goes up, the other goes down by the same amount)
The two investments cancel out each other (if equal amounts invested in each) 46 © Amitai Aviram. All rights reserved.<br>
slide47. Value margin Diversification: theory to practice Firms diversify by operating in several markets that have a low correlation with each other: firm’s returns should be close to the projected (i.e., average) returns
Firms hedge by operating (or buying financial instruments) in markets that have negative correlation with each other
This reduces profitability (gains in one market will be offset by losses in the other) as the cost of reducing/eliminating the impact of a risk
Diversify, hedge, or neither?
Hedge: risks with high uncertainty & high impact on the firm
Diversify: risks with lower uncertainty & high impact on the firm
Neither: risks with a low impact on the firm
The agency problem with diversification
Diversification comes at expense of other goals (e.g., markets w/highest profit, most synergies). Can someone else diversify instead of the firm?
Does management gain something from diversifying? 47 © Amitai Aviram. All rights reserved.<br>
slide48. Value pool Volume of sales What affects volume of sales?
Factors unique to the particular product
Economic cycle’s effects on demand (income effects); e.g.,
Demand for high-end products may decline during recessions
Demand for low-end products may increase as people trade down
Demand for some products is resistant to income effects (people buy the same amount in good times & bad)
Don’t confuse income effects with price effects – tendency to buy more when price is low & less when price is high
Spillover effects from other links in the supply chain
Product life cycle 48 © Amitai Aviram. All rights reserved.<br>
slide49. Value pool Sales volume & product life cycle Another predictable pattern in which demand changes over time relates to the natural life cycle of a product
Often assessed on a market level (“industry life cycle”), but many markets have multiple products in different life cycle stages Fragmentation Shakeout Maturity Decline Market: Product: 49 © Amitai Aviram. All rights reserved.<br>
slide50. Value pool Product life cycle – Introduction Demand: small, uncertain
Competition: limited (few rivals; little substitution)
Firms emphasize innovation & product recognition
Cashflow: high cash usage (“question mark”)
Invest in hope of growing volume
Some life cycles add a “design” or “embryonic” stage before introduction (no sales & high investment in R&D) 50 © Amitai Aviram. All rights reserved.<br>
slide51. Value pool Product life cycle – Growth Demand: increases (from early adopters & wealthy to mass market)
Declining costs: economies of scale & experience curve
Declining marginal value as high-value customers are all tapped
Pressure on distribution system
Competition: some features/biz models become dominant
Firms enter successful segments (increasing substitution & rivalry) & exit failed segments
Firms emphasize distribution, differentiation
Cashflow: very high cash usage (“star”)
Invest to increase sales
Some life cycles divide growth into early (before one model dominates) & late phases 51 © Amitai Aviram. All rights reserved.<br>
slide52. Value pool Product life cycle – Maturity Demand: relatively flat
Little new demand, mostly replacement demand: direct (old customers replacing new products with old ones) or indirect (new customers replacing old customers)
Competition: price competition increases
Customers more price sensitive
Many rivals with sunk investments (emerging overcapacity)
Commoditization (less room to differentiate)
Firms emphasize cost efficiency (e.g., scale)
Cashflow: high cash generation (“cash cow”)
Divert generated cash to stars/? (including product extensions) 52 © Amitai Aviram. All rights reserved.<br>
slide53. Value pool Product life cycle – Decline Demand: declining
Product obsolete; needs are better satisfied by other products/markets
Competition: severe price competition until rivals die out
Reduced demand results in significant overcapacity
Firms emphasize cost efficiency, signaling commitment
Cashflow: high but declining cash generation (“cash cow”)
Very little investment in R&D, production or distribution
Divert generated cash to stars / ? (including product extensions) 53 © Amitai Aviram. All rights reserved.<br>