
Calculating percentage changes (from 3.1
MS
Published · 40 slides · 0 views
1 / 1
Description
Calculating percentage changes (from 3.1 Multiplicative reasoning) KS3 Mastery PD Materials: Exemplified Key Ideas Materials for use in the classroom or to support professional development discussions Summer 2021 About this resource These
Related Topics
Share
Embed code
Download this presentation From Below
"Calculating percentage changes (from 3.1" is the property of its rightful owner. Permission is granted to download and print the materials on this website for personal, non-commercial use only, and to display it on your personal computer provided you do not modify the materials and that you retain all copyright notices contained in the materials. By downloading content from our website, you accept the terms of this agreement.
Presentation Transcript
01
Calculating percentage changes (from 3.1 Multiplicative reasoning) KS3 Mastery PD Materials: Exemplified Key Ideas
Materials for use in the classroom or to support professional development discussions Summer 2021<br>
Materials for use in the classroom or to support professional development discussions Summer 2021<br>
02
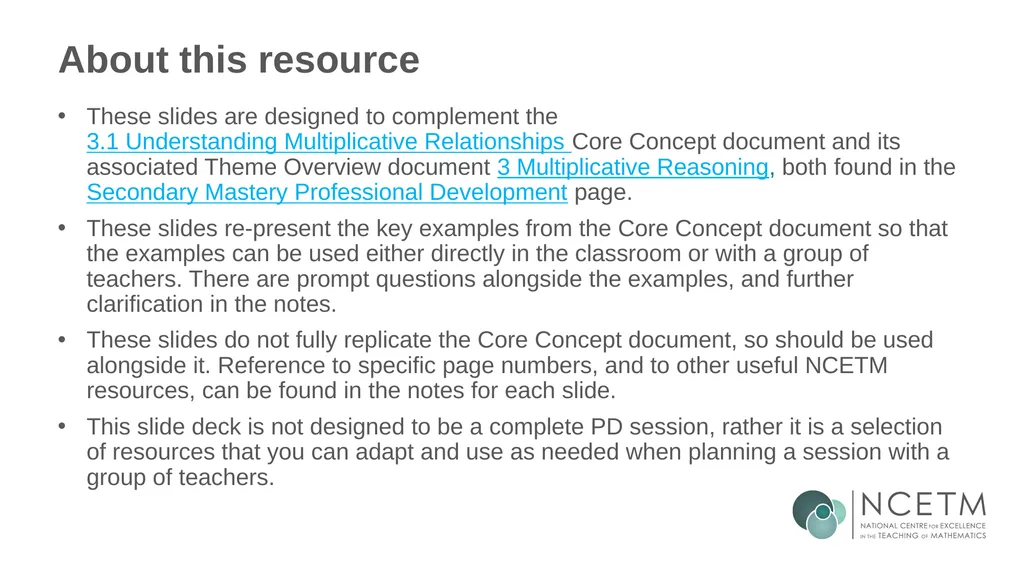
About this resource These slides are designed to complement the 3.1 Understanding Multiplicative Relationships Core Concept document and its associated Theme Overview document 3 Multiplicative Reasoning, both found in the Secondary Mastery Professional Development page.
These slides re-present the key examples from the Core Concept document so that the examples can be used either directly in the classroom or with a group of teachers. There are prompt questions alongside the examples, and further clarification in the notes.
These slides do not fully replicate the Core Concept document, so should be used alongside it. Reference to specific page numbers, and to other useful NCETM resources, can be found in the notes for each slide.
This slide deck is not designed to be a complete PD session, rather it is a selection of resources that you can adapt and use as needed when planning a session with a group of teachers.<br>
These slides re-present the key examples from the Core Concept document so that the examples can be used either directly in the classroom or with a group of teachers. There are prompt questions alongside the examples, and further clarification in the notes.
These slides do not fully replicate the Core Concept document, so should be used alongside it. Reference to specific page numbers, and to other useful NCETM resources, can be found in the notes for each slide.
This slide deck is not designed to be a complete PD session, rather it is a selection of resources that you can adapt and use as needed when planning a session with a group of teachers.<br>
03
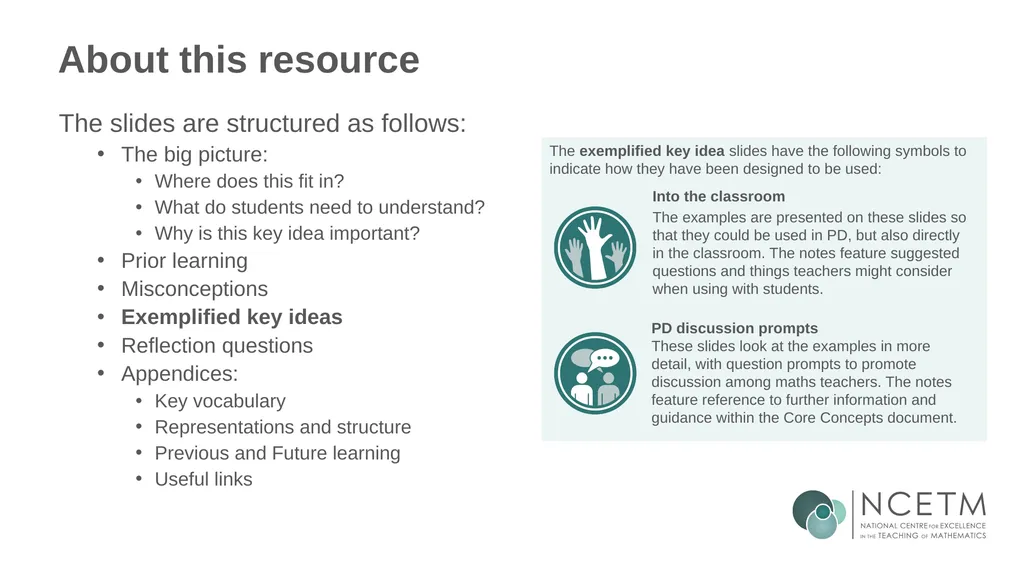
About this resource The slides are structured as follows:
The big picture:
Where does this fit in?
What do students need to understand?
Why is this key idea important?
Prior learning
Misconceptions
Exemplified key ideas
Reflection questions
Appendices:
Key vocabulary
Representations and structure
Previous and Future learning
Useful links The exemplified key idea slides have the following symbols to indicate how they have been designed to be used: Into the classroom
The examples are presented on these slides so that they could be used in PD, but also directly in the classroom. The notes feature suggested questions and things teachers might consider when using with students. PD discussion prompts
These slides look at the examples in more detail, with question prompts to promote discussion among maths teachers. The notes feature reference to further information and guidance within the Core Concepts document.<br>
The big picture:
Where does this fit in?
What do students need to understand?
Why is this key idea important?
Prior learning
Misconceptions
Exemplified key ideas
Reflection questions
Appendices:
Key vocabulary
Representations and structure
Previous and Future learning
Useful links The exemplified key idea slides have the following symbols to indicate how they have been designed to be used: Into the classroom
The examples are presented on these slides so that they could be used in PD, but also directly in the classroom. The notes feature suggested questions and things teachers might consider when using with students. PD discussion prompts
These slides look at the examples in more detail, with question prompts to promote discussion among maths teachers. The notes feature reference to further information and guidance within the Core Concepts document.<br>
04
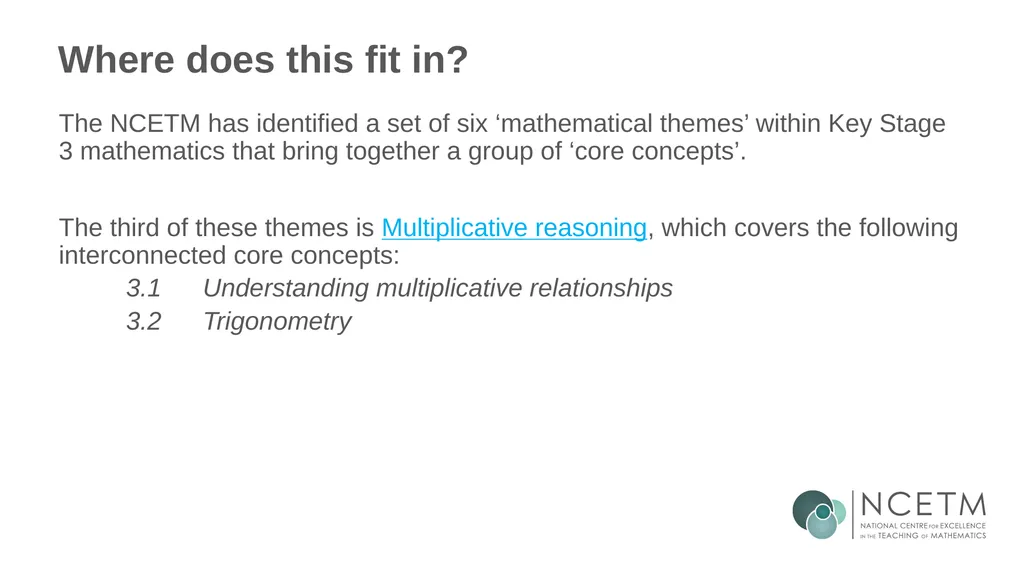
Where does this fit in? The NCETM has identified a set of six ‘mathematical themes’ within Key Stage 3 mathematics that bring together a group of ‘core concepts’.
The third of these themes is Multiplicative reasoning, which covers the following interconnected core concepts:
3.1 Understanding multiplicative relationships
3.2 Trigonometry<br>
The third of these themes is Multiplicative reasoning, which covers the following interconnected core concepts:
3.1 Understanding multiplicative relationships
3.2 Trigonometry<br>
05
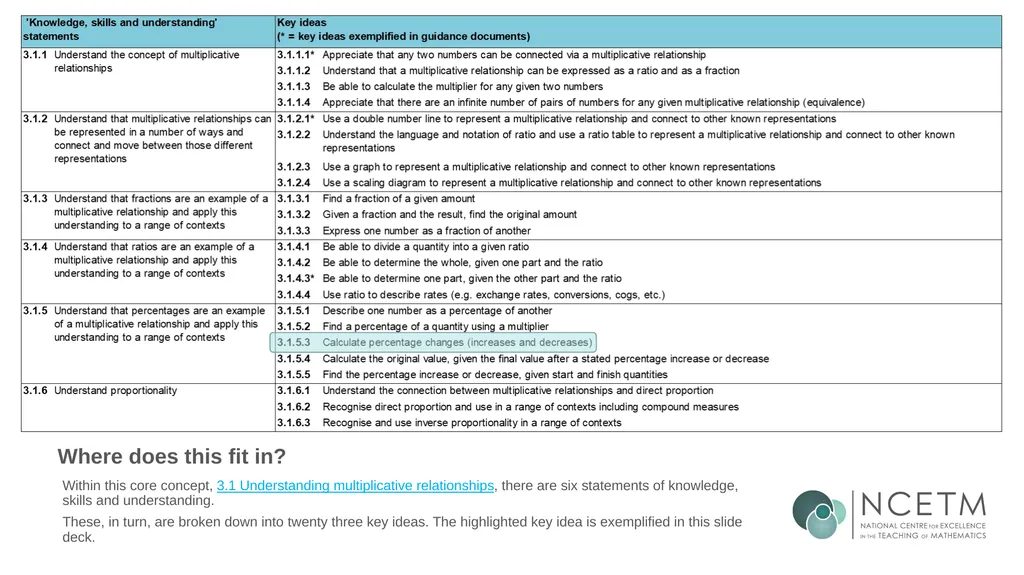
Where does this fit in? Within this core concept, 3.1 Understanding multiplicative relationships, there are six statements of knowledge, skills and understanding.
These, in turn, are broken down into twenty three key ideas. The highlighted key idea is exemplified in this slide deck.<br>
These, in turn, are broken down into twenty three key ideas. The highlighted key idea is exemplified in this slide deck.<br>
06
What do students need to understand? What prior knowledge might your students already have?
What language might they use to describe this key idea?
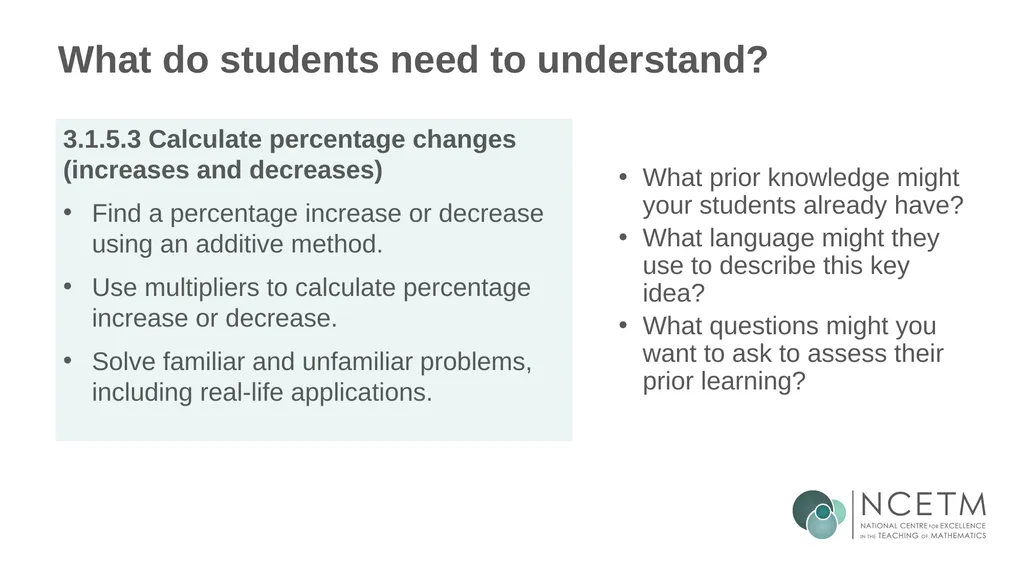
What questions might you want to ask to assess their prior learning? 3.1.5.3 Calculate percentage changes (increases and decreases)
Find a percentage increase or decrease using an additive method.
Use multipliers to calculate percentage increase or decrease.
Solve familiar and unfamiliar problems, including real-life applications.<br>
What language might they use to describe this key idea?
What questions might you want to ask to assess their prior learning? 3.1.5.3 Calculate percentage changes (increases and decreases)
Find a percentage increase or decrease using an additive method.
Use multipliers to calculate percentage increase or decrease.
Solve familiar and unfamiliar problems, including real-life applications.<br>
07
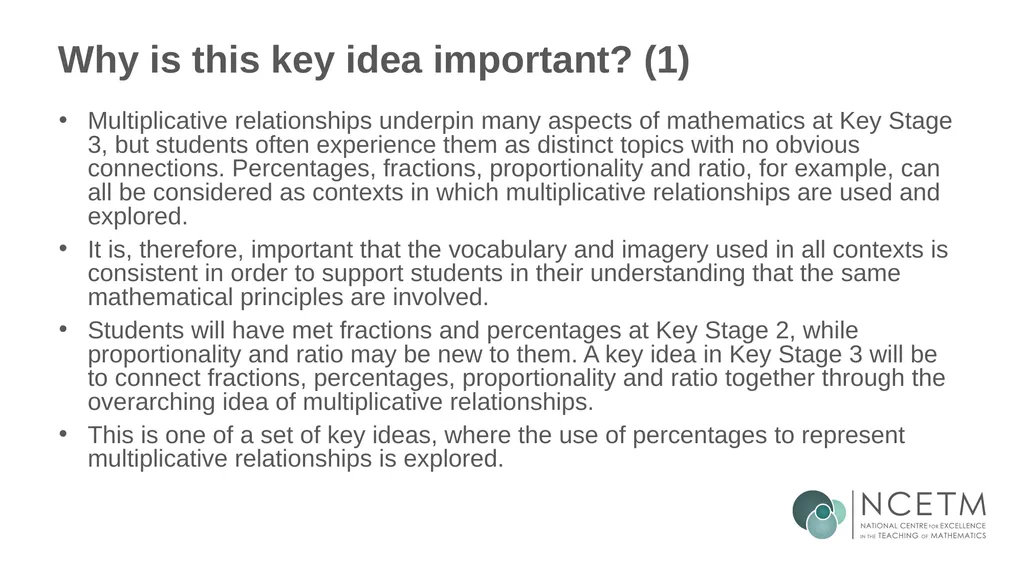
Why is this key idea important? (1) Multiplicative relationships underpin many aspects of mathematics at Key Stage 3, but students often experience them as distinct topics with no obvious connections. Percentages, fractions, proportionality and ratio, for example, can all be considered as contexts in which multiplicative relationships are used and explored.
It is, therefore, important that the vocabulary and imagery used in all contexts is consistent in order to support students in their understanding that the same mathematical principles are involved.
Students will have met fractions and percentages at Key Stage 2, while proportionality and ratio may be new to them. A key idea in Key Stage 3 will be to connect fractions, percentages, proportionality and ratio together through the overarching idea of multiplicative relationships.
This is one of a set of key ideas, where the use of percentages to represent multiplicative relationships is explored.<br>
It is, therefore, important that the vocabulary and imagery used in all contexts is consistent in order to support students in their understanding that the same mathematical principles are involved.
Students will have met fractions and percentages at Key Stage 2, while proportionality and ratio may be new to them. A key idea in Key Stage 3 will be to connect fractions, percentages, proportionality and ratio together through the overarching idea of multiplicative relationships.
This is one of a set of key ideas, where the use of percentages to represent multiplicative relationships is explored.<br>
08
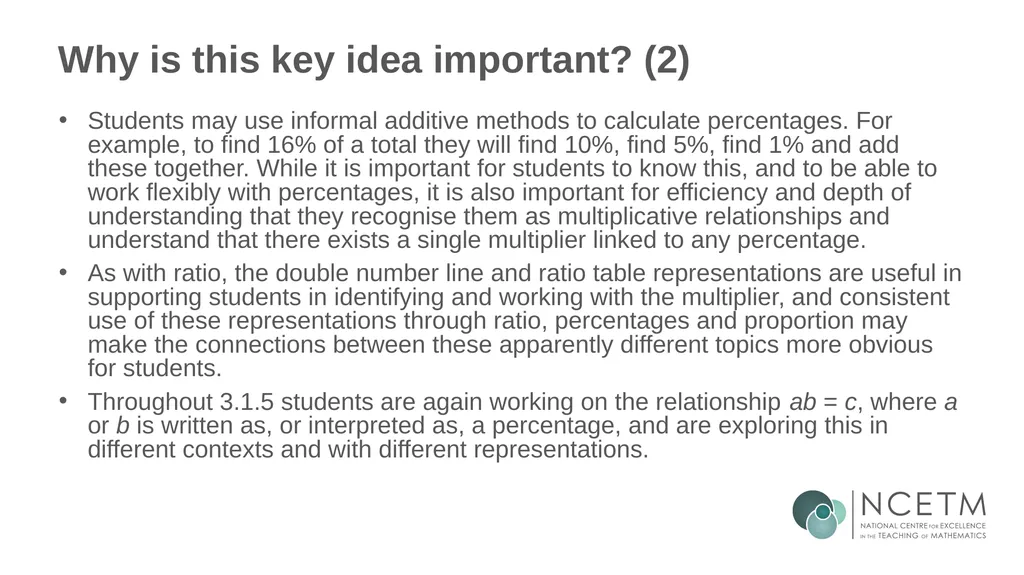
Why is this key idea important? (2) Students may use informal additive methods to calculate percentages. For example, to find 16% of a total they will find 10%, find 5%, find 1% and add these together. While it is important for students to know this, and to be able to work flexibly with percentages, it is also important for efficiency and depth of understanding that they recognise them as multiplicative relationships and understand that there exists a single multiplier linked to any percentage.
As with ratio, the double number line and ratio table representations are useful in supporting students in identifying and working with the multiplier, and consistent use of these representations through ratio, percentages and proportion may make the connections between these apparently different topics more obvious for students.
Throughout 3.1.5 students are again working on the relationship ab = c, where a or b is written as, or interpreted as, a percentage, and are exploring this in different contexts and with different representations.<br>
As with ratio, the double number line and ratio table representations are useful in supporting students in identifying and working with the multiplier, and consistent use of these representations through ratio, percentages and proportion may make the connections between these apparently different topics more obvious for students.
Throughout 3.1.5 students are again working on the relationship ab = c, where a or b is written as, or interpreted as, a percentage, and are exploring this in different contexts and with different representations.<br>
09
Prior learning What prior knowledge might your students already have?
What language might they use to describe this key idea?
What questions might you want to ask to assess their prior learning?<br>
What language might they use to describe this key idea?
What questions might you want to ask to assess their prior learning?<br>
10
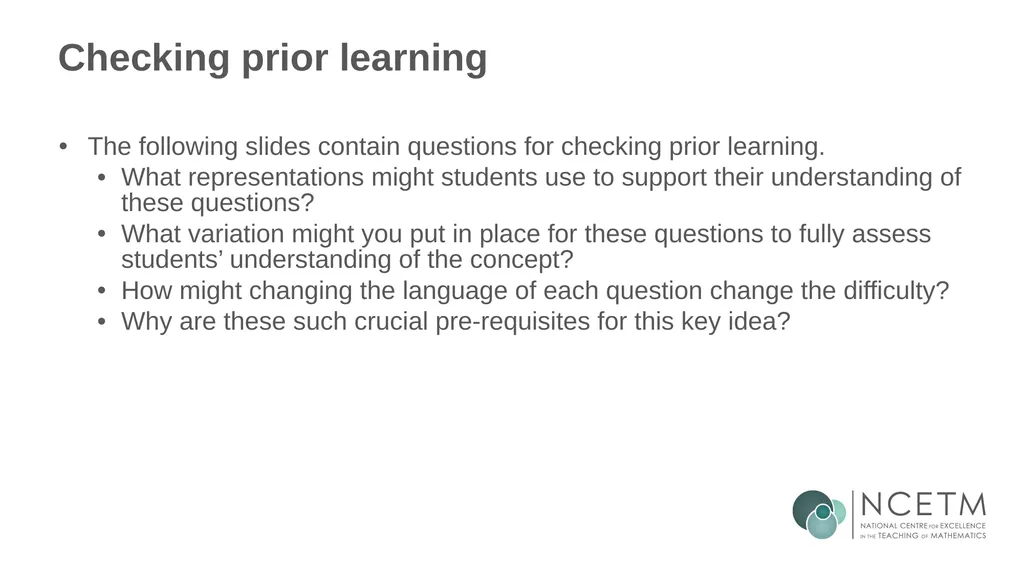
Checking prior learning The following slides contain questions for checking prior learning.
What representations might students use to support their understanding of these questions?
What variation might you put in place for these questions to fully assess students’ understanding of the concept?
How might changing the language of each question change the difficulty?
Why are these such crucial pre-requisites for this key idea?<br>
What representations might students use to support their understanding of these questions?
What variation might you put in place for these questions to fully assess students’ understanding of the concept?
How might changing the language of each question change the difficulty?
Why are these such crucial pre-requisites for this key idea?<br>
11
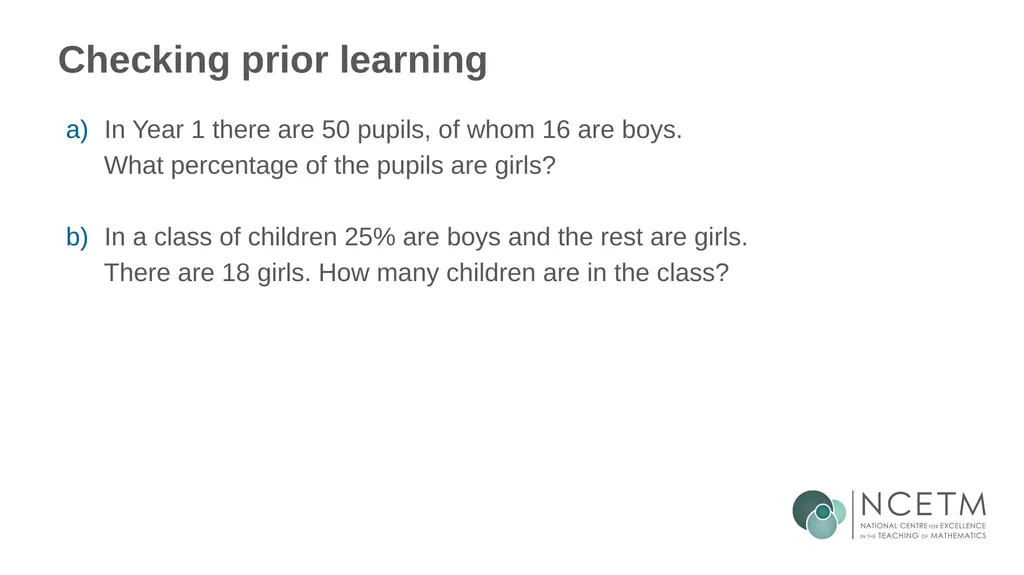
Checking prior learning In Year 1 there are 50 pupils, of whom 16 are boys.
What percentage of the pupils are girls?
In a class of children 25% are boys and the rest are girls.
There are 18 girls. How many children are in the class?<br>
What percentage of the pupils are girls?
In a class of children 25% are boys and the rest are girls.
There are 18 girls. How many children are in the class?<br>
12
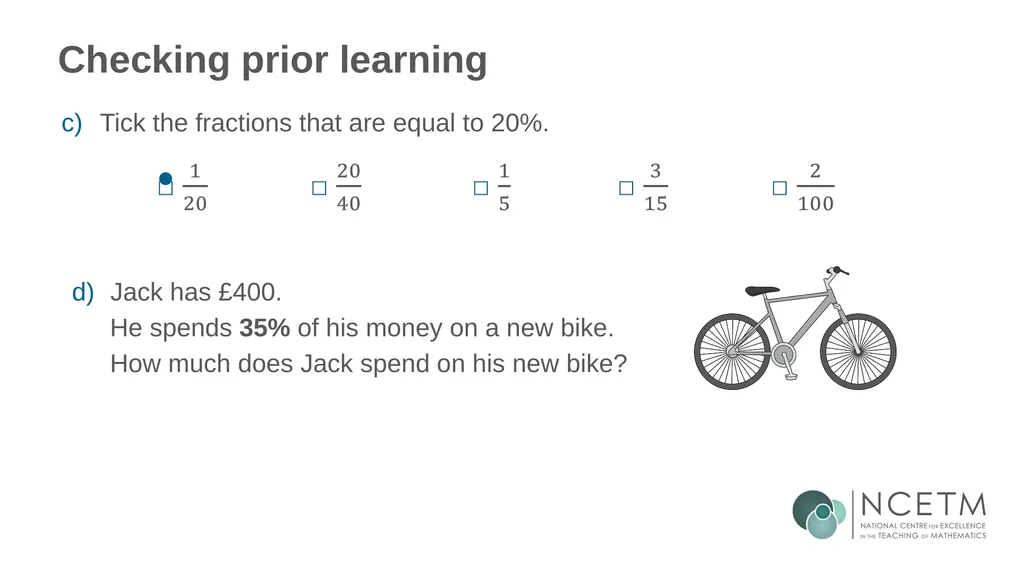
Checking prior learning Jack has £400.
He spends 35% of his money on a new bike.
How much does Jack spend on his new bike? Tick the fractions that are equal to 20%.<br>
He spends 35% of his money on a new bike.
How much does Jack spend on his new bike? Tick the fractions that are equal to 20%.<br>
13
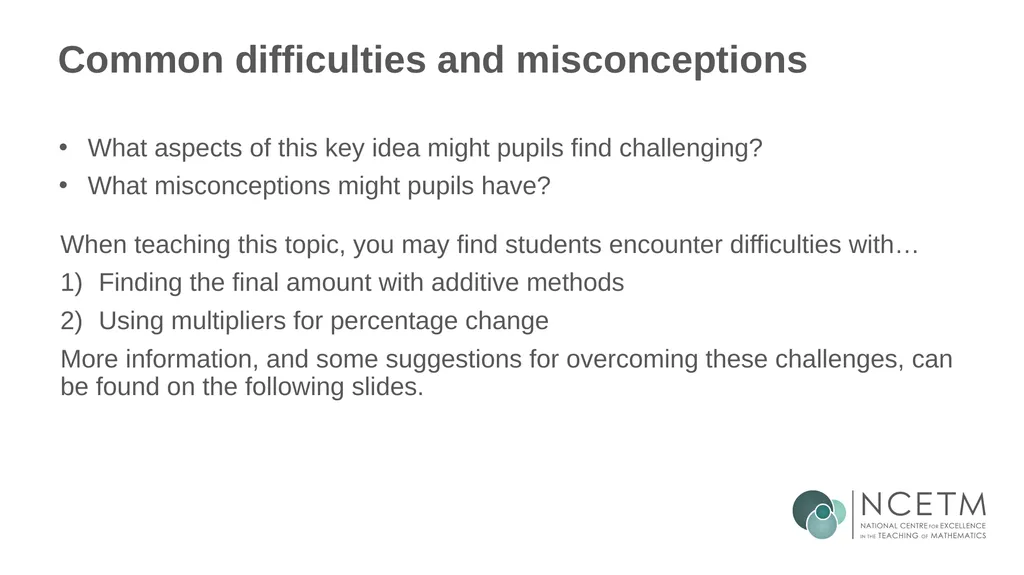
Common difficulties and misconceptions What aspects of this key idea might pupils find challenging?
What misconceptions might pupils have? When teaching this topic, you may find students encounter difficulties with…
Finding the final amount with additive methods
Using multipliers for percentage change
More information, and some suggestions for overcoming these challenges, can be found on the following slides.<br>
What misconceptions might pupils have? When teaching this topic, you may find students encounter difficulties with…
Finding the final amount with additive methods
Using multipliers for percentage change
More information, and some suggestions for overcoming these challenges, can be found on the following slides.<br>
14
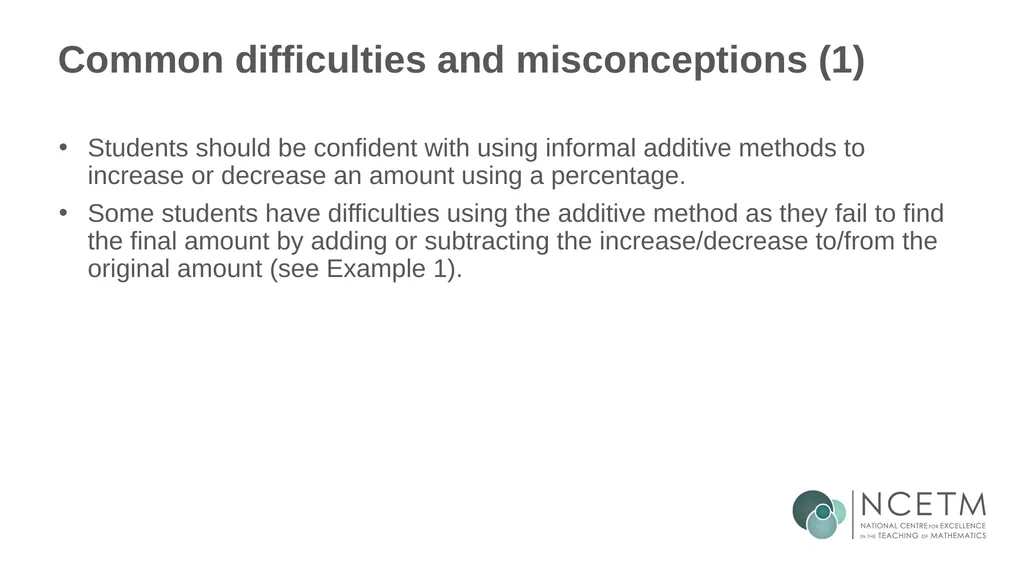
Common difficulties and misconceptions (1) Students should be confident with using informal additive methods to increase or decrease an amount using a percentage.
Some students have difficulties using the additive method as they fail to find the final amount by adding or subtracting the increase/decrease to/from the original amount (see Example 1).<br>
Some students have difficulties using the additive method as they fail to find the final amount by adding or subtracting the increase/decrease to/from the original amount (see Example 1).<br>
15
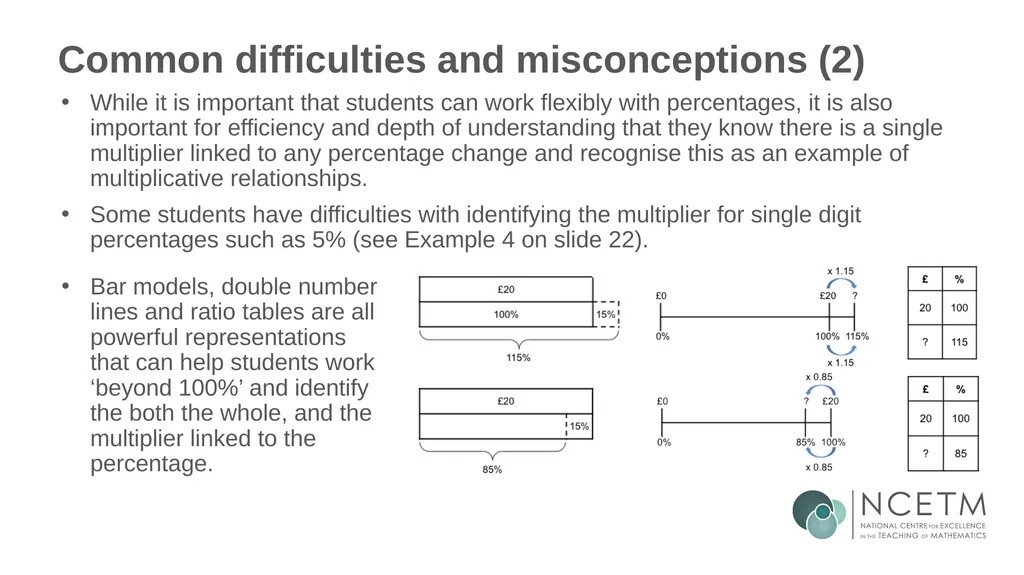
Common difficulties and misconceptions (2) Bar models, double number lines and ratio tables are all powerful representations that can help students work ‘beyond 100%’ and identify the both the whole, and the multiplier linked to the percentage. While it is important that students can work flexibly with percentages, it is also important for efficiency and depth of understanding that they know there is a single multiplier linked to any percentage change and recognise this as an example of multiplicative relationships.
Some students have difficulties with identifying the multiplier for single digit percentages such as 5% (see Example 4 on slide 22).<br>
Some students have difficulties with identifying the multiplier for single digit percentages such as 5% (see Example 4 on slide 22).<br>
16
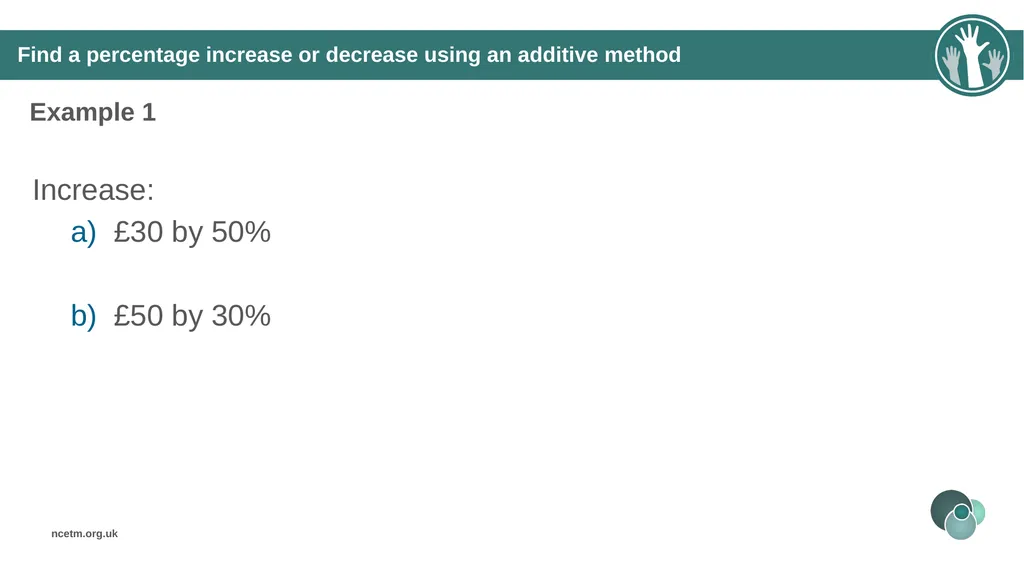
Find a percentage increase or decrease using an additive method Example 1 Increase:
£30 by 50%
£50 by 30%<br>
£30 by 50%
£50 by 30%<br>
17
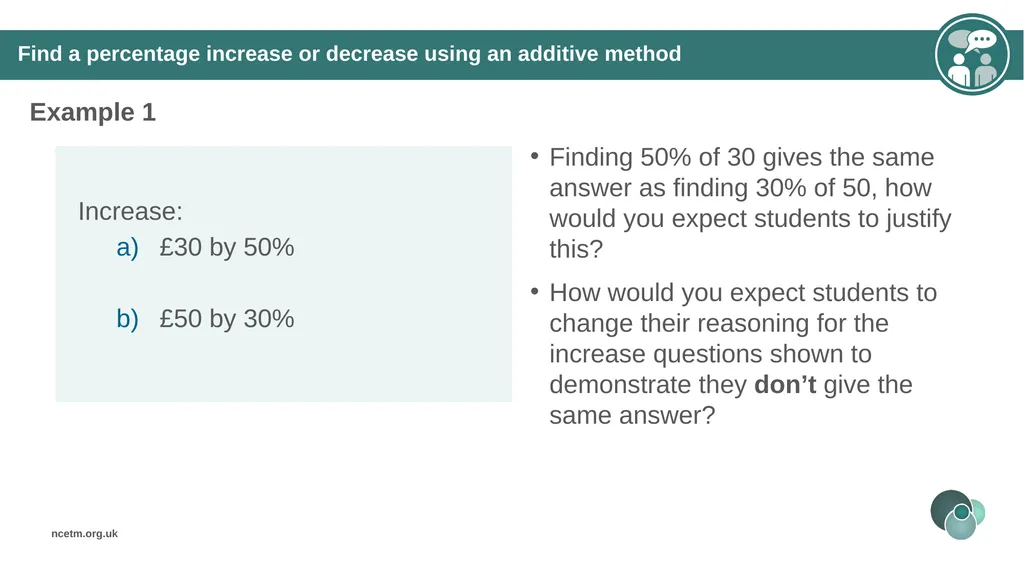
Find a percentage increase or decrease using an additive method Example 1 Finding 50% of 30 gives the same answer as finding 30% of 50, how would you expect students to justify this?
How would you expect students to change their reasoning for the increase questions shown to demonstrate they don’t give the same answer?<br>
How would you expect students to change their reasoning for the increase questions shown to demonstrate they don’t give the same answer?<br>
18
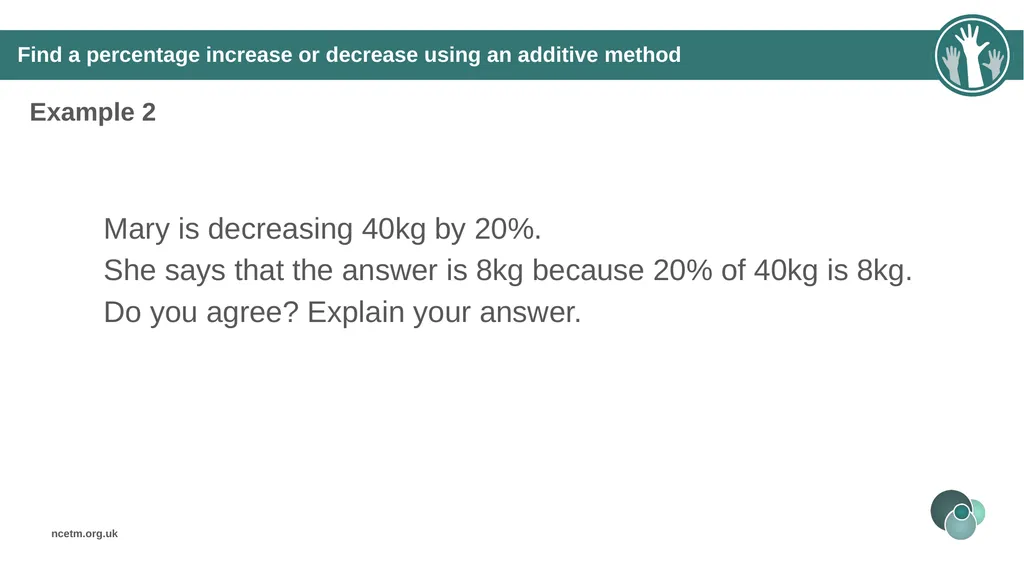
Find a percentage increase or decrease using an additive method Example 2 Mary is decreasing 40kg by 20%.
She says that the answer is 8kg because 20% of 40kg is 8kg.
Do you agree? Explain your answer.<br>
She says that the answer is 8kg because 20% of 40kg is 8kg.
Do you agree? Explain your answer.<br>
19
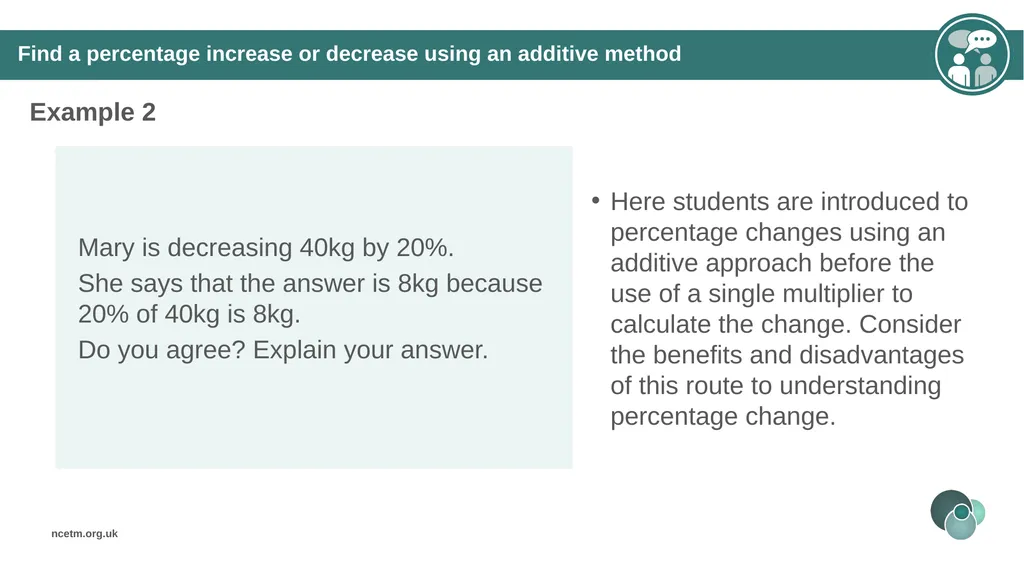
Find a percentage increase or decrease using an additive method Example 2 Here students are introduced to percentage changes using an additive approach before the use of a single multiplier to calculate the change. Consider the benefits and disadvantages of this route to understanding percentage change.<br>
20
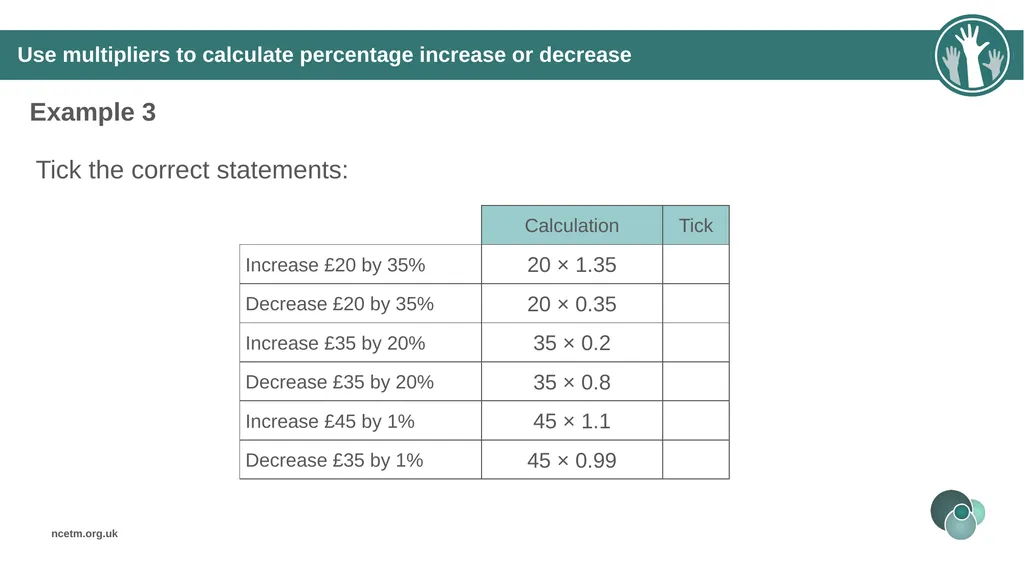
Use multipliers to calculate percentage increase or decrease Example 3 Tick the correct statements:<br>
21
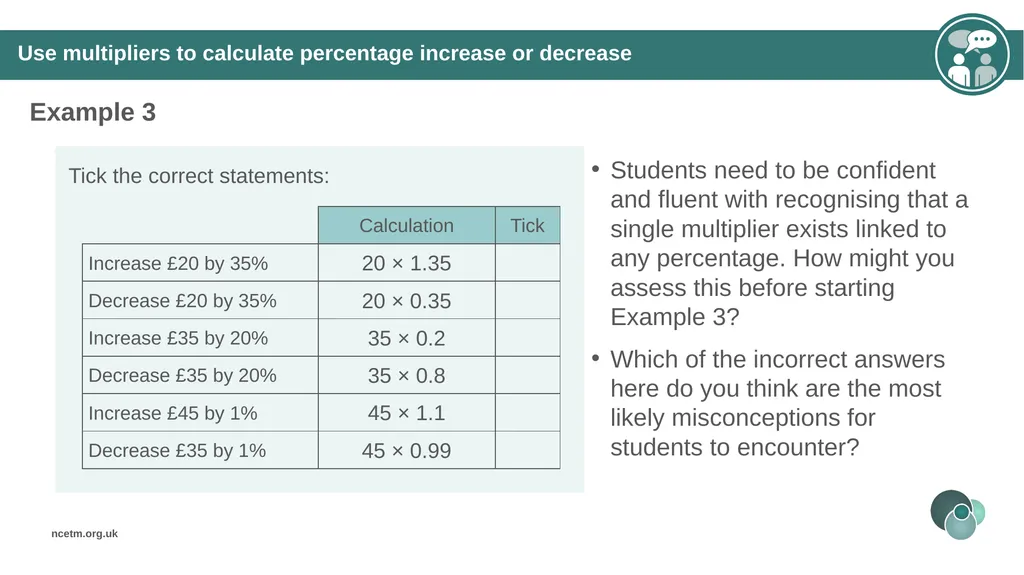
Use multipliers to calculate percentage increase or decrease Example 3 Students need to be confident and fluent with recognising that a single multiplier exists linked to any percentage. How might you assess this before starting Example 3?
Which of the incorrect answers here do you think are the most likely misconceptions for students to encounter?<br>
Which of the incorrect answers here do you think are the most likely misconceptions for students to encounter?<br>
22
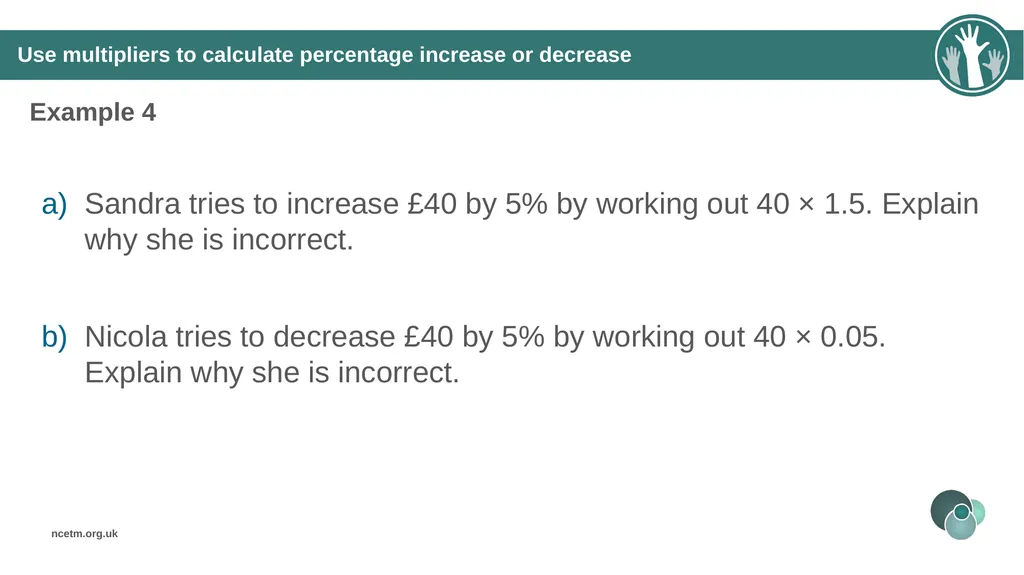
Use multipliers to calculate percentage increase or decrease Example 4 Sandra tries to increase £40 by 5% by working out 40 × 1.5. Explain why she is incorrect.
Nicola tries to decrease £40 by 5% by working out 40 × 0.05. Explain why she is incorrect.<br>
Nicola tries to decrease £40 by 5% by working out 40 × 0.05. Explain why she is incorrect.<br>
23
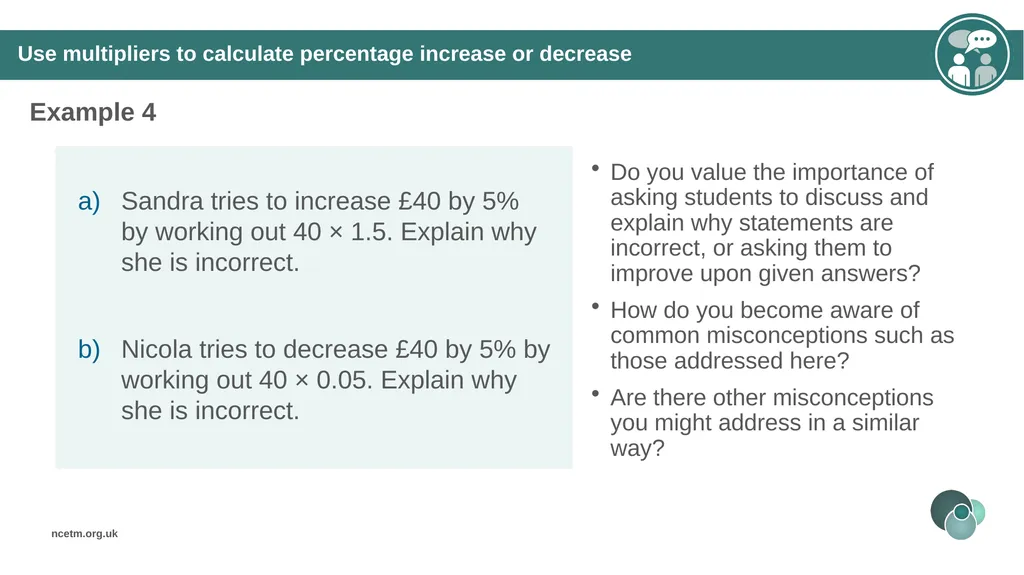
Use multipliers to calculate percentage increase or decrease Example 4 Do you value the importance of asking students to discuss and explain why statements are incorrect, or asking them to improve upon given answers?
How do you become aware of common misconceptions such as those addressed here?
Are there other misconceptions you might address in a similar way?<br>
How do you become aware of common misconceptions such as those addressed here?
Are there other misconceptions you might address in a similar way?<br>
24
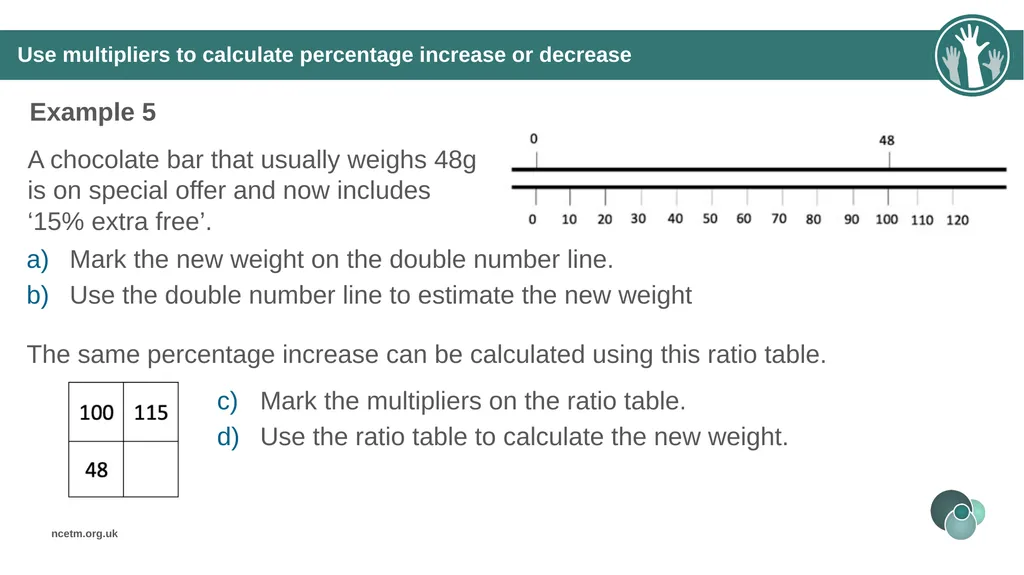
Use multipliers to calculate percentage increase or decrease Example 5 A chocolate bar that usually weighs 48g is on special offer and now includes ‘15% extra free’. Mark the new weight on the double number line.
Use the double number line to estimate the new weight The same percentage increase can be calculated using this ratio table. Mark the multipliers on the ratio table.
Use the ratio table to calculate the new weight.<br>
Use the double number line to estimate the new weight The same percentage increase can be calculated using this ratio table. Mark the multipliers on the ratio table.
Use the ratio table to calculate the new weight.<br>
25
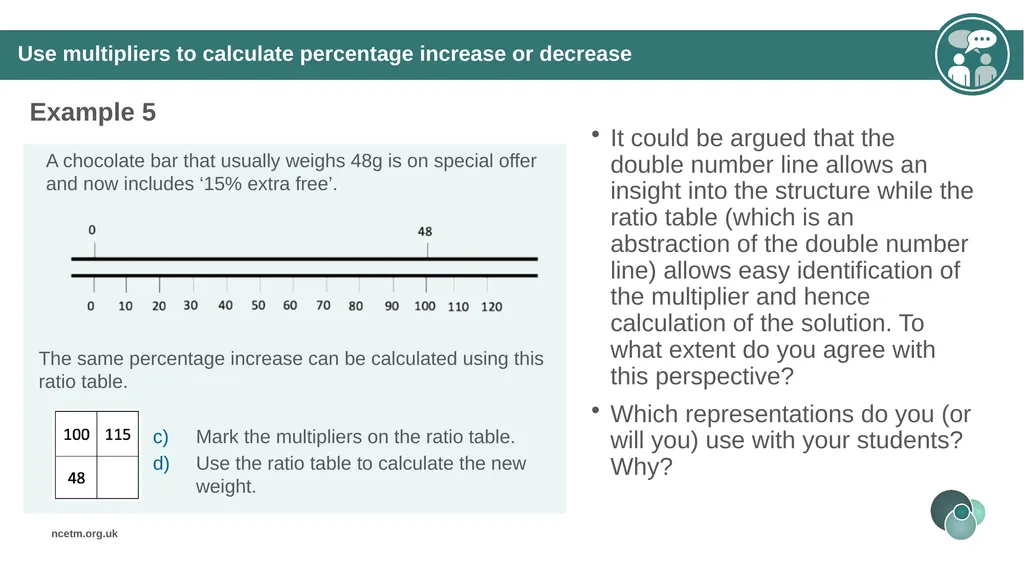
Use multipliers to calculate percentage increase or decrease Example 5 It could be argued that the double number line allows an insight into the structure while the ratio table (which is an abstraction of the double number line) allows easy identification of the multiplier and hence calculation of the solution. To what extent do you agree with this perspective?
Which representations do you (or will you) use with your students? Why?<br>
Which representations do you (or will you) use with your students? Why?<br>
26
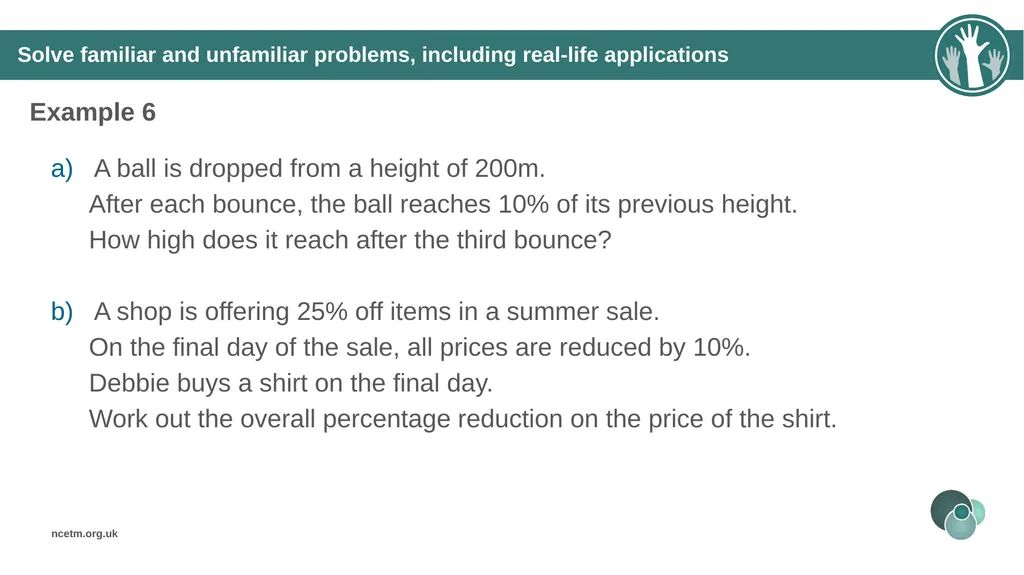
Solve familiar and unfamiliar problems, including real-life applications Example 6 A ball is dropped from a height of 200m.
After each bounce, the ball reaches 10% of its previous height.
How high does it reach after the third bounce?
A shop is offering 25% off items in a summer sale.
On the final day of the sale, all prices are reduced by 10%.
Debbie buys a shirt on the final day.
Work out the overall percentage reduction on the price of the shirt.<br>
After each bounce, the ball reaches 10% of its previous height.
How high does it reach after the third bounce?
A shop is offering 25% off items in a summer sale.
On the final day of the sale, all prices are reduced by 10%.
Debbie buys a shirt on the final day.
Work out the overall percentage reduction on the price of the shirt.<br>
27
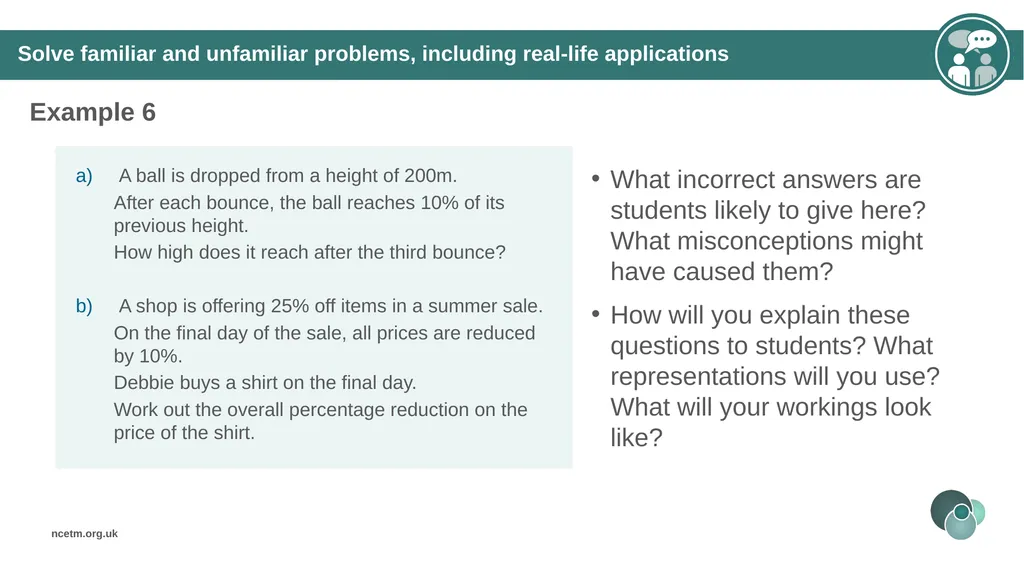
Solve familiar and unfamiliar problems, including real-life applications Example 6 What incorrect answers are students likely to give here? What misconceptions might have caused them?
How will you explain these questions to students? What representations will you use? What will your workings look like?<br>
How will you explain these questions to students? What representations will you use? What will your workings look like?<br>
28
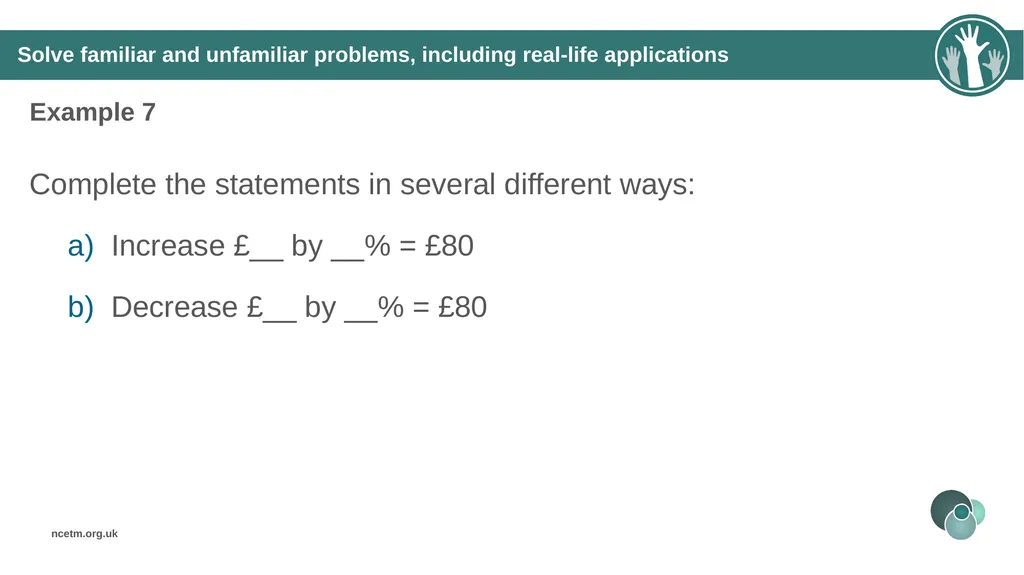
Solve familiar and unfamiliar problems, including real-life applications Example 7 Complete the statements in several different ways:
Increase £__ by __% = £80
Decrease £__ by __% = £80<br>
Increase £__ by __% = £80
Decrease £__ by __% = £80<br>
29
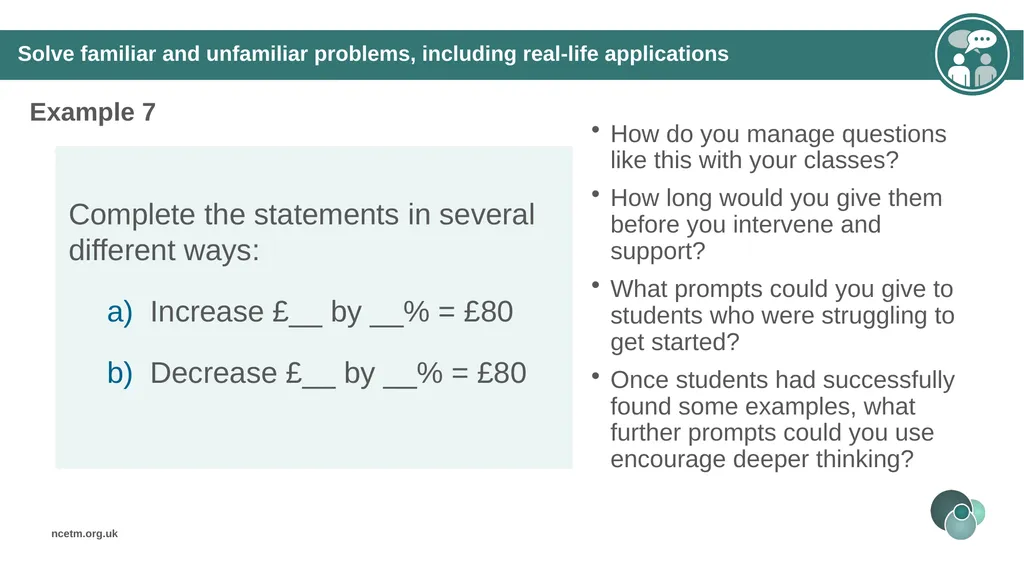
Solve familiar and unfamiliar problems, including real-life applications Example 7 How do you manage questions like this with your classes?
How long would you give them before you intervene and support?
What prompts could you give to students who were struggling to get started?
Once students had successfully found some examples, what further prompts could you use encourage deeper thinking?<br>
How long would you give them before you intervene and support?
What prompts could you give to students who were struggling to get started?
Once students had successfully found some examples, what further prompts could you use encourage deeper thinking?<br>
30
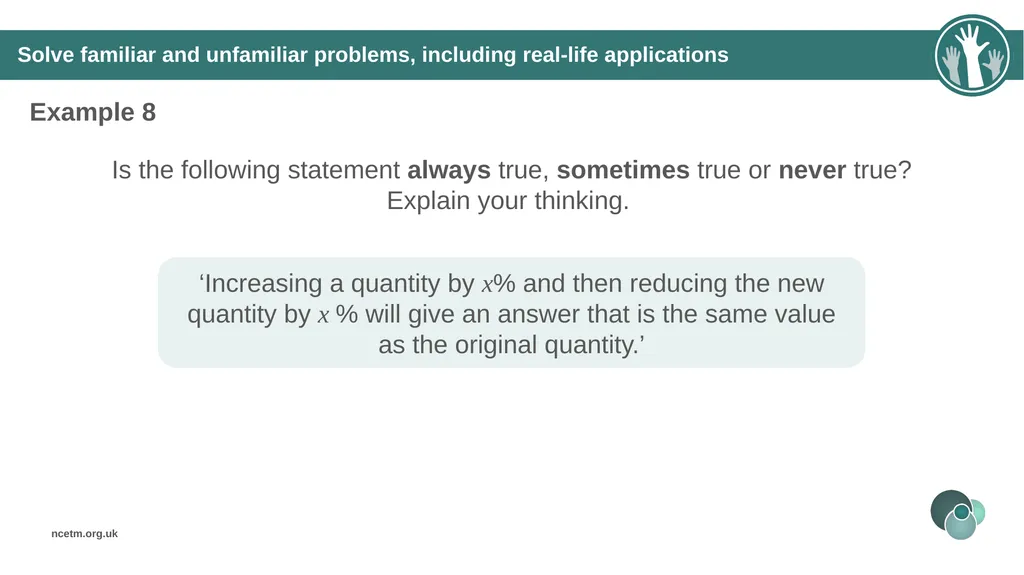
Solve familiar and unfamiliar problems, including real-life applications Example 8 Is the following statement always true, sometimes true or never true? Explain your thinking. ‘Increasing a quantity by x% and then reducing the new quantity by x % will give an answer that is the same value as the original quantity.’<br>
31
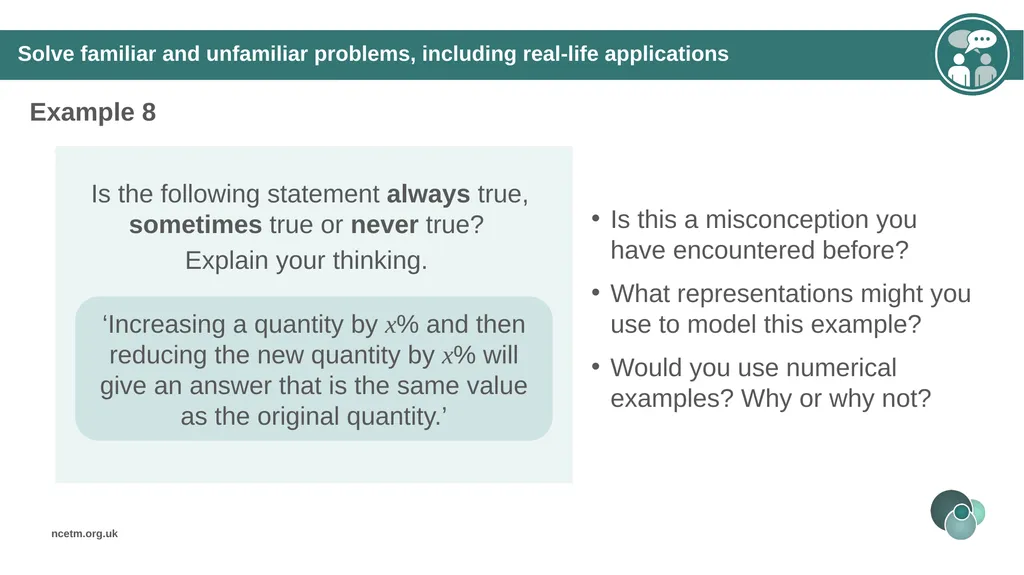
Solve familiar and unfamiliar problems, including real-life applications Example 8 Is this a misconception you have encountered before?
What representations might you use to model this example?
Would you use numerical examples? Why or why not?<br>
What representations might you use to model this example?
Would you use numerical examples? Why or why not?<br>
32
Reflection questions What other mathematical concepts will be supported by students’ stronger understanding of this key idea?
What mathematical language will you continue to use to support pupils to make connections with other areas?
Which representations might you continue to use to further develop students’ understanding?<br>
What mathematical language will you continue to use to support pupils to make connections with other areas?
Which representations might you continue to use to further develop students’ understanding?<br>
33
Appendices You may choose to use the following slides when planning or delivering a PD session. They cover:
Key vocabulary
Representations and structure
Previous learning
Future learning
Library of links<br>
Key vocabulary
Representations and structure
Previous learning
Future learning
Library of links<br>
34
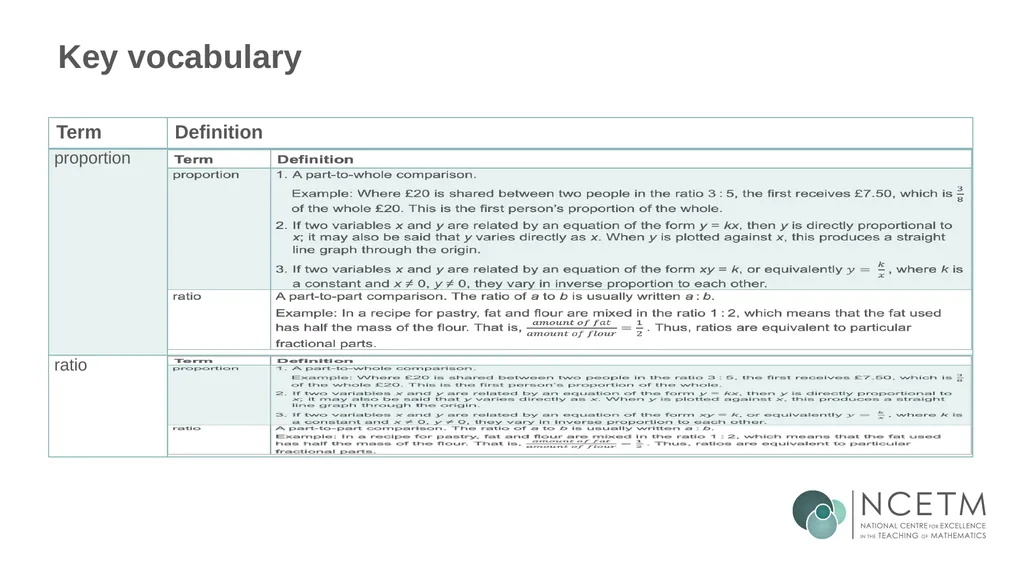
Key vocabulary<br>
35
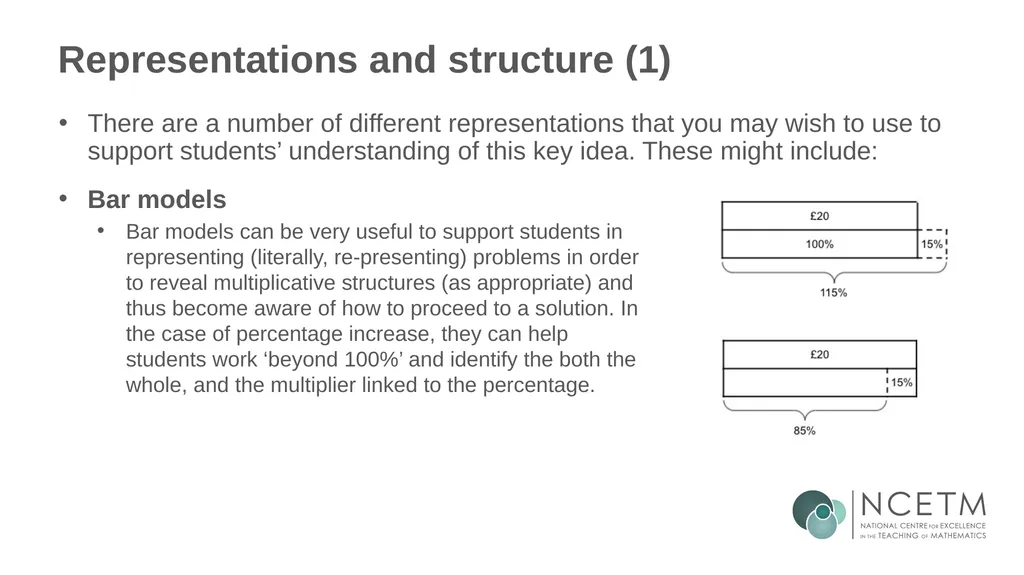
Representations and structure (1) There are a number of different representations that you may wish to use to support students’ understanding of this key idea. These might include: Bar models
Bar models can be very useful to support students in representing (literally, re-presenting) problems in order to reveal multiplicative structures (as appropriate) and thus become aware of how to proceed to a solution. In the case of percentage increase, they can help students work ‘beyond 100%’ and identify the both the whole, and the multiplier linked to the percentage.<br>
Bar models can be very useful to support students in representing (literally, re-presenting) problems in order to reveal multiplicative structures (as appropriate) and thus become aware of how to proceed to a solution. In the case of percentage increase, they can help students work ‘beyond 100%’ and identify the both the whole, and the multiplier linked to the percentage.<br>
36
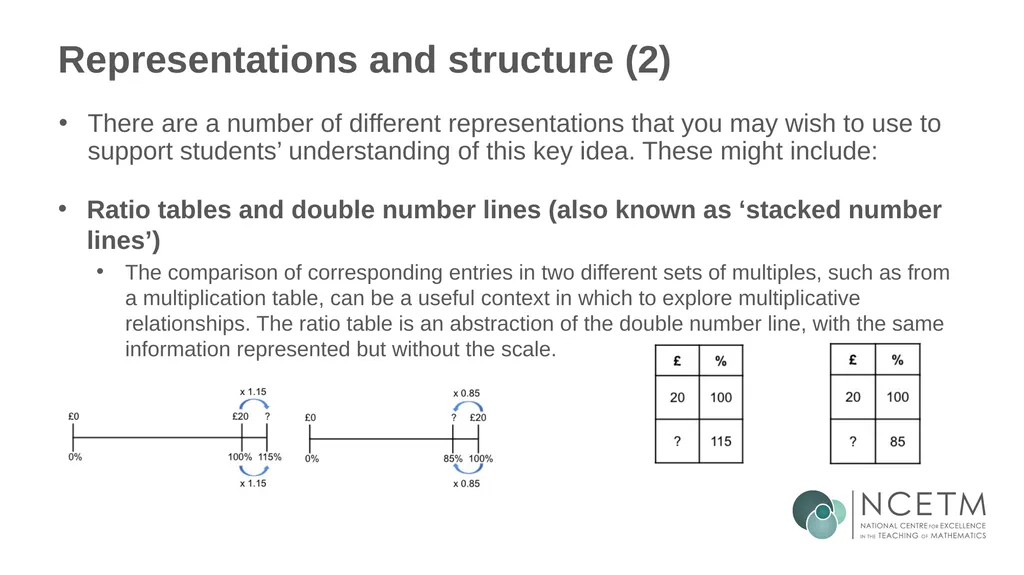
Representations and structure (2) There are a number of different representations that you may wish to use to support students’ understanding of this key idea. These might include: Ratio tables and double number lines (also known as ‘stacked number lines’)
The comparison of corresponding entries in two different sets of multiples, such as from a multiplication table, can be a useful context in which to explore multiplicative relationships. The ratio table is an abstraction of the double number line, with the same information represented but without the scale.<br>
The comparison of corresponding entries in two different sets of multiples, such as from a multiplication table, can be a useful context in which to explore multiplicative relationships. The ratio table is an abstraction of the double number line, with the same information represented but without the scale.<br>
37
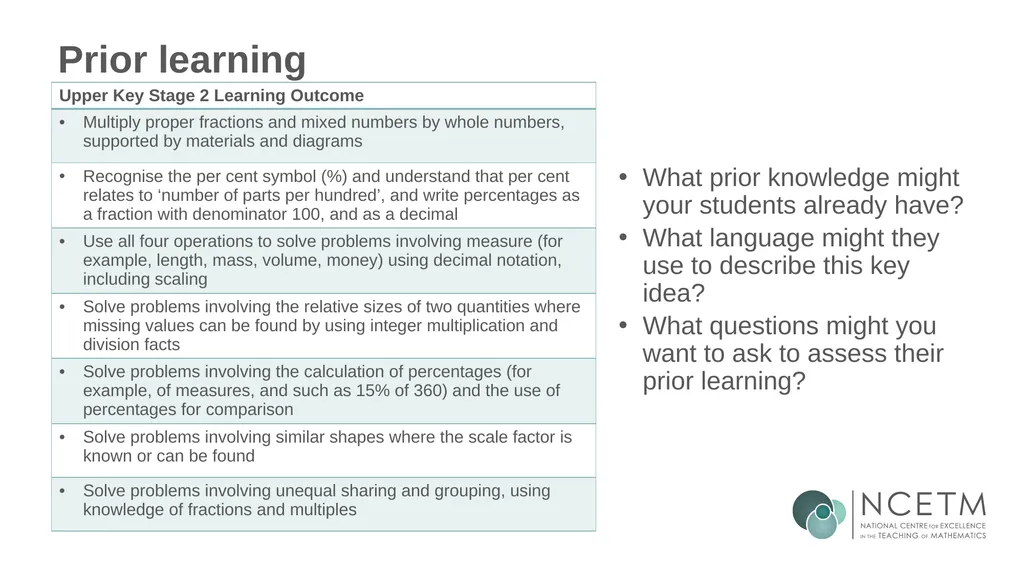
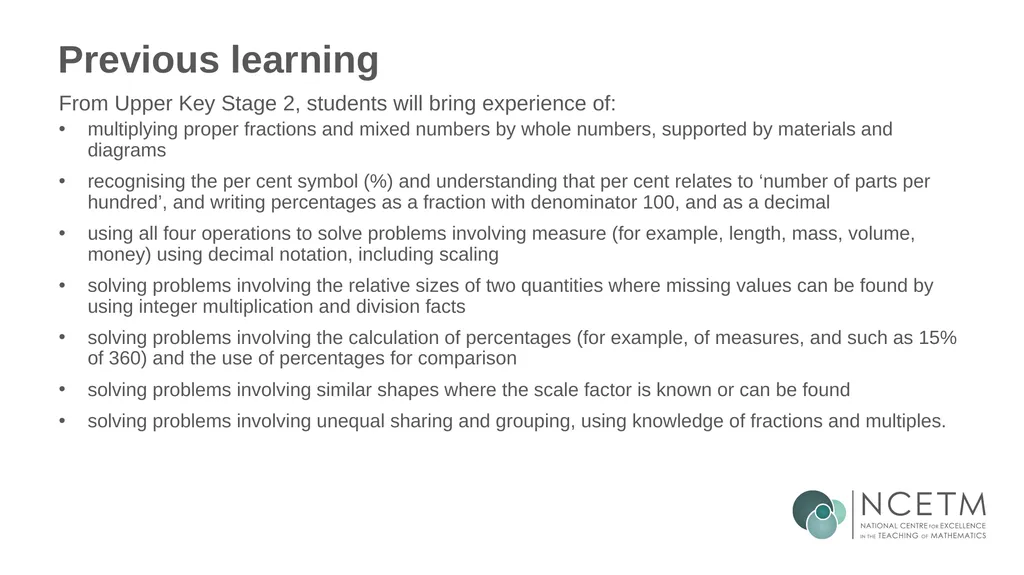
Previous learning From Upper Key Stage 2, students will bring experience of:
multiplying proper fractions and mixed numbers by whole numbers, supported by materials and diagrams
recognising the per cent symbol (%) and understanding that per cent relates to ‘number of parts per hundred’, and writing percentages as a fraction with denominator 100, and as a decimal
using all four operations to solve problems involving measure (for example, length, mass, volume, money) using decimal notation, including scaling
solving problems involving the relative sizes of two quantities where missing values can be found by using integer multiplication and division facts
solving problems involving the calculation of percentages (for example, of measures, and such as 15% of 360) and the use of percentages for comparison
solving problems involving similar shapes where the scale factor is known or can be found
solving problems involving unequal sharing and grouping, using knowledge of fractions and multiples.<br>
multiplying proper fractions and mixed numbers by whole numbers, supported by materials and diagrams
recognising the per cent symbol (%) and understanding that per cent relates to ‘number of parts per hundred’, and writing percentages as a fraction with denominator 100, and as a decimal
using all four operations to solve problems involving measure (for example, length, mass, volume, money) using decimal notation, including scaling
solving problems involving the relative sizes of two quantities where missing values can be found by using integer multiplication and division facts
solving problems involving the calculation of percentages (for example, of measures, and such as 15% of 360) and the use of percentages for comparison
solving problems involving similar shapes where the scale factor is known or can be found
solving problems involving unequal sharing and grouping, using knowledge of fractions and multiples.<br>
38
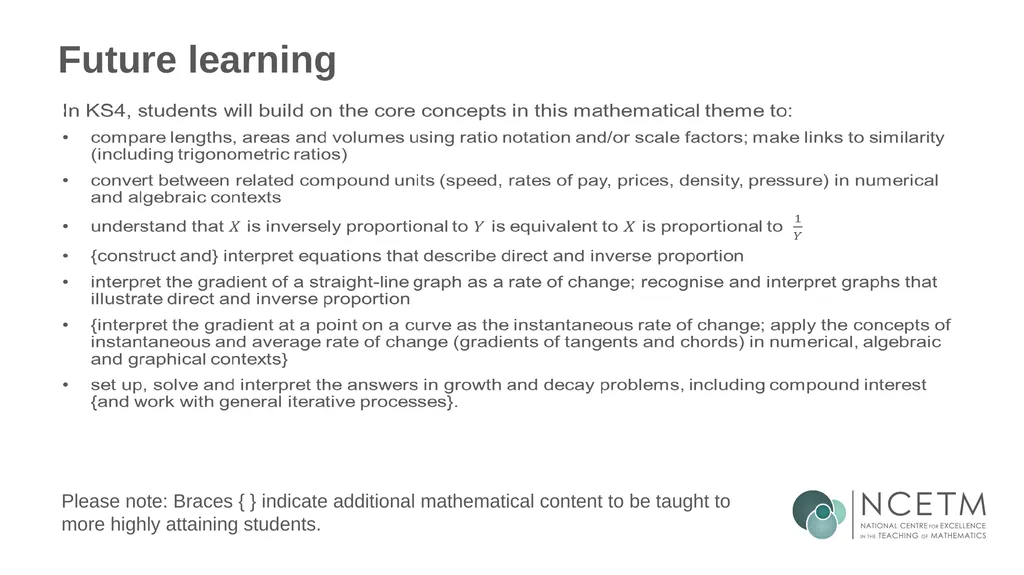
Future learning Please note: Braces { } indicate additional mathematical content to be taught to more highly attaining students.<br>
39
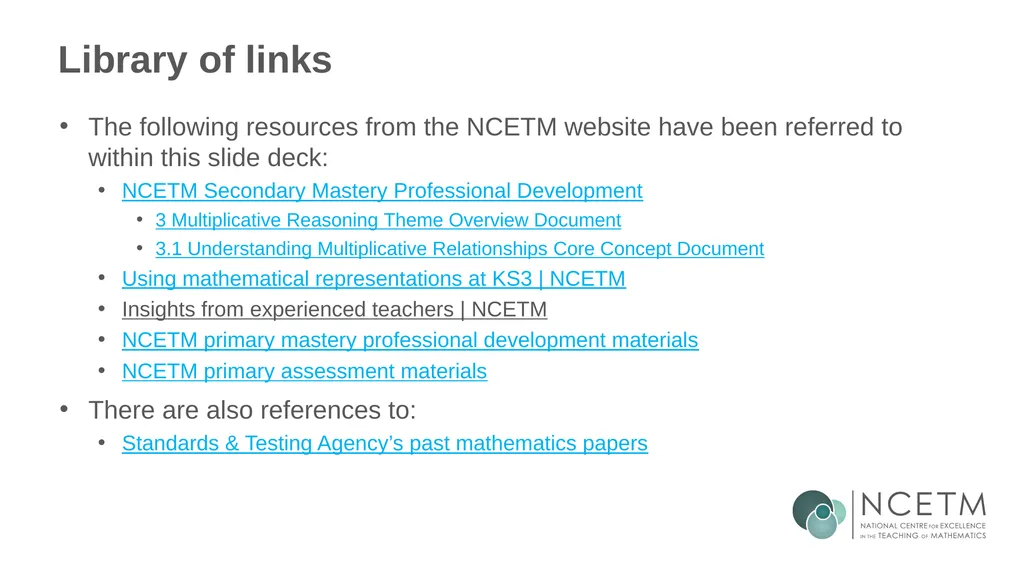
Library of links The following resources from the NCETM website have been referred to within this slide deck:
NCETM Secondary Mastery Professional Development
3 Multiplicative Reasoning Theme Overview Document
3.1 Understanding Multiplicative Relationships Core Concept Document
Using mathematical representations at KS3 | NCETM
Insights from experienced teachers | NCETM
NCETM primary mastery professional development materials
NCETM primary assessment materials
There are also references to:
Standards & Testing Agency’s past mathematics papers<br>
NCETM Secondary Mastery Professional Development
3 Multiplicative Reasoning Theme Overview Document
3.1 Understanding Multiplicative Relationships Core Concept Document
Using mathematical representations at KS3 | NCETM
Insights from experienced teachers | NCETM
NCETM primary mastery professional development materials
NCETM primary assessment materials
There are also references to:
Standards & Testing Agency’s past mathematics papers<br>