
Capability Dashboard – 15 Box Grid From Session C
Description: Capability Dashboard 15 Box Grid From Session C Page 2 Capability Dashboard - PerformancePotential 15 Box Grid Performance Potential High Medium Limited Top 15 Next 15 Mid 50 Caution 10 Least Effective 10 Collaboration Team
Related Topics
Download Presentation
"Capability Dashboard – 15 Box Grid From Session C" is the property of its rightful owner. Permission is granted to download and print the materials on this website for personal, non-commercial use only, and to display it on your personal computer provided you do not modify the materials and that you retain all copyright notices contained in the materials. By downloading content from our website, you accept the terms of this agreement.
Presentation Transcript
slide1. Capability Dashboard – 15 Box Grid
From Session C<br>
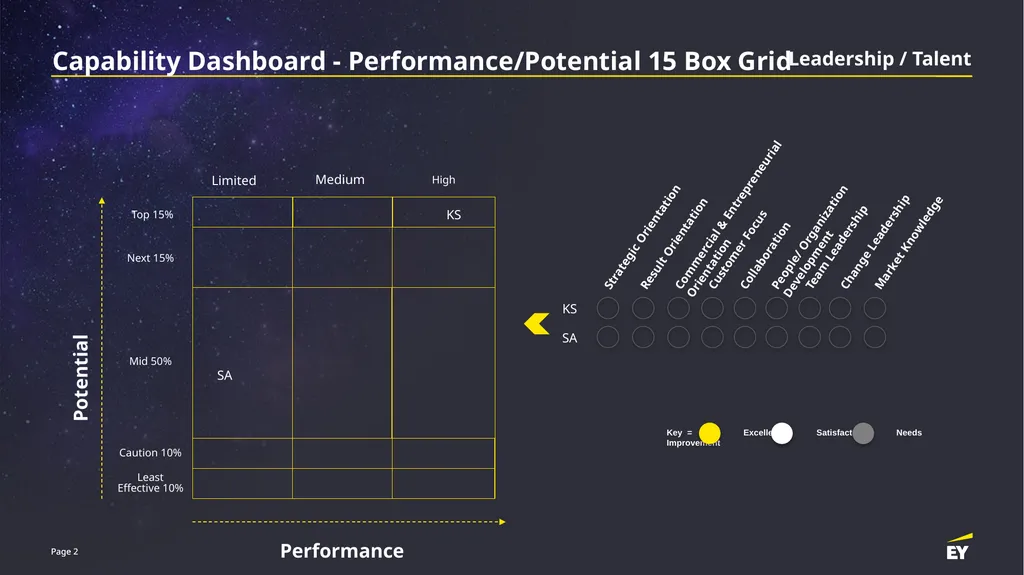
slide2. Page 2 Capability Dashboard - Performance/Potential 15 Box Grid Performance Potential High Medium Limited Top 15% Next 15% Mid 50% Caution 10% Least Effective 10% Collaboration Team Leadership Change Leadership Result Orientation Strategic Orientation Commercial & Entrepreneurial Orientation Customer Focus People/ Organization Development Market Knowledge Key = Excellent Satisfactory Needs Improvement KS SA KS SA * Leadership / Talent<br>
slide3. Key aspects of the 15 box grid Page 3 The 15 grid capability dashboard maps the capability of each employee based on performance as well as potential
This capability dashboard ensures that all Talent is in scope for relevant development paths
The top 15% are the High Potentials and High Performers. The next 65% are called the “Solid 65” and the last 20% gives us the opportunity to focus on performance and potential related needs for that group
This grid gives leadership an understanding of who is showing up where to ensure key decisions like succession planning slates have the identified high performers and high potentials. It also reminds us to customise development approaches based on where an employee is in this grid
This grid also helps us keep a tab on who may be a retention risk and who could be a consistent performer vs a constant at the bottom 20% - giving data to decide on recognition, reward, key developmental conversations etc as required<br>
From Session C<br>
slide2. Page 2 Capability Dashboard - Performance/Potential 15 Box Grid Performance Potential High Medium Limited Top 15% Next 15% Mid 50% Caution 10% Least Effective 10% Collaboration Team Leadership Change Leadership Result Orientation Strategic Orientation Commercial & Entrepreneurial Orientation Customer Focus People/ Organization Development Market Knowledge Key = Excellent Satisfactory Needs Improvement KS SA KS SA * Leadership / Talent<br>
slide3. Key aspects of the 15 box grid Page 3 The 15 grid capability dashboard maps the capability of each employee based on performance as well as potential
This capability dashboard ensures that all Talent is in scope for relevant development paths
The top 15% are the High Potentials and High Performers. The next 65% are called the “Solid 65” and the last 20% gives us the opportunity to focus on performance and potential related needs for that group
This grid gives leadership an understanding of who is showing up where to ensure key decisions like succession planning slates have the identified high performers and high potentials. It also reminds us to customise development approaches based on where an employee is in this grid
This grid also helps us keep a tab on who may be a retention risk and who could be a consistent performer vs a constant at the bottom 20% - giving data to decide on recognition, reward, key developmental conversations etc as required<br>