
Chapter 3 Firm’s Financial Operations 2 Contents
DP
Published · 77 slides · 0 views

1 / 1

Description
Chapter 3 Firms Financial Operations 2 Contents Firms Financial Operations 1. Financial Statements 2. Financial Analysis 3. Cash Flow Management 4. Earned Value Management 3 1. Financial Statements 1.1 General Financial information is
Related Topics
Share
Embed code
Download this presentation From Below
"Chapter 3 Firm’s Financial Operations 2 Contents" is the property of its rightful owner. Permission is granted to download and print the materials on this website for personal, non-commercial use only, and to display it on your personal computer provided you do not modify the materials and that you retain all copyright notices contained in the materials. By downloading content from our website, you accept the terms of this agreement.
Presentation Transcript
01
Chapter 3
Firm’s Financial Operations<br>
Firm’s Financial Operations<br>
02
2 Contents Firm’s Financial Operations
1. Financial Statements
2. Financial Analysis
3. Cash Flow Management
4. Earned Value Management<br>
1. Financial Statements
2. Financial Analysis
3. Cash Flow Management
4. Earned Value Management<br>
03
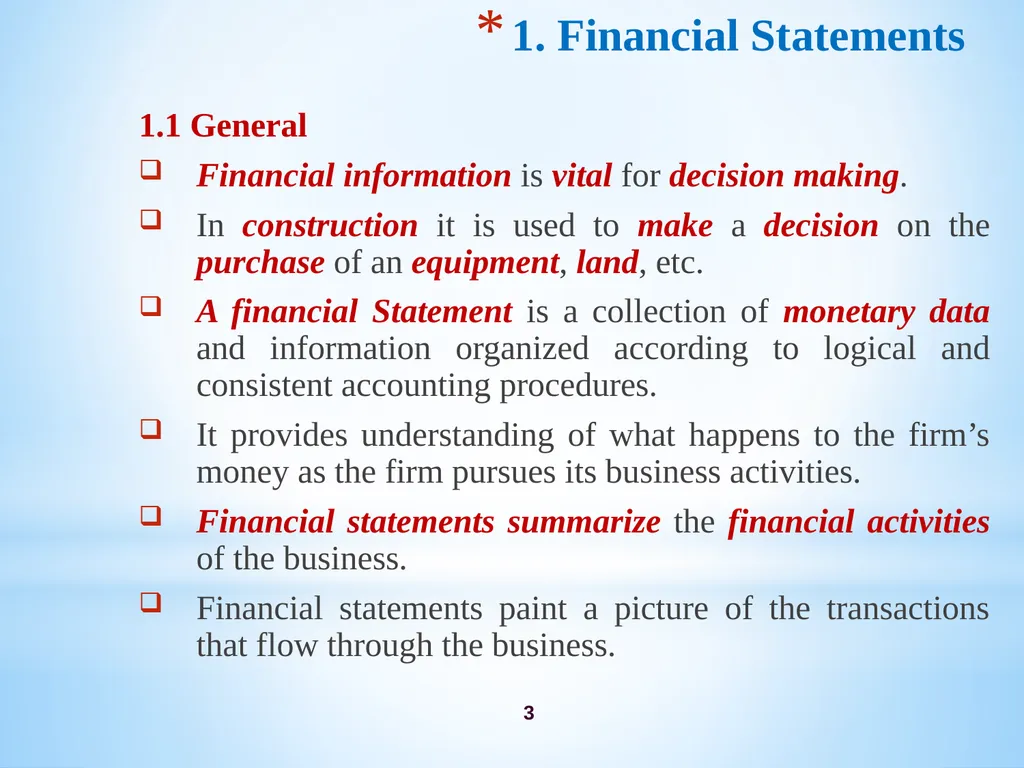
3 1. Financial Statements 1.1 General
Financial information is vital for decision making.
In construction it is used to make a decision on the purchase of an equipment, land, etc.
A financial Statement is a collection of monetary data and information organized according to logical and consistent accounting procedures.
It provides understanding of what happens to the firm’s money as the firm pursues its business activities.
Financial statements summarize the financial activities of the business.
Financial statements paint a picture of the transactions that flow through the business.<br>
Financial information is vital for decision making.
In construction it is used to make a decision on the purchase of an equipment, land, etc.
A financial Statement is a collection of monetary data and information organized according to logical and consistent accounting procedures.
It provides understanding of what happens to the firm’s money as the firm pursues its business activities.
Financial statements summarize the financial activities of the business.
Financial statements paint a picture of the transactions that flow through the business.<br>
04
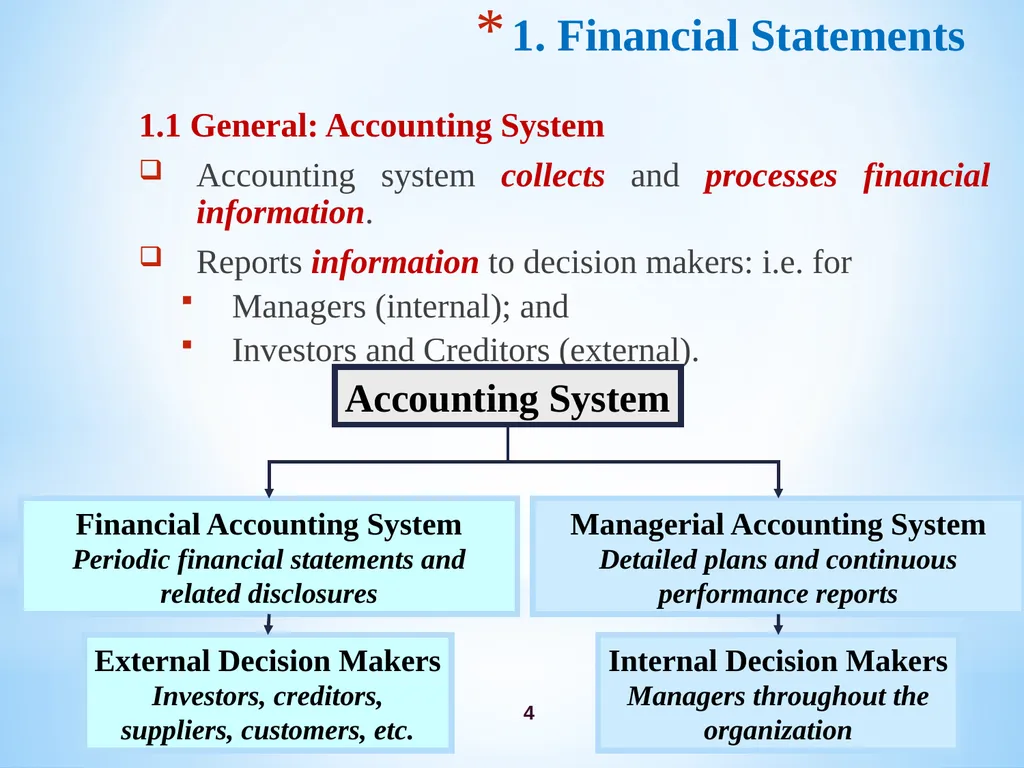
4 1. Financial Statements 1.1 General: Accounting System
Accounting system collects and processes financial information.
Reports information to decision makers: i.e. for
Managers (internal); and
Investors and Creditors (external). Accounting System<br>
Accounting system collects and processes financial information.
Reports information to decision makers: i.e. for
Managers (internal); and
Investors and Creditors (external). Accounting System<br>
05
5 1. Financial Statements 1.2 Uses of Financial Statements
Financial statements have the following uses to:
Present a historical record of the firm’s financial development when complied over a number of years;
Forecast a course of action for the firm. Financial statement is often prepared for a future period. It expresses the financial manager’s estimate of the firm’s future performance; and
A means employed by firms to present their financial situations to stockholders, creditors and the general public.<br>
Financial statements have the following uses to:
Present a historical record of the firm’s financial development when complied over a number of years;
Forecast a course of action for the firm. Financial statement is often prepared for a future period. It expresses the financial manager’s estimate of the firm’s future performance; and
A means employed by firms to present their financial situations to stockholders, creditors and the general public.<br>
06
6 1. Financial Statements 1.3 Purpose of Financial Statements
The main purpose of financial statements is to inform the following parties of the financial performance and position of the entity:
Management:– for reviewing their performance during the reporting period;
Shareholders:– for assessing the worth of their investments and reviewing the effectiveness of the Management;
Investors:– for judging the worth of the entity before deciding to invest;
Suppliers and Lenders:– for judging the creditworthiness of the entity before deciding to extend credit; and
Government:– for calculating the amount of tax to be collected.<br>
The main purpose of financial statements is to inform the following parties of the financial performance and position of the entity:
Management:– for reviewing their performance during the reporting period;
Shareholders:– for assessing the worth of their investments and reviewing the effectiveness of the Management;
Investors:– for judging the worth of the entity before deciding to invest;
Suppliers and Lenders:– for judging the creditworthiness of the entity before deciding to extend credit; and
Government:– for calculating the amount of tax to be collected.<br>
07
7 1. Financial Statements 1.4 Forms of Financial Statements
Financial statements take up one of the following forms:
Balance sheet;
Income statement; and
Cash flow (Flow of fund) statement.
1.4.1 Balance Sheet
The balance sheet is a statement which shows the financial position of a company at the end of a certain reporting period, which is the fiscal year.
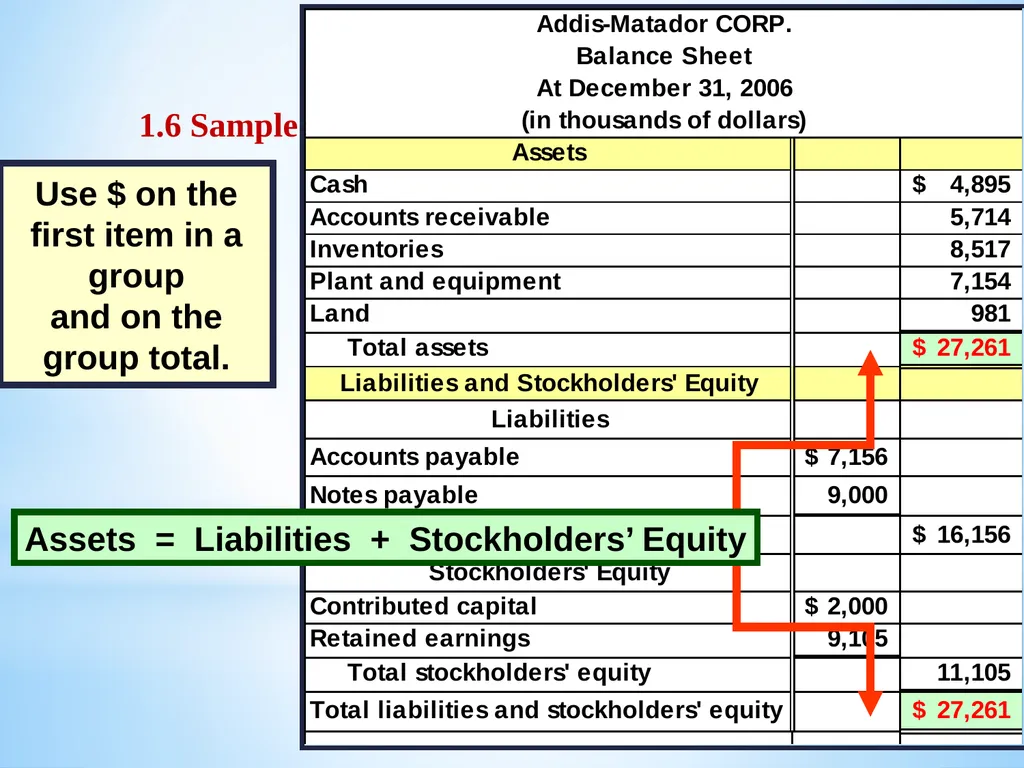
It mainly shows the assets, liabilities and stockholders equity, based on the accounting equations:
Assets = Liabilities + Owner’s equity
It declares the assets, liabilities and equity for the firm at the last day of the accounting period,
It matches resources (assets) with sources (liabilities and equity).<br>
Financial statements take up one of the following forms:
Balance sheet;
Income statement; and
Cash flow (Flow of fund) statement.
1.4.1 Balance Sheet
The balance sheet is a statement which shows the financial position of a company at the end of a certain reporting period, which is the fiscal year.
It mainly shows the assets, liabilities and stockholders equity, based on the accounting equations:
Assets = Liabilities + Owner’s equity
It declares the assets, liabilities and equity for the firm at the last day of the accounting period,
It matches resources (assets) with sources (liabilities and equity).<br>
08
8 1. Financial Statements 1.4 Forms of Financial Statements
1.4.1 Balance Sheet
A. Assets
Asset represents how much a company owns at a given time of reporting, usually the budget year.
i. Current Assets:
It includes cash and properties that can be converted to cash in less than a year.
Cash at hand, in bank or in the form of marketable securities & short form investments;
Accounts receivable: money due but not yet received:
Approved payment certificates; and
Materials delivered.
Inventory: amount invested for purchasing materials, materials on site, Paid delivery orders, etc.<br>
1.4.1 Balance Sheet
A. Assets
Asset represents how much a company owns at a given time of reporting, usually the budget year.
i. Current Assets:
It includes cash and properties that can be converted to cash in less than a year.
Cash at hand, in bank or in the form of marketable securities & short form investments;
Accounts receivable: money due but not yet received:
Approved payment certificates; and
Materials delivered.
Inventory: amount invested for purchasing materials, materials on site, Paid delivery orders, etc.<br>
09
9 1. Financial Statements 1.4 Forms of Financial Statements
1.4.1 Balance Sheet
A. Assets
ii. Fixed Assets:
These are permanent properties, which can not be easily converted to cash within a year,
Plant and Equipment: This includes building, cars, machinery and other equipments and are adjusted by the depreciation record.
Real Estate (if any): This account lists the property owned by the firm. (Land)<br>
1.4.1 Balance Sheet
A. Assets
ii. Fixed Assets:
These are permanent properties, which can not be easily converted to cash within a year,
Plant and Equipment: This includes building, cars, machinery and other equipments and are adjusted by the depreciation record.
Real Estate (if any): This account lists the property owned by the firm. (Land)<br>
10
10 1. Financial Statements 1.4 Forms of Financial Statements
1.4.1 Balance Sheet
B. Liabilities
Liabilities are funds that a company owes like loans.
It represents sources of assets since the firm either borrows the money or make use of certain assets that have not yet been paid for.
i. Current Liabilities
All debts that need to be settled in a very short period, usually within a year like accounts and notes payable in a year, accrued expenses which include:
Accounts payable: when a firm makes purchase on credit,
Short-term notes payable: promissory notes that mature in one year,
Other payables: accruals (wages payable), tax liabilities.<br>
1.4.1 Balance Sheet
B. Liabilities
Liabilities are funds that a company owes like loans.
It represents sources of assets since the firm either borrows the money or make use of certain assets that have not yet been paid for.
i. Current Liabilities
All debts that need to be settled in a very short period, usually within a year like accounts and notes payable in a year, accrued expenses which include:
Accounts payable: when a firm makes purchase on credit,
Short-term notes payable: promissory notes that mature in one year,
Other payables: accruals (wages payable), tax liabilities.<br>
11
11 1. Financial Statements 1.4 Forms of Financial Statements
1.4.1 Balance Sheet
B. Liabilities
ii. Long Term Liabilities
Liabilities that will not be paid off during the next year.
This includes the long-Term secured and unsecured financing which covers mortgage and notes where a building or other Fixed assets are pledged as specific collateral for debts.
C. Stock Holders Equity
This is part of the assets of the company, which is provided by the owners (investors). Thus it is considered as a liability to the company.
Preferred Stock,
Common Stock,
Contributed or paid in capital, and
Retained earnings.<br>
1.4.1 Balance Sheet
B. Liabilities
ii. Long Term Liabilities
Liabilities that will not be paid off during the next year.
This includes the long-Term secured and unsecured financing which covers mortgage and notes where a building or other Fixed assets are pledged as specific collateral for debts.
C. Stock Holders Equity
This is part of the assets of the company, which is provided by the owners (investors). Thus it is considered as a liability to the company.
Preferred Stock,
Common Stock,
Contributed or paid in capital, and
Retained earnings.<br>
12
12 1. Financial Statements 1.4 Forms of Financial Statements
1.4.2 Income Statement
It is a form of financial statement that shows whether the company has made or lost money during that reporting period.
Income statements can be prepared monthly, quarterly, etc. However, usual accounting periods extend to one year, which is the fiscal year.
It shows the revenues and expenses of the firm, the effect of interest and taxes and the net income for the period.
It may be called as the profit-and-loss statement or the statement of earnings.<br>
1.4.2 Income Statement
It is a form of financial statement that shows whether the company has made or lost money during that reporting period.
Income statements can be prepared monthly, quarterly, etc. However, usual accounting periods extend to one year, which is the fiscal year.
It shows the revenues and expenses of the firm, the effect of interest and taxes and the net income for the period.
It may be called as the profit-and-loss statement or the statement of earnings.<br>
13
13 1. Financial Statements 1.4 Forms of Financial Statements
1.4.2 Income Statement
The balance sheet offers a view of the firm at a moment in time, whereas the income statement summarizes the profitability of operations over a period of time.
It is an accounting device designated to show stockholders and creditors whether the firm is making money.
It can also be used as a tool to identify the factors that affect the degree of profitability.<br>
1.4.2 Income Statement
The balance sheet offers a view of the firm at a moment in time, whereas the income statement summarizes the profitability of operations over a period of time.
It is an accounting device designated to show stockholders and creditors whether the firm is making money.
It can also be used as a tool to identify the factors that affect the degree of profitability.<br>
14
14 1. Financial Statements 1.4 Forms of Financial Statements
1.4.2 Income Statement
A. Revenue
Revenues are earnings from the sale of goods or services to customers.
Revenue is recognized in the period in which goods and services are sold, not necessarily the period in which cash is received.
B. Expense
Expenses are the dollar amount of resources used up by the entity to earn revenues during a period.
An expense is recognized in the period in which goods and services are used, not necessarily the period in which cash is paid.<br>
1.4.2 Income Statement
A. Revenue
Revenues are earnings from the sale of goods or services to customers.
Revenue is recognized in the period in which goods and services are sold, not necessarily the period in which cash is received.
B. Expense
Expenses are the dollar amount of resources used up by the entity to earn revenues during a period.
An expense is recognized in the period in which goods and services are used, not necessarily the period in which cash is paid.<br>
15
15 1. Financial Statements 1.4 Forms of Financial Statements
1.4.3 Cash Flow Statement
The income statement shows how much the company has lost or gained, but does not indicate financing and investment activities during the period.
Therefore, an additional financial statement is required which can show how the company generated the cash and how it has spent or utilized it.
This statement is known as the cash flow statement.<br>
1.4.3 Cash Flow Statement
The income statement shows how much the company has lost or gained, but does not indicate financing and investment activities during the period.
Therefore, an additional financial statement is required which can show how the company generated the cash and how it has spent or utilized it.
This statement is known as the cash flow statement.<br>
16
16 1. Financial Statements 1.4 Forms of Financial Statements
1.4.3 Cash Flow Statement
Cash flow statement shows the movement of funds into the firm’s current asset accounts from external sources such as stockholders, creditors and customers.
It also shows the movement of funds to meet the firm’s obligation, or pay dividends.
The movements are shown for a specific period, normally the same time period as the firm’s income statement.<br>
1.4.3 Cash Flow Statement
Cash flow statement shows the movement of funds into the firm’s current asset accounts from external sources such as stockholders, creditors and customers.
It also shows the movement of funds to meet the firm’s obligation, or pay dividends.
The movements are shown for a specific period, normally the same time period as the firm’s income statement.<br>
17
17 1. Financial Statements 1.5 Reporting Format
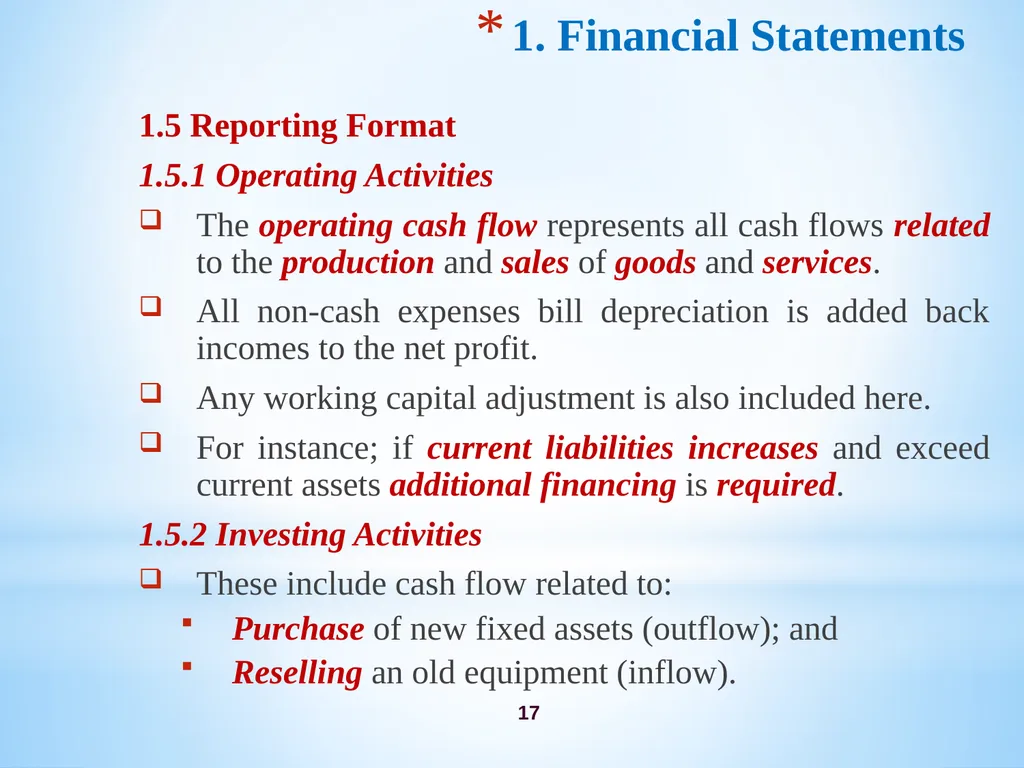
1.5.1 Operating Activities
The operating cash flow represents all cash flows related to the production and sales of goods and services.
All non-cash expenses bill depreciation is added back incomes to the net profit.
Any working capital adjustment is also included here.
For instance; if current liabilities increases and exceed current assets additional financing is required.
1.5.2 Investing Activities
These include cash flow related to:
Purchase of new fixed assets (outflow); and
Reselling an old equipment (inflow).<br>
1.5.1 Operating Activities
The operating cash flow represents all cash flows related to the production and sales of goods and services.
All non-cash expenses bill depreciation is added back incomes to the net profit.
Any working capital adjustment is also included here.
For instance; if current liabilities increases and exceed current assets additional financing is required.
1.5.2 Investing Activities
These include cash flow related to:
Purchase of new fixed assets (outflow); and
Reselling an old equipment (inflow).<br>
18
18 1. Financial Statements 1.5 Reporting Format
1.5.3 Financing Activities
These include cash flow related to:
Purchasing stocks (outflow);
Selling stocks (inflow); and
Paying loans (outflow).<br>
1.5.3 Financing Activities
These include cash flow related to:
Purchasing stocks (outflow);
Selling stocks (inflow); and
Paying loans (outflow).<br>
19
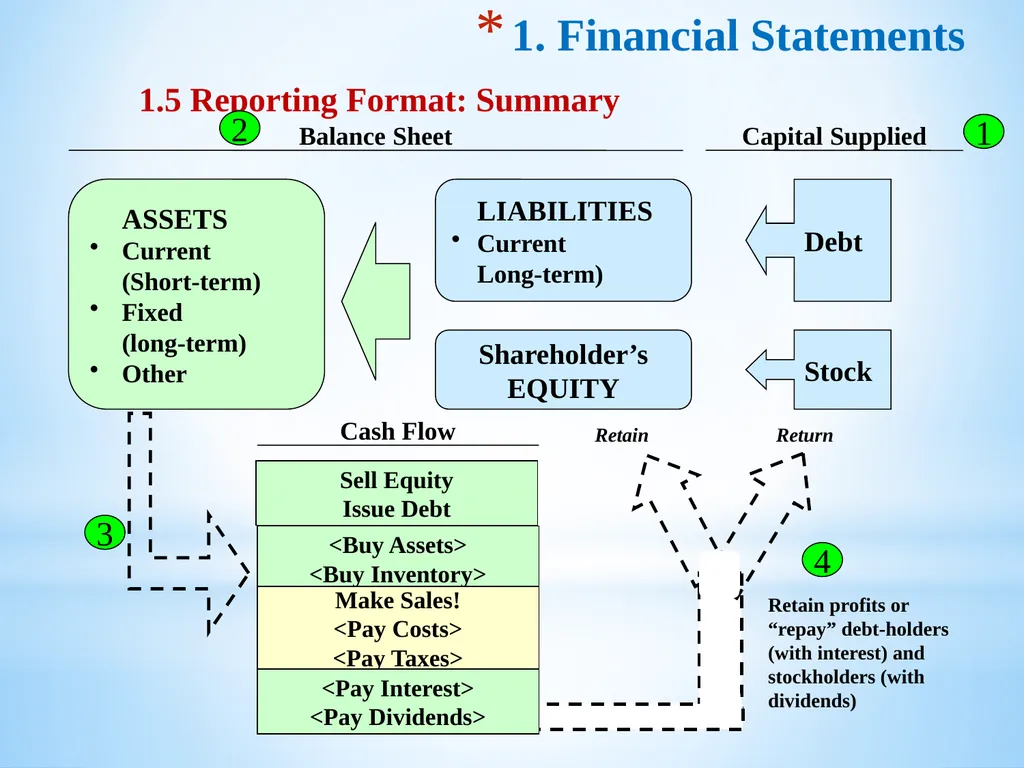
19 1. Financial Statements 1.5 Reporting Format: Summary<br>
20
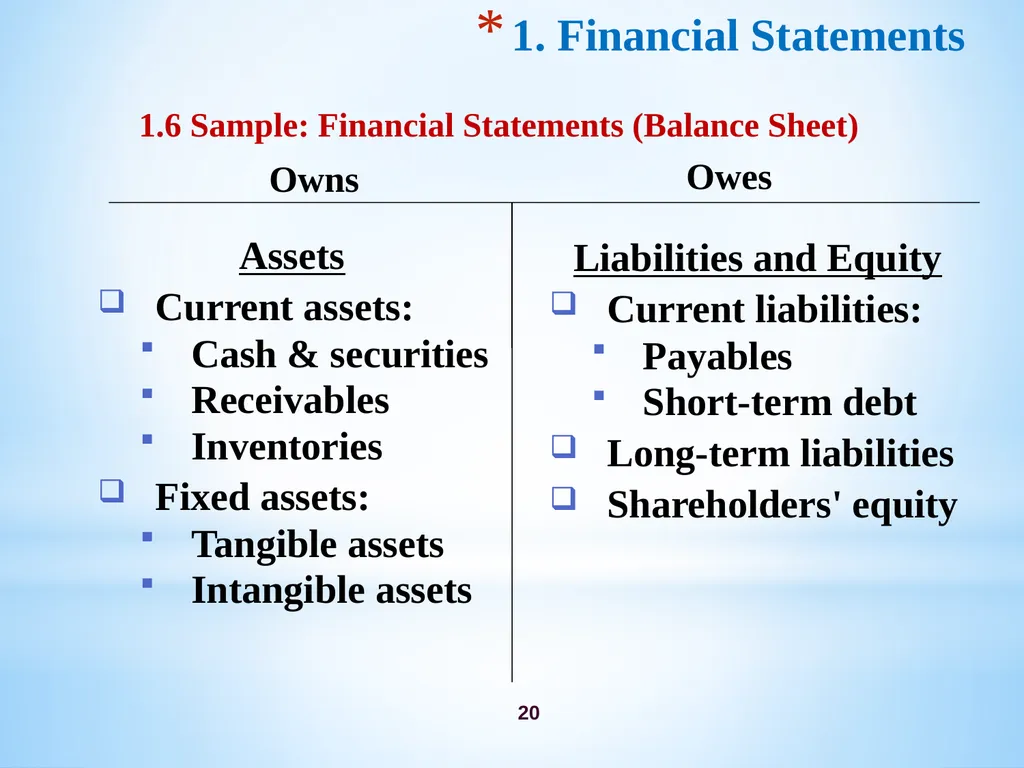
20 1. Financial Statements 1.6 Sample: Financial Statements (Balance Sheet) Assets
Current assets:
Cash & securities
Receivables
Inventories
Fixed assets:
Tangible assets
Intangible assets Liabilities and Equity
Current liabilities:
Payables
Short-term debt
Long-term liabilities
Shareholders' equity<br>
Current assets:
Cash & securities
Receivables
Inventories
Fixed assets:
Tangible assets
Intangible assets Liabilities and Equity
Current liabilities:
Payables
Short-term debt
Long-term liabilities
Shareholders' equity<br>
21
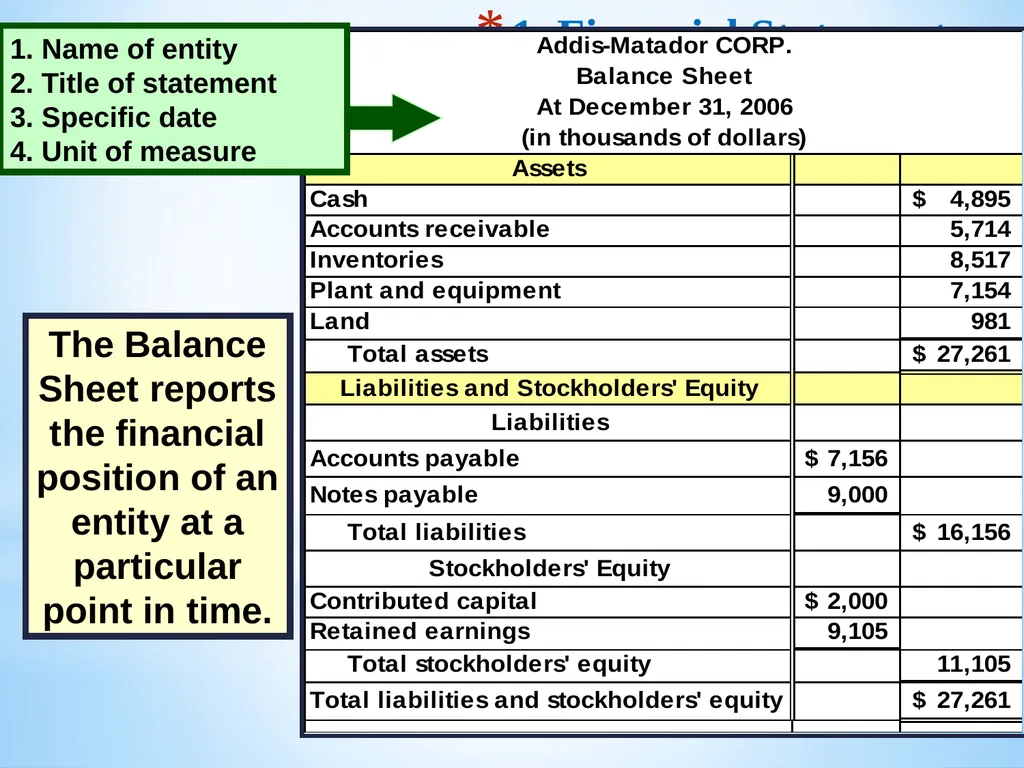
21 1. Financial Statements 1.6 Sample: Financial Statements (Balance Sheet) The Balance Sheet reports the financial position of an entity at a particular point in time.<br>
22
22 1. Financial Statements 1.6 Sample: Financial Statements (Balance Sheet) Use $ on the first item in a group
and on the group total.<br>
and on the group total.<br>
23
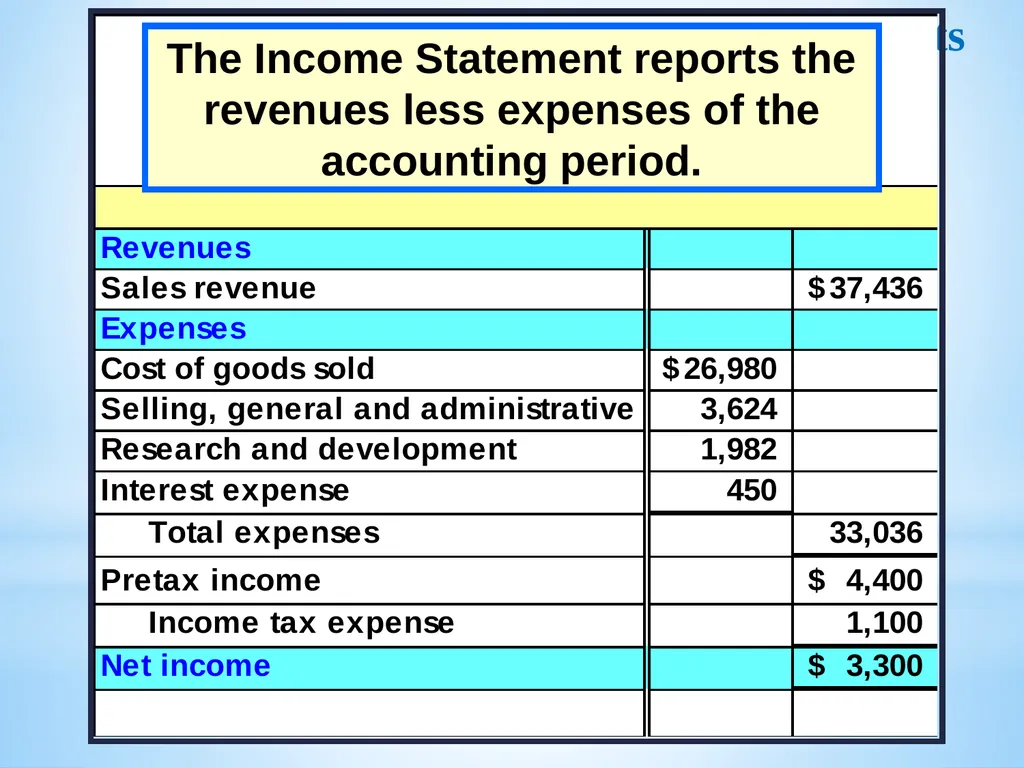
23 1. Financial Statements 1.6 Sample: Financial Statements (Balance Sheet) The Income Statement reports the revenues less expenses of the accounting period.<br>
24
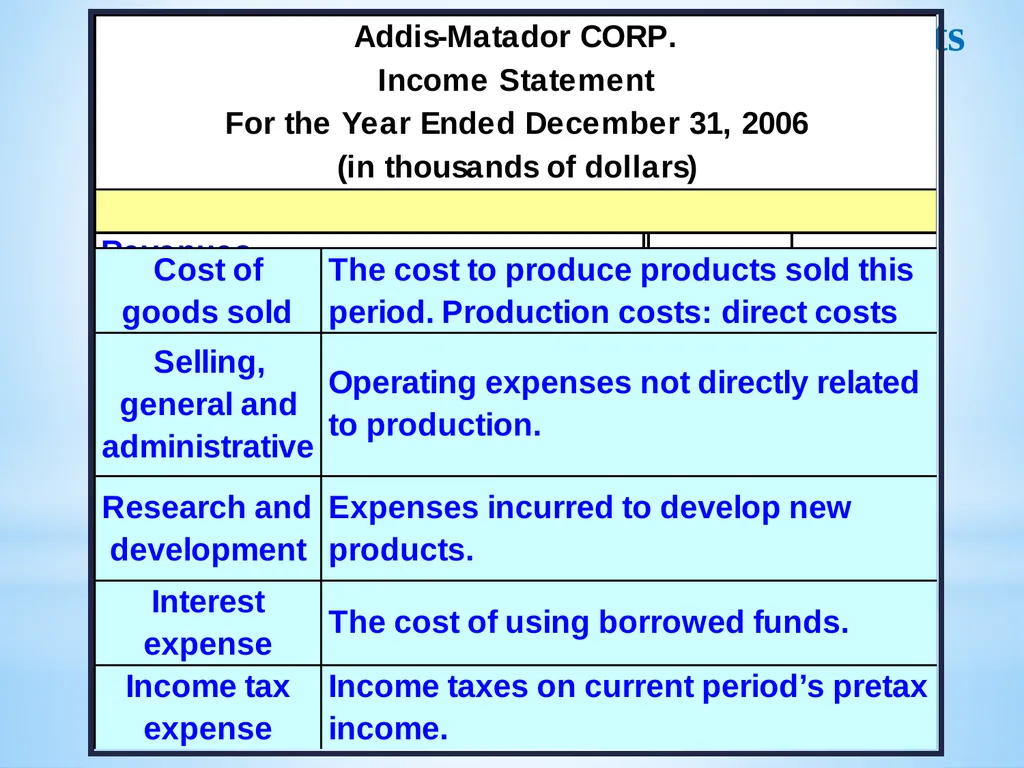
24 1. Financial Statements 1.6 Sample: Financial Statements (Balance Sheet)<br>
25
25 1. Financial Statements 1.6 Sample: Cash Flow Statements
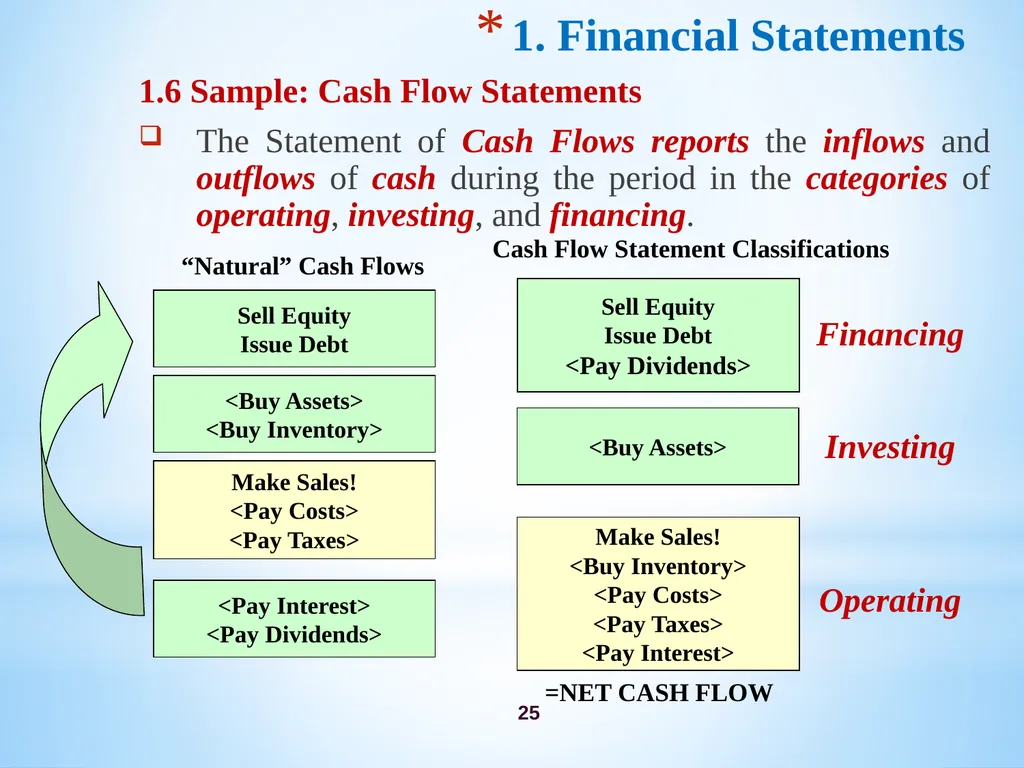
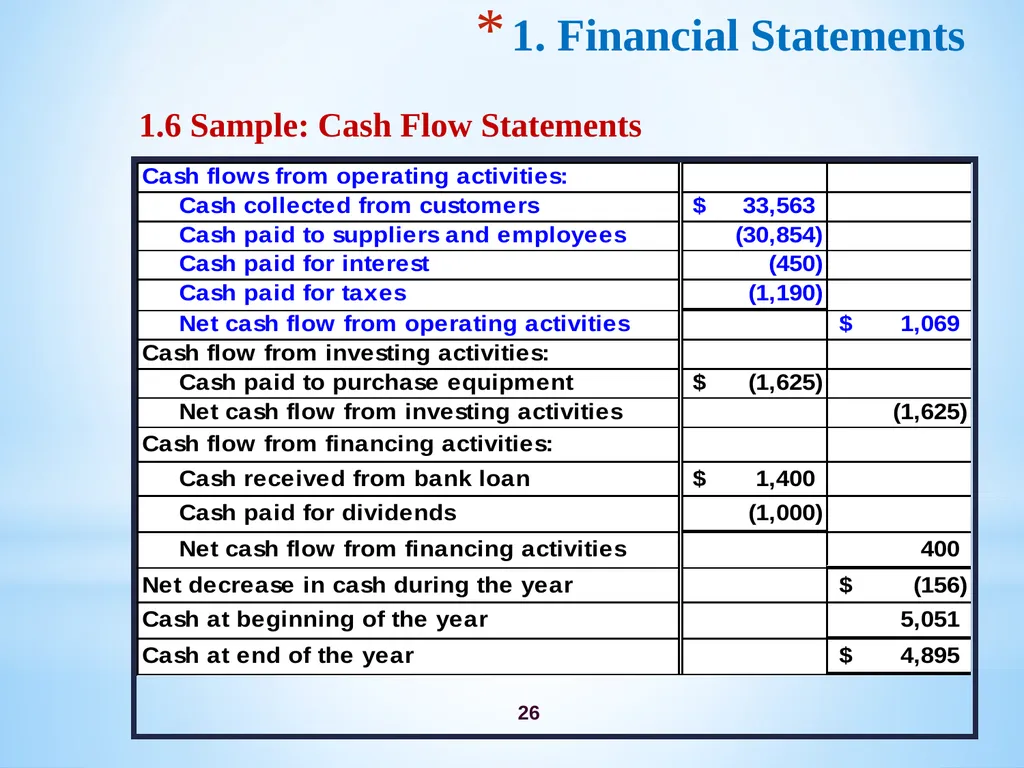
The Statement of Cash Flows reports the inflows and outflows of cash during the period in the categories of operating, investing, and financing. Sell Equity
Issue Debt <Buy Assets>
<Buy Inventory> Make Sales!
<Pay Costs>
<Pay Taxes> “Natural” Cash Flows <Pay Interest>
<Pay Dividends> Sell Equity
Issue Debt
<Pay Dividends> <Buy Assets> Make Sales!
<Buy Inventory>
<Pay Costs>
<Pay Taxes>
<Pay Interest> Cash Flow Statement Classifications Financing Investing Operating =NET CASH FLOW<br>
The Statement of Cash Flows reports the inflows and outflows of cash during the period in the categories of operating, investing, and financing. Sell Equity
Issue Debt <Buy Assets>
<Buy Inventory> Make Sales!
<Pay Costs>
<Pay Taxes> “Natural” Cash Flows <Pay Interest>
<Pay Dividends> Sell Equity
Issue Debt
<Pay Dividends> <Buy Assets> Make Sales!
<Buy Inventory>
<Pay Costs>
<Pay Taxes>
<Pay Interest> Cash Flow Statement Classifications Financing Investing Operating =NET CASH FLOW<br>
26
26 1. Financial Statements 1.6 Sample: Cash Flow Statements<br>
27
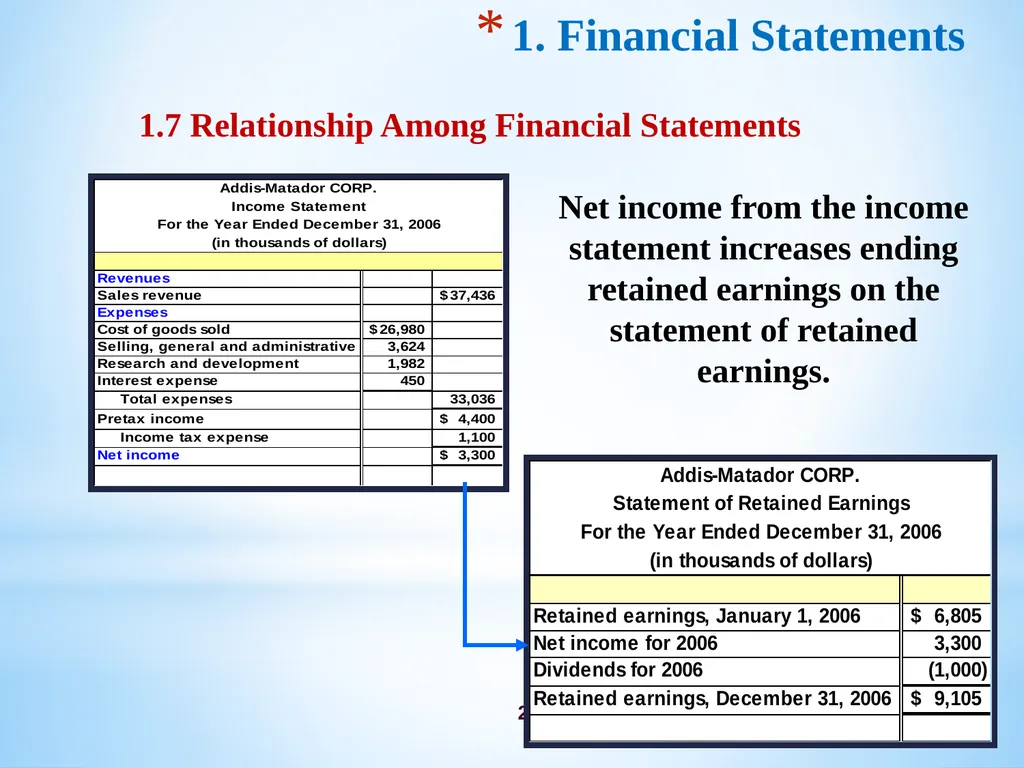
27 1. Financial Statements 1.7 Relationship Among Financial Statements Net income from the income statement increases ending retained earnings on the statement of retained earnings.<br>
28
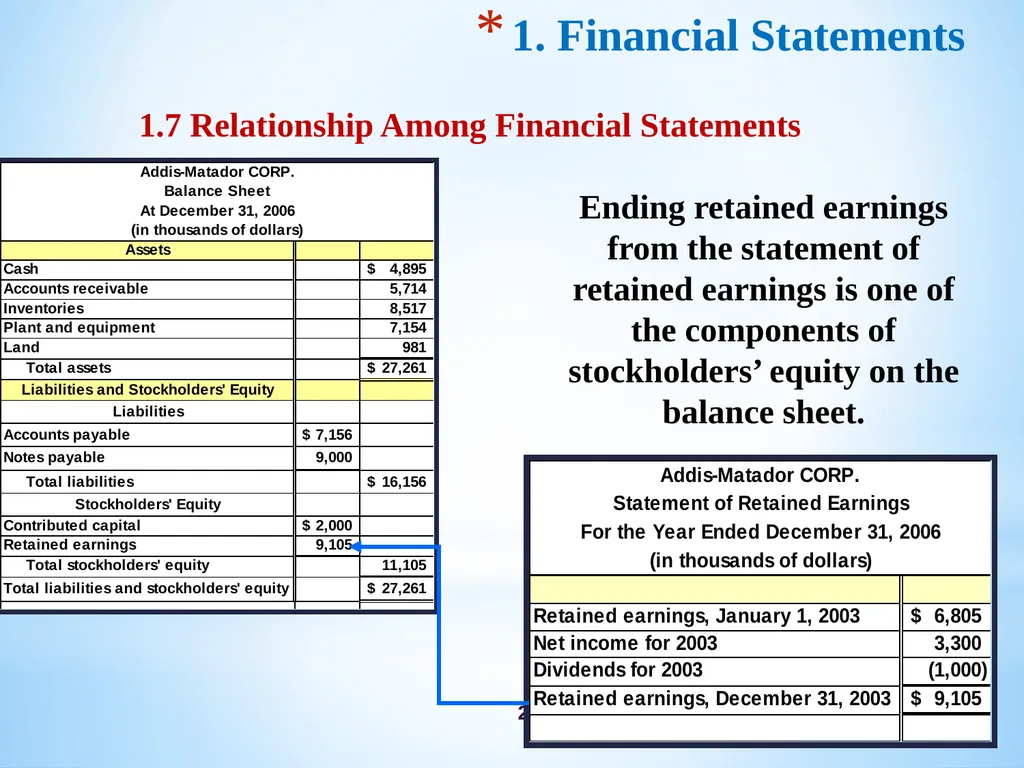
28 1. Financial Statements 1.7 Relationship Among Financial Statements Ending retained earnings from the statement of retained earnings is one of the components of stockholders’ equity on the balance sheet.<br>
29
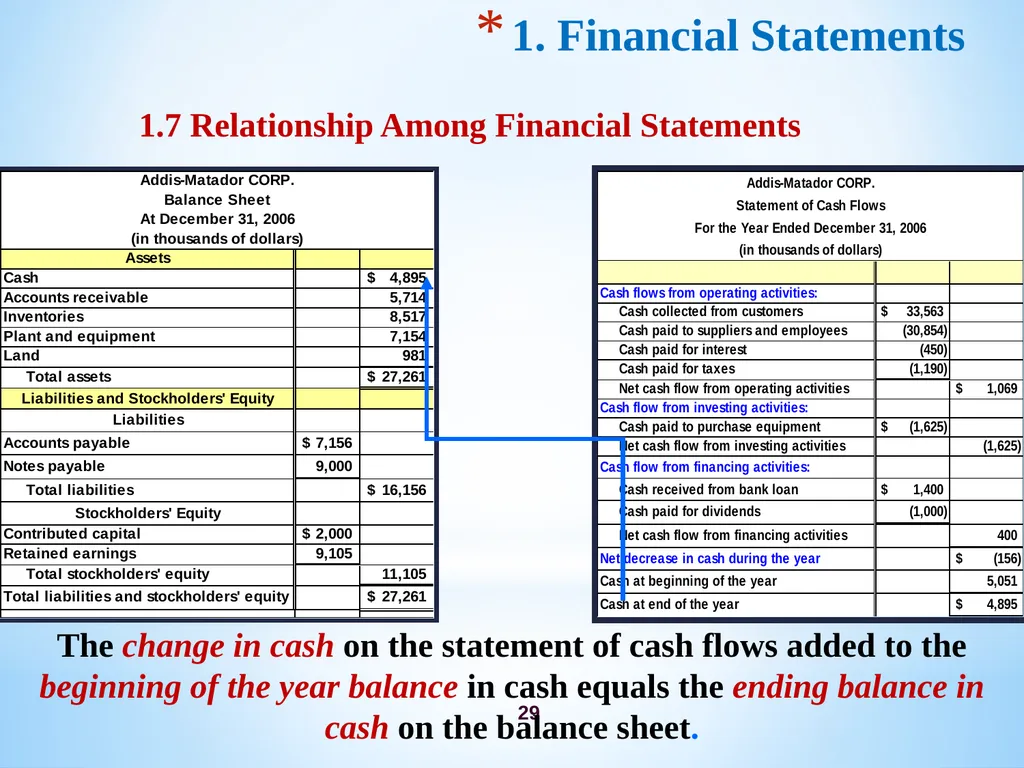
29 1. Financial Statements 1.7 Relationship Among Financial Statements The change in cash on the statement of cash flows added to the beginning of the year balance in cash equals the ending balance in cash on the balance sheet.<br>
30
30 2. Financial Analysis 2.1 General
Financial analysis is done to find firm’s financial strengths and weaknesses through the assessment of the firm’s past, present and future financial conditions
If properly analyzed and interpreted, financial statements can provide valuable insights into a firm’s performance.
Analysis of financial statements is of interest to:
Lenders (short-term as well as long-term);
Investors;
Security analysts; and
Managers, public and others.<br>
Financial analysis is done to find firm’s financial strengths and weaknesses through the assessment of the firm’s past, present and future financial conditions
If properly analyzed and interpreted, financial statements can provide valuable insights into a firm’s performance.
Analysis of financial statements is of interest to:
Lenders (short-term as well as long-term);
Investors;
Security analysts; and
Managers, public and others.<br>
31
31 2. Financial Analysis 2.1 General
Financial statements analysis is helpful in assessing:
Corporate excellence;
Judging creditworthiness;
Forecasting bond ratings; and
Predicting bankruptcy and assessing market risks.
Primary Tools:
Financial Statements; and
Comparison of financial ratios to past, industry, sector and all firms.<br>
Financial statements analysis is helpful in assessing:
Corporate excellence;
Judging creditworthiness;
Forecasting bond ratings; and
Predicting bankruptcy and assessing market risks.
Primary Tools:
Financial Statements; and
Comparison of financial ratios to past, industry, sector and all firms.<br>
32
32 2. Financial Analysis 2.1 General
2.1.1 Common Size Financial Statements
Each component of the statement is represented in terms of percentages.
Income statement: each item is calculated as a percent of net sales
Balance sheet: each item is calculated as a percent of assets or total liabilities and stockholder’s equity.
2.1.2 Comparative (Common-Base year) Financial Statements
Financial information reported side by side in vertical columns to see relationship and trends between years i.e. Trend Analysis.
Horizontal analysis shows birr and percent changes from year to year.<br>
2.1.1 Common Size Financial Statements
Each component of the statement is represented in terms of percentages.
Income statement: each item is calculated as a percent of net sales
Balance sheet: each item is calculated as a percent of assets or total liabilities and stockholder’s equity.
2.1.2 Comparative (Common-Base year) Financial Statements
Financial information reported side by side in vertical columns to see relationship and trends between years i.e. Trend Analysis.
Horizontal analysis shows birr and percent changes from year to year.<br>
33
33 2. Financial Analysis 2.1 General
2.1.3 Financial Statements Ratio Comparison
It should analyze ratios based upon standards of comparison such as:
Industry ratios and standards;
Similar businesses in the same industry (competition);
Past performance ratios; and
Prior years operating results.<br>
2.1.3 Financial Statements Ratio Comparison
It should analyze ratios based upon standards of comparison such as:
Industry ratios and standards;
Similar businesses in the same industry (competition);
Past performance ratios; and
Prior years operating results.<br>
34
34 2. Financial Analysis 2.2 Debt Management Analysis (Leverage Ratio)
This helps to see how a company manages or uses its debt and its ability to meet its repayment obligations.
2.2.1 Debt Ratio (DR)
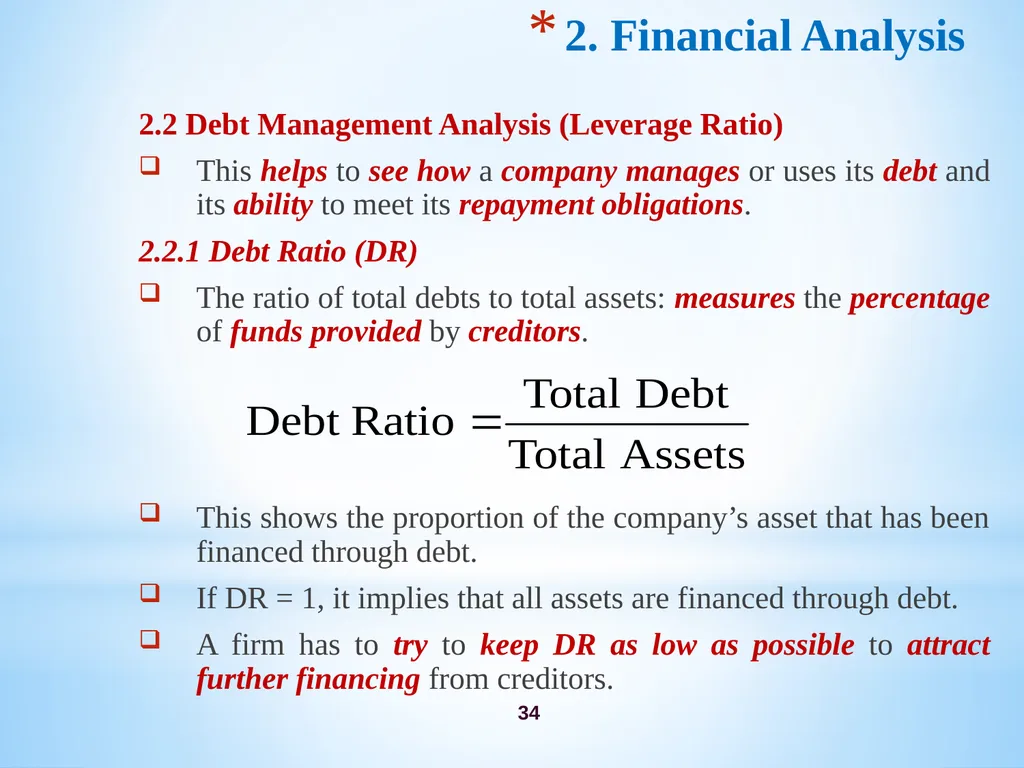
The ratio of total debts to total assets: measures the percentage of funds provided by creditors.
This shows the proportion of the company’s asset that has been financed through debt.
If DR = 1, it implies that all assets are financed through debt.
A firm has to try to keep DR as low as possible to attract further financing from creditors.<br>
This helps to see how a company manages or uses its debt and its ability to meet its repayment obligations.
2.2.1 Debt Ratio (DR)
The ratio of total debts to total assets: measures the percentage of funds provided by creditors.
This shows the proportion of the company’s asset that has been financed through debt.
If DR = 1, it implies that all assets are financed through debt.
A firm has to try to keep DR as low as possible to attract further financing from creditors.<br>
35
35 2. Financial Analysis 2.2 Debt Management Analysis (Leverage Ratio)
2.2.2 Times – Interest – Earned Ratio (TIER)
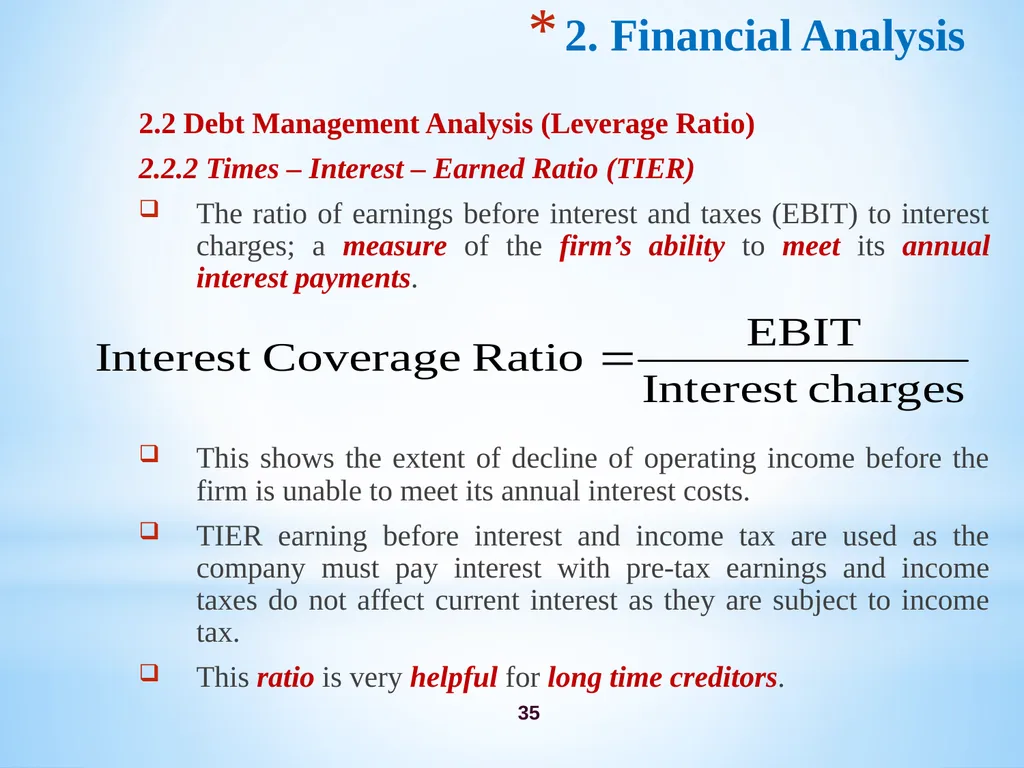
The ratio of earnings before interest and taxes (EBIT) to interest charges; a measure of the firm’s ability to meet its annual interest payments.
This shows the extent of decline of operating income before the firm is unable to meet its annual interest costs.
TIER earning before interest and income tax are used as the company must pay interest with pre-tax earnings and income taxes do not affect current interest as they are subject to income tax.
This ratio is very helpful for long time creditors.<br>
2.2.2 Times – Interest – Earned Ratio (TIER)
The ratio of earnings before interest and taxes (EBIT) to interest charges; a measure of the firm’s ability to meet its annual interest payments.
This shows the extent of decline of operating income before the firm is unable to meet its annual interest costs.
TIER earning before interest and income tax are used as the company must pay interest with pre-tax earnings and income taxes do not affect current interest as they are subject to income tax.
This ratio is very helpful for long time creditors.<br>
36
36 2. Financial Analysis 2.3 Liquidity Analysis
Working capital is the excess of current assets to current liabilities. It means that there exists a convertible asset to meet current obligations.
The net working capital shows the extent of the liquidity of the company.
Liquidity or the amount of working capital of a company is of interest to short term creditors as they need their payments to be effected in a short period of time.
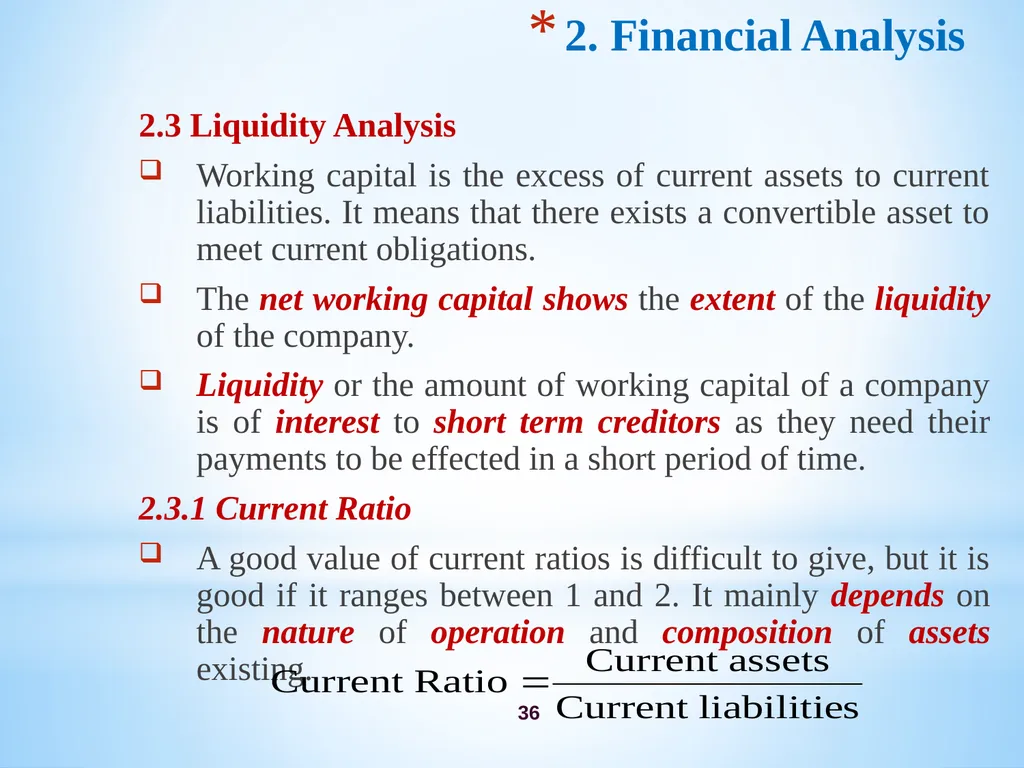
2.3.1 Current Ratio
A good value of current ratios is difficult to give, but it is good if it ranges between 1 and 2. It mainly depends on the nature of operation and composition of assets existing.<br>
Working capital is the excess of current assets to current liabilities. It means that there exists a convertible asset to meet current obligations.
The net working capital shows the extent of the liquidity of the company.
Liquidity or the amount of working capital of a company is of interest to short term creditors as they need their payments to be effected in a short period of time.
2.3.1 Current Ratio
A good value of current ratios is difficult to give, but it is good if it ranges between 1 and 2. It mainly depends on the nature of operation and composition of assets existing.<br>
37
37 2. Financial Analysis 2.3 Liquidity Analysis
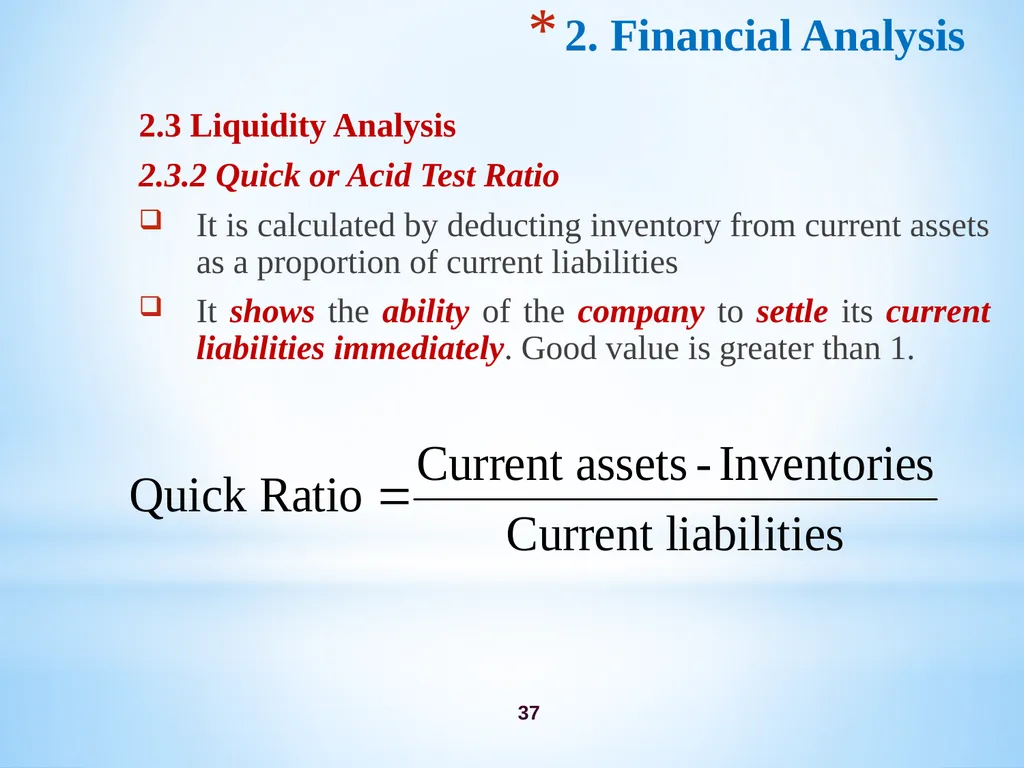
2.3.2 Quick or Acid Test Ratio
It is calculated by deducting inventory from current assets as a proportion of current liabilities
It shows the ability of the company to settle its current liabilities immediately. Good value is greater than 1.<br>
2.3.2 Quick or Acid Test Ratio
It is calculated by deducting inventory from current assets as a proportion of current liabilities
It shows the ability of the company to settle its current liabilities immediately. Good value is greater than 1.<br>
38
38 2. Financial Analysis 2.4 Asset Management Analysis
The asset management ratios measures how effectively the firm is managing its assets.
Too many assets:- to high cost of capital; and
Too low assets:- less profitable sales.
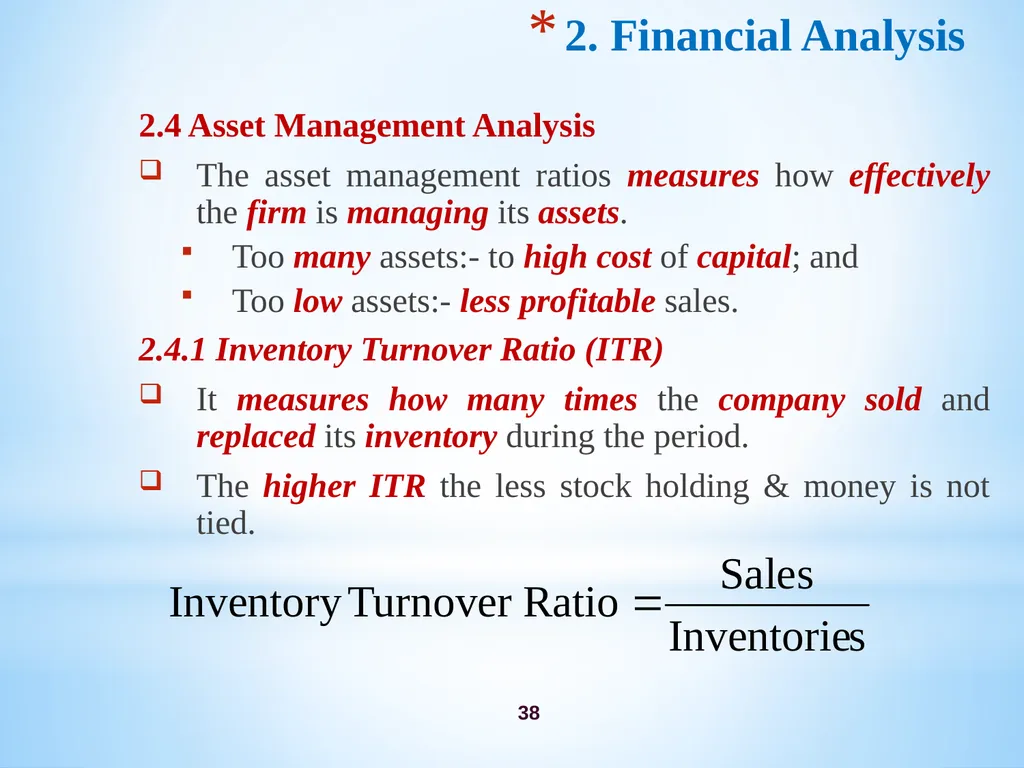
2.4.1 Inventory Turnover Ratio (ITR)
It measures how many times the company sold and replaced its inventory during the period.
The higher ITR the less stock holding & money is not tied.<br>
The asset management ratios measures how effectively the firm is managing its assets.
Too many assets:- to high cost of capital; and
Too low assets:- less profitable sales.
2.4.1 Inventory Turnover Ratio (ITR)
It measures how many times the company sold and replaced its inventory during the period.
The higher ITR the less stock holding & money is not tied.<br>
39
39 2. Financial Analysis 2.4 Asset Management Analysis
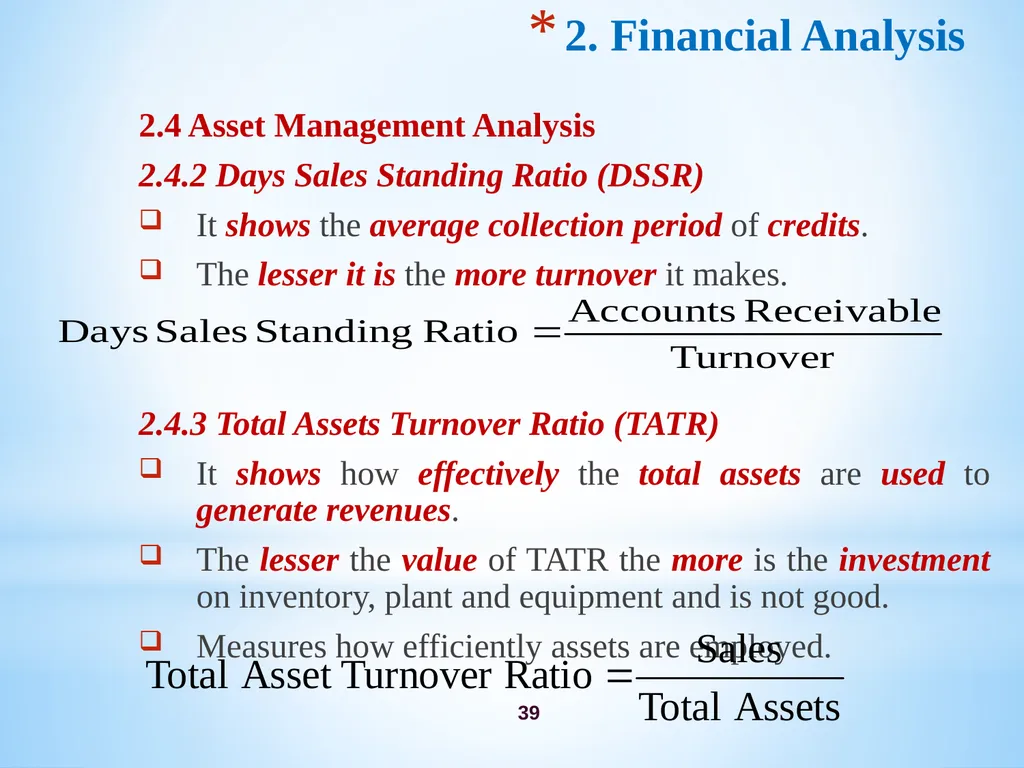
2.4.2 Days Sales Standing Ratio (DSSR)
It shows the average collection period of credits.
The lesser it is the more turnover it makes.
2.4.3 Total Assets Turnover Ratio (TATR)
It shows how effectively the total assets are used to generate revenues.
The lesser the value of TATR the more is the investment on inventory, plant and equipment and is not good.
Measures how efficiently assets are employed.<br>
2.4.2 Days Sales Standing Ratio (DSSR)
It shows the average collection period of credits.
The lesser it is the more turnover it makes.
2.4.3 Total Assets Turnover Ratio (TATR)
It shows how effectively the total assets are used to generate revenues.
The lesser the value of TATR the more is the investment on inventory, plant and equipment and is not good.
Measures how efficiently assets are employed.<br>
40
40 2. Financial Analysis 2.4 Asset Management Analysis
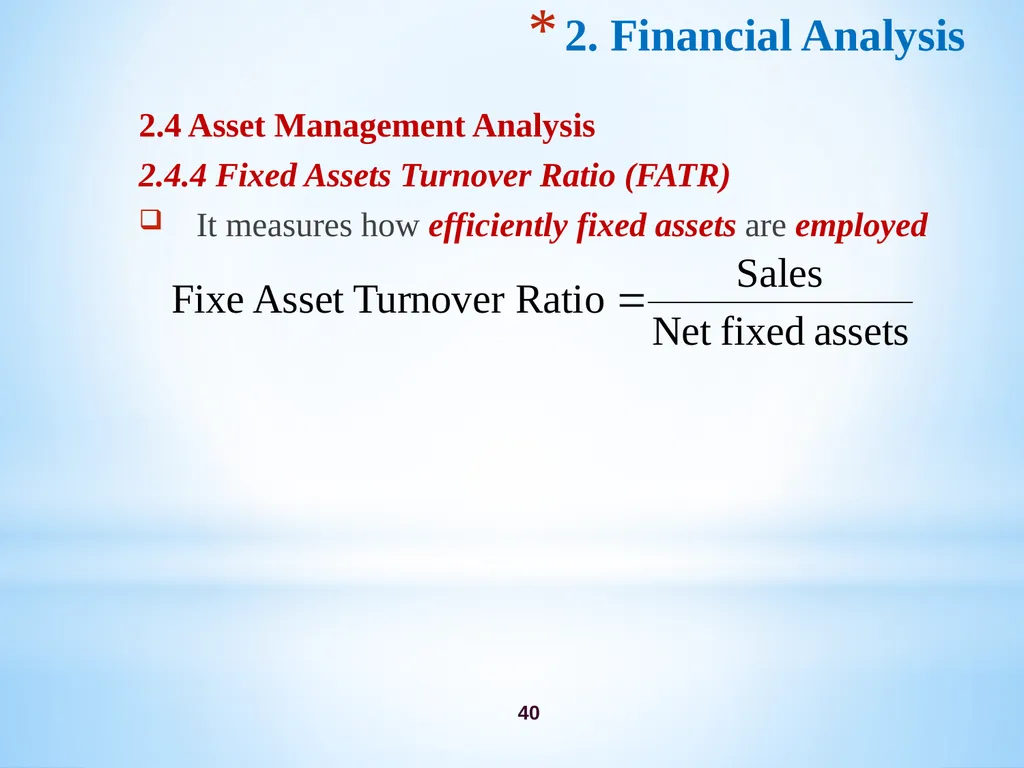
2.4.4 Fixed Assets Turnover Ratio (FATR)
It measures how efficiently fixed assets are employed<br>
2.4.4 Fixed Assets Turnover Ratio (FATR)
It measures how efficiently fixed assets are employed<br>
41
41 2. Financial Analysis 2.5 Profitability Analysis
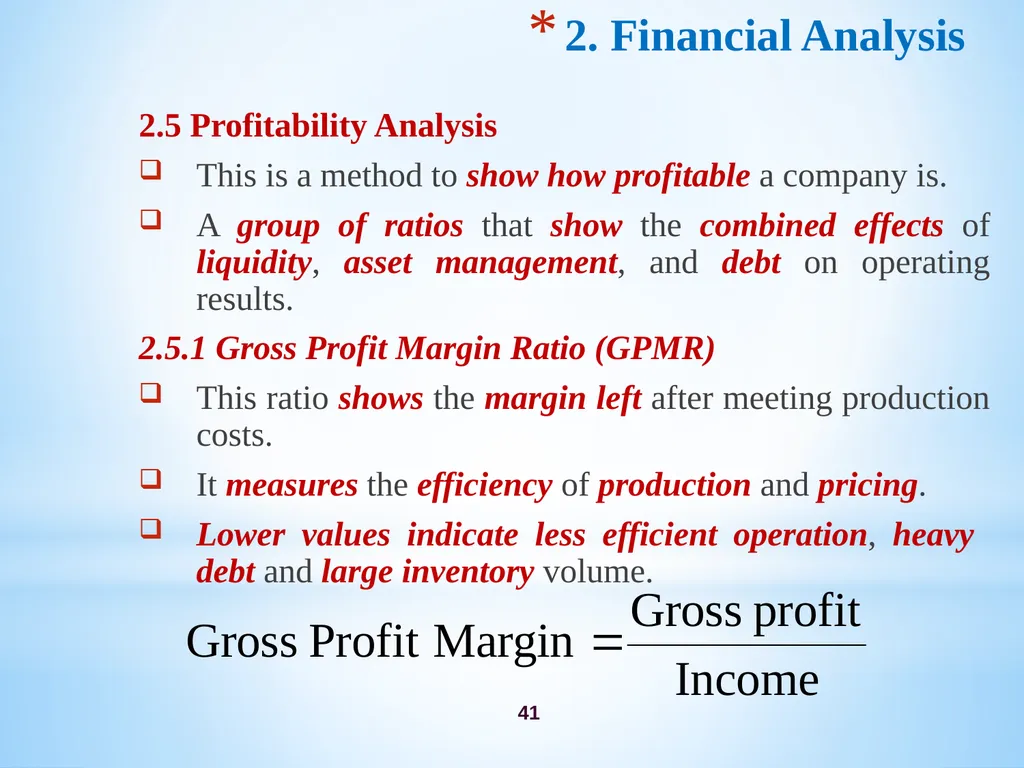
This is a method to show how profitable a company is.
A group of ratios that show the combined effects of liquidity, asset management, and debt on operating results.
2.5.1 Gross Profit Margin Ratio (GPMR)
This ratio shows the margin left after meeting production costs.
It measures the efficiency of production and pricing.
Lower values indicate less efficient operation, heavy debt and large inventory volume.<br>
This is a method to show how profitable a company is.
A group of ratios that show the combined effects of liquidity, asset management, and debt on operating results.
2.5.1 Gross Profit Margin Ratio (GPMR)
This ratio shows the margin left after meeting production costs.
It measures the efficiency of production and pricing.
Lower values indicate less efficient operation, heavy debt and large inventory volume.<br>
42
42 2. Financial Analysis 2.5 Profitability Analysis
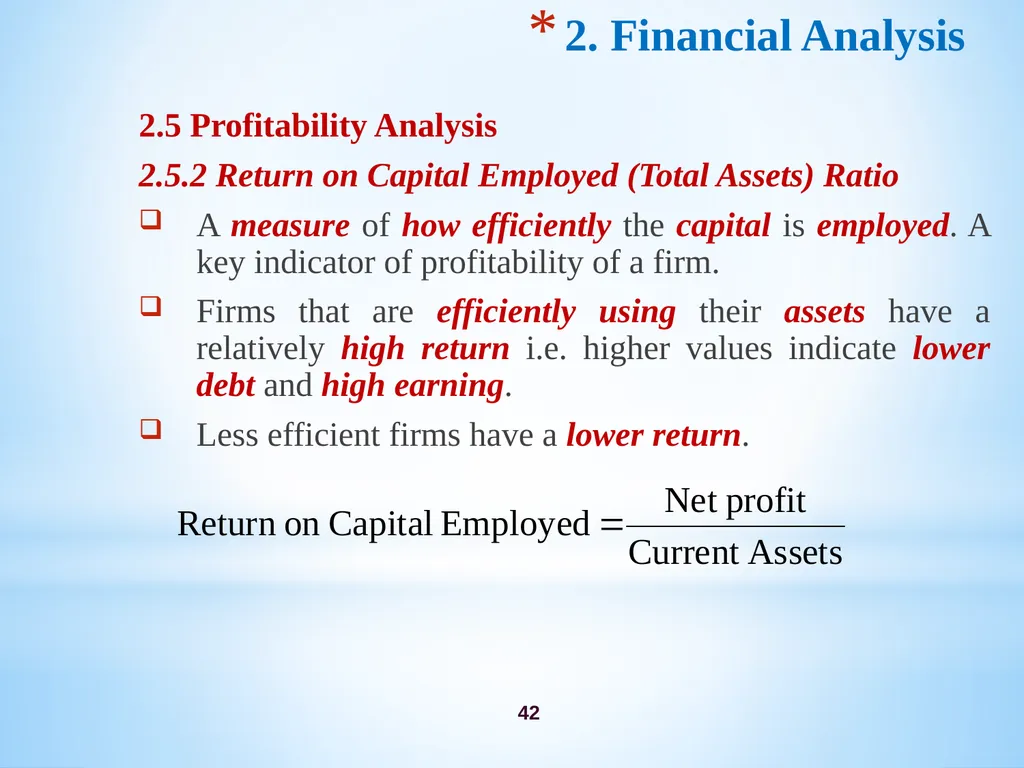
2.5.2 Return on Capital Employed (Total Assets) Ratio
A measure of how efficiently the capital is employed. A key indicator of profitability of a firm.
Firms that are efficiently using their assets have a relatively high return i.e. higher values indicate lower debt and high earning.
Less efficient firms have a lower return.<br>
2.5.2 Return on Capital Employed (Total Assets) Ratio
A measure of how efficiently the capital is employed. A key indicator of profitability of a firm.
Firms that are efficiently using their assets have a relatively high return i.e. higher values indicate lower debt and high earning.
Less efficient firms have a lower return.<br>
43
43 2. Financial Analysis 2.5 Profitability Analysis
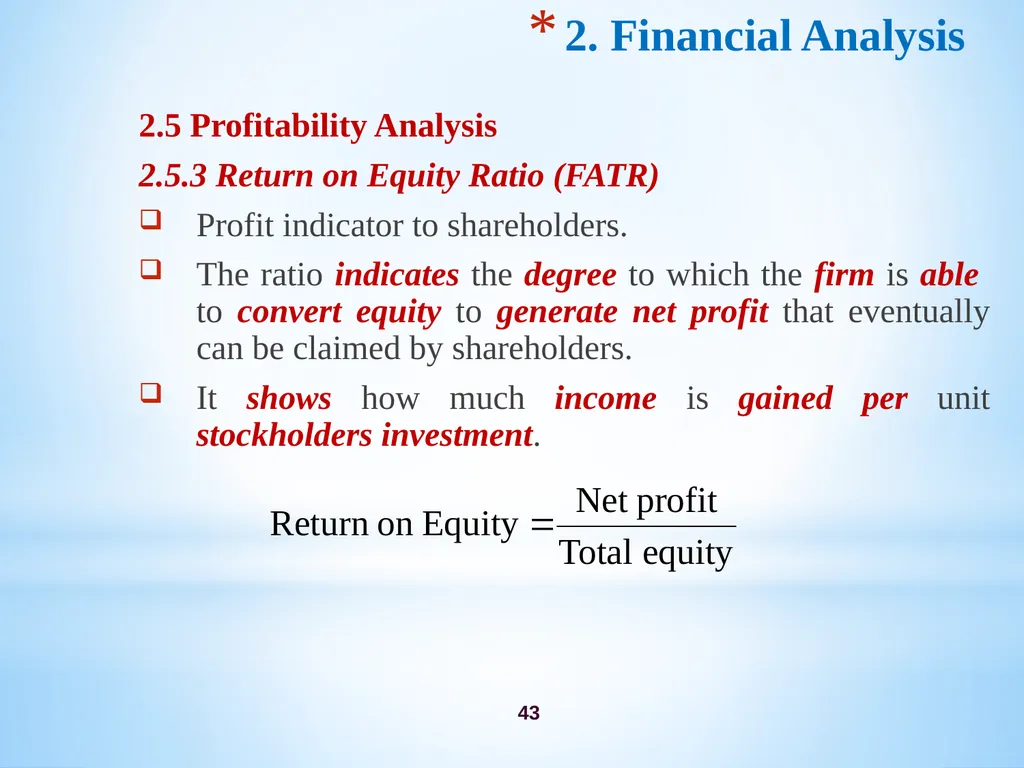
2.5.3 Return on Equity Ratio (FATR)
Profit indicator to shareholders.
The ratio indicates the degree to which the firm is able to convert equity to generate net profit that eventually can be claimed by shareholders.
It shows how much income is gained per unit stockholders investment.<br>
2.5.3 Return on Equity Ratio (FATR)
Profit indicator to shareholders.
The ratio indicates the degree to which the firm is able to convert equity to generate net profit that eventually can be claimed by shareholders.
It shows how much income is gained per unit stockholders investment.<br>
44
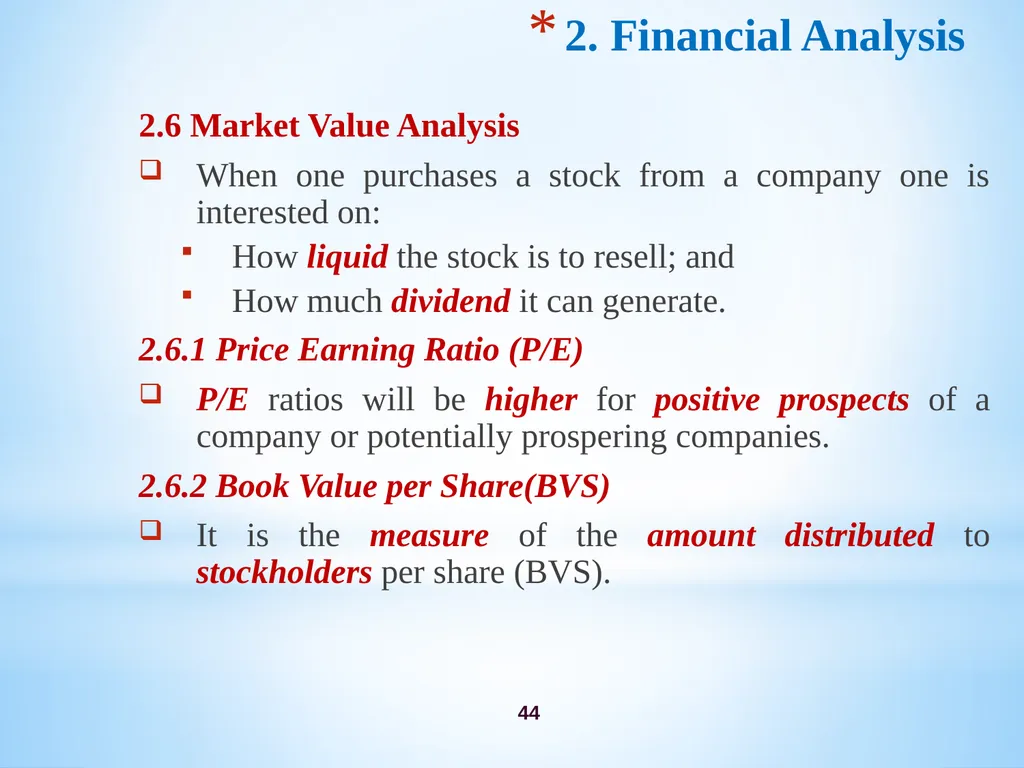
44 2. Financial Analysis 2.6 Market Value Analysis
When one purchases a stock from a company one is interested on:
How liquid the stock is to resell; and
How much dividend it can generate.
2.6.1 Price Earning Ratio (P/E)
P/E ratios will be higher for positive prospects of a company or potentially prospering companies.
2.6.2 Book Value per Share(BVS)
It is the measure of the amount distributed to stockholders per share (BVS).<br>
When one purchases a stock from a company one is interested on:
How liquid the stock is to resell; and
How much dividend it can generate.
2.6.1 Price Earning Ratio (P/E)
P/E ratios will be higher for positive prospects of a company or potentially prospering companies.
2.6.2 Book Value per Share(BVS)
It is the measure of the amount distributed to stockholders per share (BVS).<br>
45
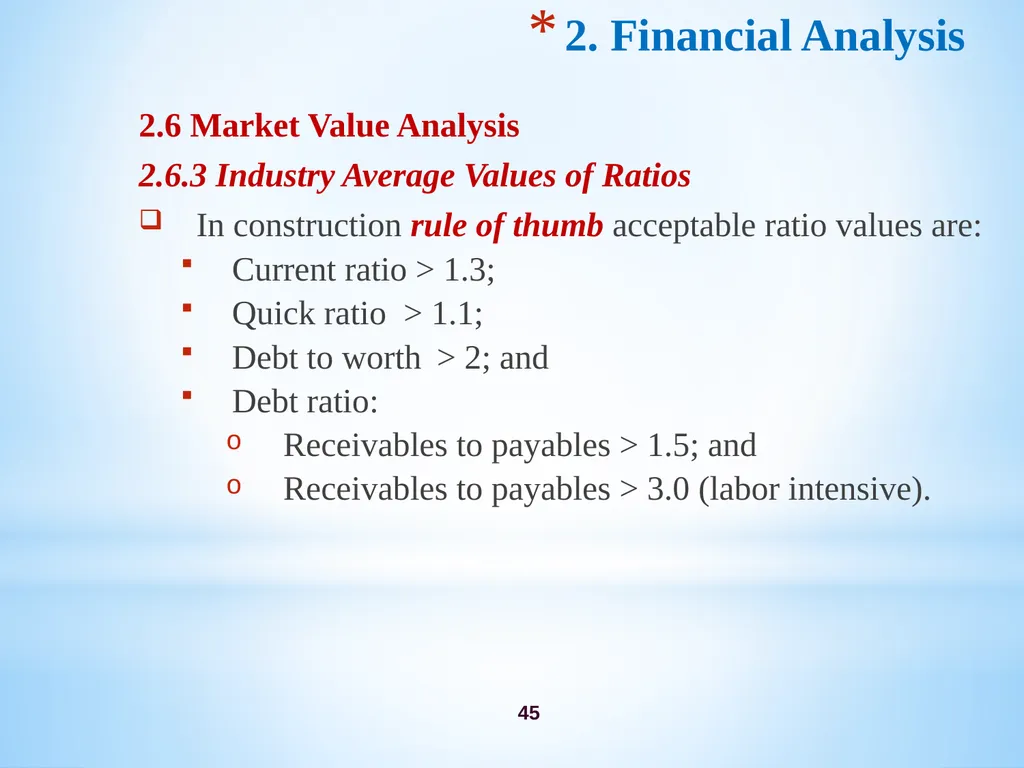
45 2. Financial Analysis 2.6 Market Value Analysis
2.6.3 Industry Average Values of Ratios
In construction rule of thumb acceptable ratio values are:
Current ratio > 1.3;
Quick ratio > 1.1;
Debt to worth > 2; and
Debt ratio:
Receivables to payables > 1.5; and
Receivables to payables > 3.0 (labor intensive).<br>
2.6.3 Industry Average Values of Ratios
In construction rule of thumb acceptable ratio values are:
Current ratio > 1.3;
Quick ratio > 1.1;
Debt to worth > 2; and
Debt ratio:
Receivables to payables > 1.5; and
Receivables to payables > 3.0 (labor intensive).<br>
46
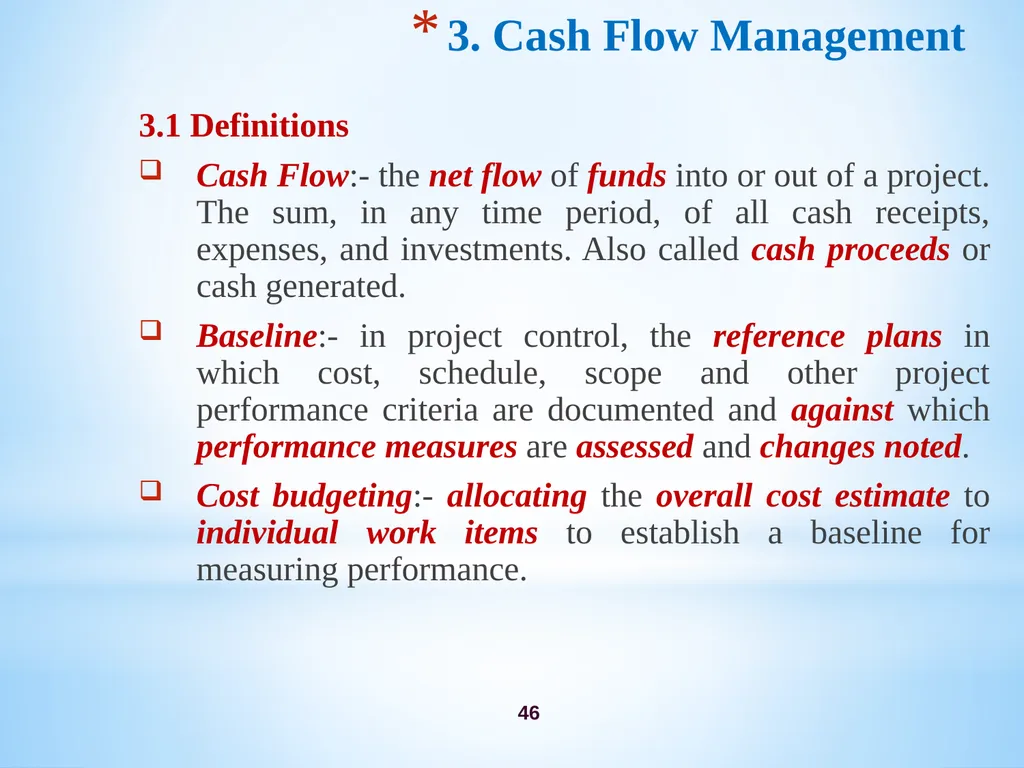
46 3. Cash Flow Management 3.1 Definitions
Cash Flow:- the net flow of funds into or out of a project. The sum, in any time period, of all cash receipts, expenses, and investments. Also called cash proceeds or cash generated.
Baseline:- in project control, the reference plans in which cost, schedule, scope and other project performance criteria are documented and against which performance measures are assessed and changes noted.
Cost budgeting:- allocating the overall cost estimate to individual work items to establish a baseline for measuring performance.<br>
Cash Flow:- the net flow of funds into or out of a project. The sum, in any time period, of all cash receipts, expenses, and investments. Also called cash proceeds or cash generated.
Baseline:- in project control, the reference plans in which cost, schedule, scope and other project performance criteria are documented and against which performance measures are assessed and changes noted.
Cost budgeting:- allocating the overall cost estimate to individual work items to establish a baseline for measuring performance.<br>
47
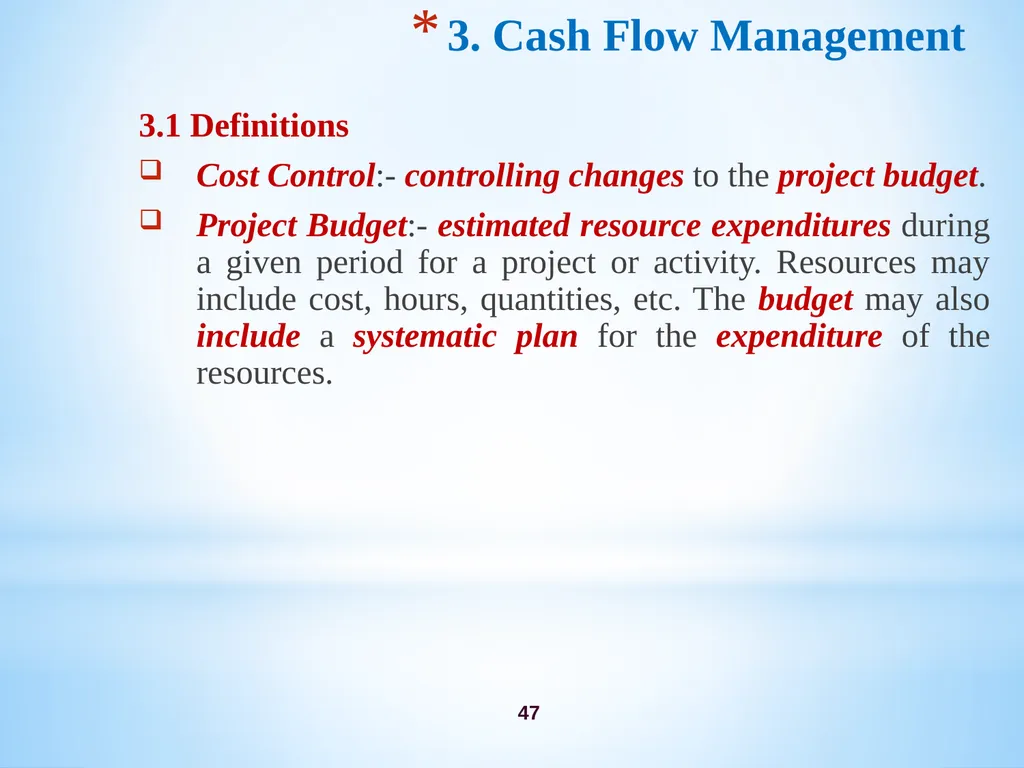
47 3. Cash Flow Management 3.1 Definitions
Cost Control:- controlling changes to the project budget.
Project Budget:- estimated resource expenditures during a given period for a project or activity. Resources may include cost, hours, quantities, etc. The budget may also include a systematic plan for the expenditure of the resources.<br>
Cost Control:- controlling changes to the project budget.
Project Budget:- estimated resource expenditures during a given period for a project or activity. Resources may include cost, hours, quantities, etc. The budget may also include a systematic plan for the expenditure of the resources.<br>
48
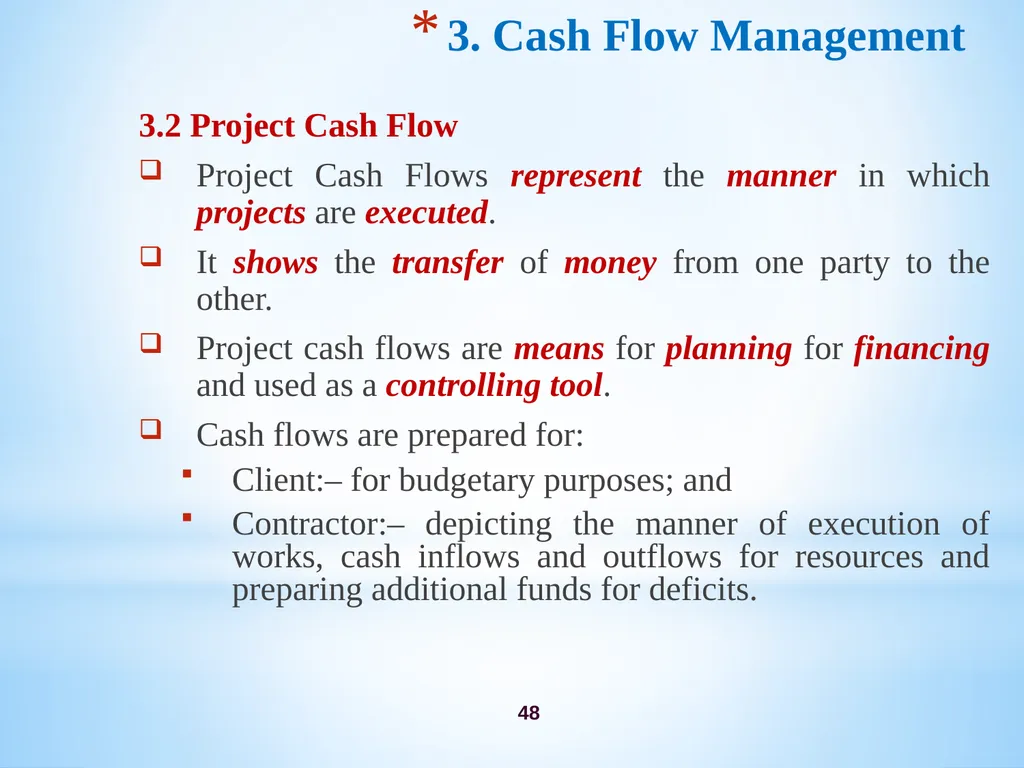
48 3. Cash Flow Management 3.2 Project Cash Flow
Project Cash Flows represent the manner in which projects are executed.
It shows the transfer of money from one party to the other.
Project cash flows are means for planning for financing and used as a controlling tool.
Cash flows are prepared for:
Client:– for budgetary purposes; and
Contractor:– depicting the manner of execution of works, cash inflows and outflows for resources and preparing additional funds for deficits.<br>
Project Cash Flows represent the manner in which projects are executed.
It shows the transfer of money from one party to the other.
Project cash flows are means for planning for financing and used as a controlling tool.
Cash flows are prepared for:
Client:– for budgetary purposes; and
Contractor:– depicting the manner of execution of works, cash inflows and outflows for resources and preparing additional funds for deficits.<br>
49
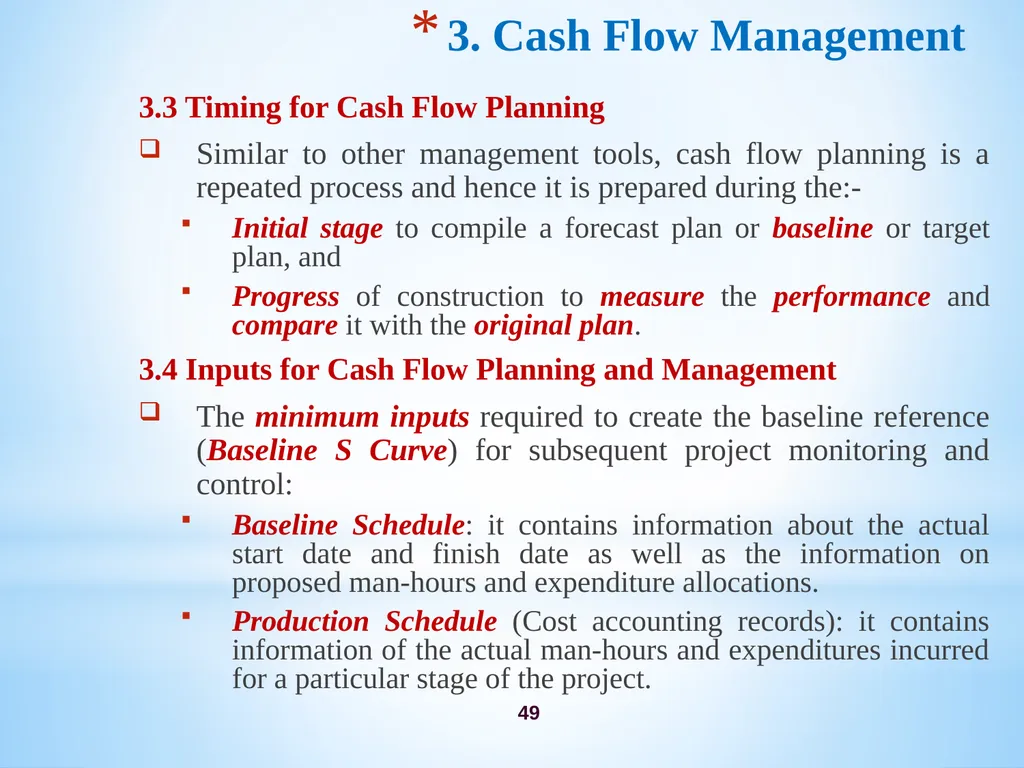
49 3. Cash Flow Management 3.3 Timing for Cash Flow Planning
Similar to other management tools, cash flow planning is a repeated process and hence it is prepared during the:-
Initial stage to compile a forecast plan or baseline or target plan, and
Progress of construction to measure the performance and compare it with the original plan.
3.4 Inputs for Cash Flow Planning and Management
The minimum inputs required to create the baseline reference (Baseline S Curve) for subsequent project monitoring and control:
Baseline Schedule: it contains information about the actual start date and finish date as well as the information on proposed man-hours and expenditure allocations.
Production Schedule (Cost accounting records): it contains information of the actual man-hours and expenditures incurred for a particular stage of the project.<br>
Similar to other management tools, cash flow planning is a repeated process and hence it is prepared during the:-
Initial stage to compile a forecast plan or baseline or target plan, and
Progress of construction to measure the performance and compare it with the original plan.
3.4 Inputs for Cash Flow Planning and Management
The minimum inputs required to create the baseline reference (Baseline S Curve) for subsequent project monitoring and control:
Baseline Schedule: it contains information about the actual start date and finish date as well as the information on proposed man-hours and expenditure allocations.
Production Schedule (Cost accounting records): it contains information of the actual man-hours and expenditures incurred for a particular stage of the project.<br>
50
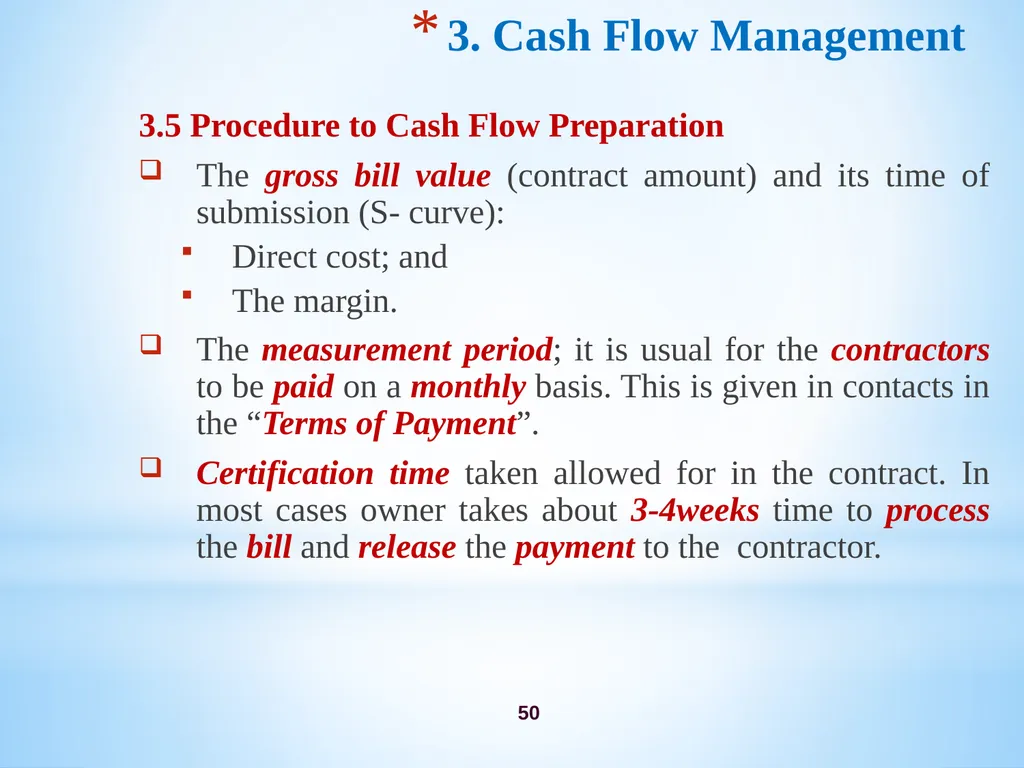
50 3. Cash Flow Management 3.5 Procedure to Cash Flow Preparation
The gross bill value (contract amount) and its time of submission (S- curve):
Direct cost; and
The margin.
The measurement period; it is usual for the contractors to be paid on a monthly basis. This is given in contacts in the “Terms of Payment”.
Certification time taken allowed for in the contract. In most cases owner takes about 3-4weeks time to process the bill and release the payment to the contractor.<br>
The gross bill value (contract amount) and its time of submission (S- curve):
Direct cost; and
The margin.
The measurement period; it is usual for the contractors to be paid on a monthly basis. This is given in contacts in the “Terms of Payment”.
Certification time taken allowed for in the contract. In most cases owner takes about 3-4weeks time to process the bill and release the payment to the contractor.<br>
51
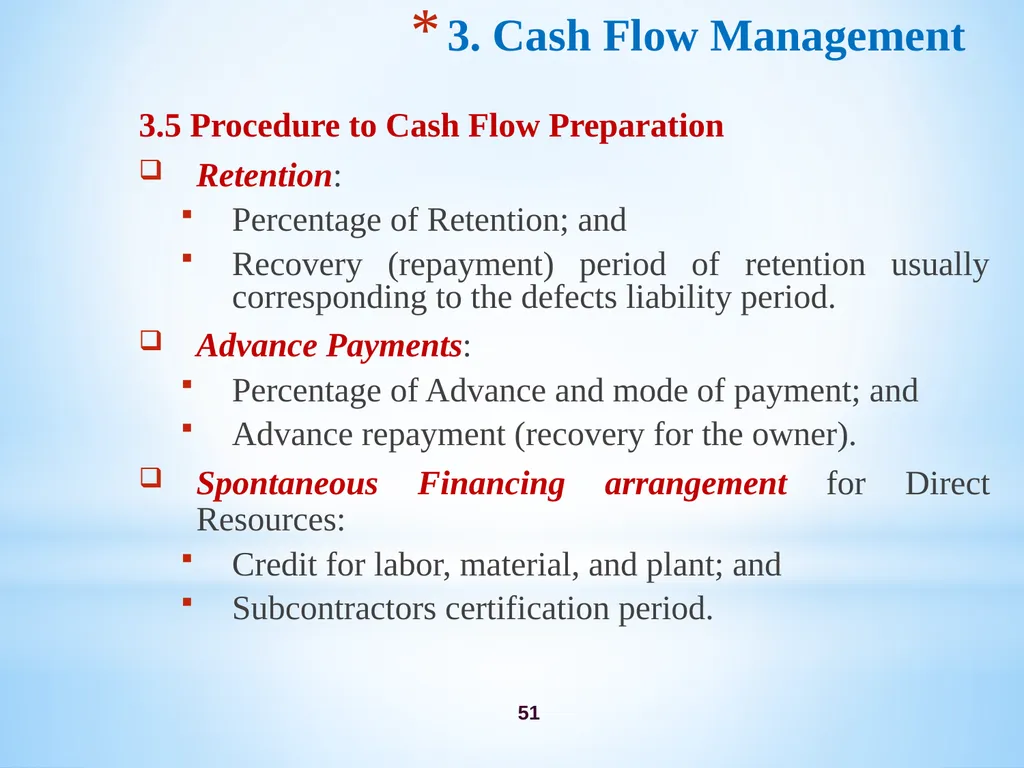
51 3. Cash Flow Management 3.5 Procedure to Cash Flow Preparation
Retention:
Percentage of Retention; and
Recovery (repayment) period of retention usually corresponding to the defects liability period.
Advance Payments:
Percentage of Advance and mode of payment; and
Advance repayment (recovery for the owner).
Spontaneous Financing arrangement for Direct Resources:
Credit for labor, material, and plant; and
Subcontractors certification period.<br>
Retention:
Percentage of Retention; and
Recovery (repayment) period of retention usually corresponding to the defects liability period.
Advance Payments:
Percentage of Advance and mode of payment; and
Advance repayment (recovery for the owner).
Spontaneous Financing arrangement for Direct Resources:
Credit for labor, material, and plant; and
Subcontractors certification period.<br>
52
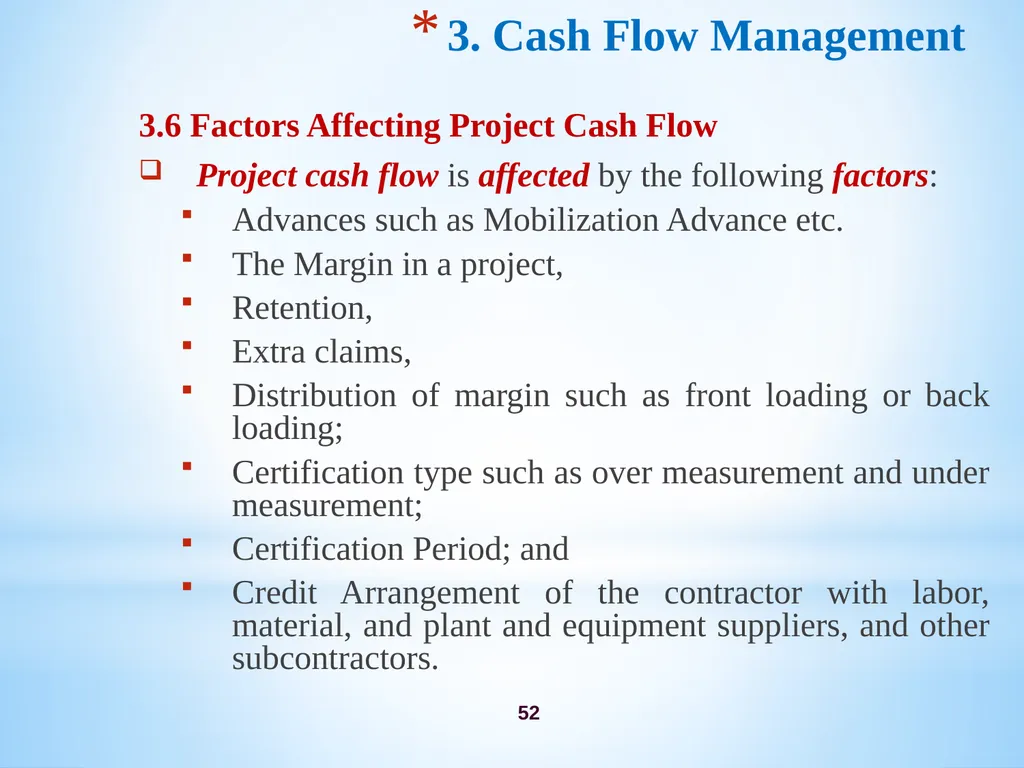
52 3. Cash Flow Management 3.6 Factors Affecting Project Cash Flow
Project cash flow is affected by the following factors:
Advances such as Mobilization Advance etc.
The Margin in a project,
Retention,
Extra claims,
Distribution of margin such as front loading or back loading;
Certification type such as over measurement and under measurement;
Certification Period; and
Credit Arrangement of the contractor with labor, material, and plant and equipment suppliers, and other subcontractors.<br>
Project cash flow is affected by the following factors:
Advances such as Mobilization Advance etc.
The Margin in a project,
Retention,
Extra claims,
Distribution of margin such as front loading or back loading;
Certification type such as over measurement and under measurement;
Certification Period; and
Credit Arrangement of the contractor with labor, material, and plant and equipment suppliers, and other subcontractors.<br>
53
53 3. Cash Flow Management 3.7 Cost Baseline Development
Project management includes a variety of responsibilities in order to achieve maximum results for their employer.
With regard to money and remaining in business, providing a budget that is adjusted to time is considered a cost baseline.
Cost baseline is used as a reference in which cost performance is measured and monitored.
This cost baseline is created by estimating the costs by the particular period that the project would be completed. This cost estimation is usually illustrated in a S-curve.
Some of these cost baselines include resource baselines as well as production variations.
These measurements of various project performance aspects ensure that cost is evaluated in regards to the overall yield of a particular project.<br>
Project management includes a variety of responsibilities in order to achieve maximum results for their employer.
With regard to money and remaining in business, providing a budget that is adjusted to time is considered a cost baseline.
Cost baseline is used as a reference in which cost performance is measured and monitored.
This cost baseline is created by estimating the costs by the particular period that the project would be completed. This cost estimation is usually illustrated in a S-curve.
Some of these cost baselines include resource baselines as well as production variations.
These measurements of various project performance aspects ensure that cost is evaluated in regards to the overall yield of a particular project.<br>
54
54 3. Cash Flow Management 3.8 Approaches in Developing for Baseline Cost Control
Development of cost baseline control involves the following two broader steps which are divided into sub-steps:
Step 1: convert the original cost estimate into a project budget
Step 2: develop a cash flow projection.<br>
Development of cost baseline control involves the following two broader steps which are divided into sub-steps:
Step 1: convert the original cost estimate into a project budget
Step 2: develop a cash flow projection.<br>
55
55 3. Cash Flow Management 3.8 Approaches in Developing for Baseline Cost Control
3.8.1 Convert Cost Estimate into a Project Budget
A. Identify and segregate the Cost Accounts according to activity types from the cost estimate
For cost accounting purposes, labor and material quantities are aggregated by type no matter for which physical component they are employed.
From owner’s point of view, the decomposition of the project into functional elements (such as footings, foundation walls, elevator pit, etc) is preferred since the owner/supervisor can easily keep track of these design elements;<br>
3.8.1 Convert Cost Estimate into a Project Budget
A. Identify and segregate the Cost Accounts according to activity types from the cost estimate
For cost accounting purposes, labor and material quantities are aggregated by type no matter for which physical component they are employed.
From owner’s point of view, the decomposition of the project into functional elements (such as footings, foundation walls, elevator pit, etc) is preferred since the owner/supervisor can easily keep track of these design elements;<br>
56
56 3. Cash Flow Management 3.8 Approaches in Developing for Baseline Cost Control
3.8.1 Convert Cost Estimate into a Project Budget
A. Identify and segregate the Cost Accounts according to activity types from the cost estimate
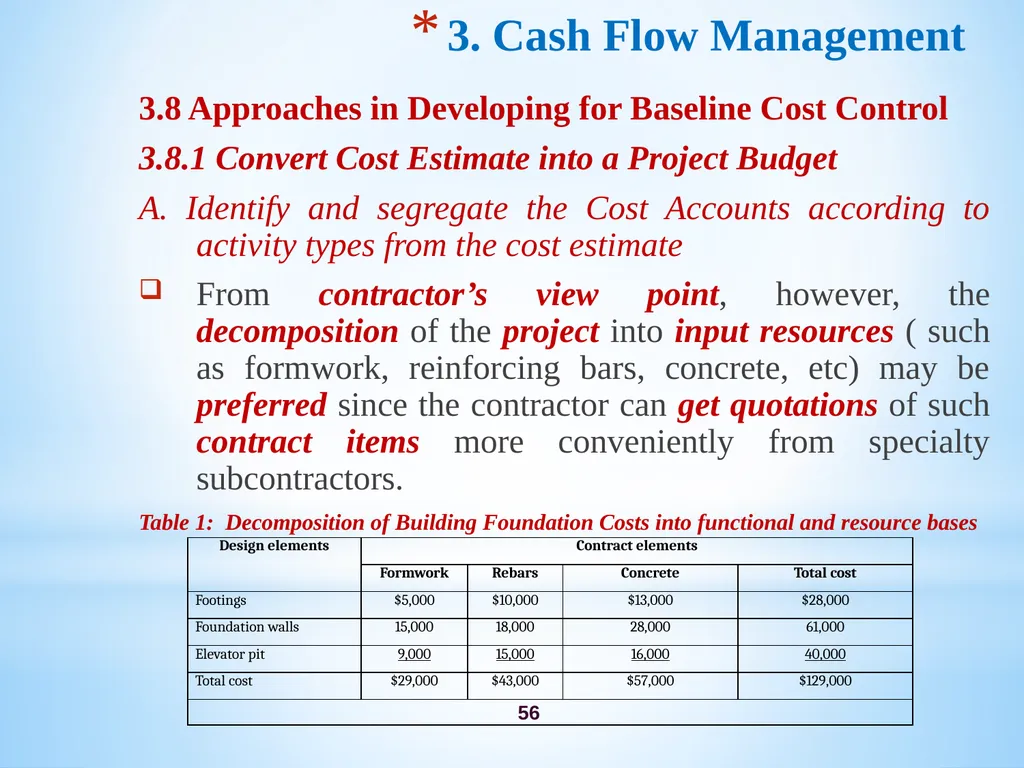
From contractor’s view point, however, the decomposition of the project into input resources ( such as formwork, reinforcing bars, concrete, etc) may be preferred since the contractor can get quotations of such contract items more conveniently from specialty subcontractors.
Table 1: Decomposition of Building Foundation Costs into functional and resource bases<br>
3.8.1 Convert Cost Estimate into a Project Budget
A. Identify and segregate the Cost Accounts according to activity types from the cost estimate
From contractor’s view point, however, the decomposition of the project into input resources ( such as formwork, reinforcing bars, concrete, etc) may be preferred since the contractor can get quotations of such contract items more conveniently from specialty subcontractors.
Table 1: Decomposition of Building Foundation Costs into functional and resource bases<br>
57
57 3. Cash Flow Management 3.8 Approaches in Developing for Baseline Cost Control
3.8.1 Convert Cost Estimate into a Project Budget
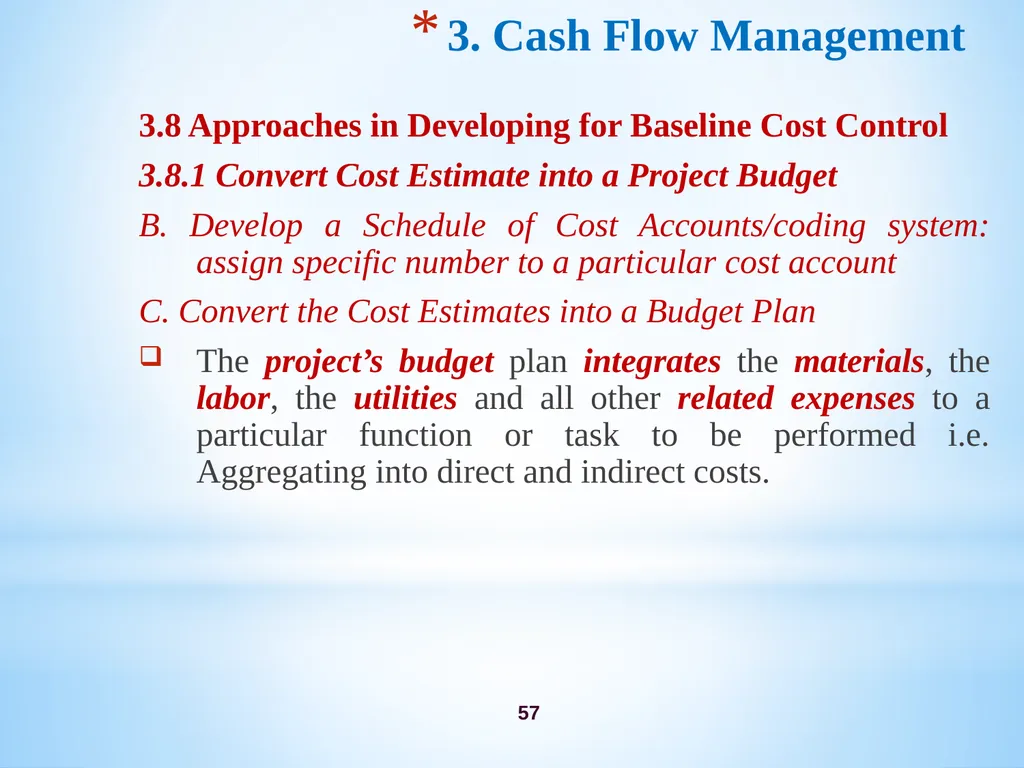
B. Develop a Schedule of Cost Accounts/coding system: assign specific number to a particular cost account
C. Convert the Cost Estimates into a Budget Plan
The project’s budget plan integrates the materials, the labor, the utilities and all other related expenses to a particular function or task to be performed i.e. Aggregating into direct and indirect costs.<br>
3.8.1 Convert Cost Estimate into a Project Budget
B. Develop a Schedule of Cost Accounts/coding system: assign specific number to a particular cost account
C. Convert the Cost Estimates into a Budget Plan
The project’s budget plan integrates the materials, the labor, the utilities and all other related expenses to a particular function or task to be performed i.e. Aggregating into direct and indirect costs.<br>
58
58 3. Cash Flow Management 3.8 Approaches in Developing for Baseline Cost Control
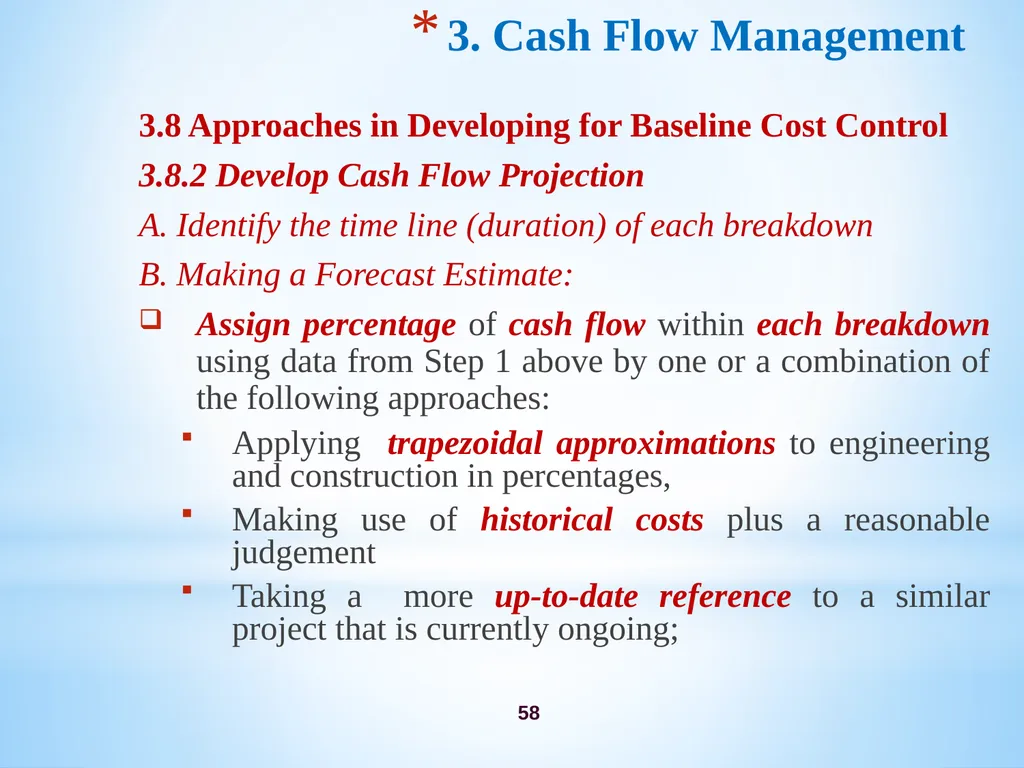
3.8.2 Develop Cash Flow Projection
A. Identify the time line (duration) of each breakdown
B. Making a Forecast Estimate:
Assign percentage of cash flow within each breakdown using data from Step 1 above by one or a combination of the following approaches:
Applying trapezoidal approximations to engineering and construction in percentages,
Making use of historical costs plus a reasonable judgement
Taking a more up-to-date reference to a similar project that is currently ongoing;<br>
3.8.2 Develop Cash Flow Projection
A. Identify the time line (duration) of each breakdown
B. Making a Forecast Estimate:
Assign percentage of cash flow within each breakdown using data from Step 1 above by one or a combination of the following approaches:
Applying trapezoidal approximations to engineering and construction in percentages,
Making use of historical costs plus a reasonable judgement
Taking a more up-to-date reference to a similar project that is currently ongoing;<br>
59
59 3. Cash Flow Management 3.8 Approaches in Developing for Baseline Cost Control
3.8.2 Develop Cash Flow Projection
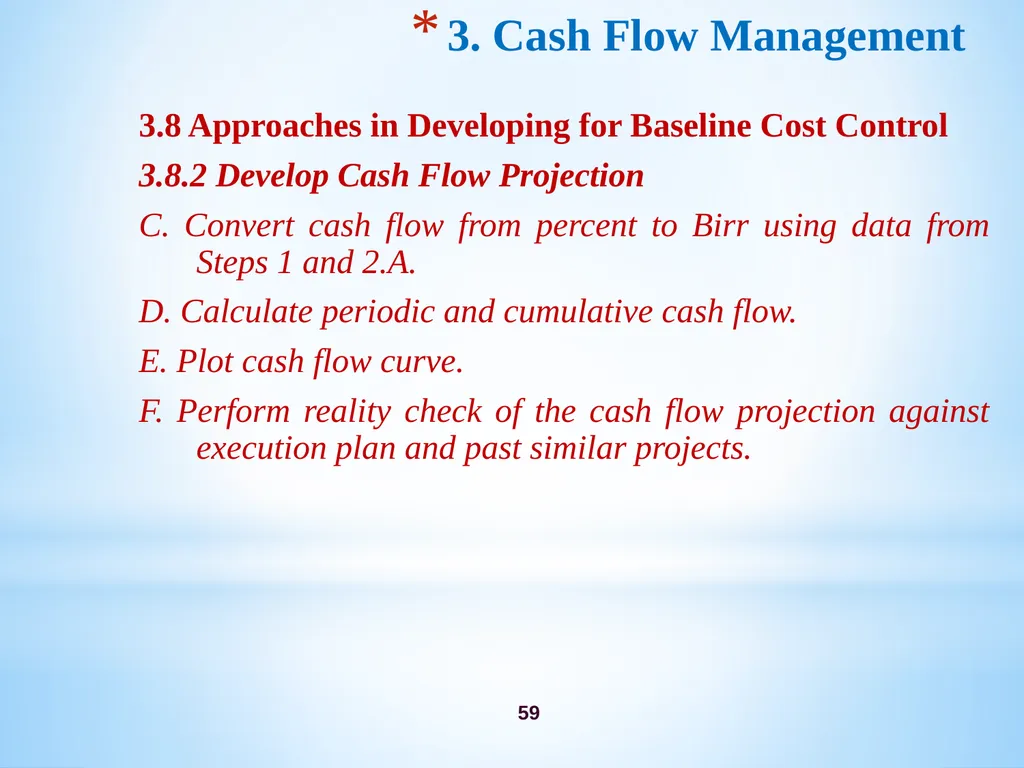
C. Convert cash flow from percent to Birr using data from Steps 1 and 2.A.
D. Calculate periodic and cumulative cash flow.
E. Plot cash flow curve.
F. Perform reality check of the cash flow projection against execution plan and past similar projects.<br>
3.8.2 Develop Cash Flow Projection
C. Convert cash flow from percent to Birr using data from Steps 1 and 2.A.
D. Calculate periodic and cumulative cash flow.
E. Plot cash flow curve.
F. Perform reality check of the cash flow projection against execution plan and past similar projects.<br>
60
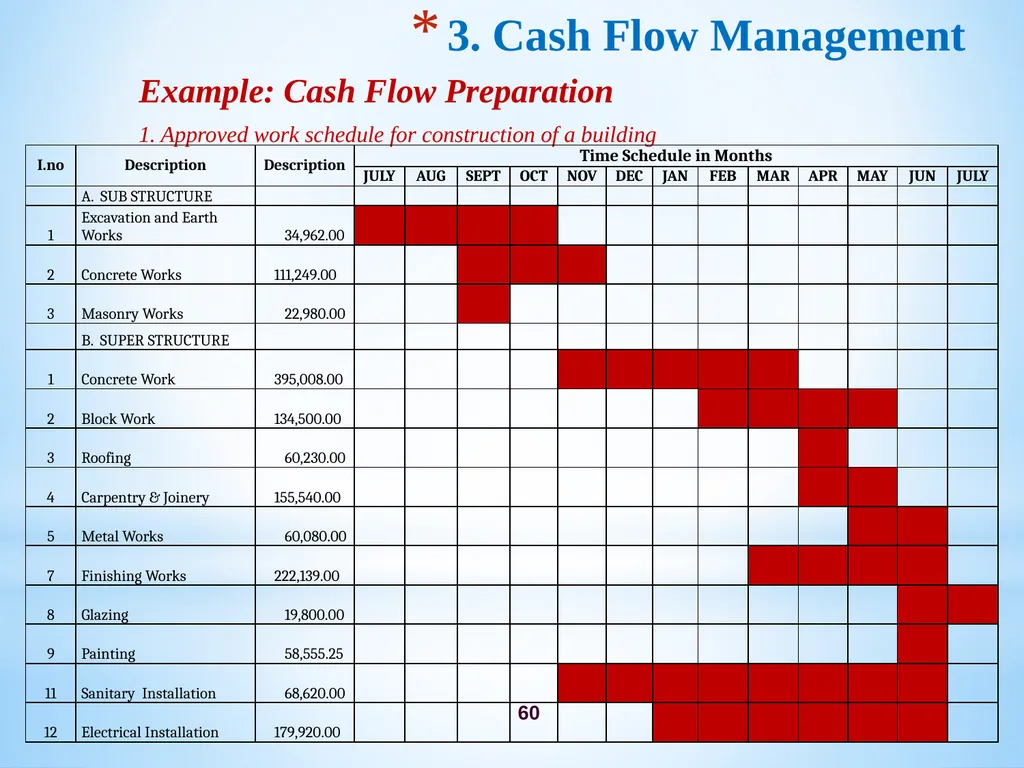
60 3. Cash Flow Management Example: Cash Flow Preparation
1. Approved work schedule for construction of a building<br>
1. Approved work schedule for construction of a building<br>
61
61 3. Cash Flow Management Example: Cash Flow Preparation
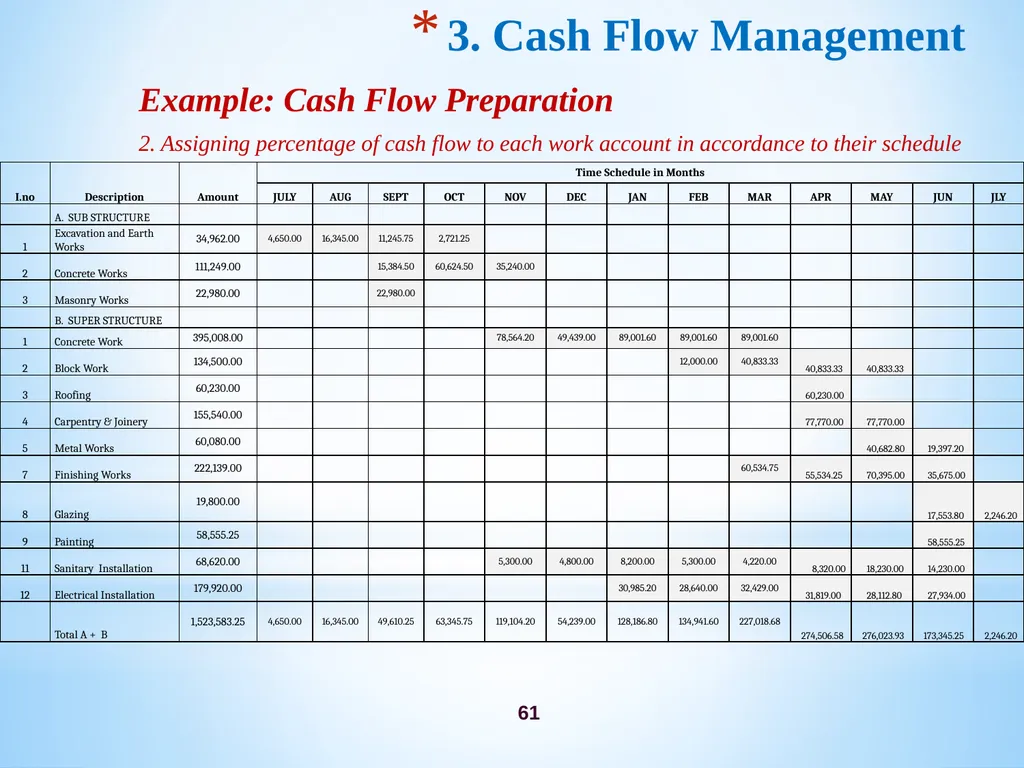
2. Assigning percentage of cash flow to each work account in accordance to their schedule<br>
2. Assigning percentage of cash flow to each work account in accordance to their schedule<br>
62
62 3. Cash Flow Management Example: Cash Flow Preparation
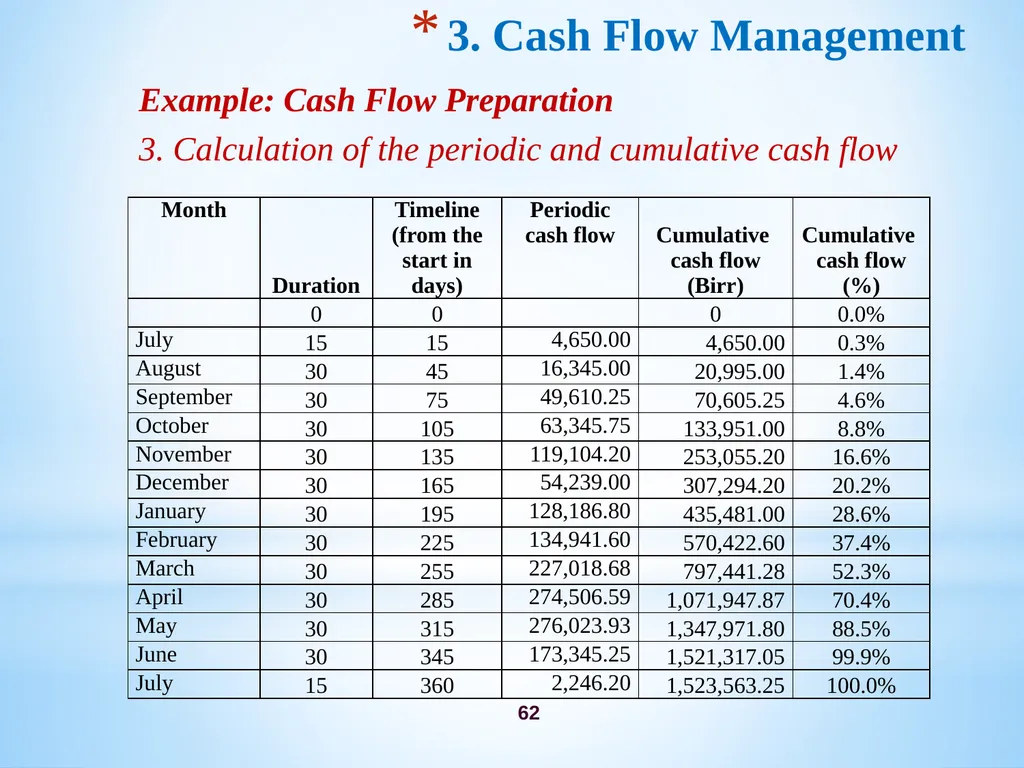
3. Calculation of the periodic and cumulative cash flow<br>
3. Calculation of the periodic and cumulative cash flow<br>
63
63 3. Cash Flow Management Example: Cash Flow Preparation
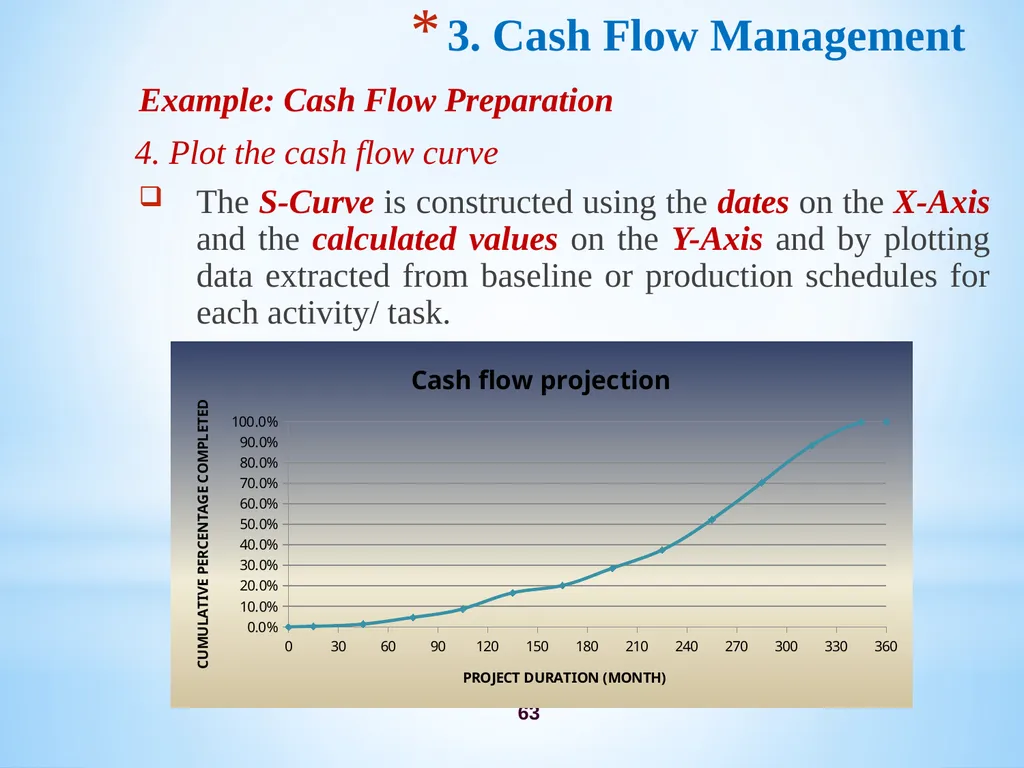
4. Plot the cash flow curve
The S-Curve is constructed using the dates on the X-Axis and the calculated values on the Y-Axis and by plotting data extracted from baseline or production schedules for each activity/ task.<br>
4. Plot the cash flow curve
The S-Curve is constructed using the dates on the X-Axis and the calculated values on the Y-Axis and by plotting data extracted from baseline or production schedules for each activity/ task.<br>
64
64 3. Cash Flow Management Example: Cash Flow Preparation
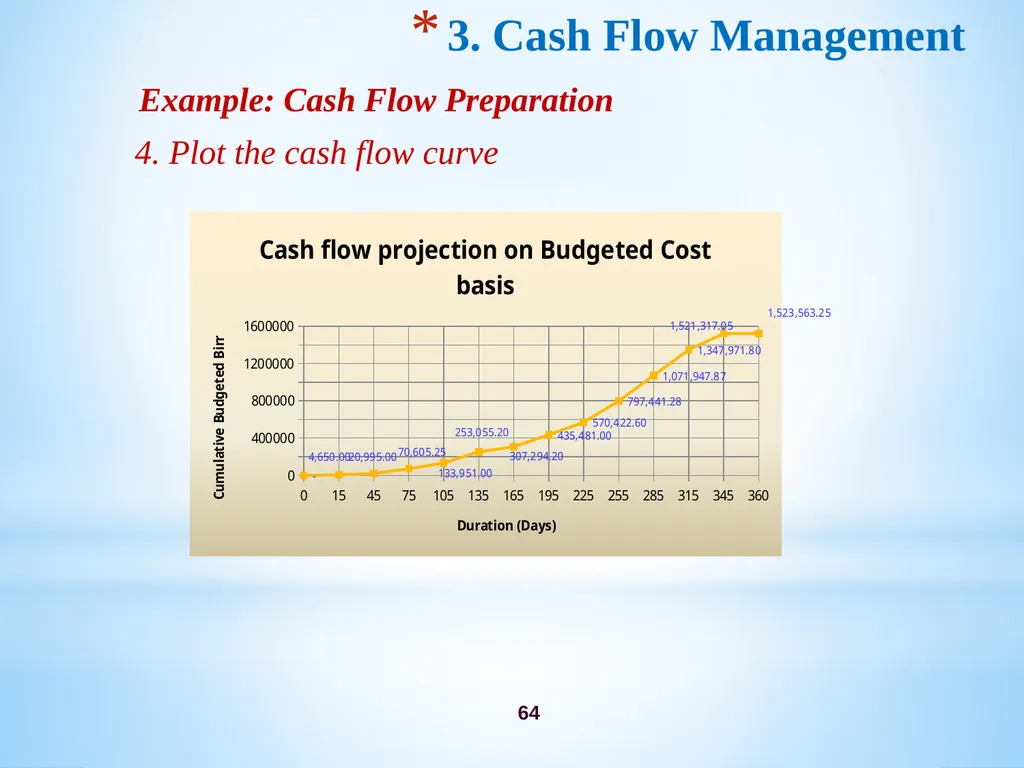
4. Plot the cash flow curve<br>
4. Plot the cash flow curve<br>
65
65 3. Cash Flow Management Example: Cash Flow Preparation
5. Explanation about baseline plan
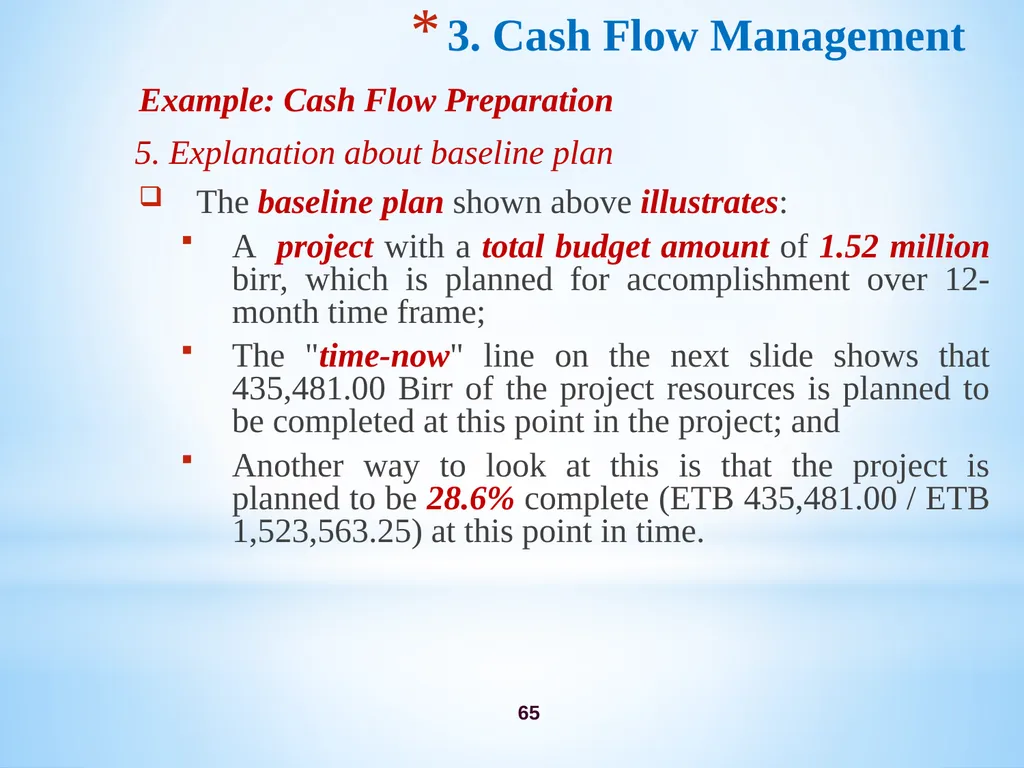
The baseline plan shown above illustrates:
A project with a total budget amount of 1.52 million birr, which is planned for accomplishment over 12-month time frame;
The "time-now" line on the next slide shows that 435,481.00 Birr of the project resources is planned to be completed at this point in the project; and
Another way to look at this is that the project is planned to be 28.6% complete (ETB 435,481.00 / ETB 1,523,563.25) at this point in time.<br>
5. Explanation about baseline plan
The baseline plan shown above illustrates:
A project with a total budget amount of 1.52 million birr, which is planned for accomplishment over 12-month time frame;
The "time-now" line on the next slide shows that 435,481.00 Birr of the project resources is planned to be completed at this point in the project; and
Another way to look at this is that the project is planned to be 28.6% complete (ETB 435,481.00 / ETB 1,523,563.25) at this point in time.<br>
66
66 3. Cash Flow Management Example: Cash Flow Preparation
5. Explanation about baseline plan<br>
5. Explanation about baseline plan<br>
67
67 4. Earned Value Management 4.1 General: Project Performance Monitoring
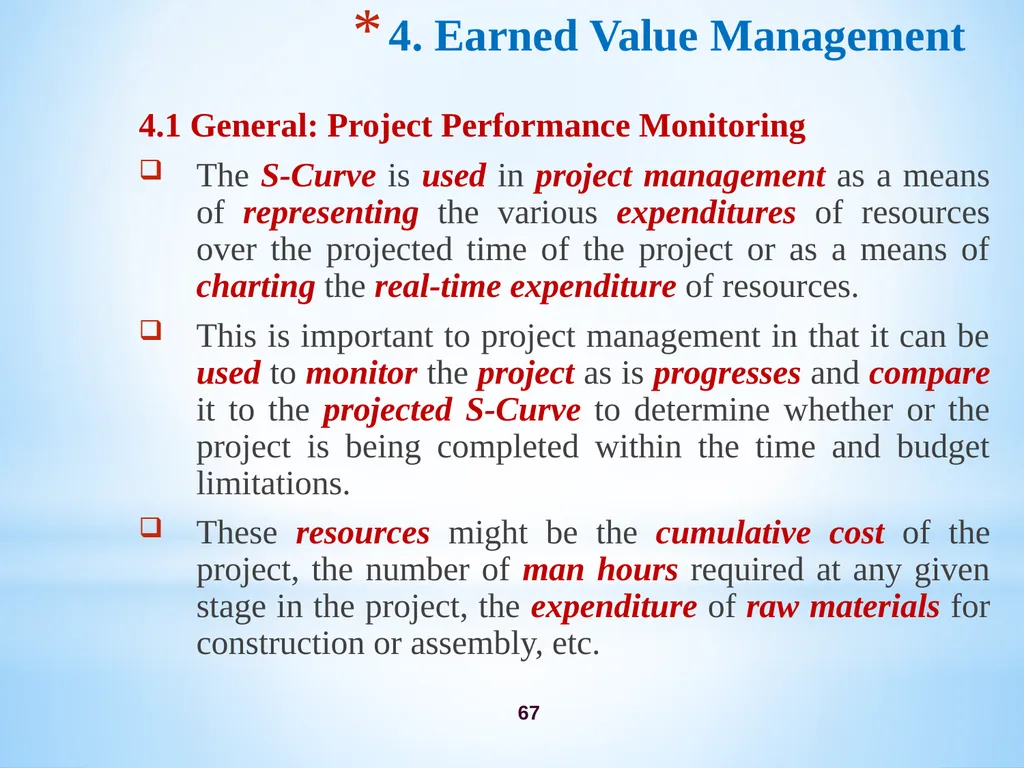
The S-Curve is used in project management as a means of representing the various expenditures of resources over the projected time of the project or as a means of charting the real-time expenditure of resources.
This is important to project management in that it can be used to monitor the project as is progresses and compare it to the projected S-Curve to determine whether or the project is being completed within the time and budget limitations.
These resources might be the cumulative cost of the project, the number of man hours required at any given stage in the project, the expenditure of raw materials for construction or assembly, etc.<br>
The S-Curve is used in project management as a means of representing the various expenditures of resources over the projected time of the project or as a means of charting the real-time expenditure of resources.
This is important to project management in that it can be used to monitor the project as is progresses and compare it to the projected S-Curve to determine whether or the project is being completed within the time and budget limitations.
These resources might be the cumulative cost of the project, the number of man hours required at any given stage in the project, the expenditure of raw materials for construction or assembly, etc.<br>
68
68 4. Earned Value Management 4.1 General: Project Performance Monitoring
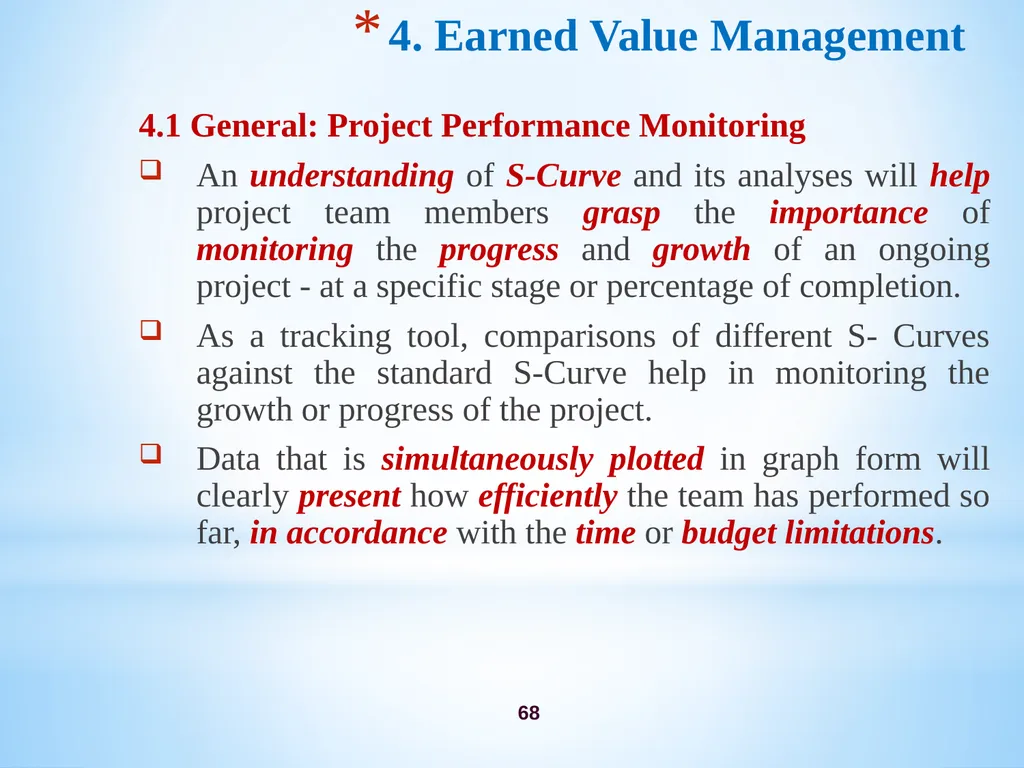
An understanding of S-Curve and its analyses will help project team members grasp the importance of monitoring the progress and growth of an ongoing project - at a specific stage or percentage of completion.
As a tracking tool, comparisons of different S- Curves against the standard S-Curve help in monitoring the growth or progress of the project.
Data that is simultaneously plotted in graph form will clearly present how efficiently the team has performed so far, in accordance with the time or budget limitations.<br>
An understanding of S-Curve and its analyses will help project team members grasp the importance of monitoring the progress and growth of an ongoing project - at a specific stage or percentage of completion.
As a tracking tool, comparisons of different S- Curves against the standard S-Curve help in monitoring the growth or progress of the project.
Data that is simultaneously plotted in graph form will clearly present how efficiently the team has performed so far, in accordance with the time or budget limitations.<br>
69
69 4. Earned Value Management 4.1 General: Earned Value Management
Earned Value Management (EVM) is used to measure project performance in terms of time and cost.
Earned value improves on the "normally used" spend plan concept (budget versus actual incurred cost) by requiring the work in process to be quantified.
The planned value, earned value, and actual cost data provides an objective and quantifiable measurement of performance, enabling trend analysis and evaluation of any cost estimate at completion within multiple levels of the project.<br>
Earned Value Management (EVM) is used to measure project performance in terms of time and cost.
Earned value improves on the "normally used" spend plan concept (budget versus actual incurred cost) by requiring the work in process to be quantified.
The planned value, earned value, and actual cost data provides an objective and quantifiable measurement of performance, enabling trend analysis and evaluation of any cost estimate at completion within multiple levels of the project.<br>
70
70 4. Earned Value Management 4.2 Earned Value Management Terms
Planned Value (PV):- formerly called the budgeted cost of work scheduled (BCWS), also called the budget, is that portion of the approved total cost estimate planned to be spent on an activity during a given period.
Actual Cost (AC):- formerly called actual cost of work performed (ACWP), is the total of direct and indirect costs incurred in accomplishing work on an activity during a given period.
Earned Value (EV):- formerly called the budgeted cost of work performed (BCWP), is an estimate of the value of the physical work actually completed.
Schedule Variance (SV) = EV-PV
Cost Variance (CV) = EV-AC<br>
Planned Value (PV):- formerly called the budgeted cost of work scheduled (BCWS), also called the budget, is that portion of the approved total cost estimate planned to be spent on an activity during a given period.
Actual Cost (AC):- formerly called actual cost of work performed (ACWP), is the total of direct and indirect costs incurred in accomplishing work on an activity during a given period.
Earned Value (EV):- formerly called the budgeted cost of work performed (BCWP), is an estimate of the value of the physical work actually completed.
Schedule Variance (SV) = EV-PV
Cost Variance (CV) = EV-AC<br>
71
71 4. Earned Value Management 4.3 Interpretation of Earned Value Numbers
Negative numbers for cost and schedule variance indicate problems in those areas.
Problems mean the project is costing more than planned (over budget) or taking longer than planned (behind schedule).
4.4 Schedule Variance
As work is performed, it is "earned" on the same basis as it was planned, in dollars or other quantifiable units such as labor hours. Comparing earned value with the planned value measures the dollar value of work accomplished versus the dollar value of work planned.
Any difference is called a schedule variance.
Schedule Variance (SV) = Earned Value-Planned Cost<br>
Negative numbers for cost and schedule variance indicate problems in those areas.
Problems mean the project is costing more than planned (over budget) or taking longer than planned (behind schedule).
4.4 Schedule Variance
As work is performed, it is "earned" on the same basis as it was planned, in dollars or other quantifiable units such as labor hours. Comparing earned value with the planned value measures the dollar value of work accomplished versus the dollar value of work planned.
Any difference is called a schedule variance.
Schedule Variance (SV) = Earned Value-Planned Cost<br>
72
72 4. Earned Value Management 4.4 Schedule Variance<br>
73
73 4. Earned Value Management 4.4 Schedule Variance
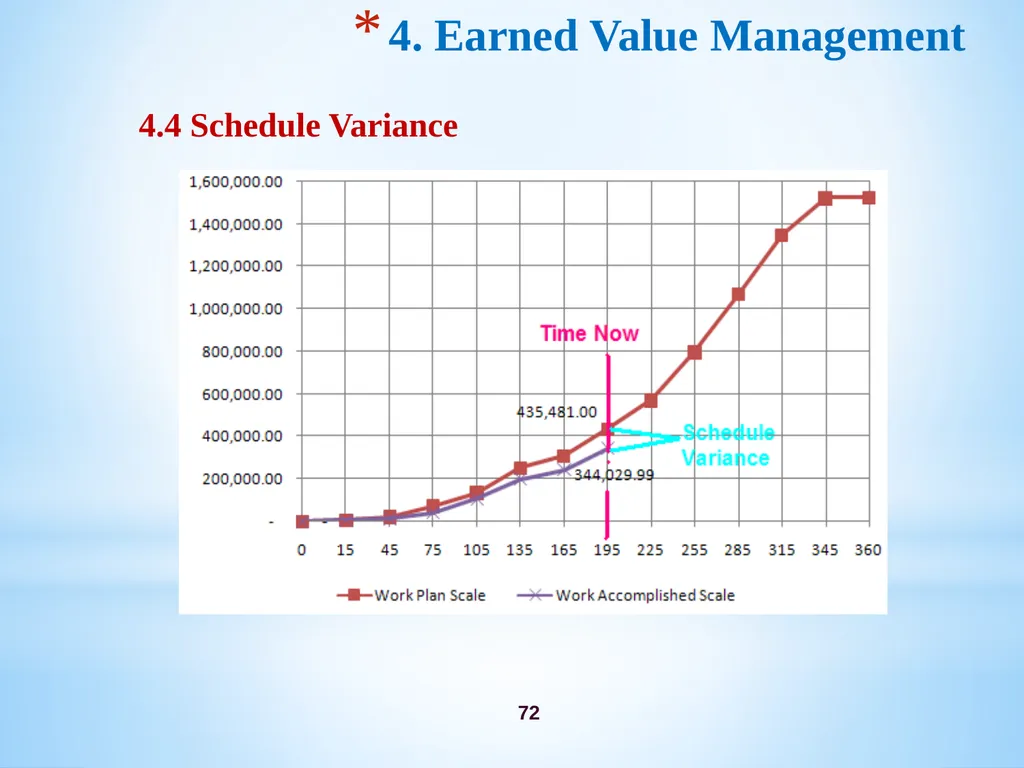
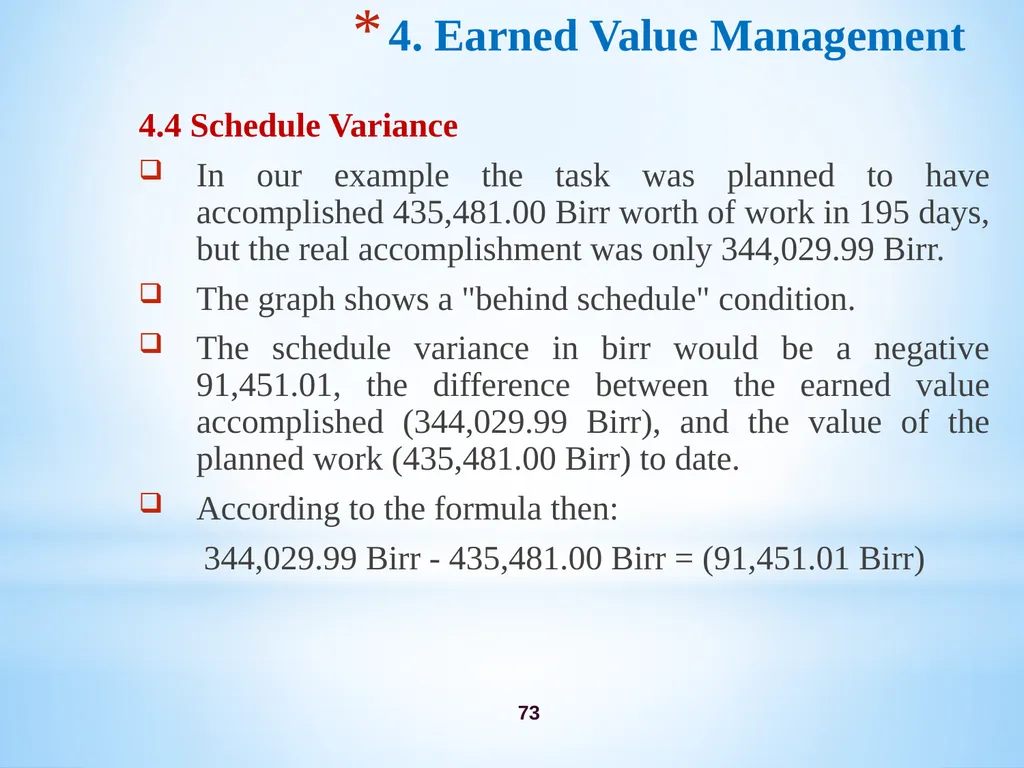
In our example the task was planned to have accomplished 435,481.00 Birr worth of work in 195 days, but the real accomplishment was only 344,029.99 Birr.
The graph shows a "behind schedule" condition.
The schedule variance in birr would be a negative 91,451.01, the difference between the earned value accomplished (344,029.99 Birr), and the value of the planned work (435,481.00 Birr) to date.
According to the formula then:
344,029.99 Birr - 435,481.00 Birr = (91,451.01 Birr)<br>
In our example the task was planned to have accomplished 435,481.00 Birr worth of work in 195 days, but the real accomplishment was only 344,029.99 Birr.
The graph shows a "behind schedule" condition.
The schedule variance in birr would be a negative 91,451.01, the difference between the earned value accomplished (344,029.99 Birr), and the value of the planned work (435,481.00 Birr) to date.
According to the formula then:
344,029.99 Birr - 435,481.00 Birr = (91,451.01 Birr)<br>
74
74 4. Earned Value Management 4.5 Cost Variance
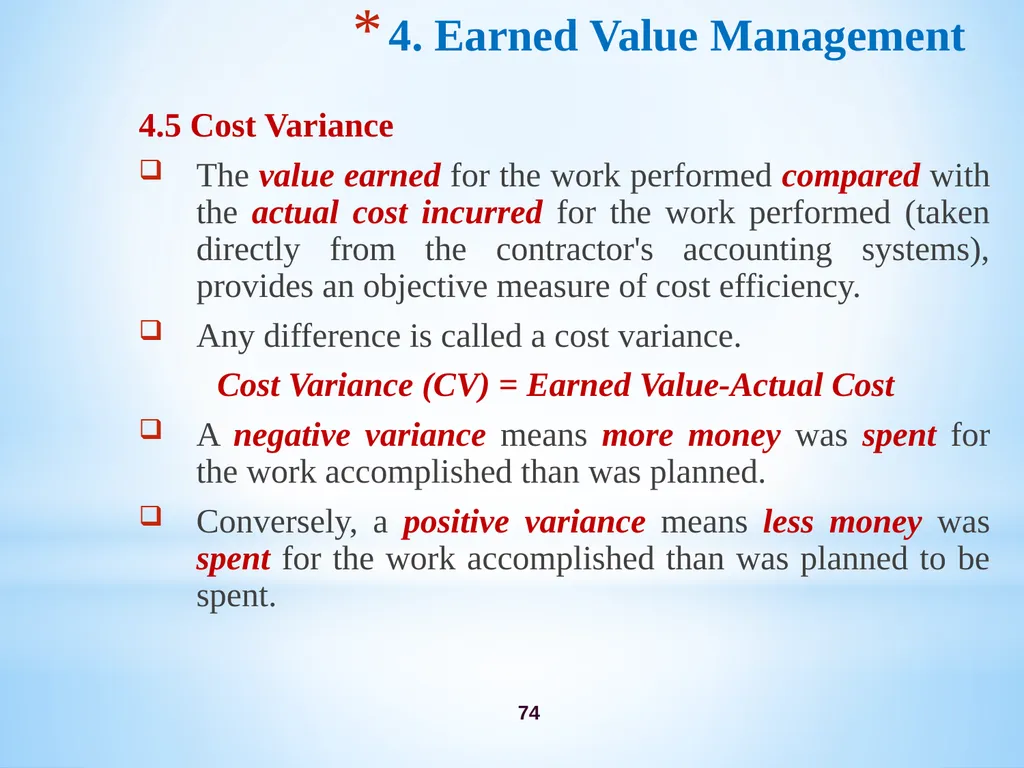
The value earned for the work performed compared with the actual cost incurred for the work performed (taken directly from the contractor's accounting systems), provides an objective measure of cost efficiency.
Any difference is called a cost variance.
Cost Variance (CV) = Earned Value-Actual Cost
A negative variance means more money was spent for the work accomplished than was planned.
Conversely, a positive variance means less money was spent for the work accomplished than was planned to be spent.<br>
The value earned for the work performed compared with the actual cost incurred for the work performed (taken directly from the contractor's accounting systems), provides an objective measure of cost efficiency.
Any difference is called a cost variance.
Cost Variance (CV) = Earned Value-Actual Cost
A negative variance means more money was spent for the work accomplished than was planned.
Conversely, a positive variance means less money was spent for the work accomplished than was planned to be spent.<br>
75
75 4. Earned Value Management 4.5 Cost Variance<br>
76
76 4. Earned Value Management 4.5 Cost Variance
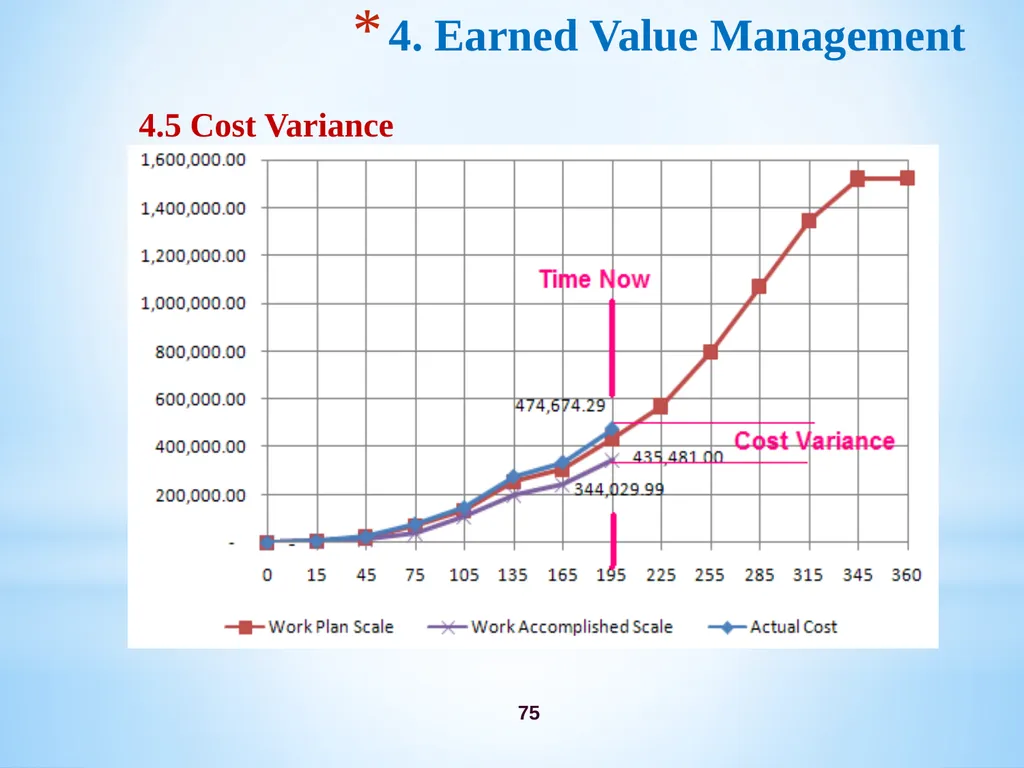
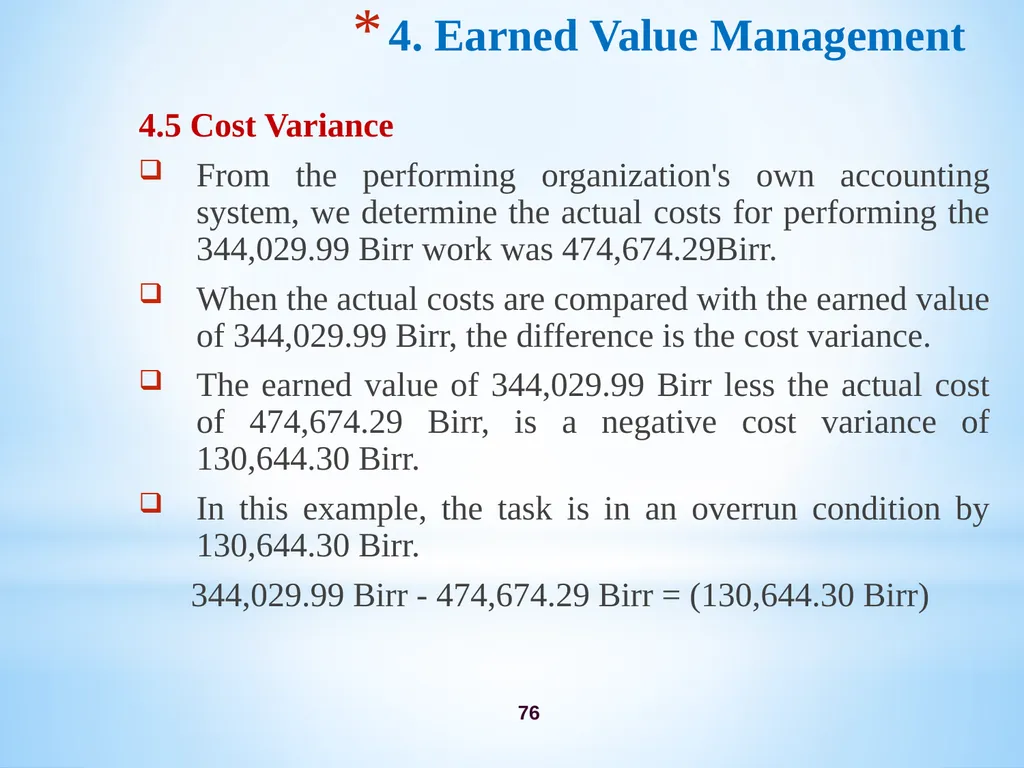
From the performing organization's own accounting system, we determine the actual costs for performing the 344,029.99 Birr work was 474,674.29Birr.
When the actual costs are compared with the earned value of 344,029.99 Birr, the difference is the cost variance.
The earned value of 344,029.99 Birr less the actual cost of 474,674.29 Birr, is a negative cost variance of 130,644.30 Birr.
In this example, the task is in an overrun condition by 130,644.30 Birr.
344,029.99 Birr - 474,674.29 Birr = (130,644.30 Birr)<br>
From the performing organization's own accounting system, we determine the actual costs for performing the 344,029.99 Birr work was 474,674.29Birr.
When the actual costs are compared with the earned value of 344,029.99 Birr, the difference is the cost variance.
The earned value of 344,029.99 Birr less the actual cost of 474,674.29 Birr, is a negative cost variance of 130,644.30 Birr.
In this example, the task is in an overrun condition by 130,644.30 Birr.
344,029.99 Birr - 474,674.29 Birr = (130,644.30 Birr)<br>
77
77 THANK YOU!<br>