
Chapter Two: Volatility Measurement Presented By:
Description: Chapter Two: Volatility Measurement Presented By: Waqas Shinwari Objectives of the Chapter To know about volatility To know about applications of volatility in Finance To know about different approaches of estimating Volatility Simple
Related Topics
Download Presentation
"Chapter Two: Volatility Measurement Presented By:" is the property of its rightful owner. Permission is granted to download and print the materials on this website for personal, non-commercial use only, and to display it on your personal computer provided you do not modify the materials and that you retain all copyright notices contained in the materials. By downloading content from our website, you accept the terms of this agreement.
Presentation Transcript
slide1. Chapter Two: Volatility Measurement Presented By: Waqas Shinwari<br>
slide2. Objectives of the Chapter To know about volatility
To know about applications of volatility in Finance
To know about different approaches of estimating Volatility
Simple Variance
EWMA Model
GARCH Model<br>
slide3. What is Volatility? Volatility is a statistical measure of the tendency of a market or security to rise or fall sharply within a period of time
Volatility is a statistical measure of the dispersion of returns for a given security or market index
Volatility has a huge use in finance and at a basic level is a proxy for the riskiness of an asset.<br>
slide4. Applications of Volatility in Finance Volatility has wide ranges of applications in finance like:
Capital Asset Pricing Models (Beta Estimation)
Markets forecasting (stock prices, indices etc.)
Valuation of Derivatives (e.g. Option Pricing)
Value at Risk (VaR) models<br>
slide5. Measures of Volatility Volatility can be measured through:
Current Market Prices (Implied Volatility)
Historical Prices
Proxies of Volatility include:
Variance
Standard Deviation
Beta<br>
slide6. Measures of Volatility – Implied Volatility Implied Volatility is used in Option’s Pricing (Black Scholes Model)
Given the current market price, model can generate a volatility value
This value is implied by current market price<br>
slide7. Measures of Volatility - Historical Another approach is to use historical data and calculate volatility
Under historical approach, volatility can be either:
Unconditional Volatility
Conditional Volatility<br>
slide8. Unconditional Volatility If today’s volatility does not depend upon yesterday’s volatility, it is said to be unconditional
Predictable and cyclical in nature and sometimes due to occurrence of particular events
In financial markets, Empirical research shows that volatility is conditional in majority cases<br>
slide9. Conditional Volatility Conditional volatility is more realistic
Conditional volatility value depends to some extent on the previous periods volatility
Conditional volatility can be:
Unweighted (simple std. Deviation)
Weighted (EWMA, GARCH)<br>
slide10. Unweighted Volatility For instance, smallest companies are given equal weight to the largest companies in an equal-weighted index fund.
Where weights of each observation is equal
We can calculate the weighted average through simple average Equal weight/Unweight is a type of weighting that gives the same weight, or importance, to each stock in a portfolio or index fund<br>
slide11. Weighted Volatility These measures assign more weights to recent data points and less weights to distant data points
The reason is that current volatility is more related to recent past than to distant past ‘Weighting’ mathematical process by which figures and/or components are adjusted to reflect importance by value or proportion.<br>
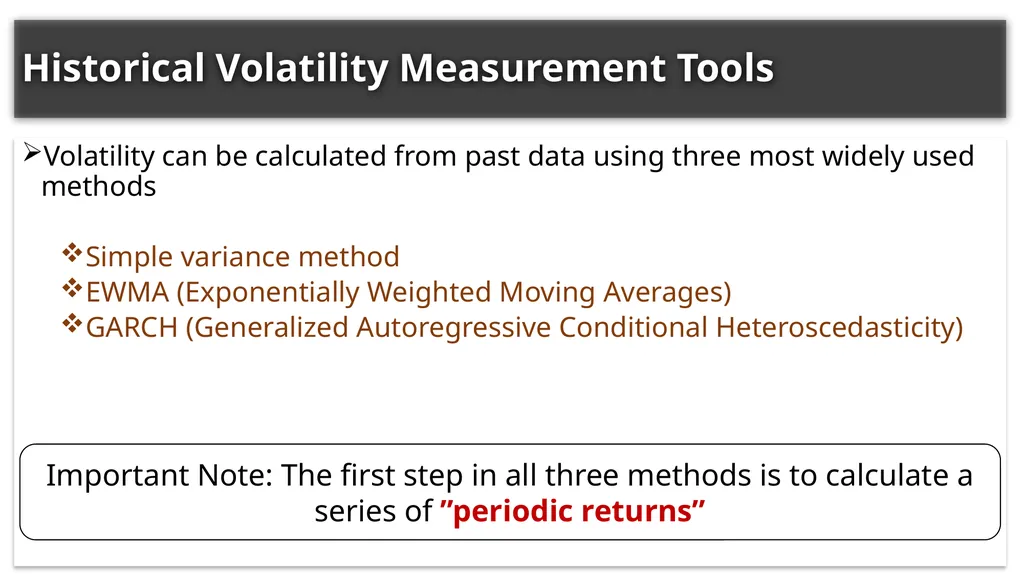
slide12. Historical Volatility Measurement Tools Volatility can be calculated from past data using three most widely used methods
Simple variance method
EWMA (Exponentially Weighted Moving Averages)
GARCH (Generalized Autoregressive Conditional Heteroscedasticity) Important Note: The first step in all three methods is to calculate a series of ”periodic returns”<br>
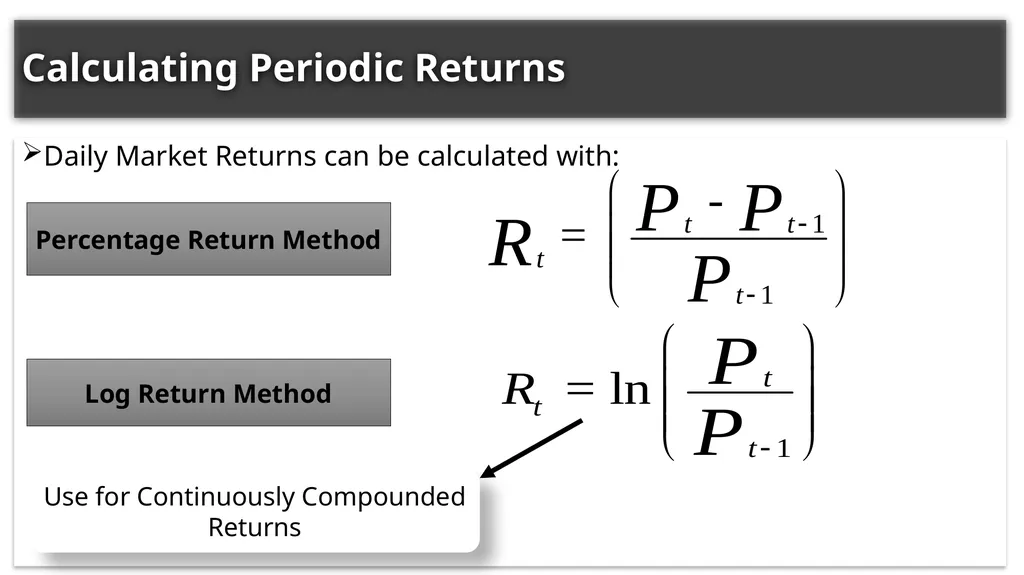
slide13. Calculating Periodic Returns Daily Market Returns can be calculated with: Percentage Return Method Log Return Method Use for Continuously Compounded Returns<br>
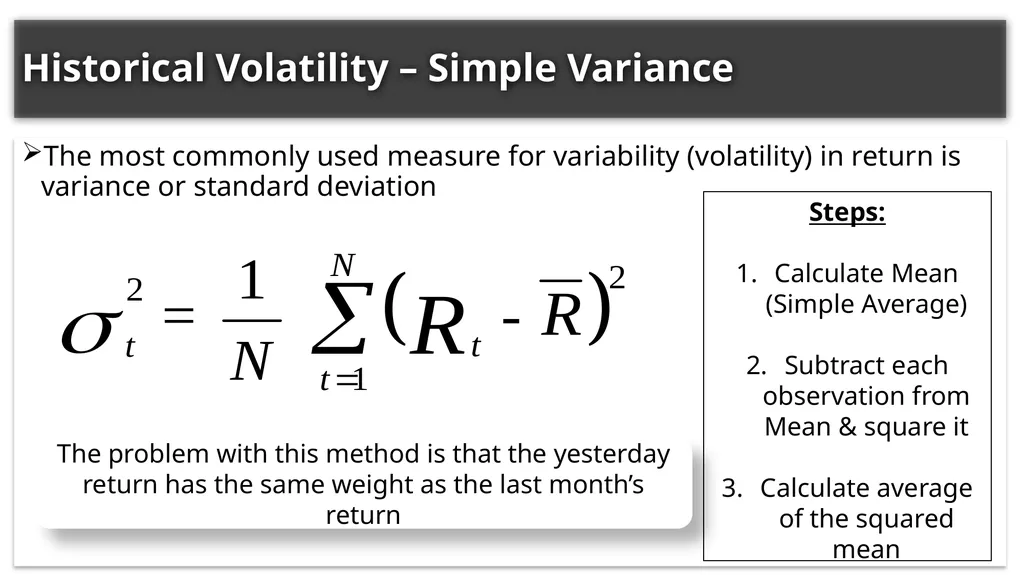
slide14. Historical Volatility – Simple Variance The most commonly used measure for variability (volatility) in return is variance or standard deviation Steps:
Calculate Mean (Simple Average)
Subtract each observation from Mean & square it
Calculate average of the squared mean The problem with this method is that the yesterday return has the same weight as the last month’s return<br>
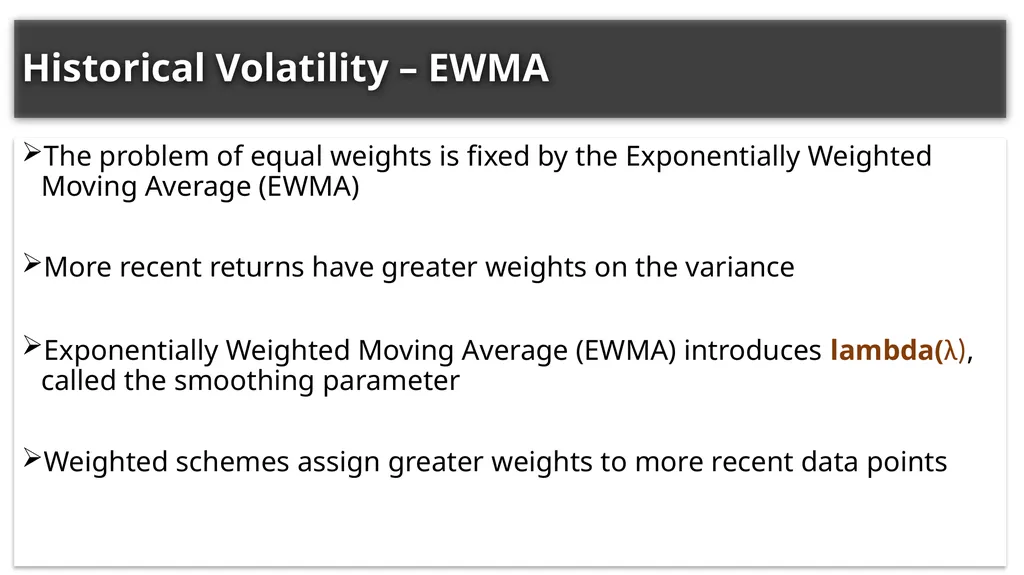
slide15. Historical Volatility – EWMA The problem of equal weights is fixed by the Exponentially Weighted Moving Average (EWMA)
More recent returns have greater weights on the variance
Exponentially Weighted Moving Average (EWMA) introduces lambda(λ), called the smoothing parameter
Weighted schemes assign greater weights to more recent data points<br>
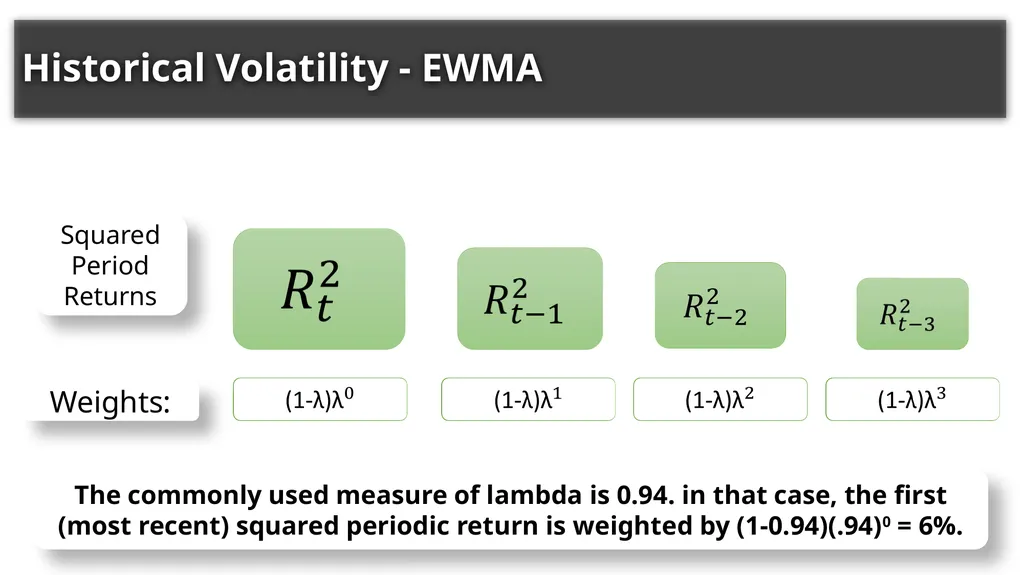
slide16. Historical Volatility - EWMA Squared Period Returns Weights: The commonly used measure of lambda is 0.94. in that case, the first (most recent) squared periodic return is weighted by (1-0.94)(.94)0 = 6%.<br>
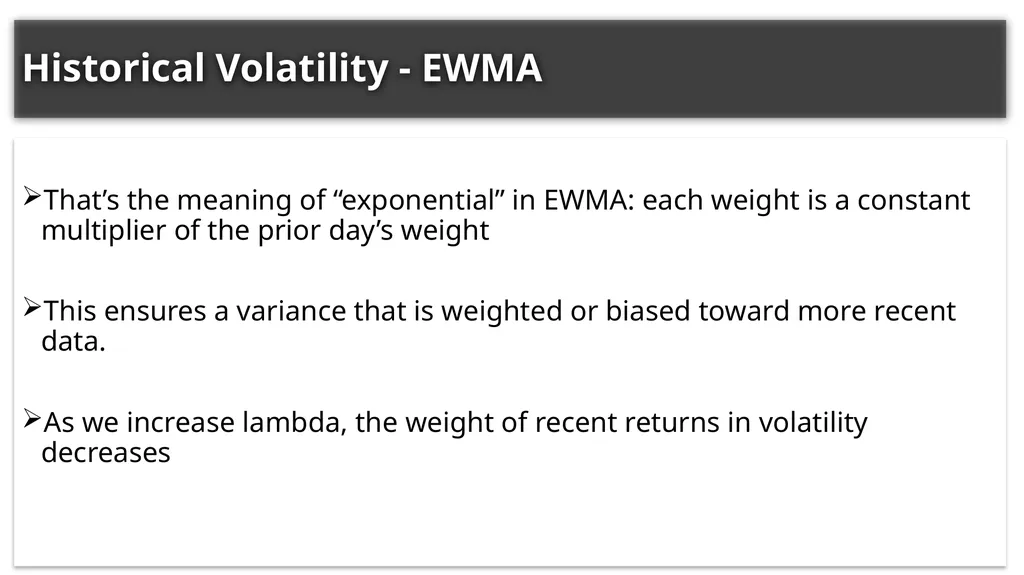
slide17. Historical Volatility - EWMA That’s the meaning of “exponential” in EWMA: each weight is a constant multiplier of the prior day’s weight
This ensures a variance that is weighted or biased toward more recent data.
As we increase lambda, the weight of recent returns in volatility decreases<br>
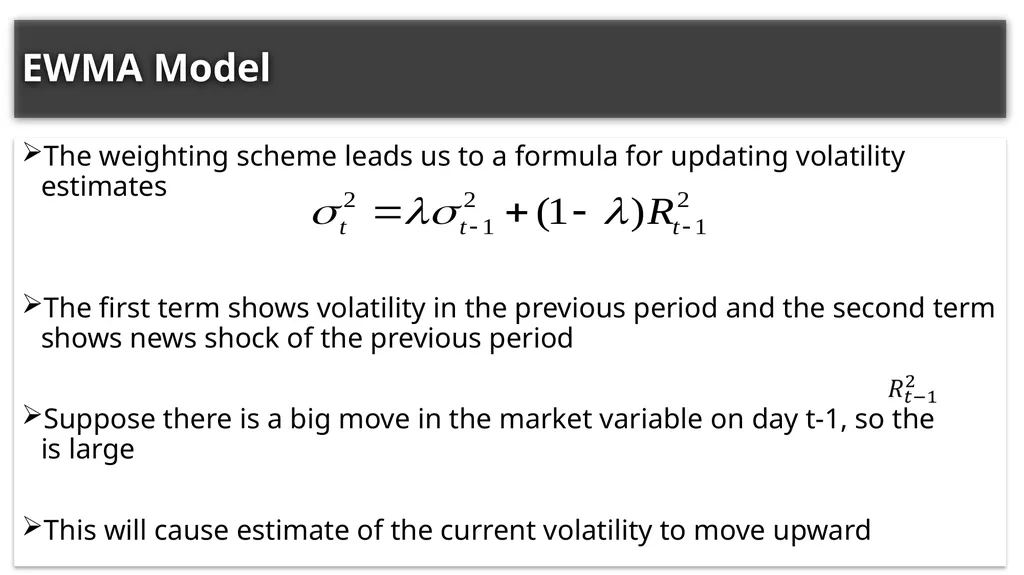
slide18. EWMA Model The weighting scheme leads us to a formula for updating volatility estimates
The first term shows volatility in the previous period and the second term shows news shock of the previous period
Suppose there is a big move in the market variable on day t-1, so the is large
This will cause estimate of the current volatility to move upward<br>
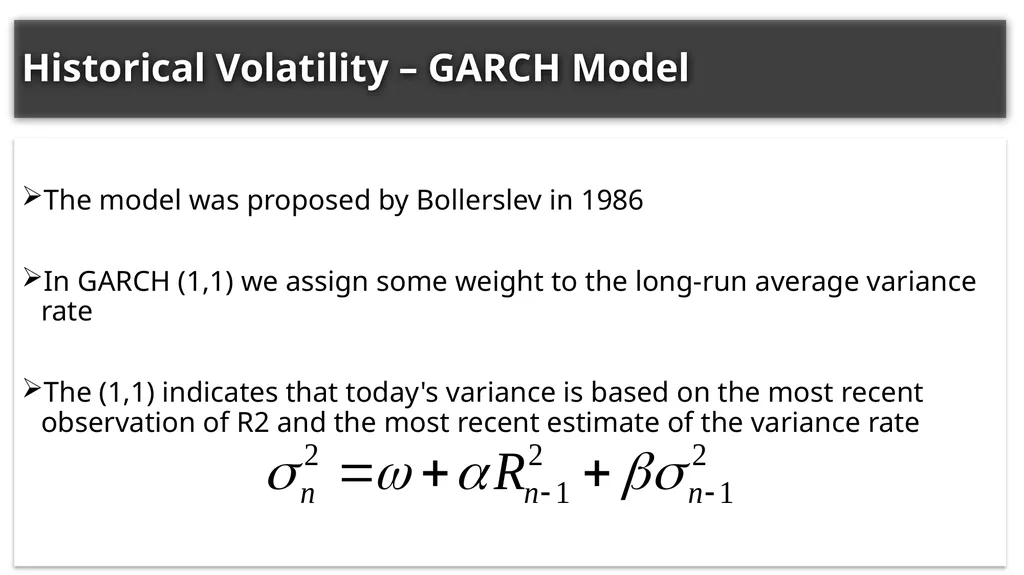
slide19. Historical Volatility – GARCH Model The model was proposed by Bollerslev in 1986
In GARCH (1,1) we assign some weight to the long-run average variance rate
The (1,1) indicates that today's variance is based on the most recent observation of R2 and the most recent estimate of the variance rate<br>
slide2. Objectives of the Chapter To know about volatility
To know about applications of volatility in Finance
To know about different approaches of estimating Volatility
Simple Variance
EWMA Model
GARCH Model<br>
slide3. What is Volatility? Volatility is a statistical measure of the tendency of a market or security to rise or fall sharply within a period of time
Volatility is a statistical measure of the dispersion of returns for a given security or market index
Volatility has a huge use in finance and at a basic level is a proxy for the riskiness of an asset.<br>
slide4. Applications of Volatility in Finance Volatility has wide ranges of applications in finance like:
Capital Asset Pricing Models (Beta Estimation)
Markets forecasting (stock prices, indices etc.)
Valuation of Derivatives (e.g. Option Pricing)
Value at Risk (VaR) models<br>
slide5. Measures of Volatility Volatility can be measured through:
Current Market Prices (Implied Volatility)
Historical Prices
Proxies of Volatility include:
Variance
Standard Deviation
Beta<br>
slide6. Measures of Volatility – Implied Volatility Implied Volatility is used in Option’s Pricing (Black Scholes Model)
Given the current market price, model can generate a volatility value
This value is implied by current market price<br>
slide7. Measures of Volatility - Historical Another approach is to use historical data and calculate volatility
Under historical approach, volatility can be either:
Unconditional Volatility
Conditional Volatility<br>
slide8. Unconditional Volatility If today’s volatility does not depend upon yesterday’s volatility, it is said to be unconditional
Predictable and cyclical in nature and sometimes due to occurrence of particular events
In financial markets, Empirical research shows that volatility is conditional in majority cases<br>
slide9. Conditional Volatility Conditional volatility is more realistic
Conditional volatility value depends to some extent on the previous periods volatility
Conditional volatility can be:
Unweighted (simple std. Deviation)
Weighted (EWMA, GARCH)<br>
slide10. Unweighted Volatility For instance, smallest companies are given equal weight to the largest companies in an equal-weighted index fund.
Where weights of each observation is equal
We can calculate the weighted average through simple average Equal weight/Unweight is a type of weighting that gives the same weight, or importance, to each stock in a portfolio or index fund<br>
slide11. Weighted Volatility These measures assign more weights to recent data points and less weights to distant data points
The reason is that current volatility is more related to recent past than to distant past ‘Weighting’ mathematical process by which figures and/or components are adjusted to reflect importance by value or proportion.<br>
slide12. Historical Volatility Measurement Tools Volatility can be calculated from past data using three most widely used methods
Simple variance method
EWMA (Exponentially Weighted Moving Averages)
GARCH (Generalized Autoregressive Conditional Heteroscedasticity) Important Note: The first step in all three methods is to calculate a series of ”periodic returns”<br>
slide13. Calculating Periodic Returns Daily Market Returns can be calculated with: Percentage Return Method Log Return Method Use for Continuously Compounded Returns<br>
slide14. Historical Volatility – Simple Variance The most commonly used measure for variability (volatility) in return is variance or standard deviation Steps:
Calculate Mean (Simple Average)
Subtract each observation from Mean & square it
Calculate average of the squared mean The problem with this method is that the yesterday return has the same weight as the last month’s return<br>
slide15. Historical Volatility – EWMA The problem of equal weights is fixed by the Exponentially Weighted Moving Average (EWMA)
More recent returns have greater weights on the variance
Exponentially Weighted Moving Average (EWMA) introduces lambda(λ), called the smoothing parameter
Weighted schemes assign greater weights to more recent data points<br>
slide16. Historical Volatility - EWMA Squared Period Returns Weights: The commonly used measure of lambda is 0.94. in that case, the first (most recent) squared periodic return is weighted by (1-0.94)(.94)0 = 6%.<br>
slide17. Historical Volatility - EWMA That’s the meaning of “exponential” in EWMA: each weight is a constant multiplier of the prior day’s weight
This ensures a variance that is weighted or biased toward more recent data.
As we increase lambda, the weight of recent returns in volatility decreases<br>
slide18. EWMA Model The weighting scheme leads us to a formula for updating volatility estimates
The first term shows volatility in the previous period and the second term shows news shock of the previous period
Suppose there is a big move in the market variable on day t-1, so the is large
This will cause estimate of the current volatility to move upward<br>
slide19. Historical Volatility – GARCH Model The model was proposed by Bollerslev in 1986
In GARCH (1,1) we assign some weight to the long-run average variance rate
The (1,1) indicates that today's variance is based on the most recent observation of R2 and the most recent estimate of the variance rate<br>