
CIS 5710: Comp. Arch. | Prof. Joe Devietti |
CS
Published · 42 slides · 0 views
1 / 1

Description
CIS 5710: Comp. Arch. Prof. Joe Devietti Performance 1 CIS 5710: Computer Architecture Unit 5: Performance Benchmarking Slides developed by Joe Devietti, Milo Martin Amir Roth at Upenn with sources that included University of
Related Topics
Share
Embed code
Download this presentation From Below
"CIS 5710: Comp. Arch. | Prof. Joe Devietti |" is the property of its rightful owner. Permission is granted to download and print the materials on this website for personal, non-commercial use only, and to display it on your personal computer provided you do not modify the materials and that you retain all copyright notices contained in the materials. By downloading content from our website, you accept the terms of this agreement.
Presentation Transcript
01
CIS 5710: Comp. Arch. | Prof. Joe Devietti | Performance 1 CIS 5710: Computer Architecture Unit 5: Performance & Benchmarking Slides developed by Joe Devietti, Milo Martin & Amir Roth at Upenn
with sources that included University of Wisconsin slides by Mark Hill, Guri Sohi, Jim Smith, and David Wood<br>
with sources that included University of Wisconsin slides by Mark Hill, Guri Sohi, Jim Smith, and David Wood<br>
02
CIS 5710: Comp. Arch. | Prof. Joe Devietti | Performance 2 This Unit Metrics
CPU Performance
Comparing Performance
Benchmarks
Performance Laws<br>
CPU Performance
Comparing Performance
Benchmarks
Performance Laws<br>
03
Performance Metrics CIS 5710: Comp. Arch. | Prof. Joe Devietti | Performance 3<br>
04
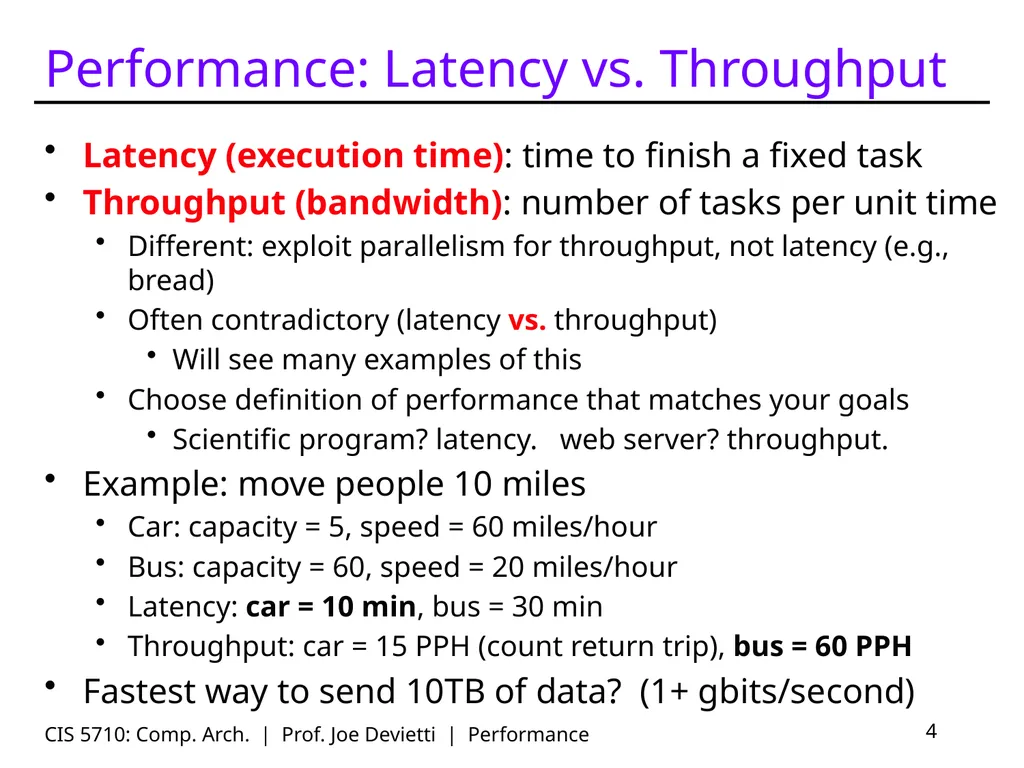
CIS 5710: Comp. Arch. | Prof. Joe Devietti | Performance 4 Performance: Latency vs. Throughput Latency (execution time): time to finish a fixed task
Throughput (bandwidth): number of tasks per unit time
Different: exploit parallelism for throughput, not latency (e.g., bread)
Often contradictory (latency vs. throughput)
Will see many examples of this
Choose definition of performance that matches your goals
Scientific program? latency. web server? throughput.
Example: move people 10 miles
Car: capacity = 5, speed = 60 miles/hour
Bus: capacity = 60, speed = 20 miles/hour
Latency: car = 10 min, bus = 30 min
Throughput: car = 15 PPH (count return trip), bus = 60 PPH
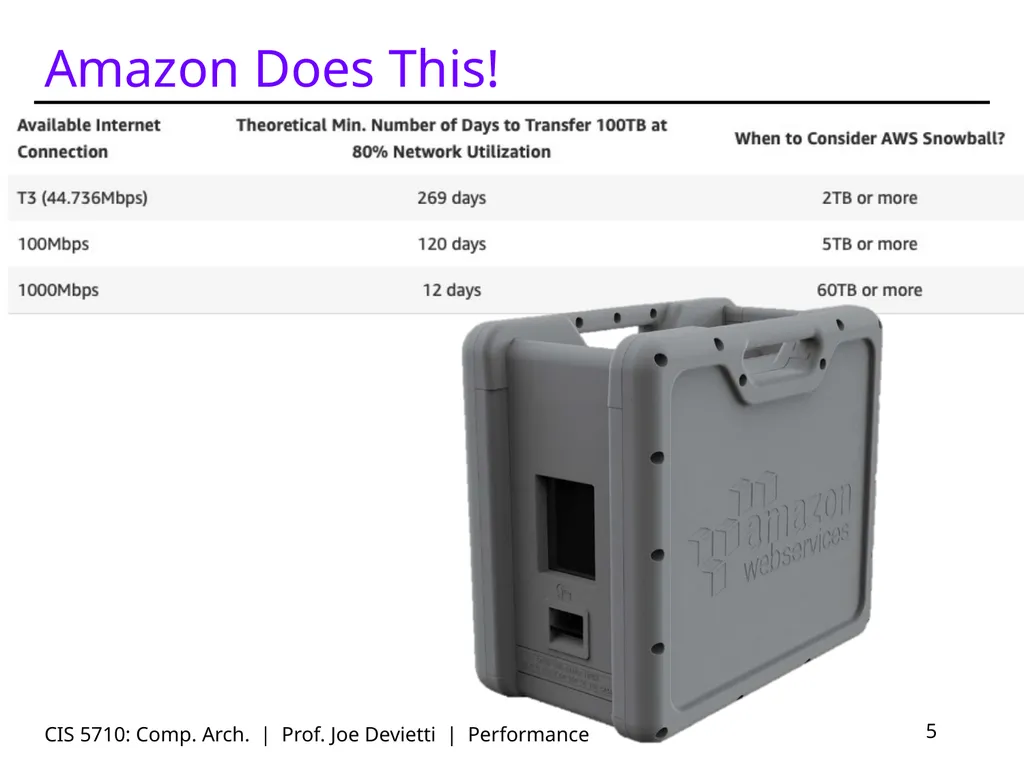
Fastest way to send 10TB of data? (1+ gbits/second)<br>
05
Amazon Does This! CIS 5710: Comp. Arch. | Prof. Joe Devietti | Performance 5<br>
06
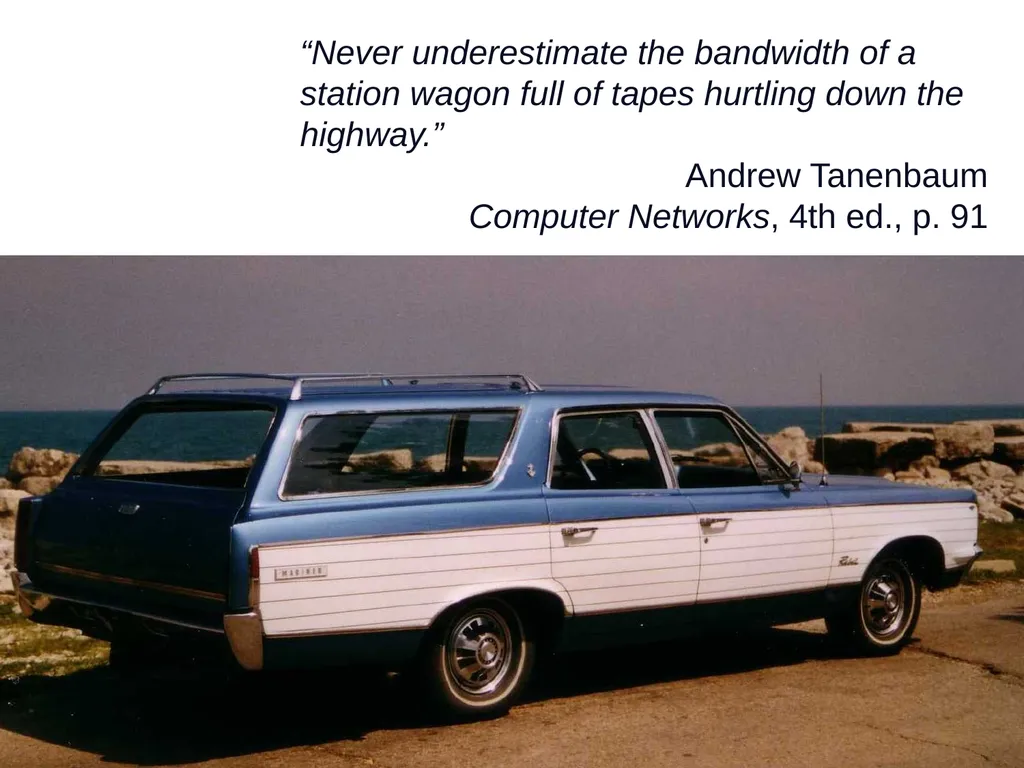
“Never underestimate the bandwidth of a station wagon full of tapes hurtling down the highway.”
Andrew Tanenbaum Computer Networks, 4th ed., p. 91<br>
Andrew Tanenbaum Computer Networks, 4th ed., p. 91<br>
07
CPU Performance CIS 5710: Comp. Arch. | Prof. Joe Devietti | Performance 7<br>
08
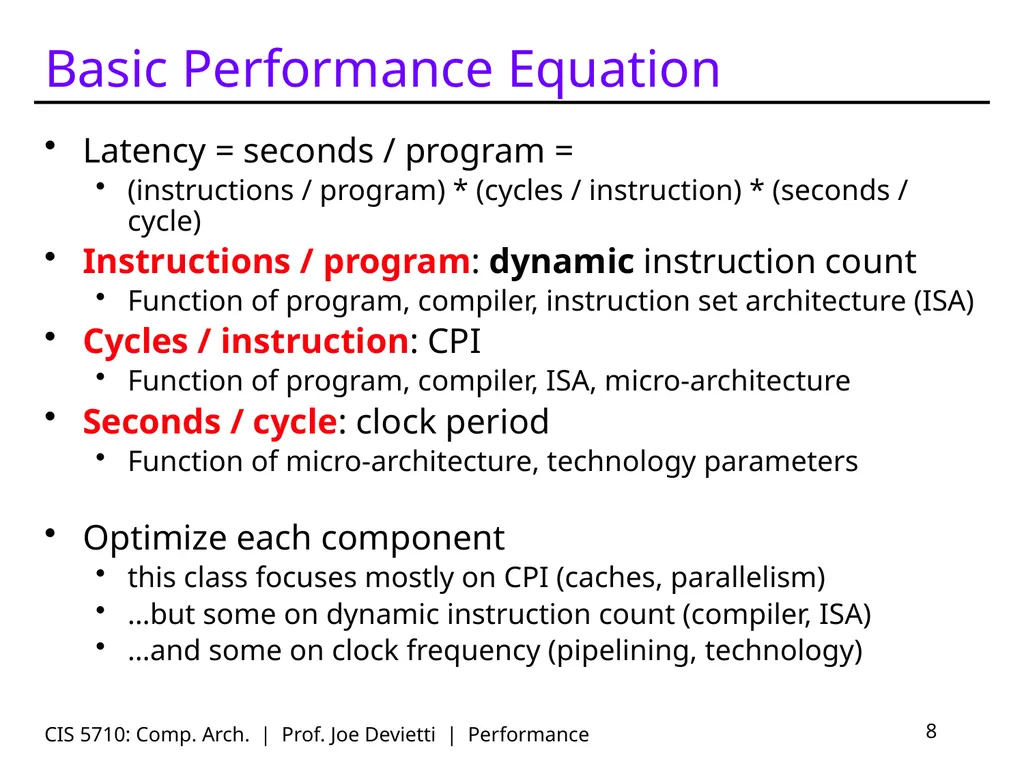
Basic Performance Equation Latency = seconds / program =
(instructions / program) * (cycles / instruction) * (seconds / cycle)
Instructions / program: dynamic instruction count
Function of program, compiler, instruction set architecture (ISA)
Cycles / instruction: CPI
Function of program, compiler, ISA, micro-architecture
Seconds / cycle: clock period
Function of micro-architecture, technology parameters
Optimize each component
this class focuses mostly on CPI (caches, parallelism)
…but some on dynamic instruction count (compiler, ISA)
…and some on clock frequency (pipelining, technology) CIS 5710: Comp. Arch. | Prof. Joe Devietti | Performance 8<br>
09
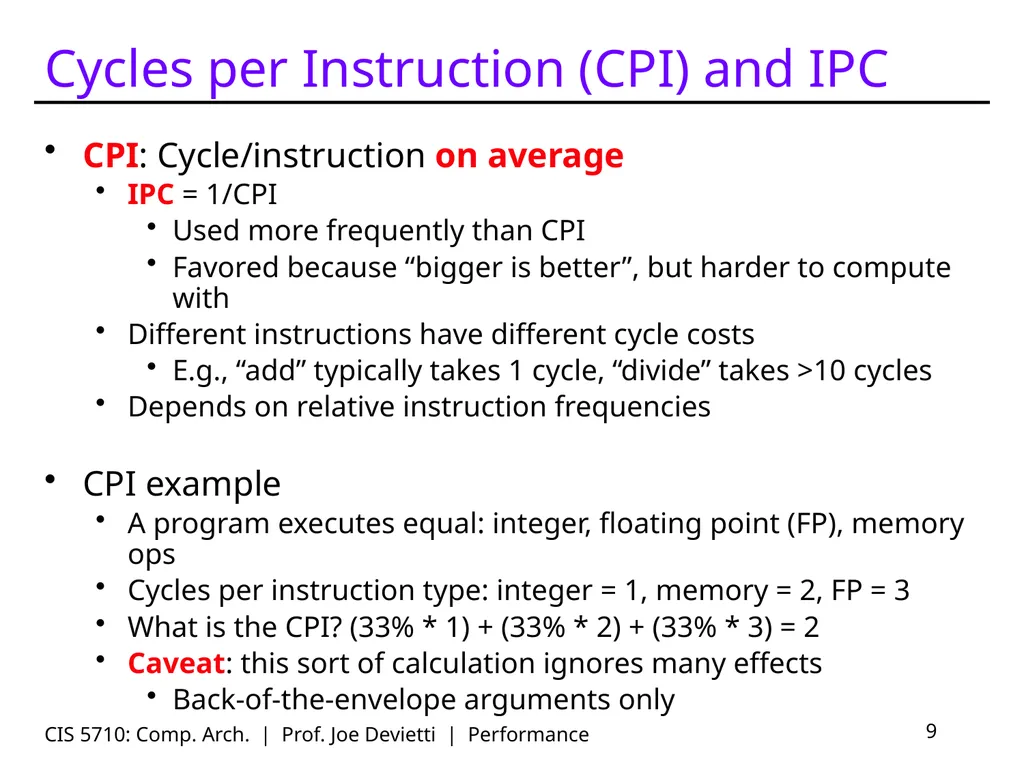
CIS 5710: Comp. Arch. | Prof. Joe Devietti | Performance 9 Cycles per Instruction (CPI) and IPC CPI: Cycle/instruction on average
IPC = 1/CPI
Used more frequently than CPI
Favored because “bigger is better”, but harder to compute with
Different instructions have different cycle costs
E.g., “add” typically takes 1 cycle, “divide” takes >10 cycles
Depends on relative instruction frequencies
CPI example
A program executes equal: integer, floating point (FP), memory ops
Cycles per instruction type: integer = 1, memory = 2, FP = 3
What is the CPI? (33% * 1) + (33% * 2) + (33% * 3) = 2
Caveat: this sort of calculation ignores many effects
Back-of-the-envelope arguments only<br>
10
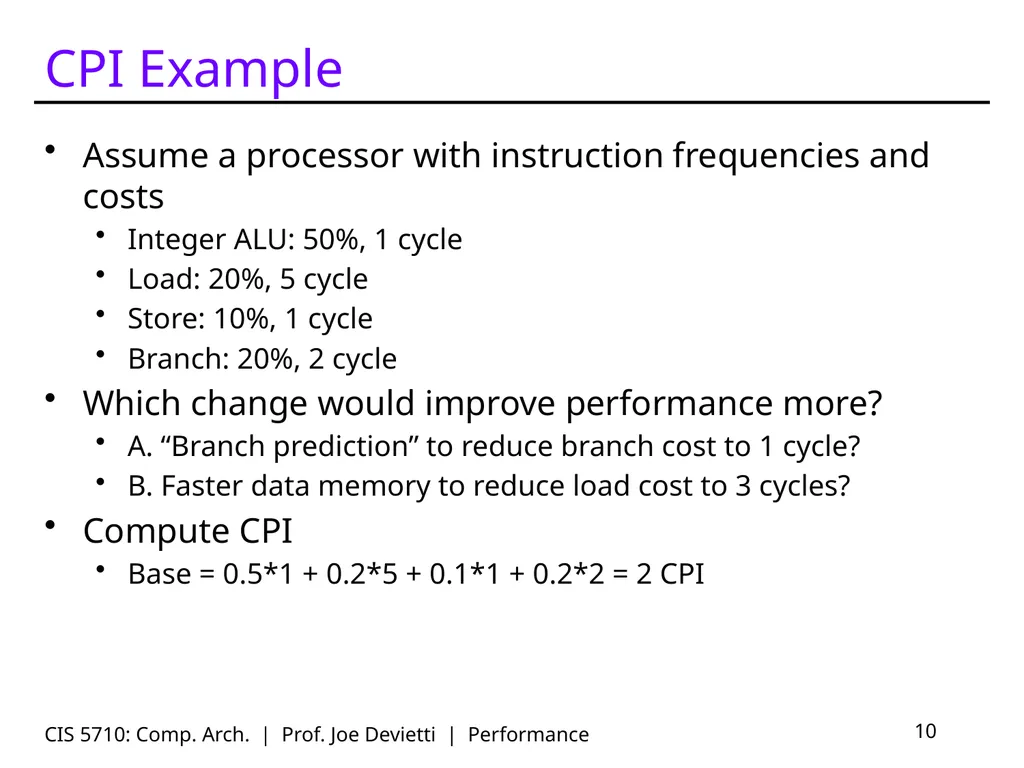
CIS 5710: Comp. Arch. | Prof. Joe Devietti | Performance 10 CPI Example Assume a processor with instruction frequencies and costs
Integer ALU: 50%, 1 cycle
Load: 20%, 5 cycle
Store: 10%, 1 cycle
Branch: 20%, 2 cycle
Which change would improve performance more?
A. “Branch prediction” to reduce branch cost to 1 cycle?
B. Faster data memory to reduce load cost to 3 cycles?
Compute CPI
Base = 0.5*1 + 0.2*5 + 0.1*1 + 0.2*2 = 2 CPI<br>
11
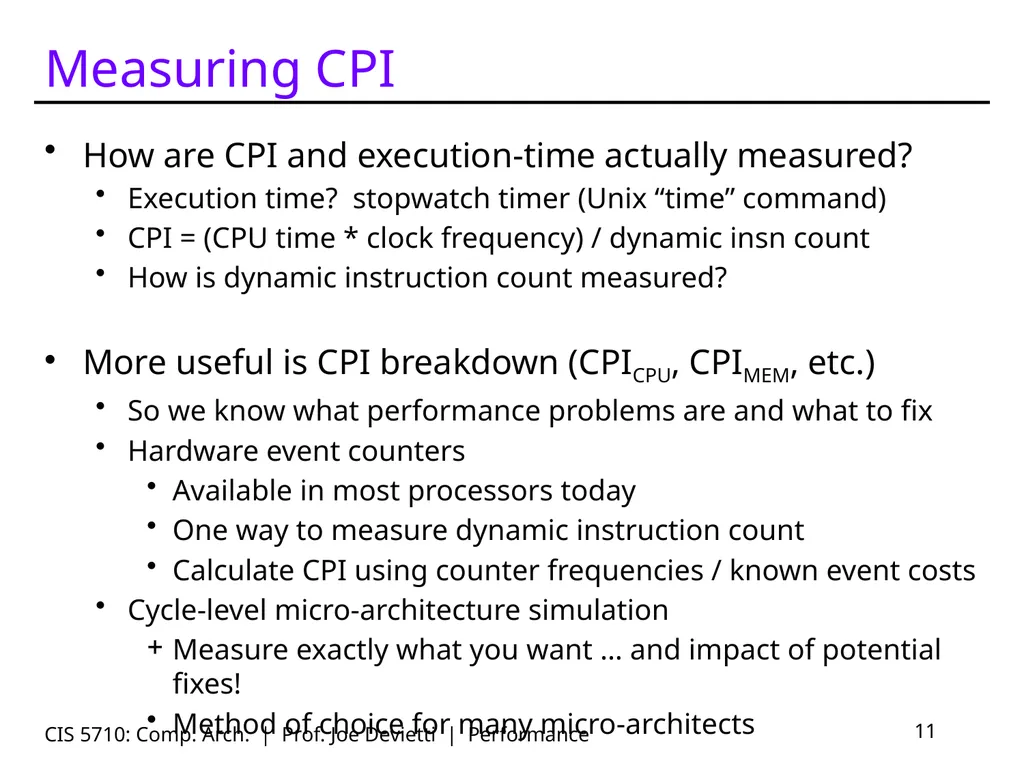
CIS 5710: Comp. Arch. | Prof. Joe Devietti | Performance 11 Measuring CPI How are CPI and execution-time actually measured?
Execution time? stopwatch timer (Unix “time” command)
CPI = (CPU time * clock frequency) / dynamic insn count
How is dynamic instruction count measured?
More useful is CPI breakdown (CPICPU, CPIMEM, etc.)
So we know what performance problems are and what to fix
Hardware event counters
Available in most processors today
One way to measure dynamic instruction count
Calculate CPI using counter frequencies / known event costs
Cycle-level micro-architecture simulation
Measure exactly what you want … and impact of potential fixes!
Method of choice for many micro-architects<br>
12
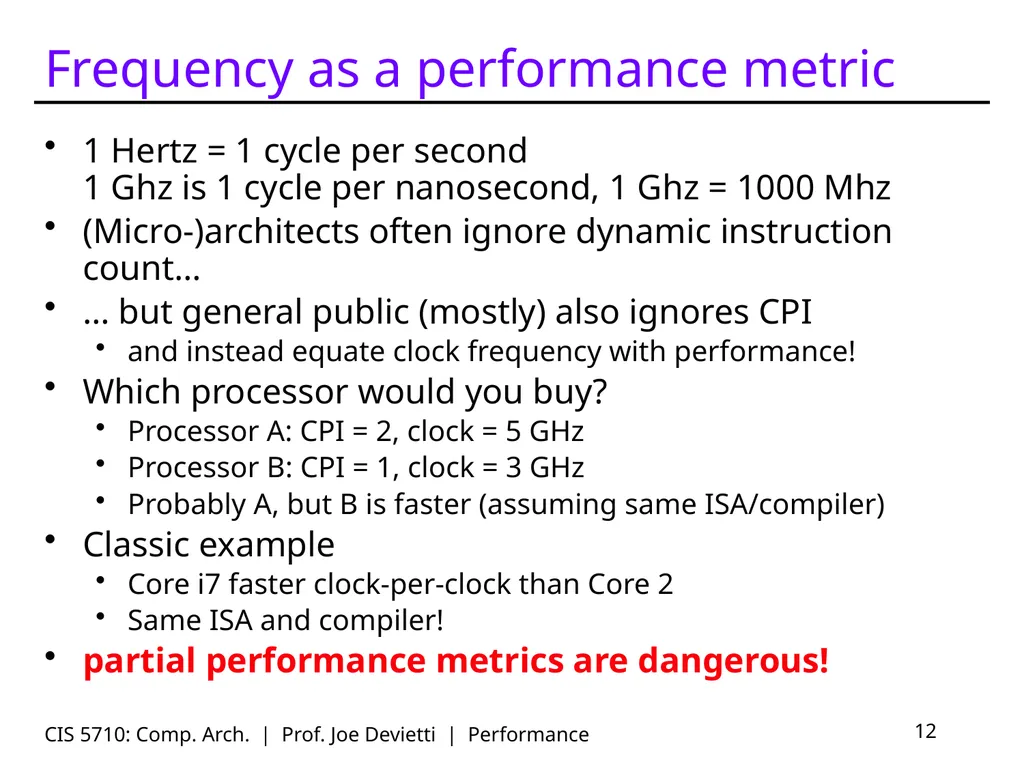
CIS 5710: Comp. Arch. | Prof. Joe Devietti | Performance 12 Frequency as a performance metric 1 Hertz = 1 cycle per second
1 Ghz is 1 cycle per nanosecond, 1 Ghz = 1000 Mhz
(Micro-)architects often ignore dynamic instruction count…
… but general public (mostly) also ignores CPI
and instead equate clock frequency with performance!
Which processor would you buy?
Processor A: CPI = 2, clock = 5 GHz
Processor B: CPI = 1, clock = 3 GHz
Probably A, but B is faster (assuming same ISA/compiler)
Classic example
Core i7 faster clock-per-clock than Core 2
Same ISA and compiler!
partial performance metrics are dangerous!<br>
13
Comparing Performance CIS 5710: Comp. Arch. | Prof. Joe Devietti | Performance 13<br>
14
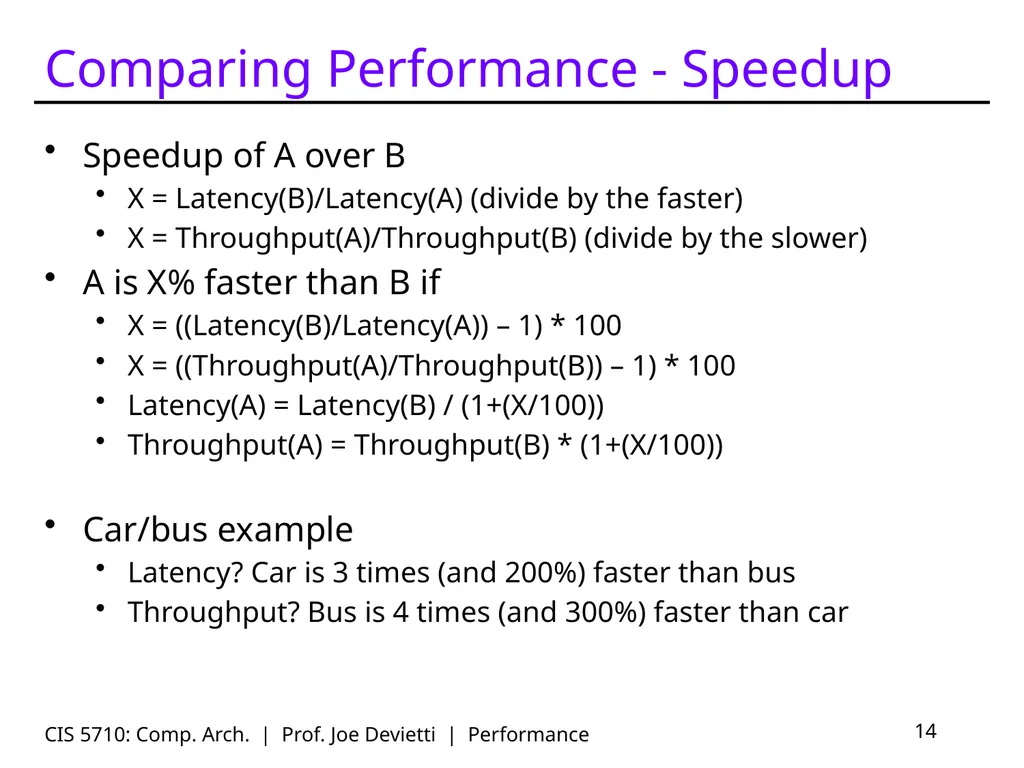
CIS 5710: Comp. Arch. | Prof. Joe Devietti | Performance 14 Comparing Performance - Speedup Speedup of A over B
X = Latency(B)/Latency(A) (divide by the faster)
X = Throughput(A)/Throughput(B) (divide by the slower)
A is X% faster than B if
X = ((Latency(B)/Latency(A)) – 1) * 100
X = ((Throughput(A)/Throughput(B)) – 1) * 100
Latency(A) = Latency(B) / (1+(X/100))
Throughput(A) = Throughput(B) * (1+(X/100))
Car/bus example
Latency? Car is 3 times (and 200%) faster than bus
Throughput? Bus is 4 times (and 300%) faster than car<br>
15
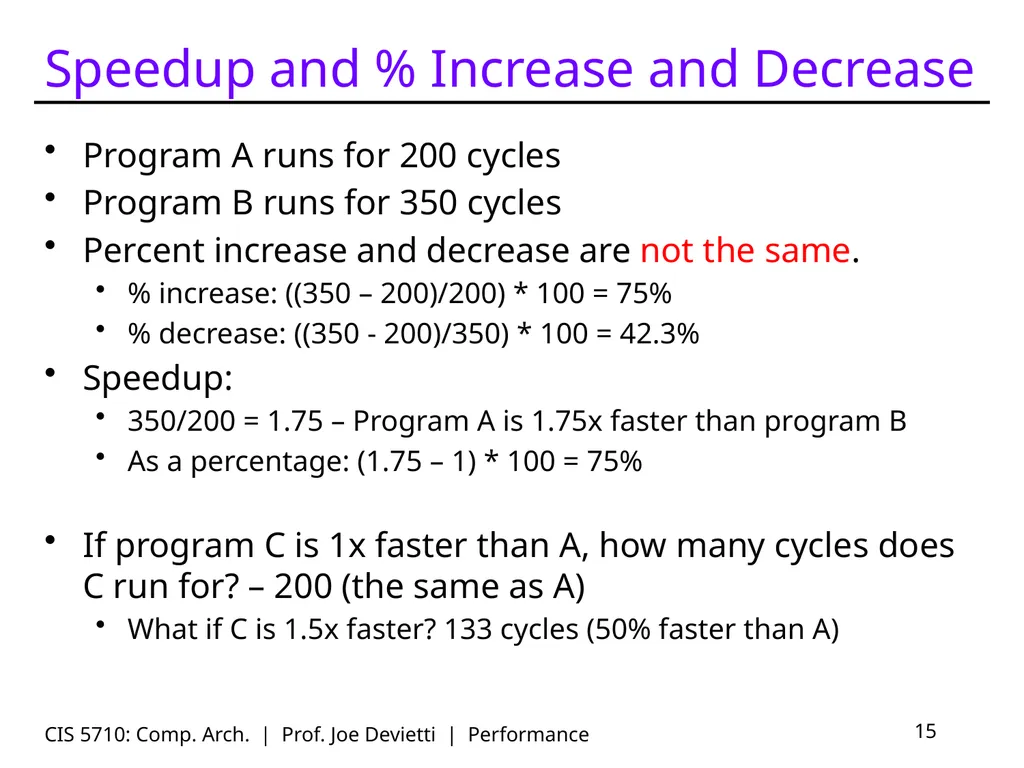
Speedup and % Increase and Decrease Program A runs for 200 cycles
Program B runs for 350 cycles
Percent increase and decrease are not the same.
% increase: ((350 – 200)/200) * 100 = 75%
% decrease: ((350 - 200)/350) * 100 = 42.3%
Speedup:
350/200 = 1.75 – Program A is 1.75x faster than program B
As a percentage: (1.75 – 1) * 100 = 75%
If program C is 1x faster than A, how many cycles does C run for? – 200 (the same as A)
What if C is 1.5x faster? 133 cycles (50% faster than A) CIS 5710: Comp. Arch. | Prof. Joe Devietti | Performance 15<br>
16
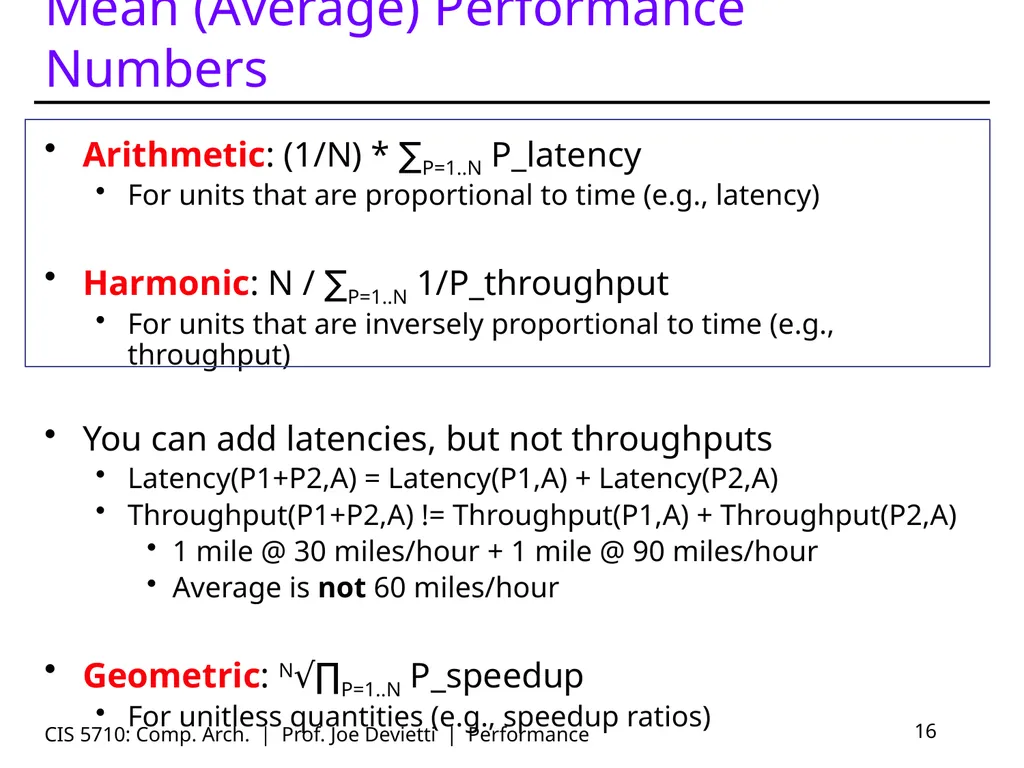
CIS 5710: Comp. Arch. | Prof. Joe Devietti | Performance 16 Mean (Average) Performance Numbers Arithmetic: (1/N) * ∑P=1..N P_latency
For units that are proportional to time (e.g., latency)
Harmonic: N / ∑P=1..N 1/P_throughput
For units that are inversely proportional to time (e.g., throughput)
You can add latencies, but not throughputs
Latency(P1+P2,A) = Latency(P1,A) + Latency(P2,A)
Throughput(P1+P2,A) != Throughput(P1,A) + Throughput(P2,A)
1 mile @ 30 miles/hour + 1 mile @ 90 miles/hour
Average is not 60 miles/hour
Geometric: N√∏P=1..N P_speedup
For unitless quantities (e.g., speedup ratios)<br>
17
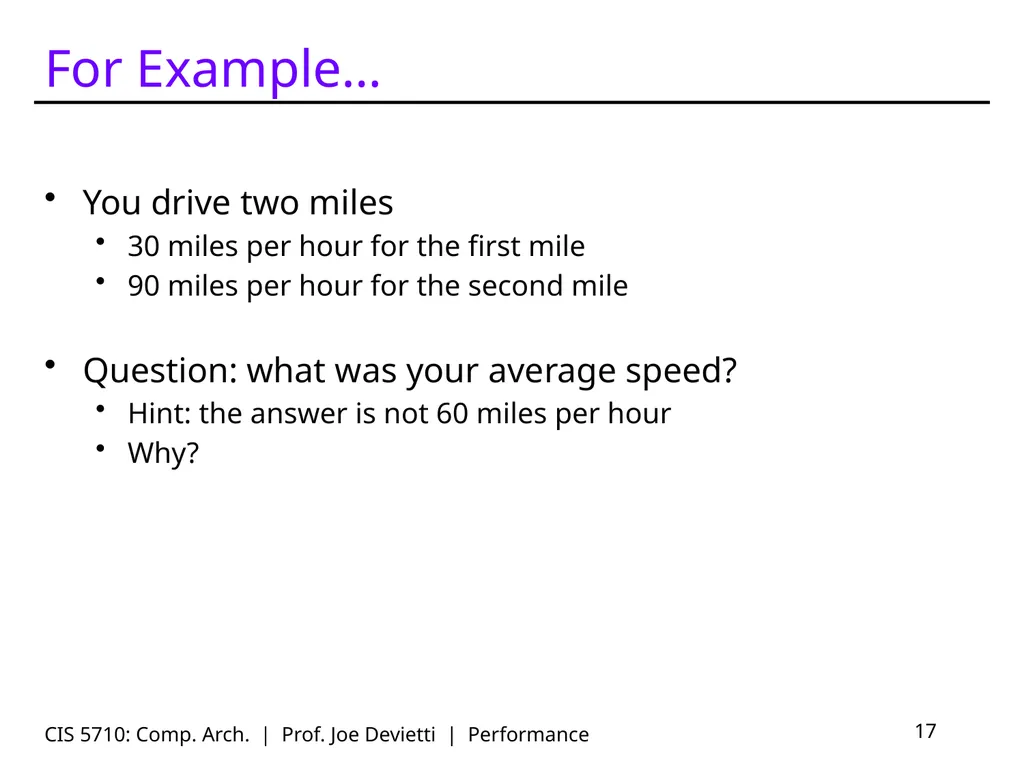
For Example… You drive two miles
30 miles per hour for the first mile
90 miles per hour for the second mile
Question: what was your average speed?
Hint: the answer is not 60 miles per hour
Why? CIS 5710: Comp. Arch. | Prof. Joe Devietti | Performance 17<br>
30 miles per hour for the first mile
90 miles per hour for the second mile
Question: what was your average speed?
Hint: the answer is not 60 miles per hour
Why? CIS 5710: Comp. Arch. | Prof. Joe Devietti | Performance 17<br>
18
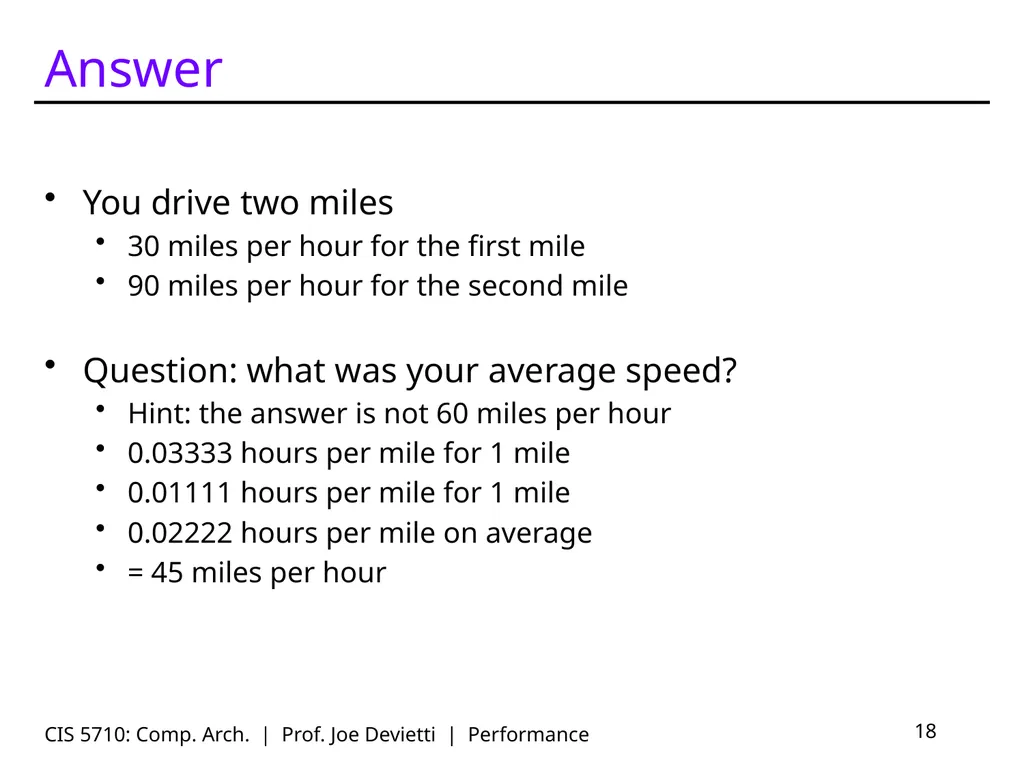
Answer You drive two miles
30 miles per hour for the first mile
90 miles per hour for the second mile
Question: what was your average speed?
Hint: the answer is not 60 miles per hour
0.03333 hours per mile for 1 mile
0.01111 hours per mile for 1 mile
0.02222 hours per mile on average
= 45 miles per hour CIS 5710: Comp. Arch. | Prof. Joe Devietti | Performance 18<br>
19
Measurement Challenges CIS 5710: Comp. Arch. | Prof. Joe Devietti | Performance 19<br>
20
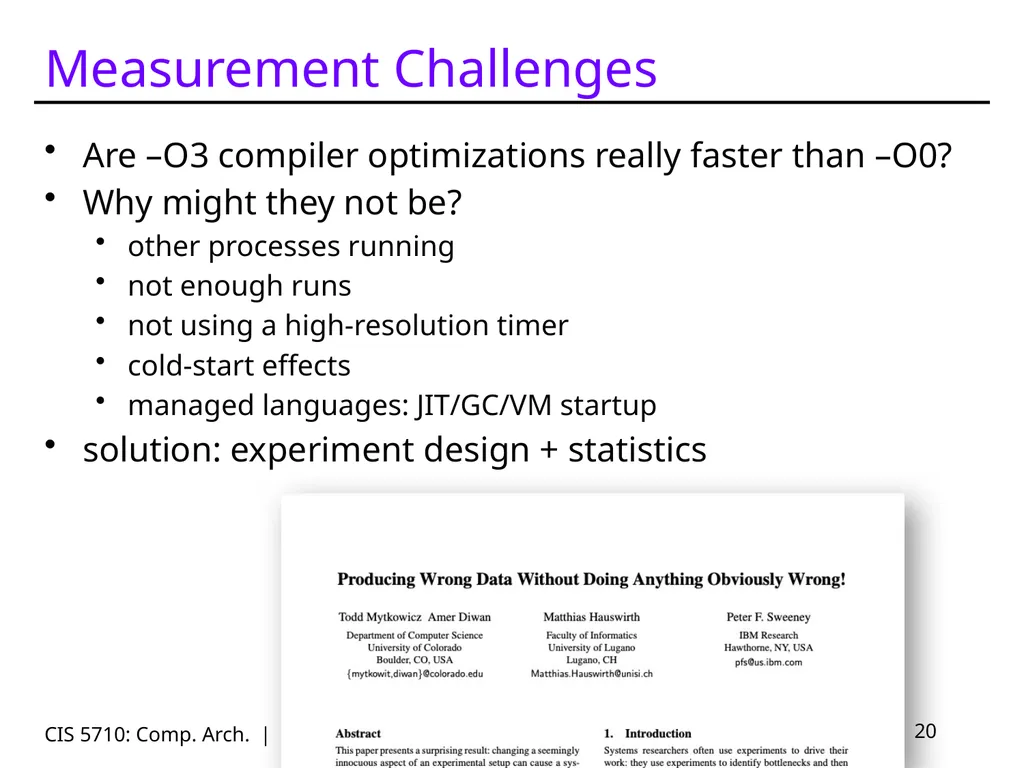
Measurement Challenges Are –O3 compiler optimizations really faster than –O0?
Why might they not be?
other processes running
not enough runs
not using a high-resolution timer
cold-start effects
managed languages: JIT/GC/VM startup
solution: experiment design + statistics CIS 5710: Comp. Arch. | Prof. Joe Devietti | Performance 20<br>
Why might they not be?
other processes running
not enough runs
not using a high-resolution timer
cold-start effects
managed languages: JIT/GC/VM startup
solution: experiment design + statistics CIS 5710: Comp. Arch. | Prof. Joe Devietti | Performance 20<br>
21
Experiment Design Two kinds of errors: systematic and random
removing systematic error
aka “measurement bias” or “not measuring what you think you are”
Run on an unloaded system
Measure something that runs for at least several seconds
Understand the system being measured
simple empty-for-loop test => compiler optimizes it away
Vary experimental setup
Use appropriate statistics
removing random error
Perform many runs: how many is enough? CIS 5710: Comp. Arch. | Prof. Joe Devietti | Performance 21<br>
22
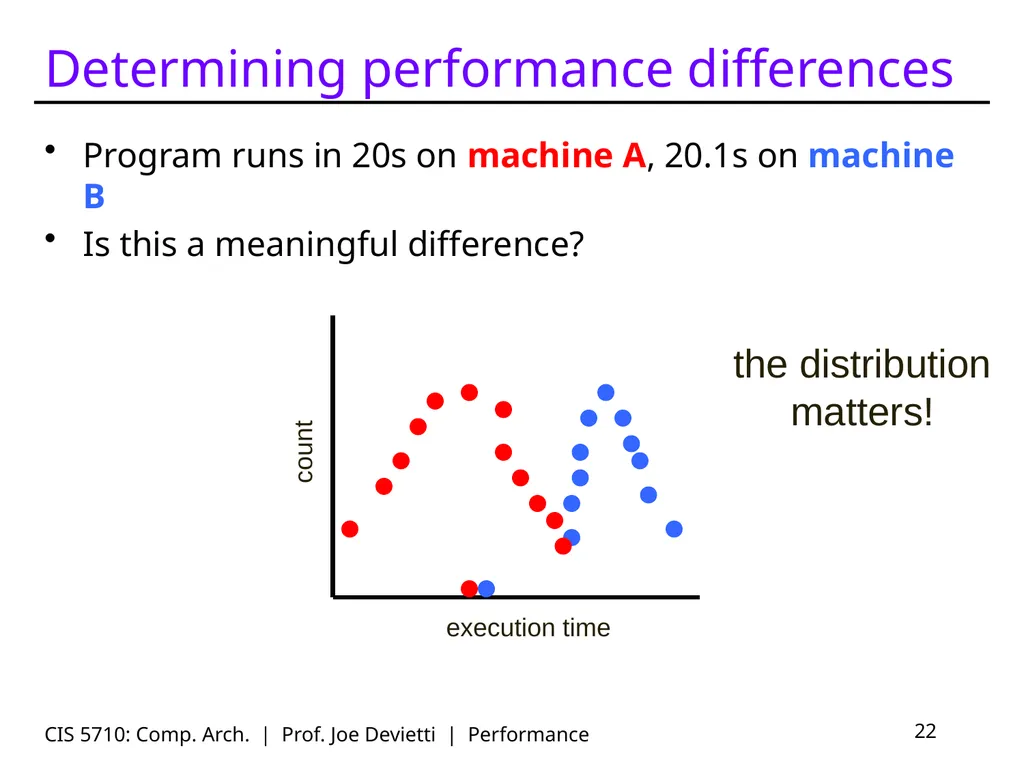
Determining performance differences Program runs in 20s on machine A, 20.1s on machine B
Is this a meaningful difference? CIS 5710: Comp. Arch. | Prof. Joe Devietti | Performance 22 count execution time the distribution matters!<br>
Is this a meaningful difference? CIS 5710: Comp. Arch. | Prof. Joe Devietti | Performance 22 count execution time the distribution matters!<br>
23
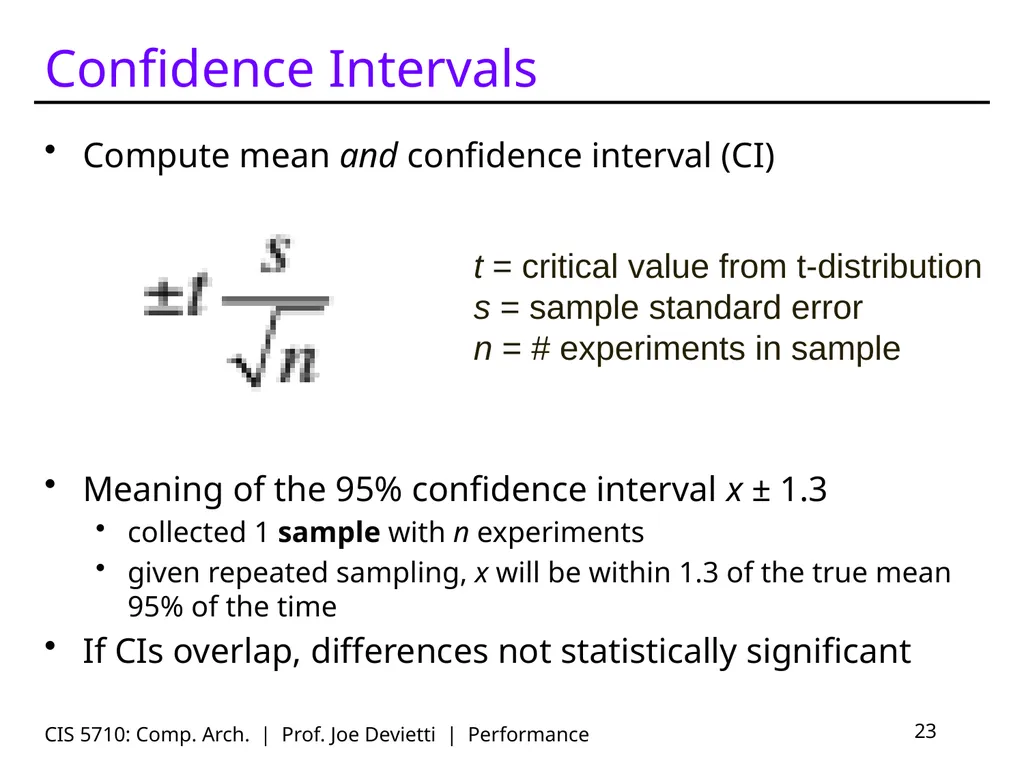
Confidence Intervals Compute mean and confidence interval (CI)
Meaning of the 95% confidence interval x ± 1.3
collected 1 sample with n experiments
given repeated sampling, x will be within 1.3 of the true mean 95% of the time
If CIs overlap, differences not statistically significant CIS 5710: Comp. Arch. | Prof. Joe Devietti | Performance 23 t = critical value from t-distribution
s = sample standard error
n = # experiments in sample<br>
24
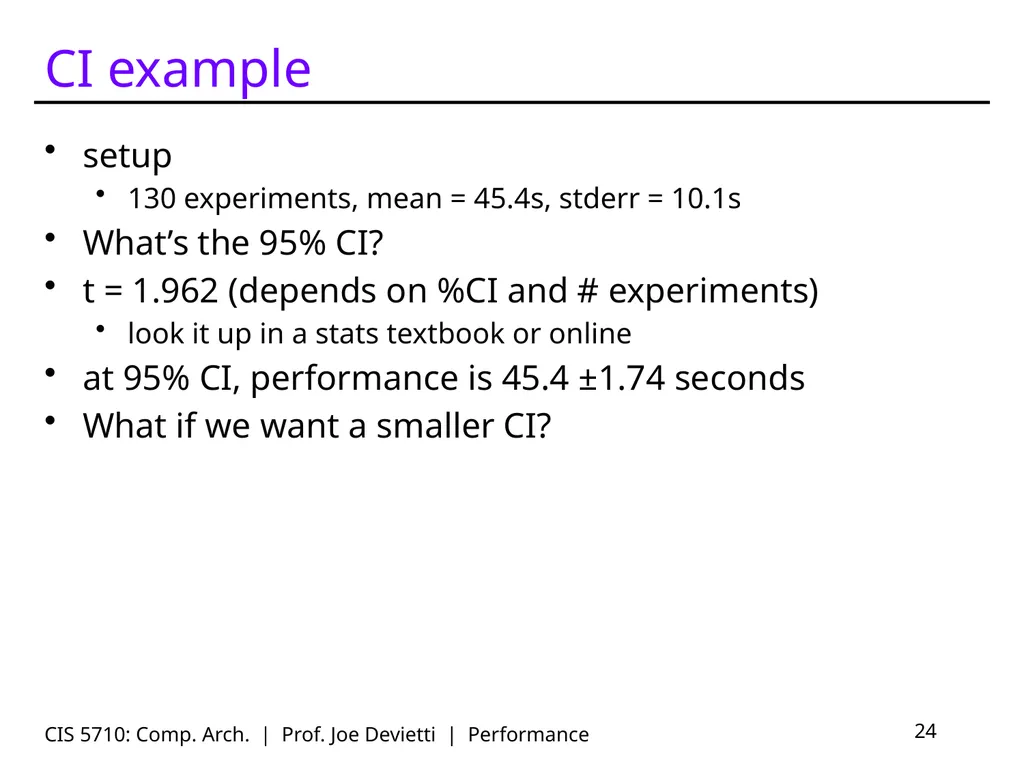
CI example setup
130 experiments, mean = 45.4s, stderr = 10.1s
What’s the 95% CI?
t = 1.962 (depends on %CI and # experiments)
look it up in a stats textbook or online
at 95% CI, performance is 45.4 ±1.74 seconds
What if we want a smaller CI? CIS 5710: Comp. Arch. | Prof. Joe Devietti | Performance 24<br>
130 experiments, mean = 45.4s, stderr = 10.1s
What’s the 95% CI?
t = 1.962 (depends on %CI and # experiments)
look it up in a stats textbook or online
at 95% CI, performance is 45.4 ±1.74 seconds
What if we want a smaller CI? CIS 5710: Comp. Arch. | Prof. Joe Devietti | Performance 24<br>
25
Benchmarking CIS 5710: Comp. Arch. | Prof. Joe Devietti | Performance 25<br>
26
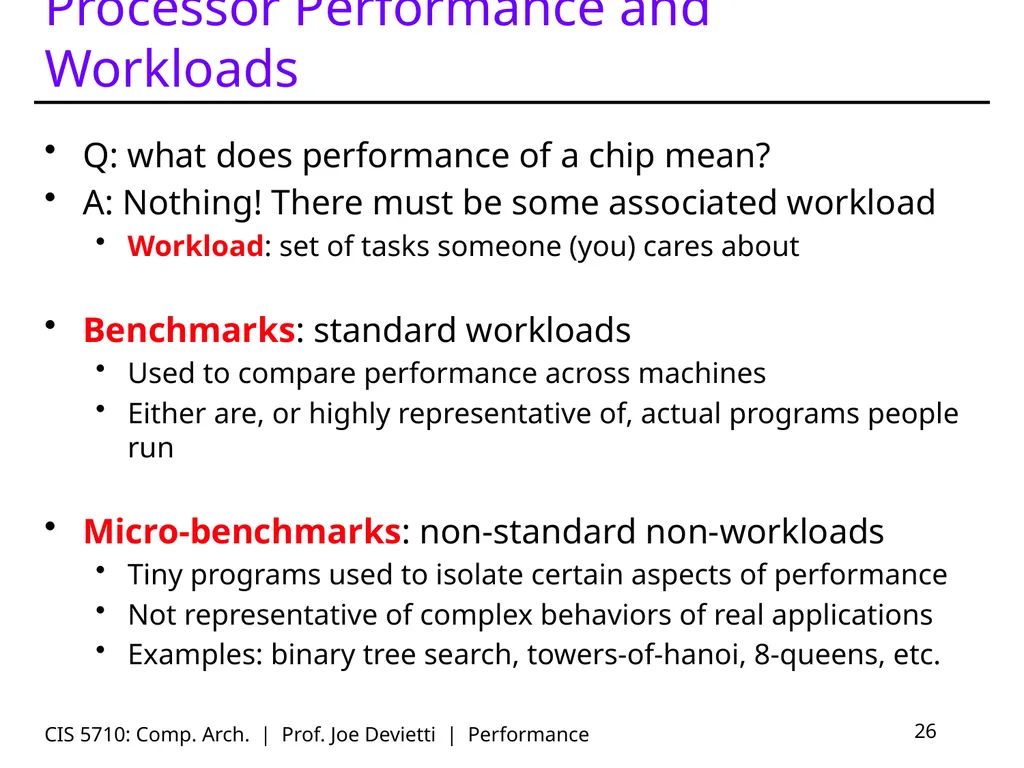
CIS 5710: Comp. Arch. | Prof. Joe Devietti | Performance 26 Processor Performance and Workloads Q: what does performance of a chip mean?
A: Nothing! There must be some associated workload
Workload: set of tasks someone (you) cares about
Benchmarks: standard workloads
Used to compare performance across machines
Either are, or highly representative of, actual programs people run
Micro-benchmarks: non-standard non-workloads
Tiny programs used to isolate certain aspects of performance
Not representative of complex behaviors of real applications
Examples: binary tree search, towers-of-hanoi, 8-queens, etc.<br>
27
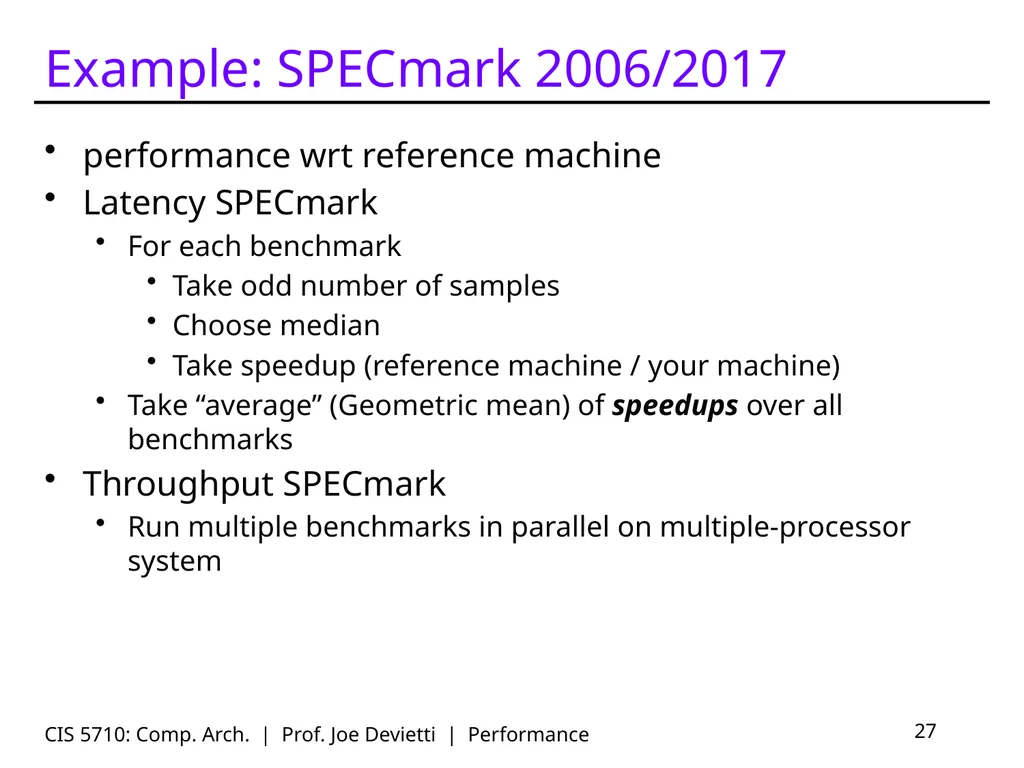
CIS 5710: Comp. Arch. | Prof. Joe Devietti | Performance 27 Example: SPECmark 2006/2017 performance wrt reference machine
Latency SPECmark
For each benchmark
Take odd number of samples
Choose median
Take speedup (reference machine / your machine)
Take “average” (Geometric mean) of speedups over all benchmarks
Throughput SPECmark
Run multiple benchmarks in parallel on multiple-processor system<br>
Latency SPECmark
For each benchmark
Take odd number of samples
Choose median
Take speedup (reference machine / your machine)
Take “average” (Geometric mean) of speedups over all benchmarks
Throughput SPECmark
Run multiple benchmarks in parallel on multiple-processor system<br>
28
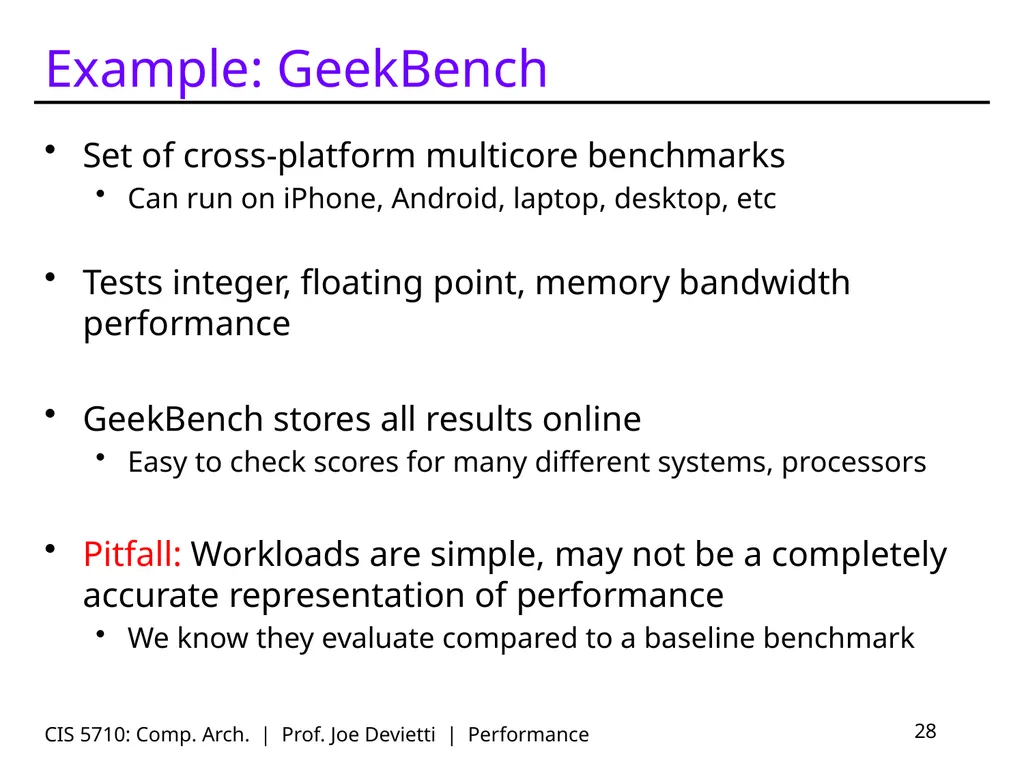
Example: GeekBench Set of cross-platform multicore benchmarks
Can run on iPhone, Android, laptop, desktop, etc
Tests integer, floating point, memory bandwidth performance
GeekBench stores all results online
Easy to check scores for many different systems, processors
Pitfall: Workloads are simple, may not be a completely accurate representation of performance
We know they evaluate compared to a baseline benchmark CIS 5710: Comp. Arch. | Prof. Joe Devietti | Performance 28<br>
29
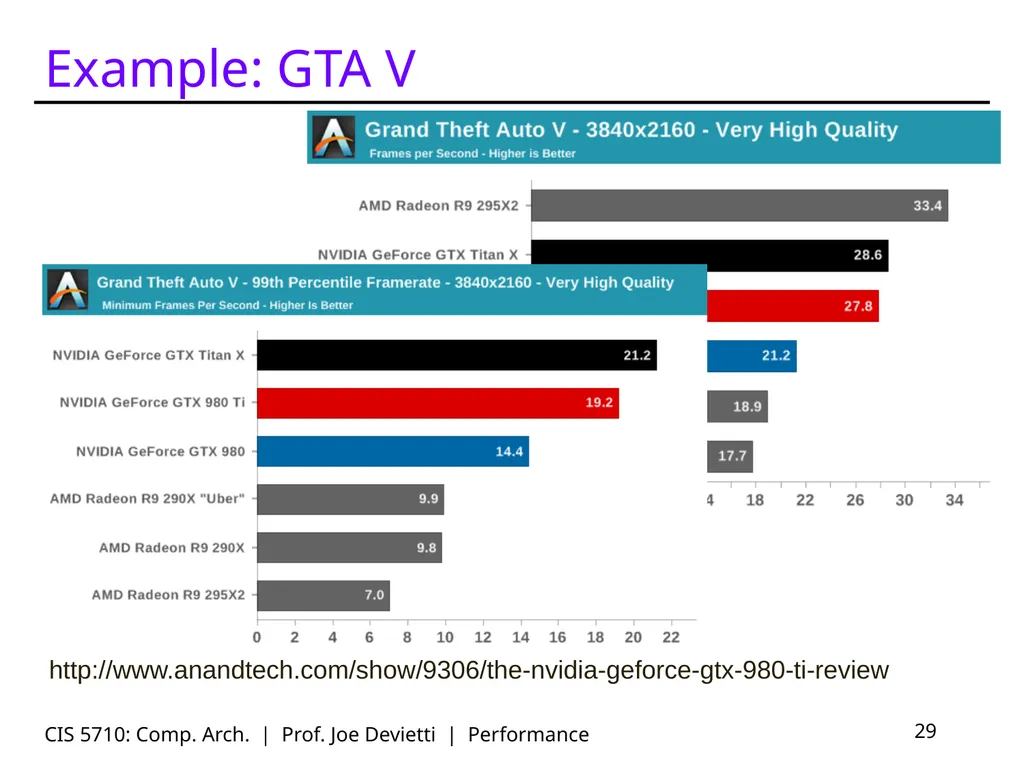
Example: GTA V CIS 5710: Comp. Arch. | Prof. Joe Devietti | Performance 29 http://www.anandtech.com/show/9306/the-nvidia-geforce-gtx-980-ti-review<br>
30
Performance Laws CIS 5710: Comp. Arch. | Prof. Joe Devietti | Performance 30<br>
31
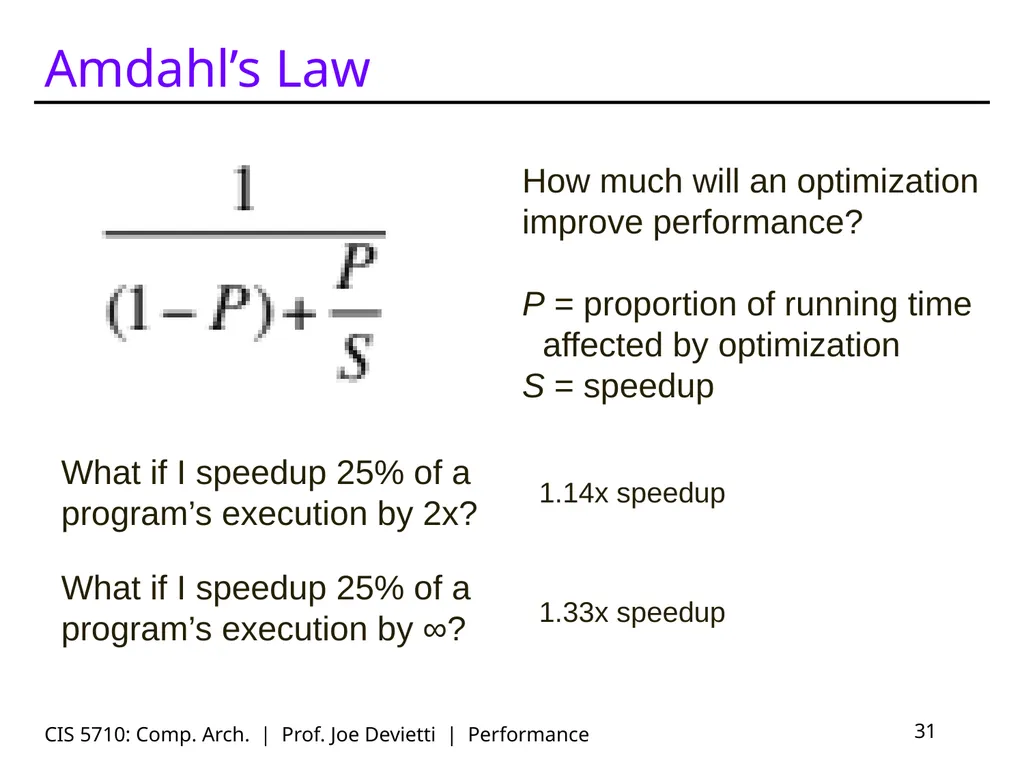
Amdahl’s Law CIS 5710: Comp. Arch. | Prof. Joe Devietti | Performance 31 How much will an optimization improve performance?
P = proportion of running time affected by optimization
S = speedup What if I speedup 25% of a program’s execution by 2x? 1.14x speedup What if I speedup 25% of a program’s execution by ∞? 1.33x speedup<br>
P = proportion of running time affected by optimization
S = speedup What if I speedup 25% of a program’s execution by 2x? 1.14x speedup What if I speedup 25% of a program’s execution by ∞? 1.33x speedup<br>
32
Amdahl’s Law for the US Budget CIS 5710: Comp. Arch. | Prof. Joe Devietti | Performance 32 https://www.whitehouse.gov/omb/historical-tables/ scrapping Dept of Education ($111B) cuts budget by 2.7%<br>
33
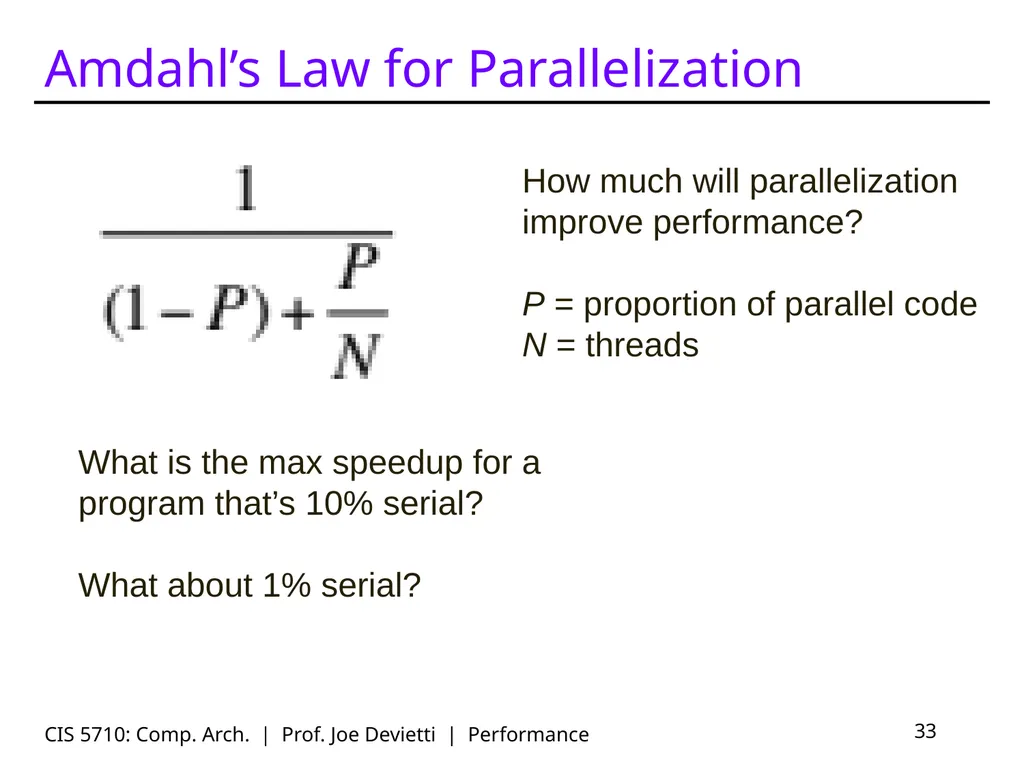
Amdahl’s Law for Parallelization CIS 5710: Comp. Arch. | Prof. Joe Devietti | Performance 33 How much will parallelization improve performance?
P = proportion of parallel code
N = threads What is the max speedup for a program that’s 10% serial?
What about 1% serial?<br>
P = proportion of parallel code
N = threads What is the max speedup for a program that’s 10% serial?
What about 1% serial?<br>
34
Increasing proportion of parallel code Amdahl’s Law requires extremely parallel code to take advantage of large multiprocessors
two approaches:
strong scaling: shrink the serial component
same problem runs faster
becomes harder and harder to do
weak scaling: increase the problem size
natural in many problem domains: internet systems, scientific computing, video games
doesn’t work in other domains CIS 5710: Comp. Arch. | Prof. Joe Devietti | Performance 34<br>
35
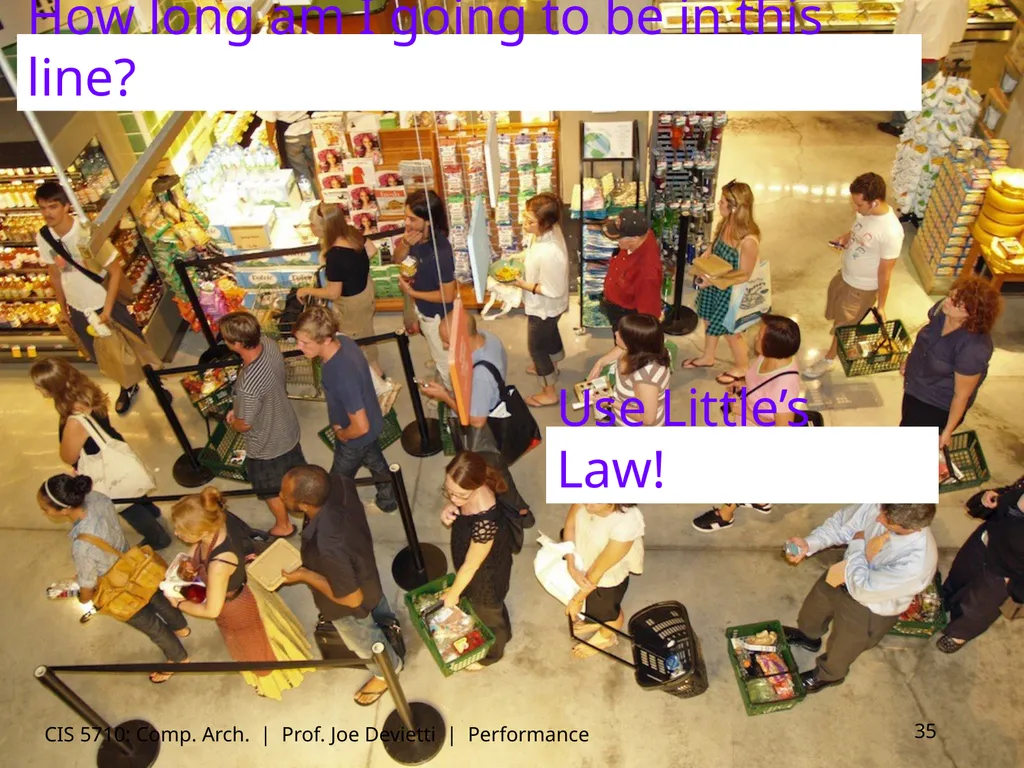
Use Little’s Law! CIS 5710: Comp. Arch. | Prof. Joe Devietti | Performance 35 How long am I going to be in this line?<br>
36
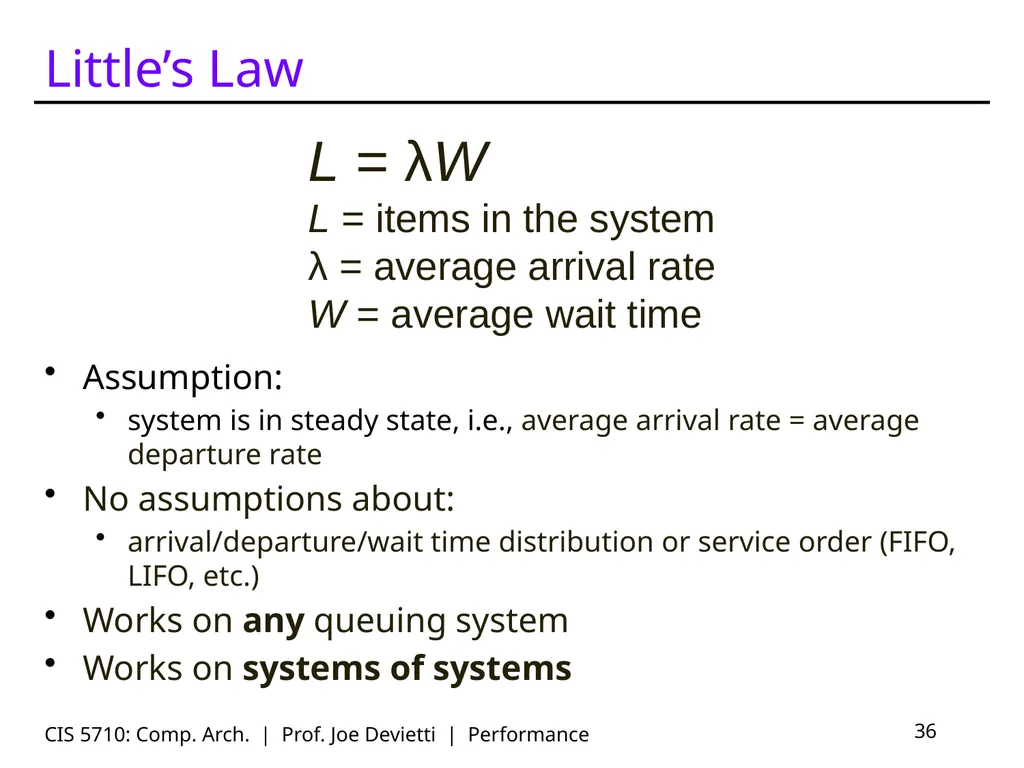
Little’s Law Assumption:
system is in steady state, i.e., average arrival rate = average departure rate
No assumptions about:
arrival/departure/wait time distribution or service order (FIFO, LIFO, etc.)
Works on any queuing system
Works on systems of systems CIS 5710: Comp. Arch. | Prof. Joe Devietti | Performance 36 L = λW
L = items in the system
λ = average arrival rate
W = average wait time<br>
37
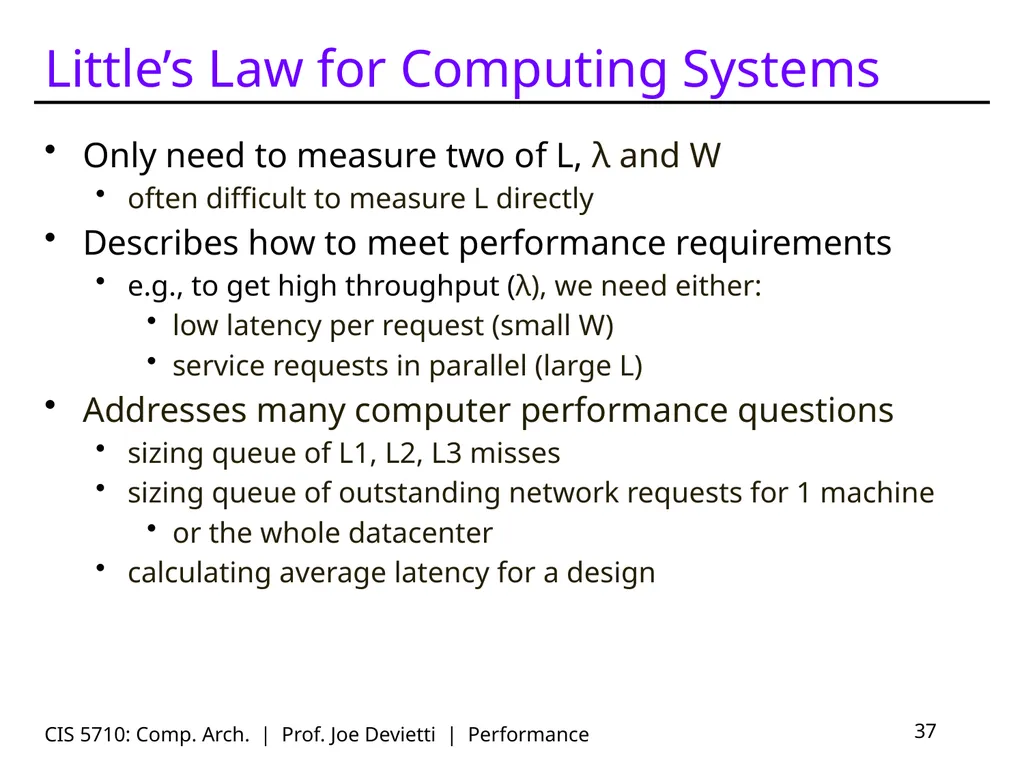
Little’s Law for Computing Systems Only need to measure two of L, λ and W
often difficult to measure L directly
Describes how to meet performance requirements
e.g., to get high throughput (λ), we need either:
low latency per request (small W)
service requests in parallel (large L)
Addresses many computer performance questions
sizing queue of L1, L2, L3 misses
sizing queue of outstanding network requests for 1 machine
or the whole datacenter
calculating average latency for a design CIS 5710: Comp. Arch. | Prof. Joe Devietti | Performance 37<br>
38
Optimizing Performance CIS 5710: Comp. Arch. | Prof. Joe Devietti | Performance 38<br>
39
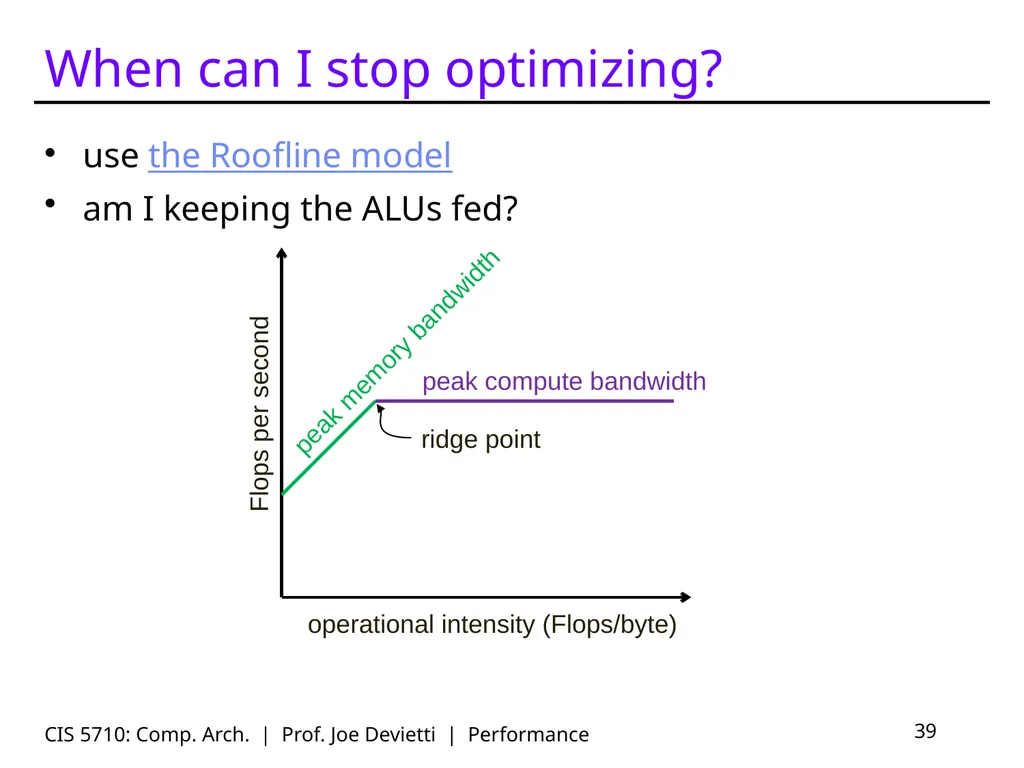
When can I stop optimizing? use the Roofline model
am I keeping the ALUs fed? CIS 5710: Comp. Arch. | Prof. Joe Devietti | Performance 39 Flops per second operational intensity (Flops/byte) peak memory bandwidth peak compute bandwidth ridge point<br>
am I keeping the ALUs fed? CIS 5710: Comp. Arch. | Prof. Joe Devietti | Performance 39 Flops per second operational intensity (Flops/byte) peak memory bandwidth peak compute bandwidth ridge point<br>
40
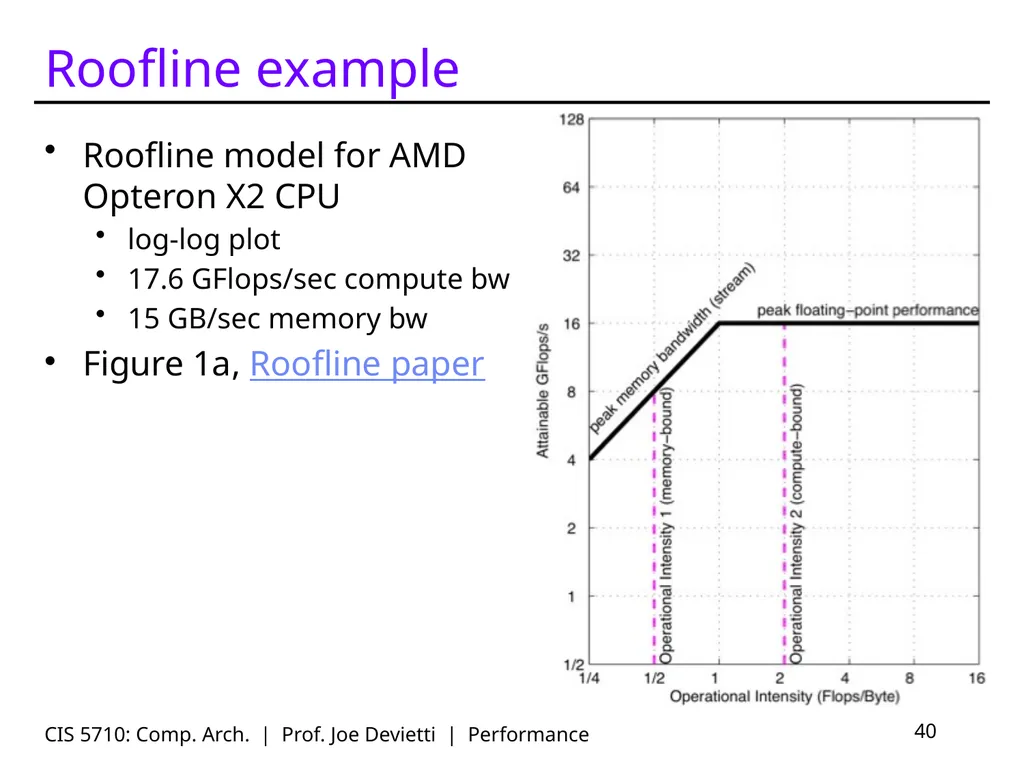
Roofline example Roofline model for AMD Opteron X2 CPU
log-log plot
17.6 GFlops/sec compute bw
15 GB/sec memory bw
Figure 1a, Roofline paper CIS 5710: Comp. Arch. | Prof. Joe Devietti | Performance 40<br>
log-log plot
17.6 GFlops/sec compute bw
15 GB/sec memory bw
Figure 1a, Roofline paper CIS 5710: Comp. Arch. | Prof. Joe Devietti | Performance 40<br>
41
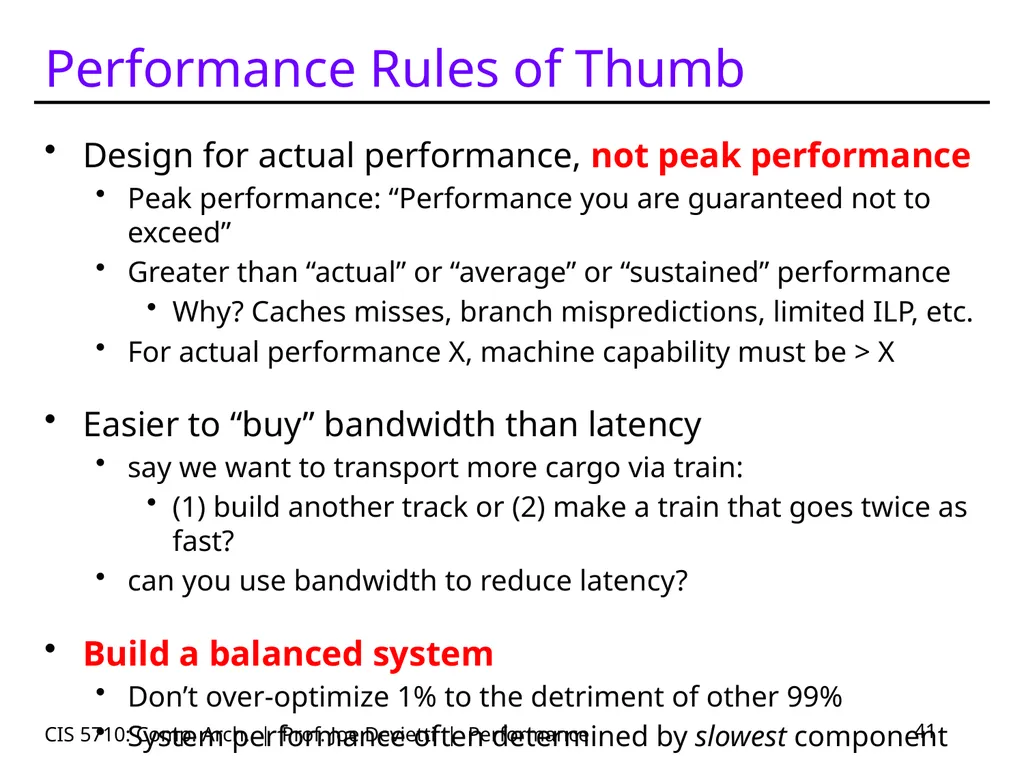
CIS 5710: Comp. Arch. | Prof. Joe Devietti | Performance 41 Performance Rules of Thumb Design for actual performance, not peak performance
Peak performance: “Performance you are guaranteed not to exceed”
Greater than “actual” or “average” or “sustained” performance
Why? Caches misses, branch mispredictions, limited ILP, etc.
For actual performance X, machine capability must be > X
Easier to “buy” bandwidth than latency
say we want to transport more cargo via train:
(1) build another track or (2) make a train that goes twice as fast?
can you use bandwidth to reduce latency?
Build a balanced system
Don’t over-optimize 1% to the detriment of other 99%
System performance often determined by slowest component<br>
42
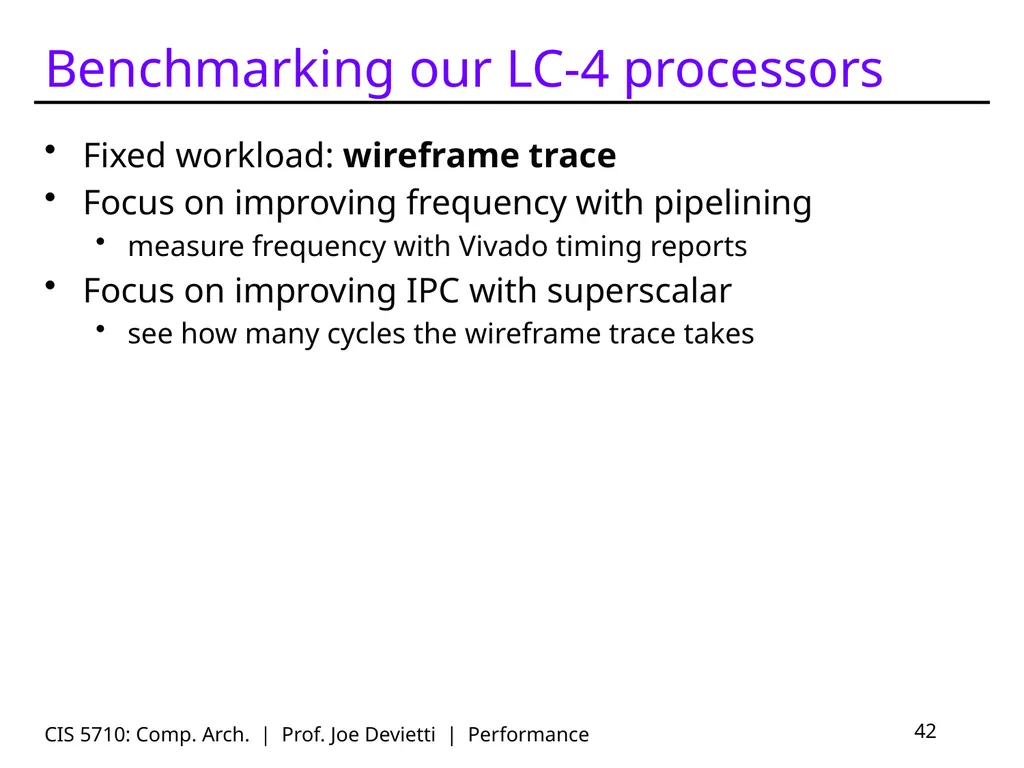
Benchmarking our LC-4 processors Fixed workload: wireframe trace
Focus on improving frequency with pipelining
measure frequency with Vivado timing reports
Focus on improving IPC with superscalar
see how many cycles the wireframe trace takes 42 CIS 5710: Comp. Arch. | Prof. Joe Devietti | Performance<br>
Focus on improving frequency with pipelining
measure frequency with Vivado timing reports
Focus on improving IPC with superscalar
see how many cycles the wireframe trace takes 42 CIS 5710: Comp. Arch. | Prof. Joe Devietti | Performance<br>