
Comments on Louise Sheiner, “The ACA Provider Cuts
TA
Published · 12 slides · 0 views

1 / 1






Description
Comments on Louise Sheiner, The ACA Provider Cuts and Productivity Growth in Health Care and Stephen Heffler, Estimating Resource-Based Hospital Multifactor Productivity Growth Ernst R. Berndt, MIT Sloan School of Management and NBER
Related Topics
Share
Embed code
Download this presentation From Below
"Comments on Louise Sheiner, “The ACA Provider Cuts" is the property of its rightful owner. Permission is granted to download and print the materials on this website for personal, non-commercial use only, and to display it on your personal computer provided you do not modify the materials and that you retain all copyright notices contained in the materials. By downloading content from our website, you accept the terms of this agreement.
Presentation Transcript
01
Comments on Louise Sheiner, “The ACA Provider Cuts and Productivity Growth in Health Care” and Stephen Heffler, “Estimating Resource-Based Hospital Multifactor Productivity Growth” Ernst R. Berndt, MIT Sloan School of Management and NBER
The Brookings Institution, Washington DC
May 3, 2016<br>
The Brookings Institution, Washington DC
May 3, 2016<br>
02
Background ACA legislation mandates that CMS’ Part A and some of Part B annual payments change by the difference between multifactor productivity growth in the health care sector minus the ten-year average of MFP growth in the overall private US economy
Historically, in almost all empirical US studies, MFP and labor productivity growth in various health care sectors have been lower (and in some cases, even negative) than that in the overall private US economy.
Focus of presentations by Sheiner and Heffler: (i) Is MFP growth in the US health care sector biased downward; (ii) What are the implications for implementation of the ACA payment change mandates? And (iii) what are the priorities for future policy and multifactor growth productivity research?<br>
Historically, in almost all empirical US studies, MFP and labor productivity growth in various health care sectors have been lower (and in some cases, even negative) than that in the overall private US economy.
Focus of presentations by Sheiner and Heffler: (i) Is MFP growth in the US health care sector biased downward; (ii) What are the implications for implementation of the ACA payment change mandates? And (iii) what are the priorities for future policy and multifactor growth productivity research?<br>
03
Discussion Points Theoretical underpinnings
What assumptions are made going from theory to empirical implementation?
Conventional Jorgenson-Griliches-Christensen growth accounting
Econometric/parametric estimates
Which assumptions are particularly problematic in US health care?
All inputs variable, marginal revenue products equal marginal input costs
Constant returns to scale, no labor or capital fixed inputs
No market power by providers, so zero economic profits
No principal-agent problems, asymmetric information, moral hazard, i.e. the traditional neoclassical model of consumer (whoever that is in health care) behavior maximizing utility subject to input prices and income constraints, is applicable
Priorities for future research agendas<br>
What assumptions are made going from theory to empirical implementation?
Conventional Jorgenson-Griliches-Christensen growth accounting
Econometric/parametric estimates
Which assumptions are particularly problematic in US health care?
All inputs variable, marginal revenue products equal marginal input costs
Constant returns to scale, no labor or capital fixed inputs
No market power by providers, so zero economic profits
No principal-agent problems, asymmetric information, moral hazard, i.e. the traditional neoclassical model of consumer (whoever that is in health care) behavior maximizing utility subject to input prices and income constraints, is applicable
Priorities for future research agendas<br>
04
Theoretical Underpinnings for MFP Relationship among primal MFP growth ƐFt, dual MFP growth ƐCt and returns to scale Ɛ-1CY where Y = F(X,t) and C = G(Y, px, t) is
ƐCt = - Ɛ-1CY ƐFt
Hence dual MFP growth = negative the product of returns to scale times primal MFP growth.
Note that if we assume constant returns to scale, this reduces to:
ƐCt = - ƐFt<br>
ƐCt = - Ɛ-1CY ƐFt
Hence dual MFP growth = negative the product of returns to scale times primal MFP growth.
Note that if we assume constant returns to scale, this reduces to:
ƐCt = - ƐFt<br>
05
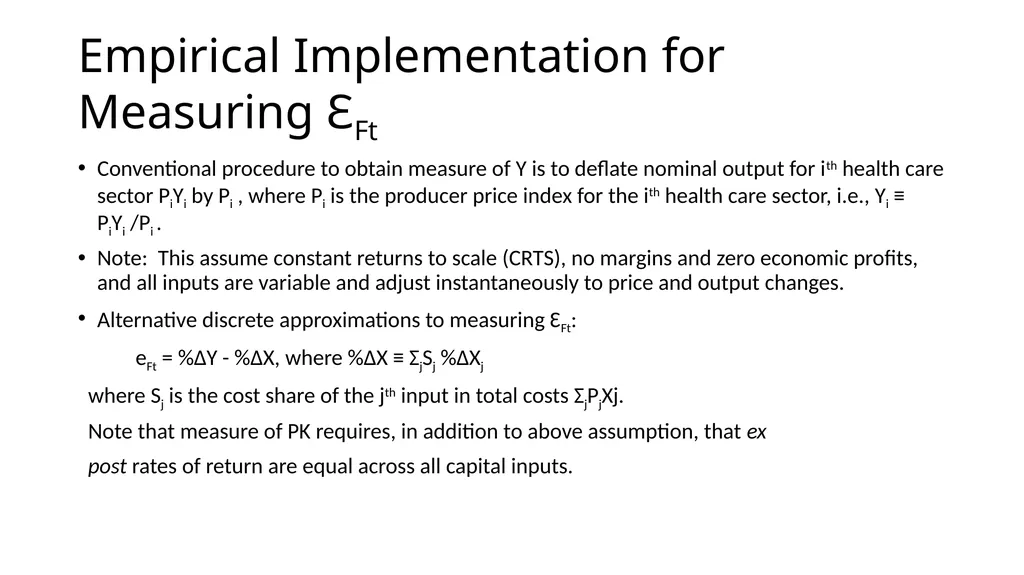
Empirical Implementation for Measuring ƐFt Conventional procedure to obtain measure of Y is to deflate nominal output for ith health care sector PiYi by Pi , where Pi is the producer price index for the ith health care sector, i.e., Yi ≡ PiYi /Pi .
Note: This assume constant returns to scale (CRTS), no margins and zero economic profits, and all inputs are variable and adjust instantaneously to price and output changes.
Alternative discrete approximations to measuring ƐFt:
eFt = %ΔY - %ΔX, where %ΔX ≡ ΣjSj %ΔXj
where Sj is the cost share of the jth input in total costs ΣjPjXj.
Note that measure of PK requires, in addition to above assumption, that ex
post rates of return are equal across all capital inputs.<br>
Note: This assume constant returns to scale (CRTS), no margins and zero economic profits, and all inputs are variable and adjust instantaneously to price and output changes.
Alternative discrete approximations to measuring ƐFt:
eFt = %ΔY - %ΔX, where %ΔX ≡ ΣjSj %ΔXj
where Sj is the cost share of the jth input in total costs ΣjPjXj.
Note that measure of PK requires, in addition to above assumption, that ex
post rates of return are equal across all capital inputs.<br>
06
Various Discrete Approximations to Measure Percent Changes in Inputs and Outputs For output percent change measurement,
%ΔY ≈ (Yt – Yt-1)/0.5*(Yt + Yt-1) – arc elasticity, or, for small changes,
≈ ln (Yt/Yt-1)
For input j percent change measurement,
%ΔXj ≈ (Xj,t – Xj,t-1)/0.5*(Xj,t + Xj,t-1) – or for small changes,
≈ ln (Xj,t/Xj,t-1).
For small changes, expect there will be little material difference
between the alternative approximations. But not so for substantial
changes.<br>
%ΔY ≈ (Yt – Yt-1)/0.5*(Yt + Yt-1) – arc elasticity, or, for small changes,
≈ ln (Yt/Yt-1)
For input j percent change measurement,
%ΔXj ≈ (Xj,t – Xj,t-1)/0.5*(Xj,t + Xj,t-1) – or for small changes,
≈ ln (Xj,t/Xj,t-1).
For small changes, expect there will be little material difference
between the alternative approximations. But not so for substantial
changes.<br>
07
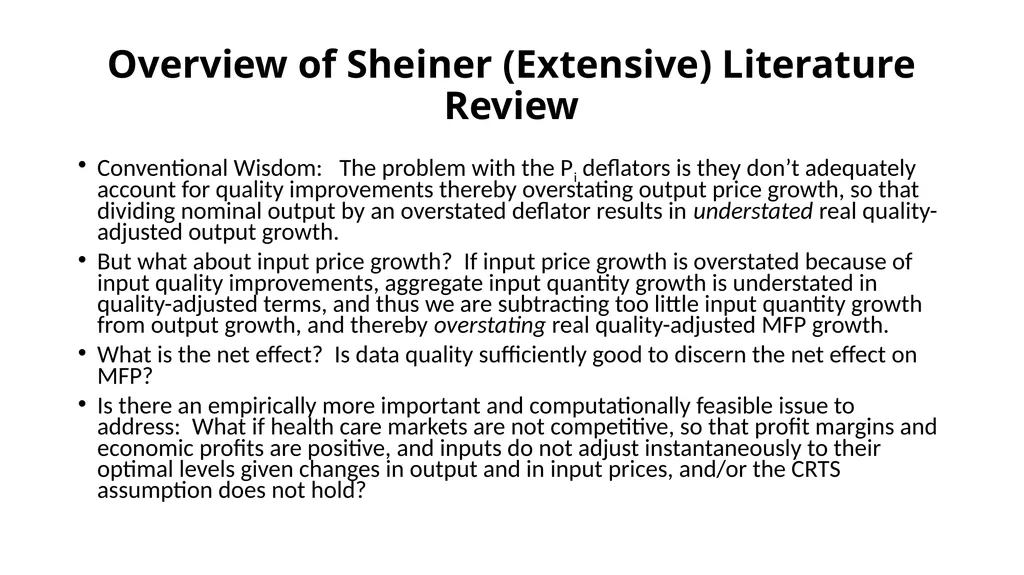
Overview of Sheiner (Extensive) Literature Review Conventional Wisdom: The problem with the Pi deflators is they don’t adequately account for quality improvements thereby overstating output price growth, so that dividing nominal output by an overstated deflator results in understated real quality-adjusted output growth.
But what about input price growth? If input price growth is overstated because of input quality improvements, aggregate input quantity growth is understated in quality-adjusted terms, and thus we are subtracting too little input quantity growth from output growth, and thereby overstating real quality-adjusted MFP growth.
What is the net effect? Is data quality sufficiently good to discern the net effect on MFP?
Is there an empirically more important and computationally feasible issue to address: What if health care markets are not competitive, so that profit margins and economic profits are positive, and inputs do not adjust instantaneously to their optimal levels given changes in output and in input prices, and/or the CRTS assumption does not hold?<br>
But what about input price growth? If input price growth is overstated because of input quality improvements, aggregate input quantity growth is understated in quality-adjusted terms, and thus we are subtracting too little input quantity growth from output growth, and thereby overstating real quality-adjusted MFP growth.
What is the net effect? Is data quality sufficiently good to discern the net effect on MFP?
Is there an empirically more important and computationally feasible issue to address: What if health care markets are not competitive, so that profit margins and economic profits are positive, and inputs do not adjust instantaneously to their optimal levels given changes in output and in input prices, and/or the CRTS assumption does not hold?<br>
08
Recent Empirical Facts and Trends
in US Health Care Markets Composition of US National Health Expenditures: Hospitals ≈ 30%, Outpatient clinics, offices ≈ 30%, Prescription pharmaceuticals ≈ 15-20% (part billed as hospital or outpatient charges), All other ≈ 22-27%
Recent Salient Trends:
Extensive consolidation among hospitals & physician practices – attempts to rationalize sites of care, exploit economies of scale and scope. Literature suggests M&A activity leads to higher prices and margins; scale economies?
Differential output prices charged by hospitals, outpatient clinics and offices, and biopharmaceuticals to both private and public payers – evidence of market power and heterogeneous consumers’ valuations?
Increased antitrust scrutiny of M&A activity and pricing behavior<br>
Recent Salient Trends:
Extensive consolidation among hospitals & physician practices – attempts to rationalize sites of care, exploit economies of scale and scope. Literature suggests M&A activity leads to higher prices and margins; scale economies?
Differential output prices charged by hospitals, outpatient clinics and offices, and biopharmaceuticals to both private and public payers – evidence of market power and heterogeneous consumers’ valuations?
Increased antitrust scrutiny of M&A activity and pricing behavior<br>
09
Towards a Reprioritized Future Research Agenda: I Rather than focusing research on measuring quality adjustment of outputs and inputs in US health care markets, would it be more useful and productive to focus on industrial organization issues such as:
How rapidly and to what extent do hospitals, outpatient clinics and offices, and biopharmaceutical manufacturers adjust to changes in output, in input prices, and to regulatory and reimbursement policy changes?
To what extent are the various health care sectors exercising market power in differential pricing consistent with varying gross margins? How is this affected by recent M&A activity?<br>
How rapidly and to what extent do hospitals, outpatient clinics and offices, and biopharmaceutical manufacturers adjust to changes in output, in input prices, and to regulatory and reimbursement policy changes?
To what extent are the various health care sectors exercising market power in differential pricing consistent with varying gross margins? How is this affected by recent M&A activity?<br>
10
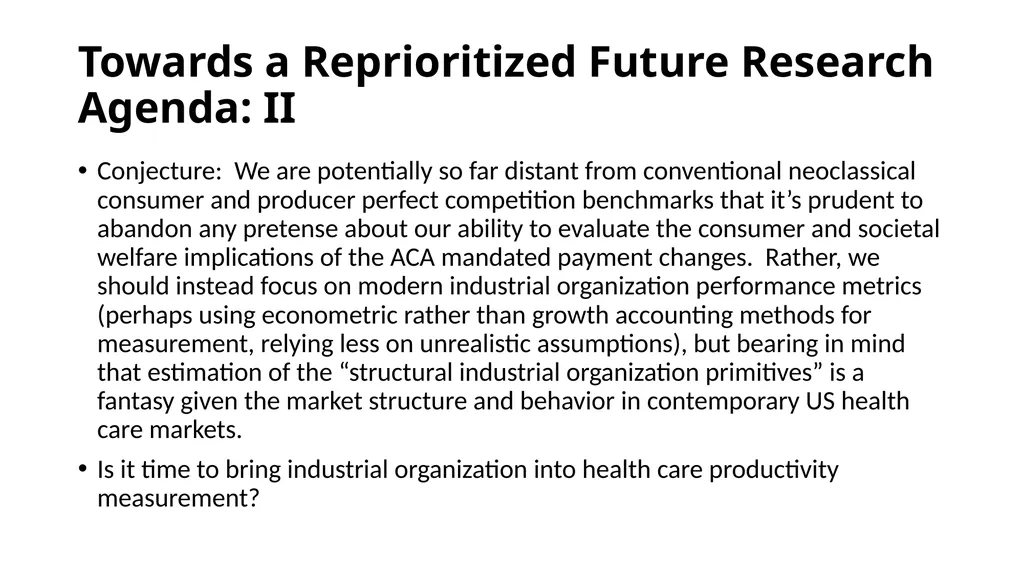
Towards a Reprioritized Future Research Agenda: II Conjecture: We are potentially so far distant from conventional neoclassical consumer and producer perfect competition benchmarks that it’s prudent to abandon any pretense about our ability to evaluate the consumer and societal welfare implications of the ACA mandated payment changes. Rather, we should instead focus on modern industrial organization performance metrics (perhaps using econometric rather than growth accounting methods for measurement, relying less on unrealistic assumptions), but bearing in mind that estimation of the “structural industrial organization primitives” is a fantasy given the market structure and behavior in contemporary US health care markets.
Is it time to bring industrial organization into health care productivity measurement?<br>
Is it time to bring industrial organization into health care productivity measurement?<br>
11
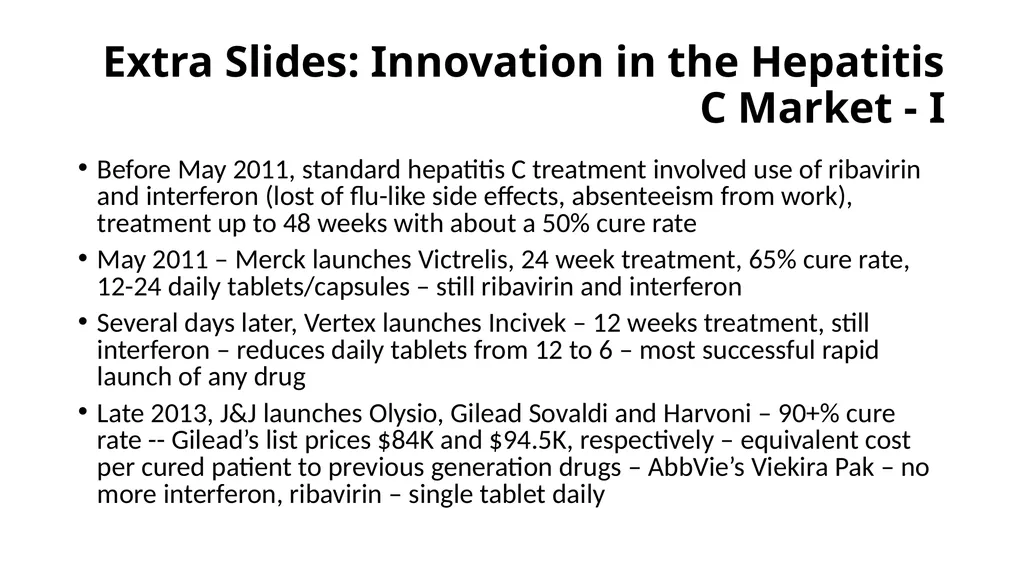
Extra Slides: Innovation in the Hepatitis C Market - I Before May 2011, standard hepatitis C treatment involved use of ribavirin and interferon (lost of flu-like side effects, absenteeism from work), treatment up to 48 weeks with about a 50% cure rate
May 2011 – Merck launches Victrelis, 24 week treatment, 65% cure rate, 12-24 daily tablets/capsules – still ribavirin and interferon
Several days later, Vertex launches Incivek – 12 weeks treatment, still interferon – reduces daily tablets from 12 to 6 – most successful rapid launch of any drug
Late 2013, J&J launches Olysio, Gilead Sovaldi and Harvoni – 90+% cure rate -- Gilead’s list prices $84K and $94.5K, respectively – equivalent cost per cured patient to previous generation drugs – AbbVie’s Viekira Pak – no more interferon, ribavirin – single tablet daily<br>
May 2011 – Merck launches Victrelis, 24 week treatment, 65% cure rate, 12-24 daily tablets/capsules – still ribavirin and interferon
Several days later, Vertex launches Incivek – 12 weeks treatment, still interferon – reduces daily tablets from 12 to 6 – most successful rapid launch of any drug
Late 2013, J&J launches Olysio, Gilead Sovaldi and Harvoni – 90+% cure rate -- Gilead’s list prices $84K and $94.5K, respectively – equivalent cost per cured patient to previous generation drugs – AbbVie’s Viekira Pak – no more interferon, ribavirin – single tablet daily<br>
12
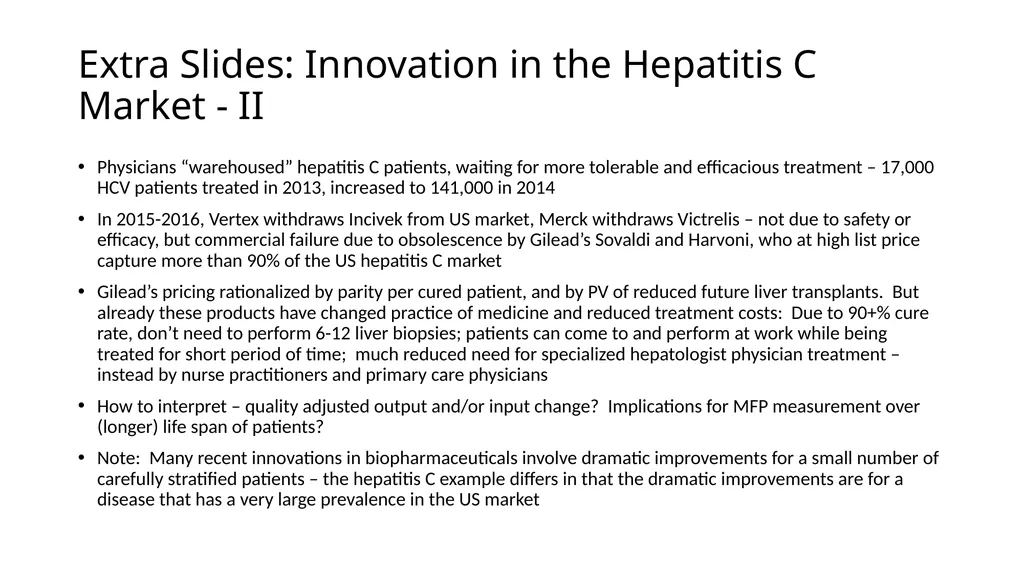
Extra Slides: Innovation in the Hepatitis C Market - II Physicians “warehoused” hepatitis C patients, waiting for more tolerable and efficacious treatment – 17,000 HCV patients treated in 2013, increased to 141,000 in 2014
In 2015-2016, Vertex withdraws Incivek from US market, Merck withdraws Victrelis – not due to safety or efficacy, but commercial failure due to obsolescence by Gilead’s Sovaldi and Harvoni, who at high list price capture more than 90% of the US hepatitis C market
Gilead’s pricing rationalized by parity per cured patient, and by PV of reduced future liver transplants. But already these products have changed practice of medicine and reduced treatment costs: Due to 90+% cure rate, don’t need to perform 6-12 liver biopsies; patients can come to and perform at work while being treated for short period of time; much reduced need for specialized hepatologist physician treatment – instead by nurse practitioners and primary care physicians
How to interpret – quality adjusted output and/or input change? Implications for MFP measurement over (longer) life span of patients?
Note: Many recent innovations in biopharmaceuticals involve dramatic improvements for a small number of carefully stratified patients – the hepatitis C example differs in that the dramatic improvements are for a disease that has a very large prevalence in the US market<br>
In 2015-2016, Vertex withdraws Incivek from US market, Merck withdraws Victrelis – not due to safety or efficacy, but commercial failure due to obsolescence by Gilead’s Sovaldi and Harvoni, who at high list price capture more than 90% of the US hepatitis C market
Gilead’s pricing rationalized by parity per cured patient, and by PV of reduced future liver transplants. But already these products have changed practice of medicine and reduced treatment costs: Due to 90+% cure rate, don’t need to perform 6-12 liver biopsies; patients can come to and perform at work while being treated for short period of time; much reduced need for specialized hepatologist physician treatment – instead by nurse practitioners and primary care physicians
How to interpret – quality adjusted output and/or input change? Implications for MFP measurement over (longer) life span of patients?
Note: Many recent innovations in biopharmaceuticals involve dramatic improvements for a small number of carefully stratified patients – the hepatitis C example differs in that the dramatic improvements are for a disease that has a very large prevalence in the US market<br>