
Components of epidemiology First component: data
Description: Components of epidemiology First component: data collection Qualitative Quantitative Natural history of disease Causal hypothesis testing Surveys Monitoring Surveillance Studies Experimental Observational Cross-sectional Cohort Case-control
Related Topics
Download Presentation
"Components of epidemiology First component: data" is the property of its rightful owner. Permission is granted to download and print the materials on this website for personal, non-commercial use only, and to display it on your personal computer provided you do not modify the materials and that you retain all copyright notices contained in the materials. By downloading content from our website, you accept the terms of this agreement.
Presentation Transcript
slide1. Components of epidemiology<br>
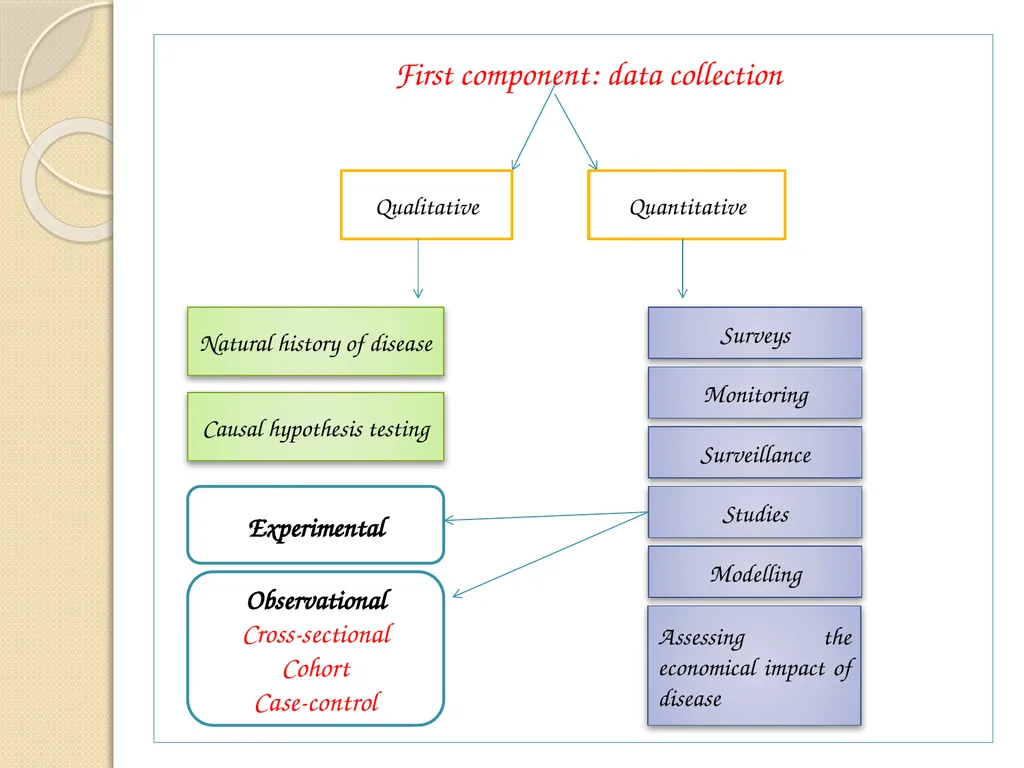
slide2. First component: data collection Qualitative Quantitative Natural history of disease Causal hypothesis testing Surveys Monitoring Surveillance Studies Experimental Observational
Cross-sectional
Cohort
Case-control Modelling Assessing the economical impact of disease<br>
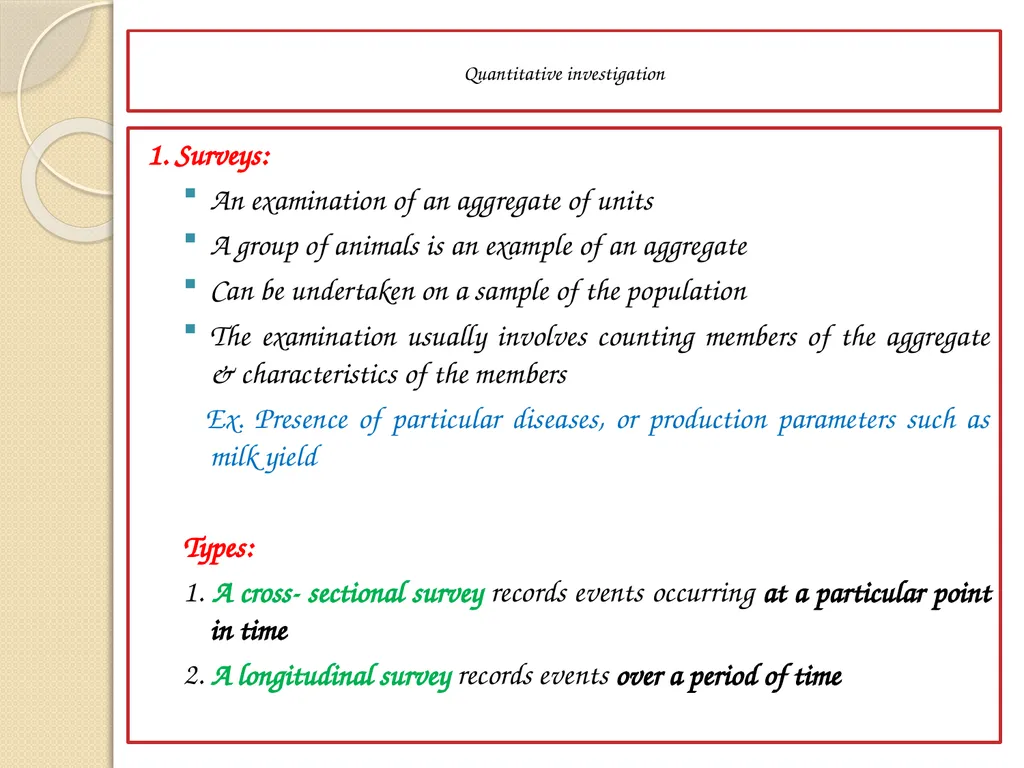
slide3. Quantitative investigation 1. Surveys:
An examination of an aggregate of units
A group of animals is an example of an aggregate
Can be undertaken on a sample of the population
The examination usually involves counting members of the aggregate & characteristics of the members
Ex. Presence of particular diseases, or production parameters such as milk yield
Types:
1. A cross- sectional survey records events occurring at a particular point in time
2. A longitudinal survey records events over a period of time<br>
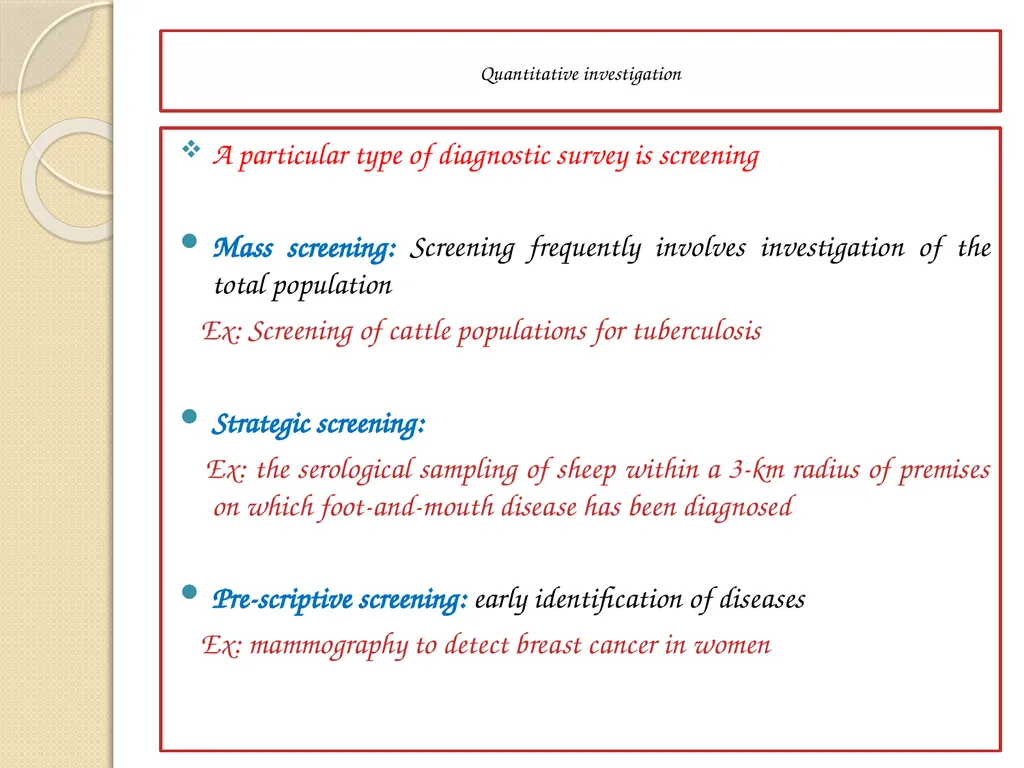
slide4. Quantitative investigation A particular type of diagnostic survey is screening
Mass screening: Screening frequently involves investigation of the total population
Ex: Screening of cattle populations for tuberculosis
Strategic screening:
Ex: the serological sampling of sheep within a 3-km radius of premises on which foot-and-mouth disease has been diagnosed
Pre-scriptive screening: early identification of diseases
Ex: mammography to detect breast cancer in women<br>
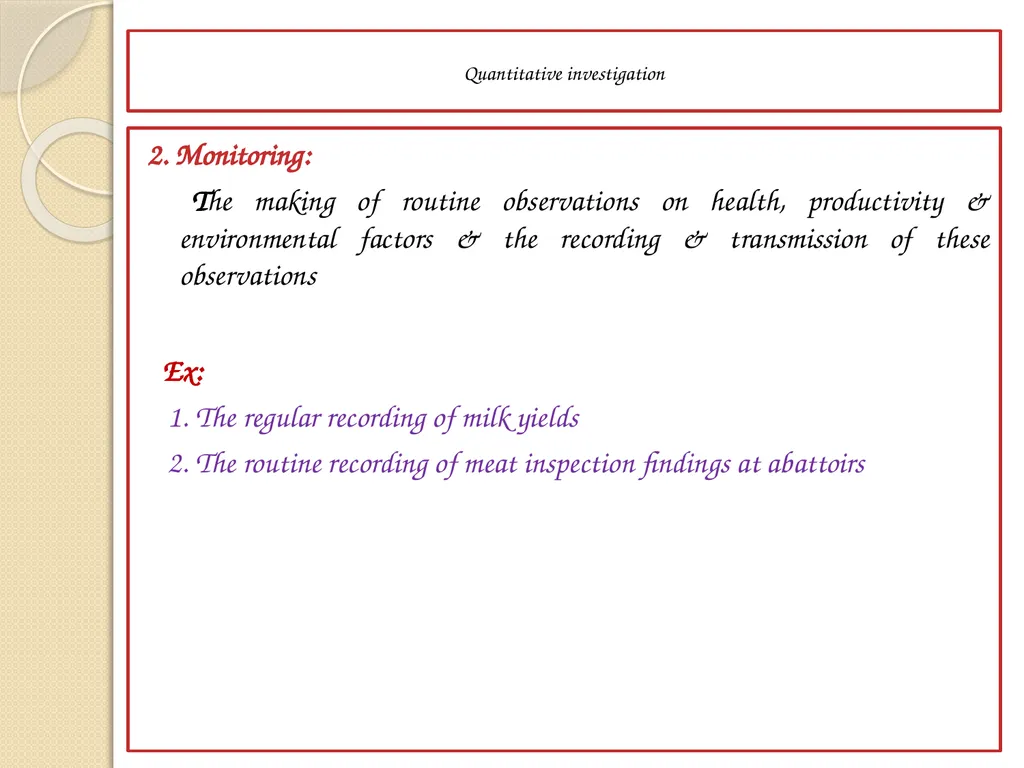
slide5. Quantitative investigation 2. Monitoring:
The making of routine observations on health, productivity & environmental factors & the recording & transmission of these observations
Ex:
1. The regular recording of milk yields
2. The routine recording of meat inspection findings at abattoirs<br>
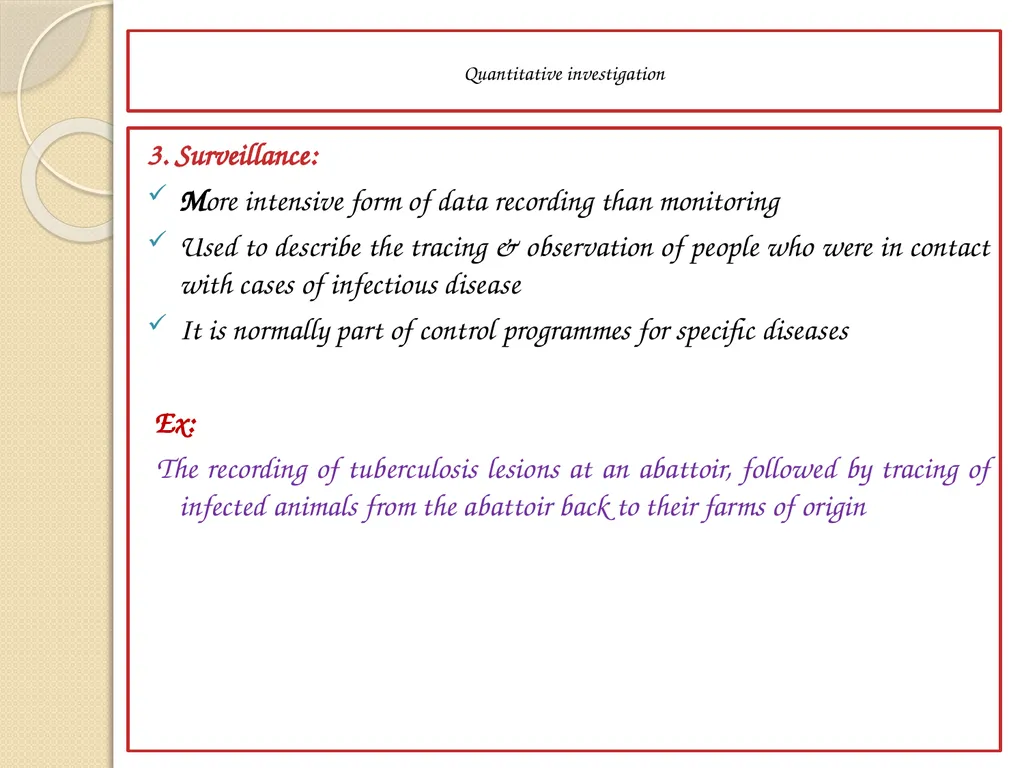
slide6. Quantitative investigation 3. Surveillance:
More intensive form of data recording than monitoring
Used to describe the tracing & observation of people who were in contact with cases of infectious disease
It is normally part of control programmes for specific diseases
Ex:
The recording of tuberculosis lesions at an abattoir, followed by tracing of infected animals from the abattoir back to their farms of origin<br>
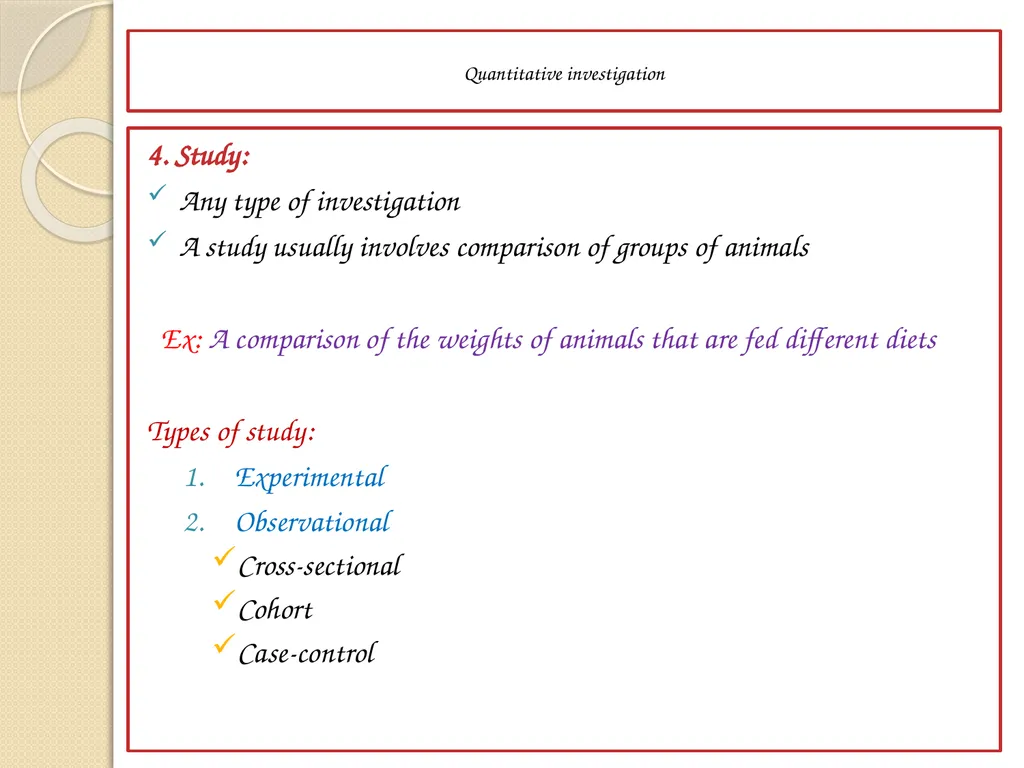
slide7. Quantitative investigation 4. Study:
Any type of investigation
A study usually involves comparison of groups of animals
Ex: A comparison of the weights of animals that are fed different diets
Types of study:
Experimental
Observational
Cross-sectional
Cohort
Case-control<br>
slide8. Quantitative investigation Experimental study:
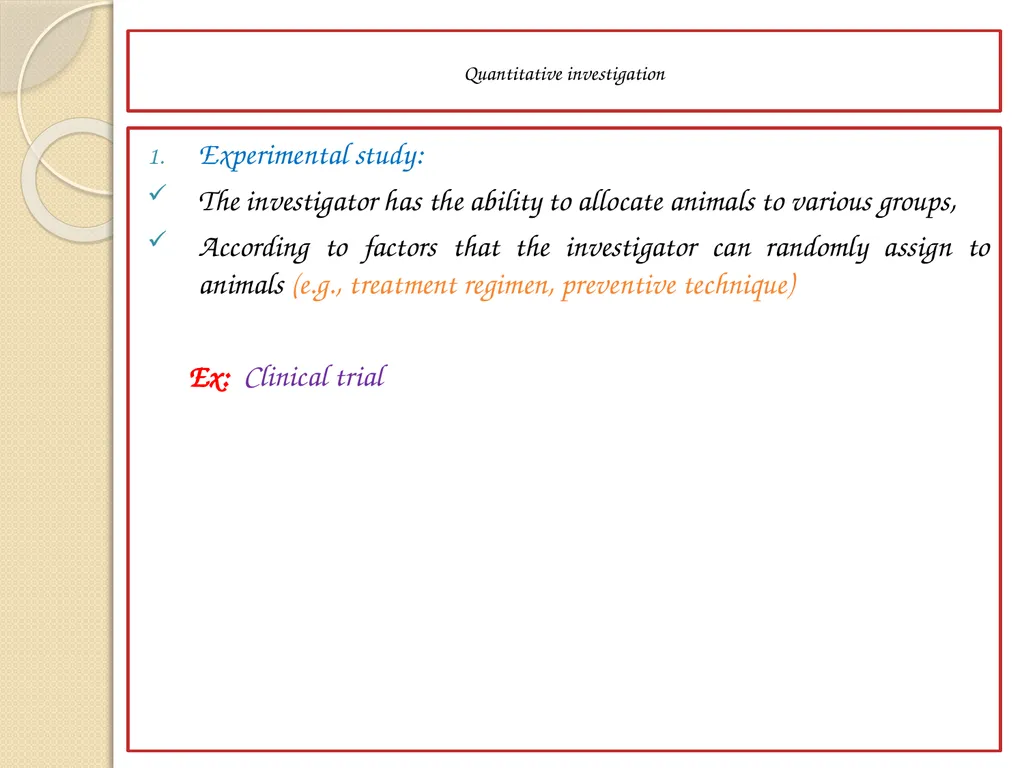
The investigator has the ability to allocate animals to various groups,
According to factors that the investigator can randomly assign to animals (e.g., treatment regimen, preventive technique)
Ex: Clinical trial<br>
slide9. Quantitative investigation 2. Observational study:
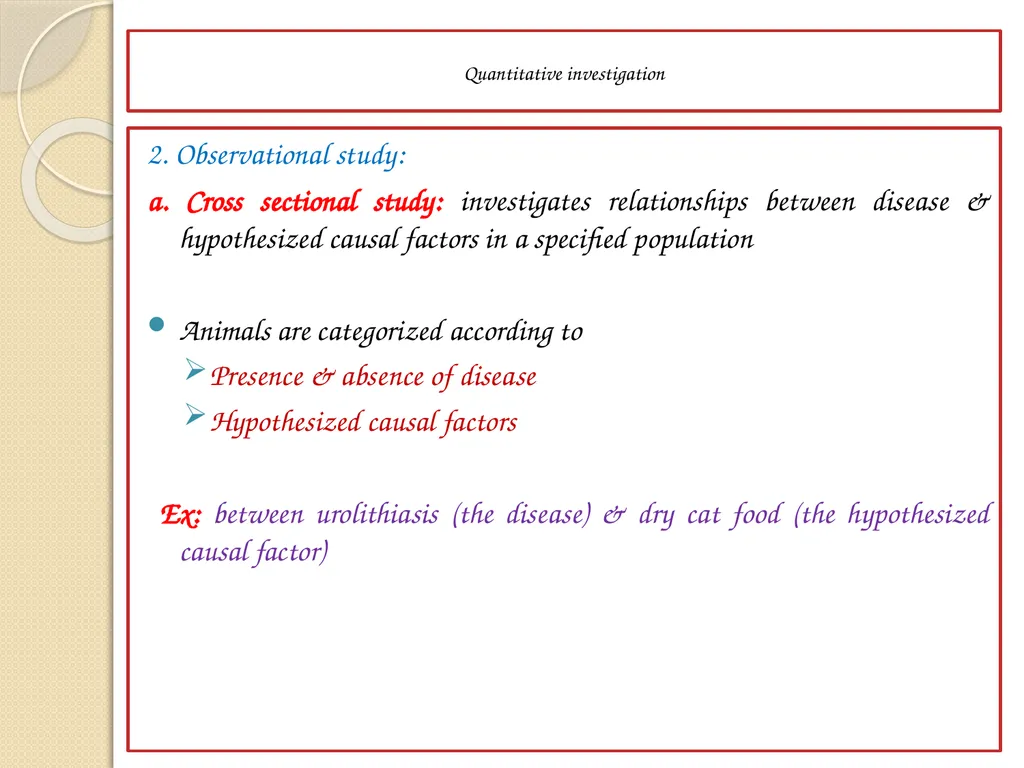
a. Cross sectional study: investigates relationships between disease & hypothesized causal factors in a specified population
Animals are categorized according to
Presence & absence of disease
Hypothesized causal factors
Ex: between urolithiasis (the disease) & dry cat food (the hypothesized causal factor)<br>
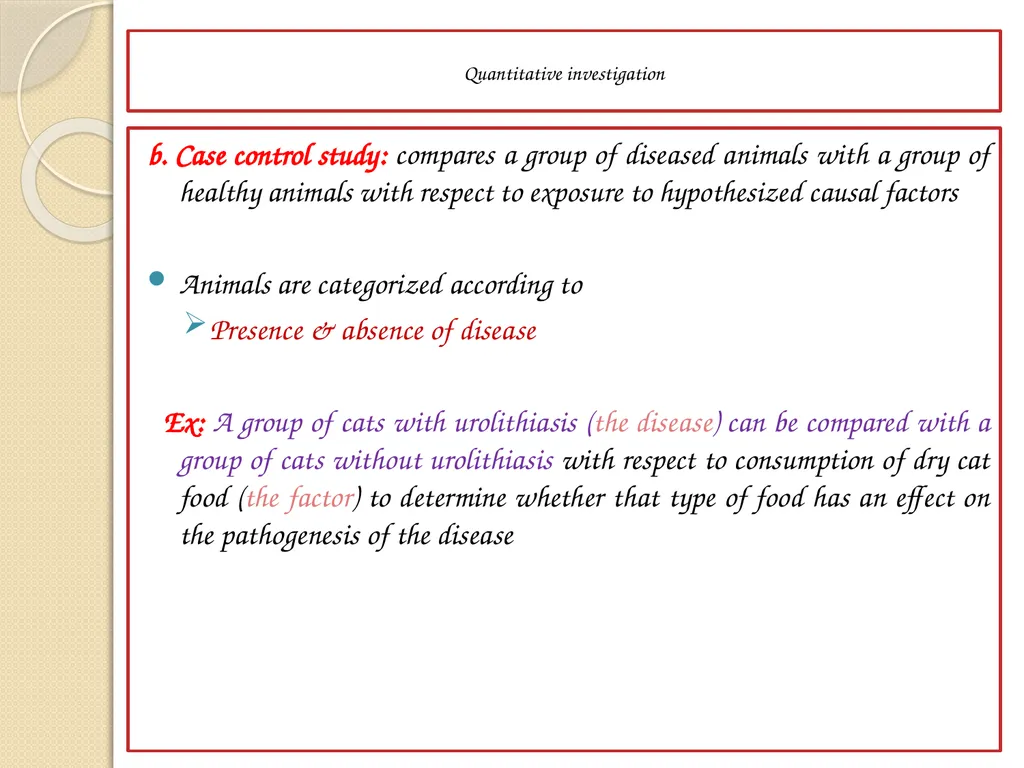
slide10. Quantitative investigation b. Case control study: compares a group of diseased animals with a group of healthy animals with respect to exposure to hypothesized causal factors
Animals are categorized according to
Presence & absence of disease
Ex: A group of cats with urolithiasis (the disease) can be compared with a group of cats without urolithiasis with respect to consumption of dry cat food (the factor) to determine whether that type of food has an effect on the pathogenesis of the disease<br>
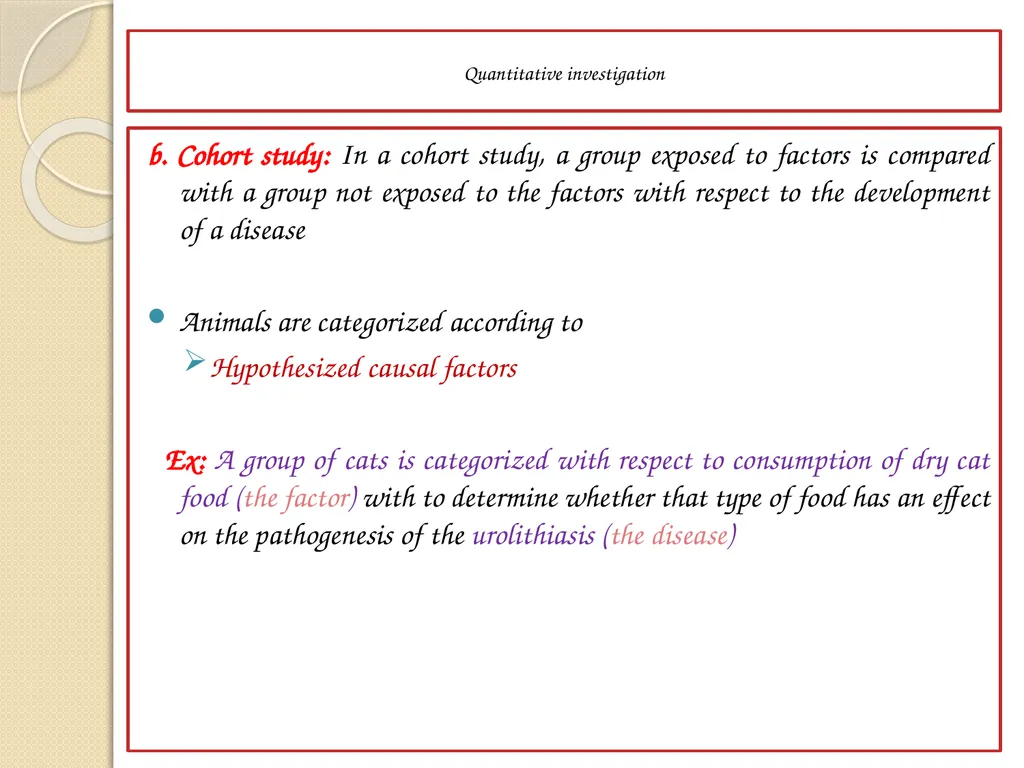
slide11. Quantitative investigation b. Cohort study: In a cohort study, a group exposed to factors is compared with a group not exposed to the factors with respect to the development of a disease
Animals are categorized according to
Hypothesized causal factors
Ex: A group of cats is categorized with respect to consumption of dry cat food (the factor) with to determine whether that type of food has an effect on the pathogenesis of the urolithiasis (the disease)<br>
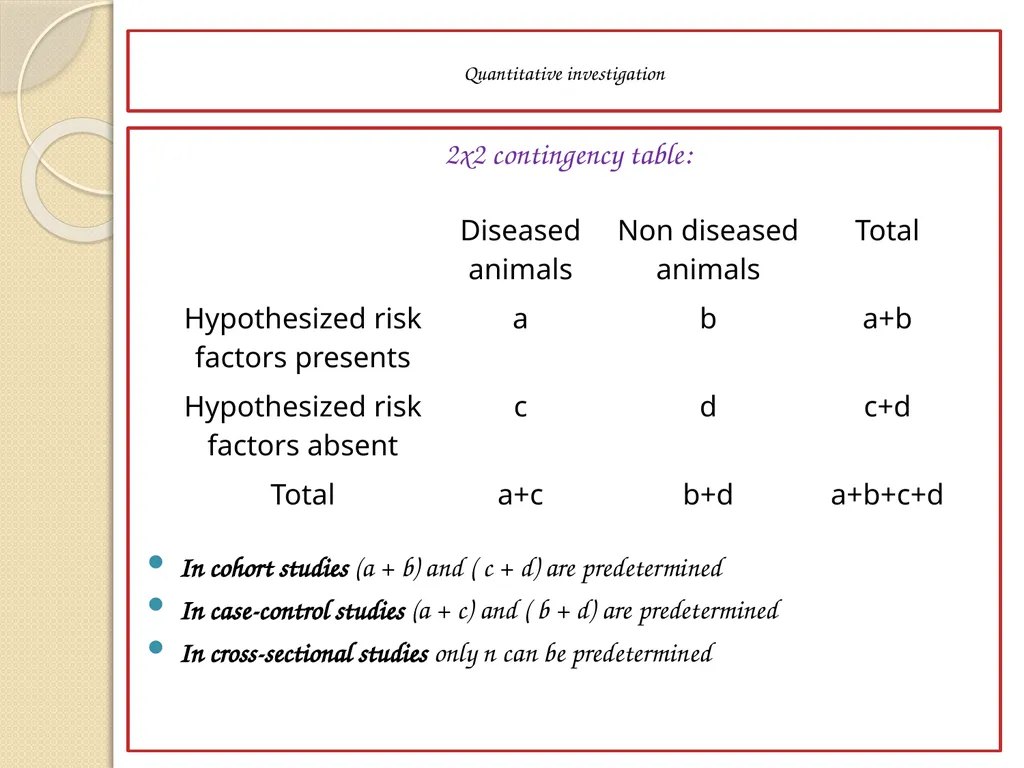
slide12. Quantitative investigation 2x2 contingency table:
In cohort studies (a + b) and ( c + d) are predetermined
In case-control studies (a + c) and ( b + d) are predetermined
In cross-sectional studies only n can be predetermined<br>
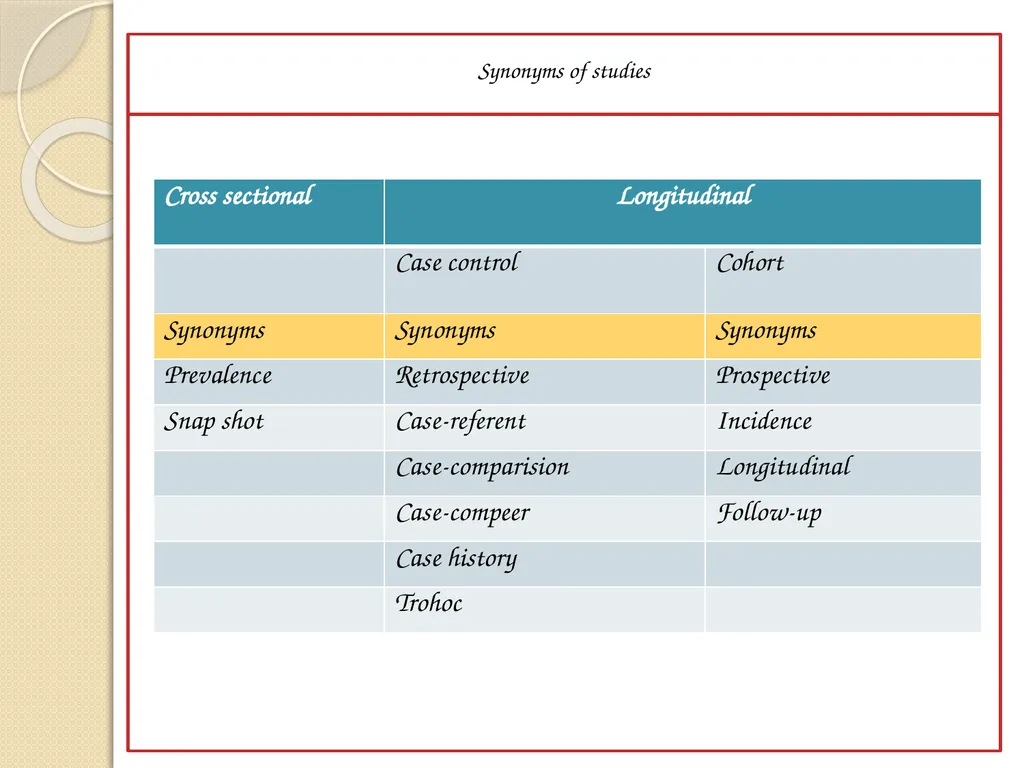
slide13. Synonyms of studies<br>
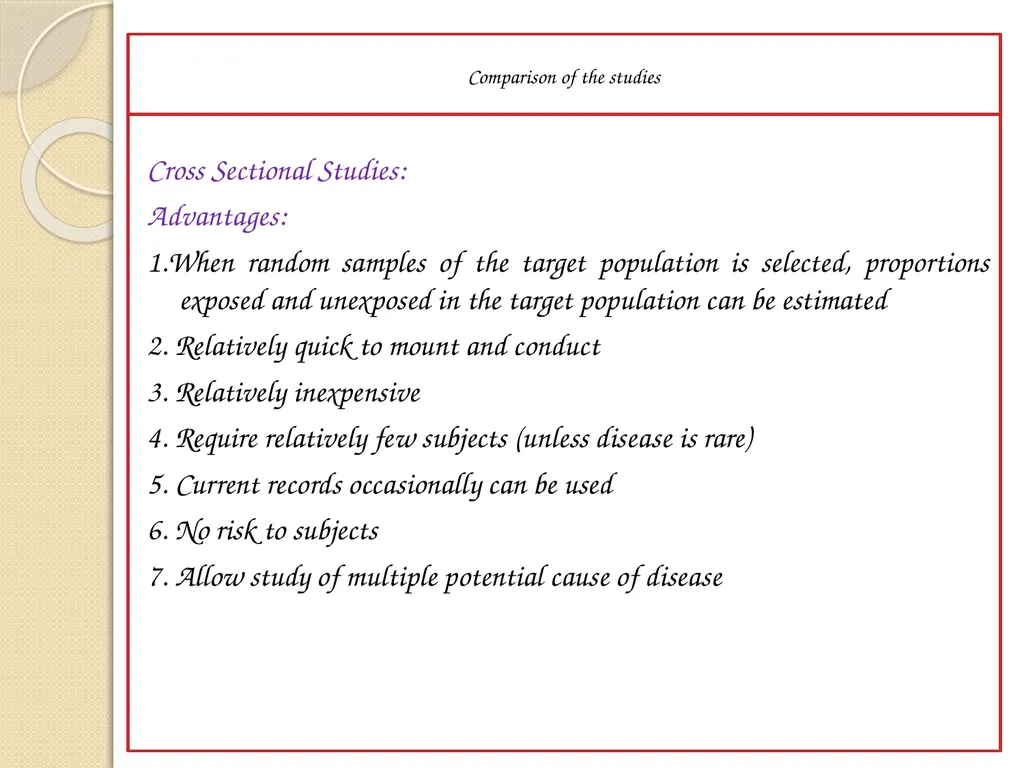
slide14. Cross Sectional Studies:
Advantages:
1.When random samples of the target population is selected, proportions exposed and unexposed in the target population can be estimated
2. Relatively quick to mount and conduct
3. Relatively inexpensive
4. Require relatively few subjects (unless disease is rare)
5. Current records occasionally can be used
6. No risk to subjects
7. Allow study of multiple potential cause of disease Comparison of the studies<br>
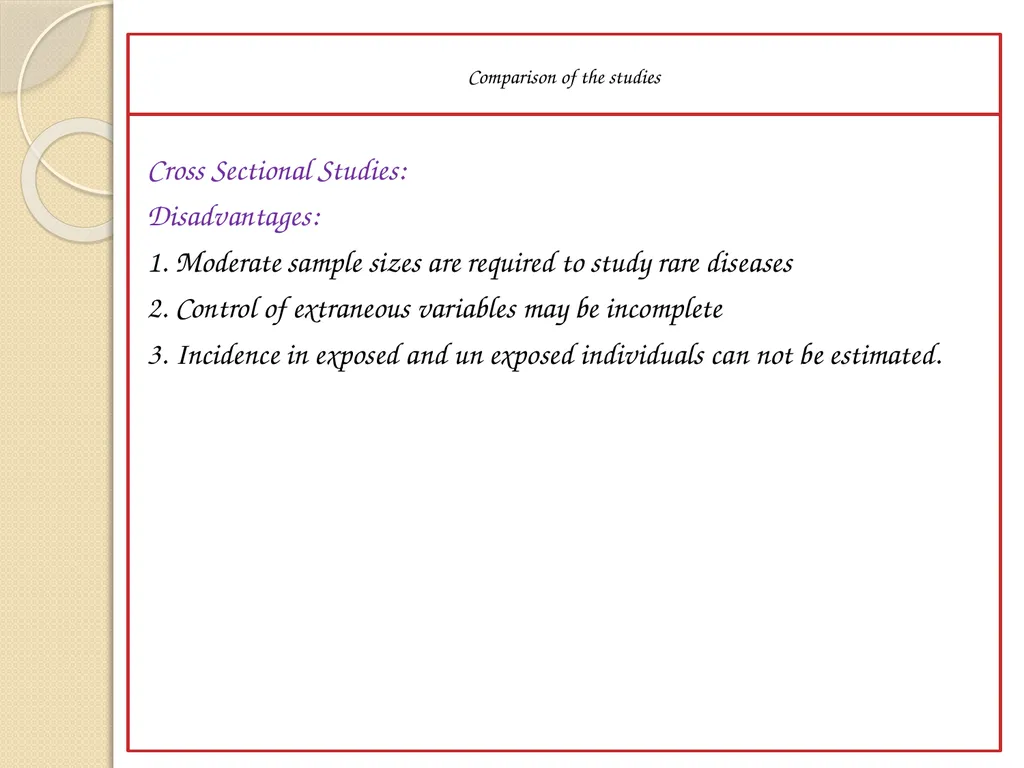
slide15. Cross Sectional Studies:
Disadvantages:
1. Moderate sample sizes are required to study rare diseases
2. Control of extraneous variables may be incomplete
3. Incidence in exposed and un exposed individuals can not be estimated. Comparison of the studies<br>
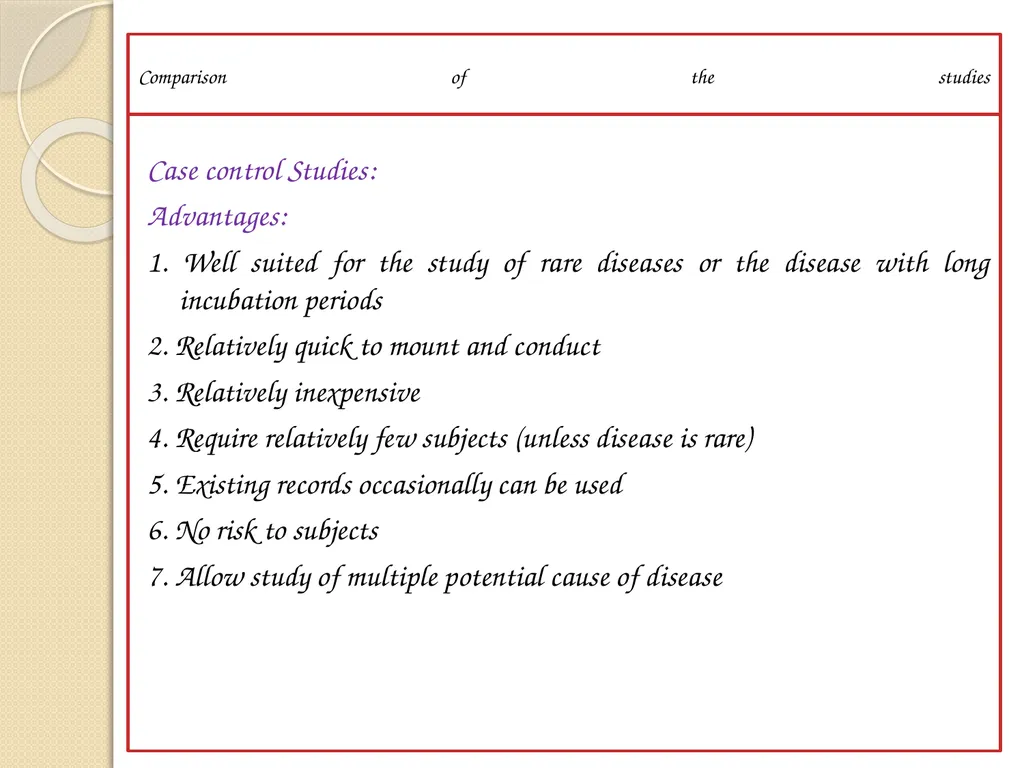
slide16. Case control Studies:
Advantages:
1. Well suited for the study of rare diseases or the disease with long incubation periods
2. Relatively quick to mount and conduct
3. Relatively inexpensive
4. Require relatively few subjects (unless disease is rare)
5. Existing records occasionally can be used
6. No risk to subjects
7. Allow study of multiple potential cause of disease Comparison of the studies<br>
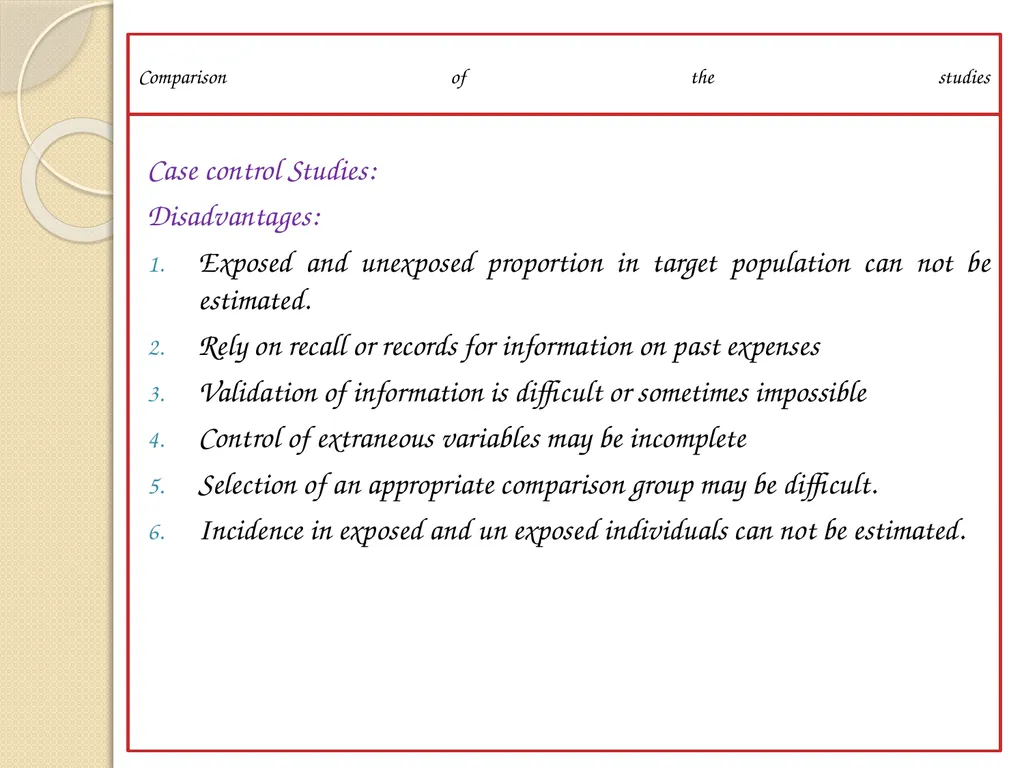
slide17. Case control Studies:
Disadvantages:
Exposed and unexposed proportion in target population can not be estimated.
Rely on recall or records for information on past expenses
Validation of information is difficult or sometimes impossible
Control of extraneous variables may be incomplete
Selection of an appropriate comparison group may be difficult.
Incidence in exposed and un exposed individuals can not be estimated. Comparison of the studies<br>
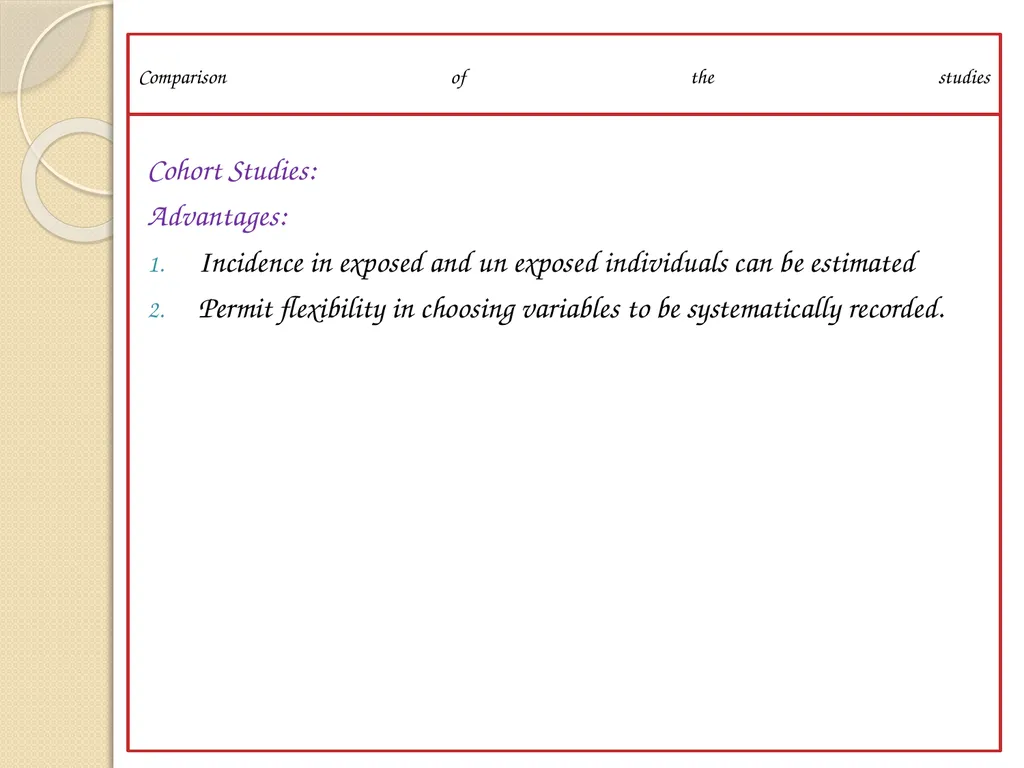
slide18. Cohort Studies:
Advantages:
Incidence in exposed and un exposed individuals can be estimated
Permit flexibility in choosing variables to be systematically recorded. Comparison of the studies<br>
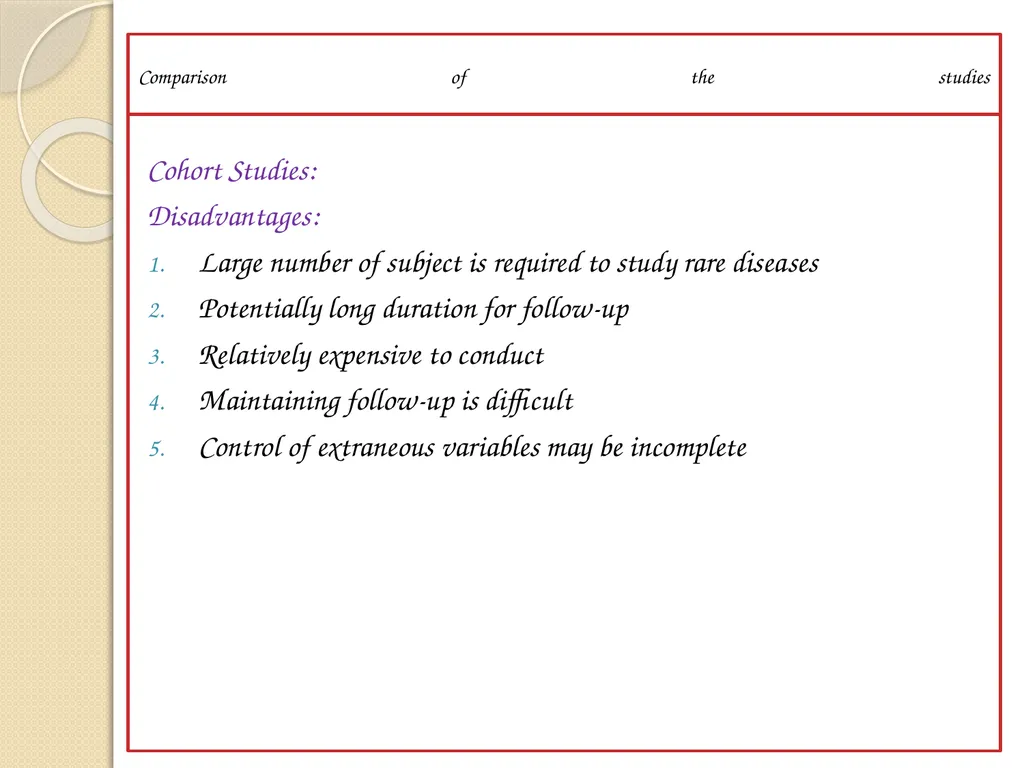
slide19. Cohort Studies:
Disadvantages:
Large number of subject is required to study rare diseases
Potentially long duration for follow-up
Relatively expensive to conduct
Maintaining follow-up is difficult
Control of extraneous variables may be incomplete Comparison of the studies<br>
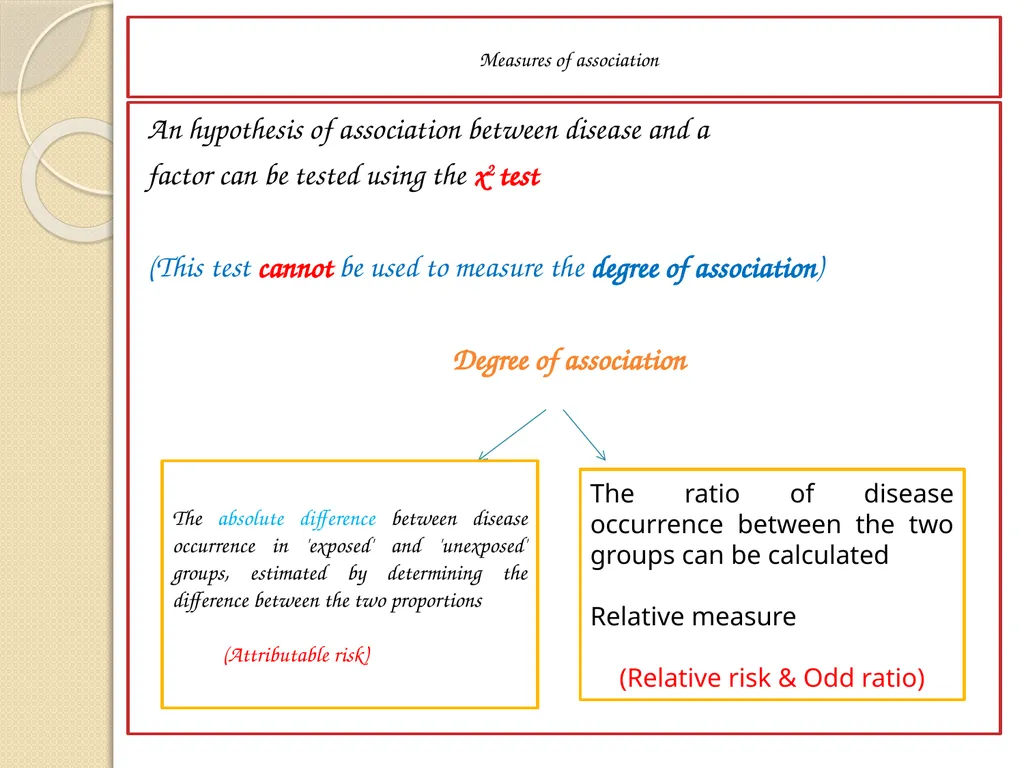
slide20. An hypothesis of association between disease and a
factor can be tested using the x2 test
(This test cannot be used to measure the degree of association)
Degree of association Measures of association The absolute difference between disease occurrence in 'exposed' and 'unexposed' groups, estimated by determining the difference between the two proportions
(Attributable risk) The ratio of disease occurrence between the two groups can be calculated
Relative measure
(Relative risk & Odd ratio)<br>
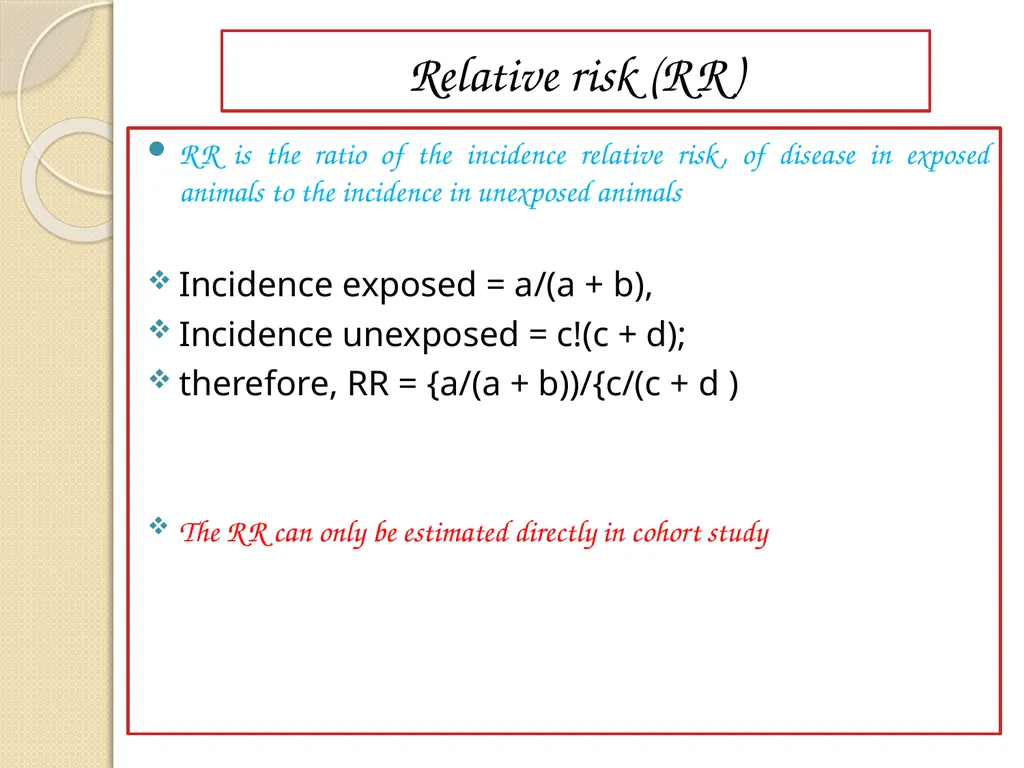
slide21. Relative risk (RR) RR is the ratio of the incidence relative risk, of disease in exposed animals to the incidence in unexposed animals
Incidence exposed = a/(a + b),
Incidence unexposed = c!(c + d);
therefore, RR = {a/(a + b))/{c/(c + d )
The RR can only be estimated directly in cohort study<br>
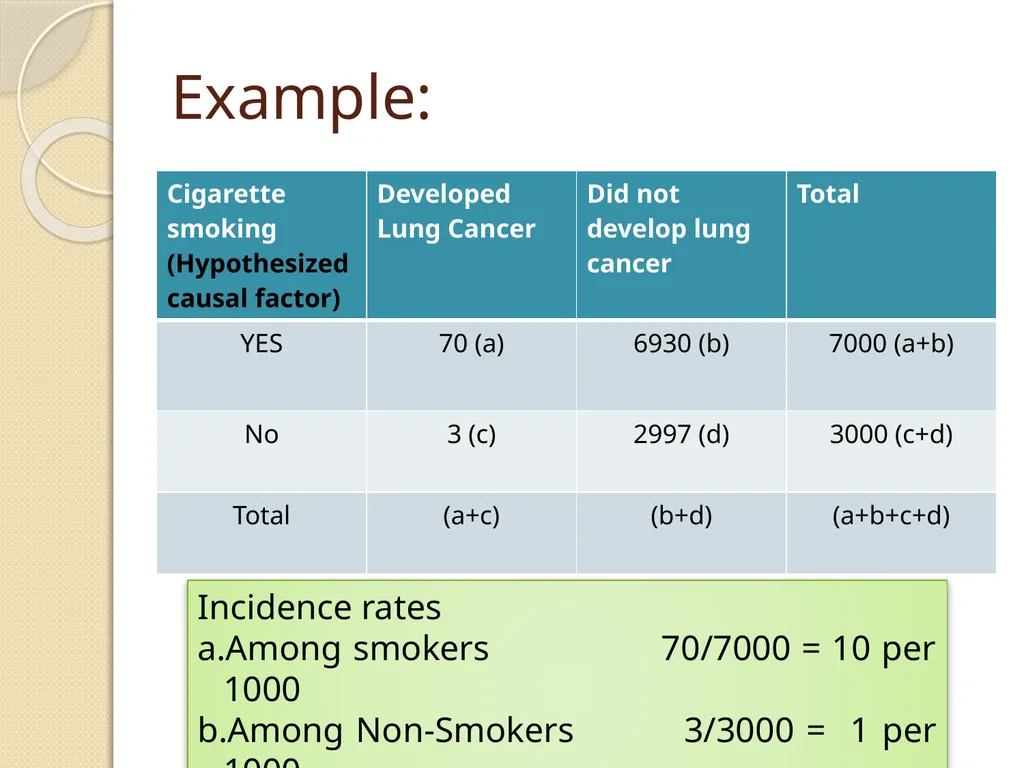
slide22. Example: Incidence rates
Among smokers 70/7000 = 10 per 1000
Among Non-Smokers 3/3000 = 1 per 1000<br>
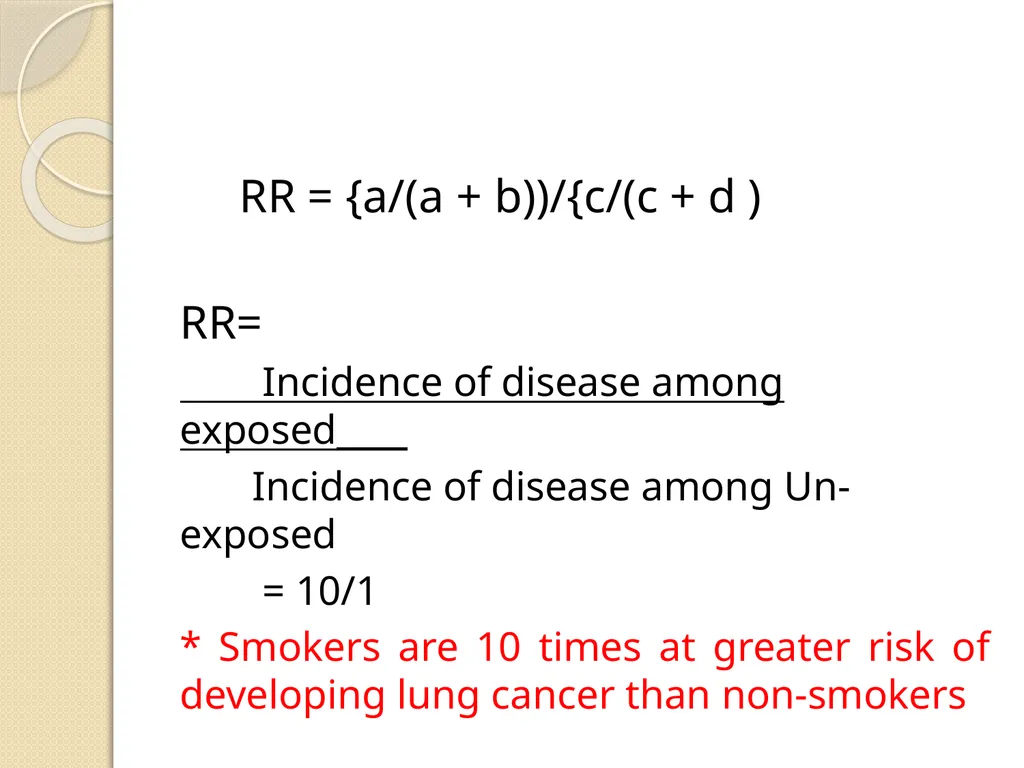
slide23. RR = {a/(a + b))/{c/(c + d )
RR=
Incidence of disease among exposed____
Incidence of disease among Un-exposed
= 10/1
* Smokers are 10 times at greater risk of developing lung cancer than non-smokers<br>
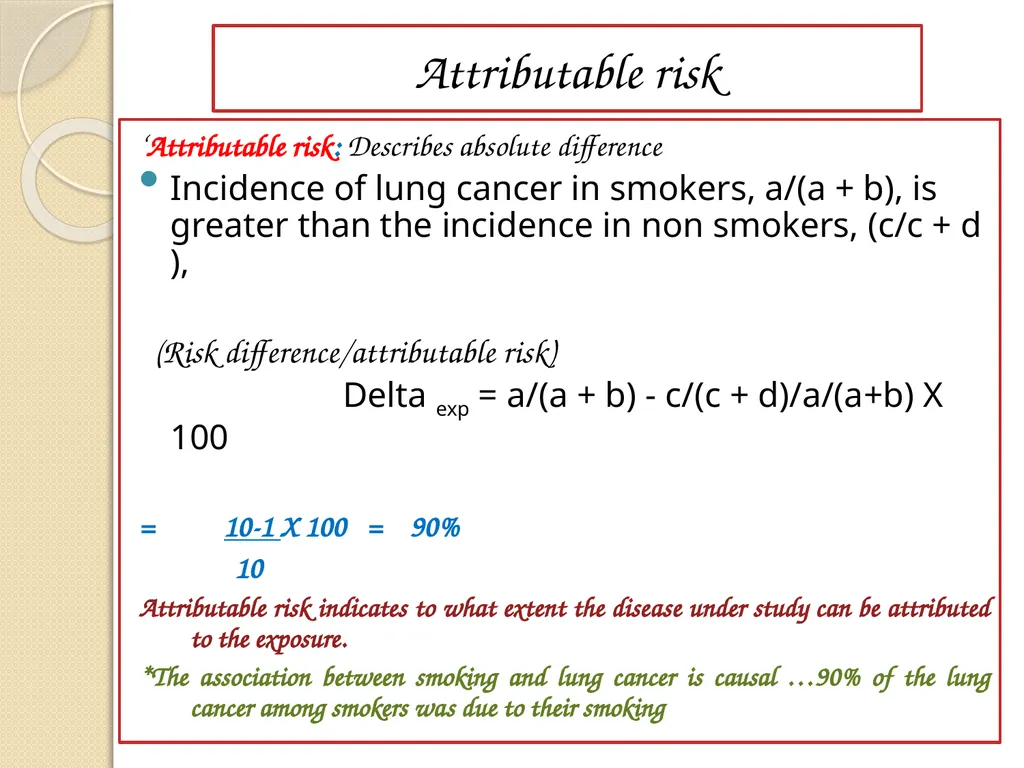
slide24. Attributable risk ‘Attributable risk: Describes absolute difference
Incidence of lung cancer in smokers, a/(a + b), is greater than the incidence in non smokers, (c/c + d ),
(Risk difference/attributable risk)
Delta exp = a/(a + b) - c/(c + d)/a/(a+b) X 100
= 10-1 X 100 = 90%
10
Attributable risk indicates to what extent the disease under study can be attributed to the exposure.
*The association between smoking and lung cancer is causal …90% of the lung cancer among smokers was due to their smoking<br>
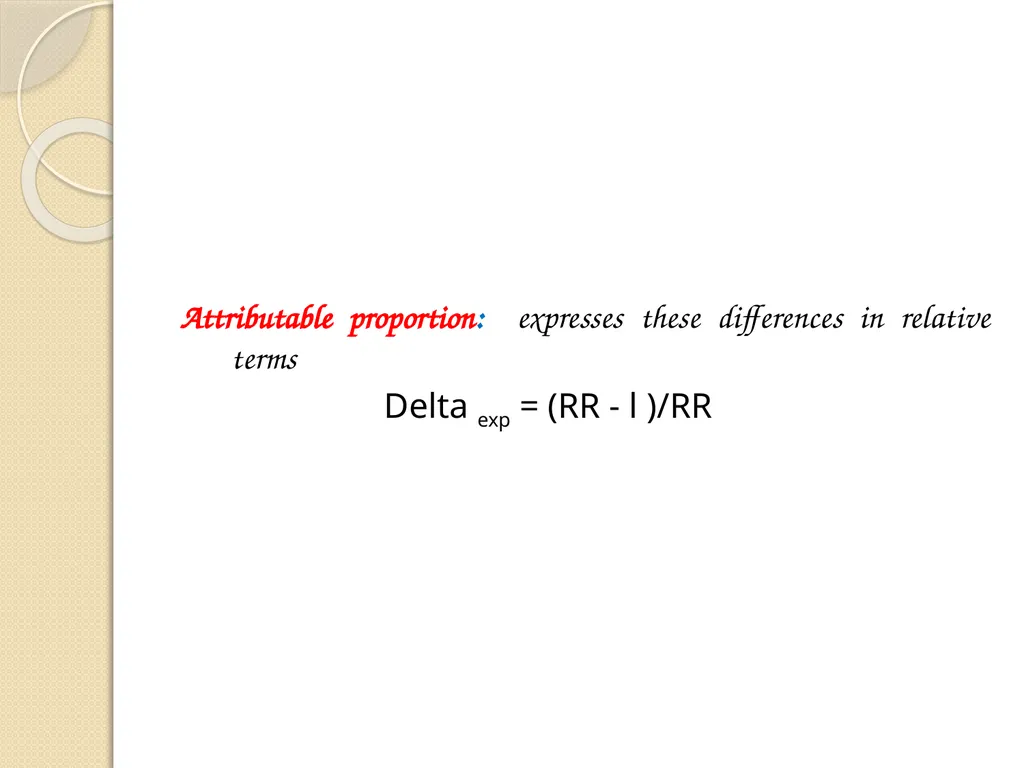
slide25. Attributable proportion: expresses these differences in relative terms
Delta exp = (RR - l )/RR<br>
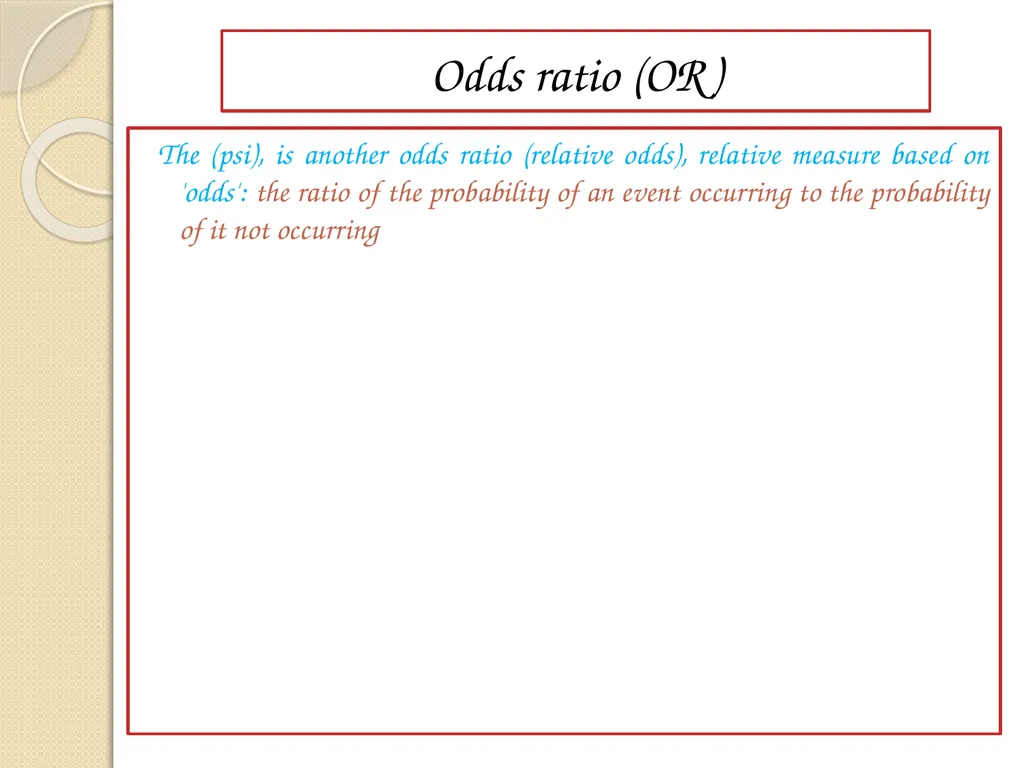
slide26. Odds ratio (OR) The (psi), is another odds ratio (relative odds), relative measure based on 'odds': the ratio of the probability of an event occurring to the probability of it not occurring<br>
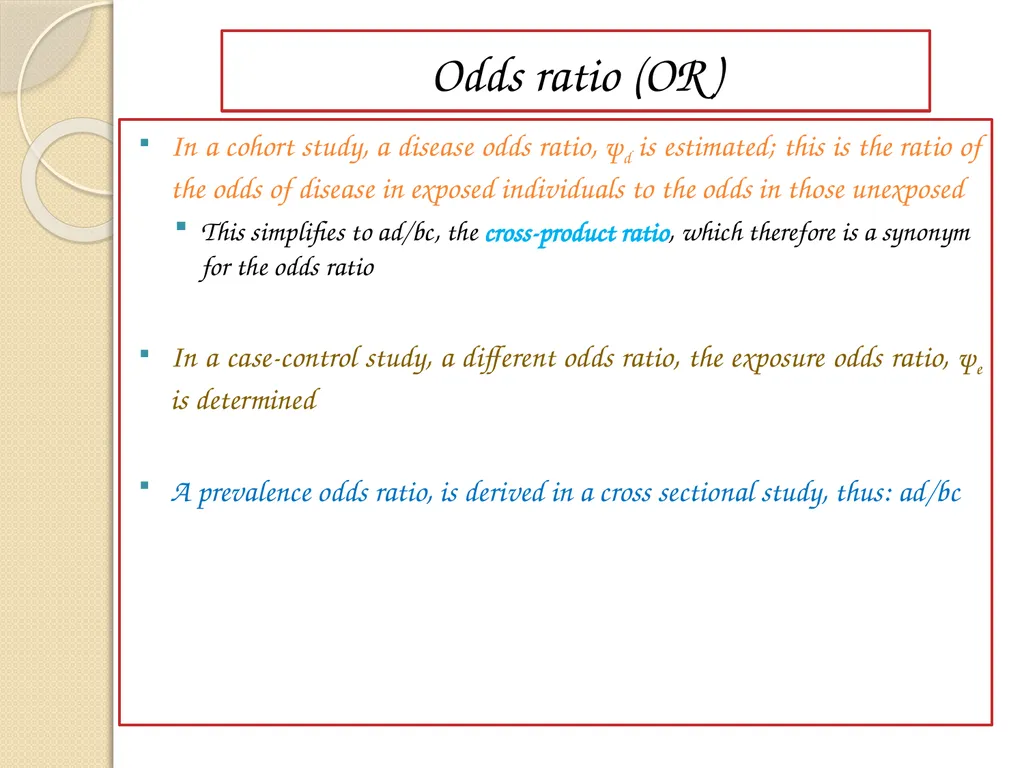
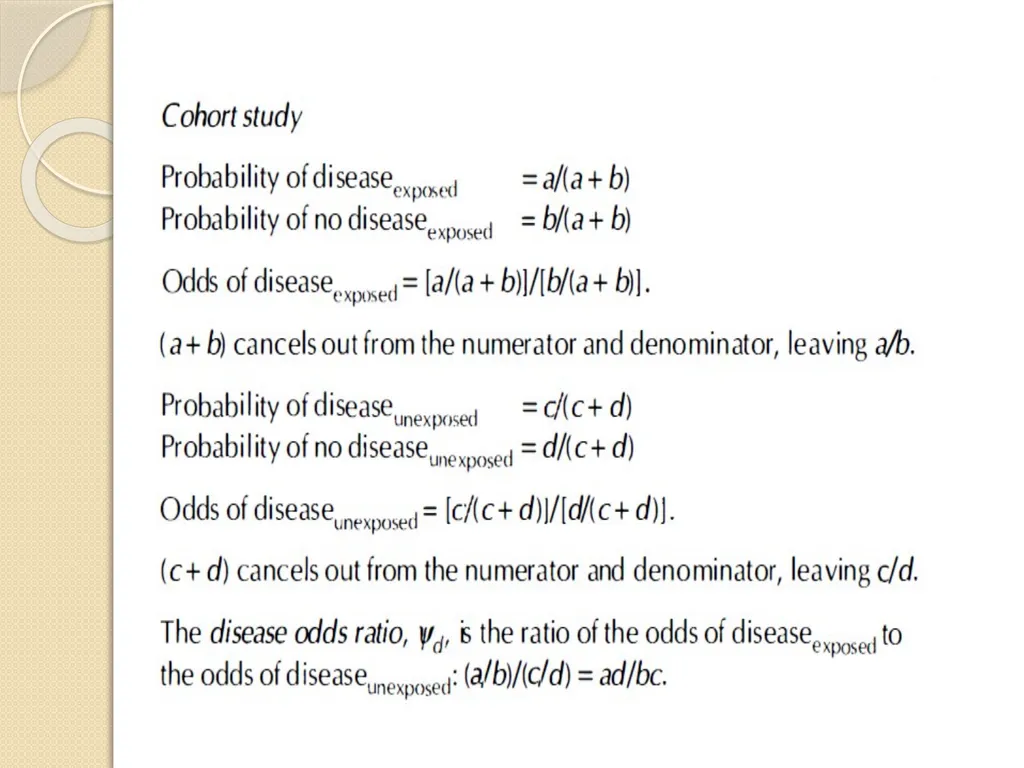
slide27. Odds ratio (OR) In a cohort study, a disease odds ratio, ψd is estimated; this is the ratio of the odds of disease in exposed individuals to the odds in those unexposed
This simplifies to ad/bc, the cross-product ratio, which therefore is a synonym for the odds ratio
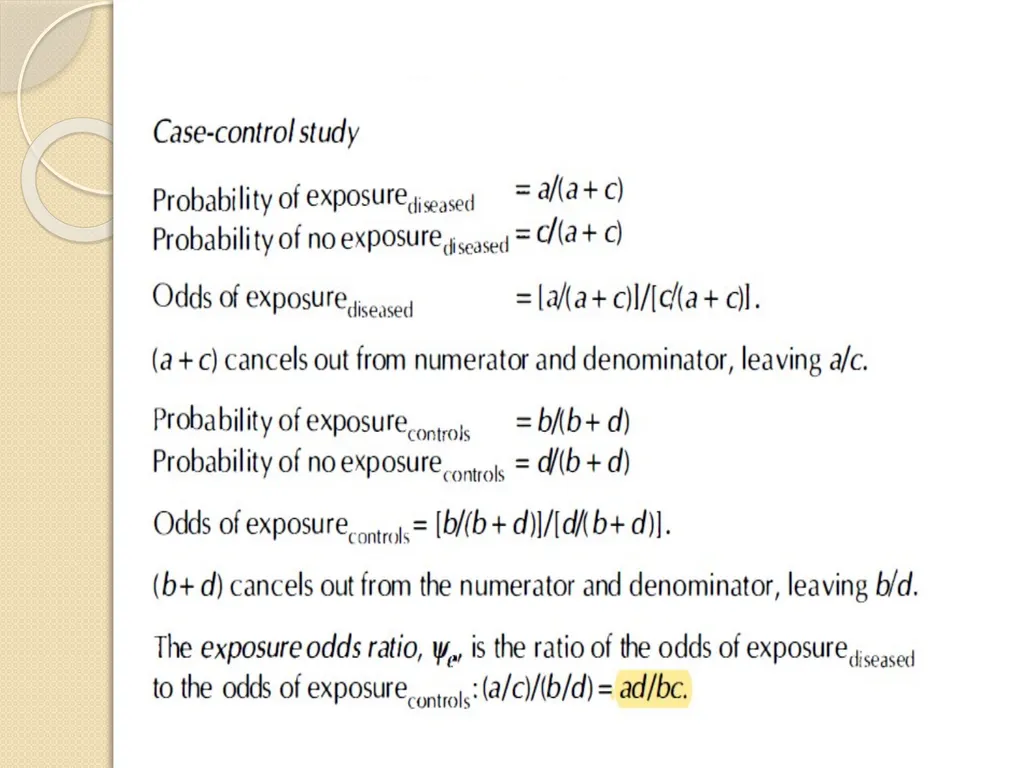
In a case-control study, a different odds ratio, the exposure odds ratio, ψe is determined
A prevalence odds ratio, is derived in a cross sectional study, thus: ad/bc<br>
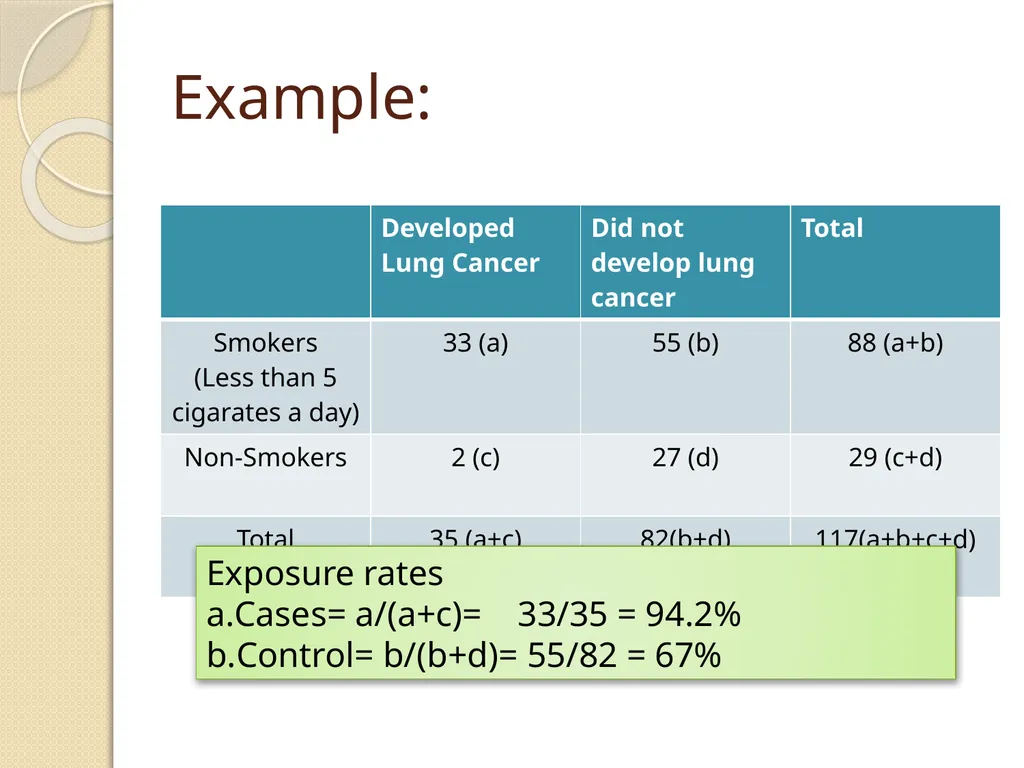
slide30. Example: Exposure rates
Cases= a/(a+c)= 33/35 = 94.2%
Control= b/(b+d)= 55/82 = 67%<br>
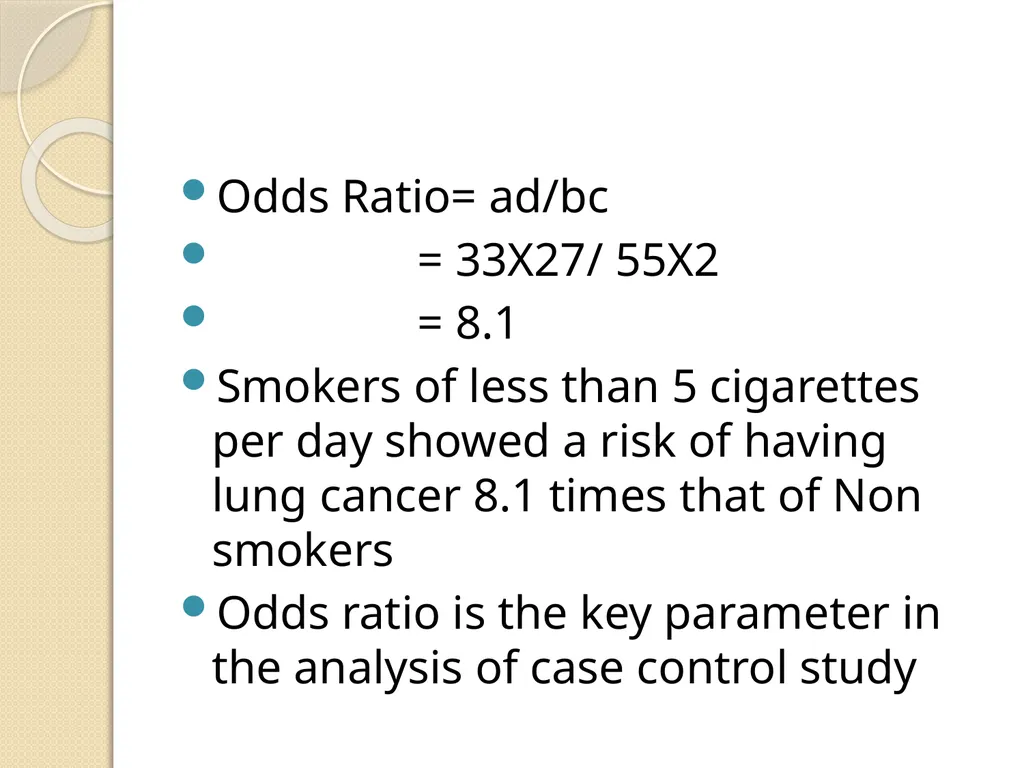
slide31. Odds Ratio= ad/bc
= 33X27/ 55X2
= 8.1
Smokers of less than 5 cigarettes per day showed a risk of having lung cancer 8.1 times that of Non smokers
Odds ratio is the key parameter in the analysis of case control study<br>
slide2. First component: data collection Qualitative Quantitative Natural history of disease Causal hypothesis testing Surveys Monitoring Surveillance Studies Experimental Observational
Cross-sectional
Cohort
Case-control Modelling Assessing the economical impact of disease<br>
slide3. Quantitative investigation 1. Surveys:
An examination of an aggregate of units
A group of animals is an example of an aggregate
Can be undertaken on a sample of the population
The examination usually involves counting members of the aggregate & characteristics of the members
Ex. Presence of particular diseases, or production parameters such as milk yield
Types:
1. A cross- sectional survey records events occurring at a particular point in time
2. A longitudinal survey records events over a period of time<br>
slide4. Quantitative investigation A particular type of diagnostic survey is screening
Mass screening: Screening frequently involves investigation of the total population
Ex: Screening of cattle populations for tuberculosis
Strategic screening:
Ex: the serological sampling of sheep within a 3-km radius of premises on which foot-and-mouth disease has been diagnosed
Pre-scriptive screening: early identification of diseases
Ex: mammography to detect breast cancer in women<br>
slide5. Quantitative investigation 2. Monitoring:
The making of routine observations on health, productivity & environmental factors & the recording & transmission of these observations
Ex:
1. The regular recording of milk yields
2. The routine recording of meat inspection findings at abattoirs<br>
slide6. Quantitative investigation 3. Surveillance:
More intensive form of data recording than monitoring
Used to describe the tracing & observation of people who were in contact with cases of infectious disease
It is normally part of control programmes for specific diseases
Ex:
The recording of tuberculosis lesions at an abattoir, followed by tracing of infected animals from the abattoir back to their farms of origin<br>
slide7. Quantitative investigation 4. Study:
Any type of investigation
A study usually involves comparison of groups of animals
Ex: A comparison of the weights of animals that are fed different diets
Types of study:
Experimental
Observational
Cross-sectional
Cohort
Case-control<br>
slide8. Quantitative investigation Experimental study:
The investigator has the ability to allocate animals to various groups,
According to factors that the investigator can randomly assign to animals (e.g., treatment regimen, preventive technique)
Ex: Clinical trial<br>
slide9. Quantitative investigation 2. Observational study:
a. Cross sectional study: investigates relationships between disease & hypothesized causal factors in a specified population
Animals are categorized according to
Presence & absence of disease
Hypothesized causal factors
Ex: between urolithiasis (the disease) & dry cat food (the hypothesized causal factor)<br>
slide10. Quantitative investigation b. Case control study: compares a group of diseased animals with a group of healthy animals with respect to exposure to hypothesized causal factors
Animals are categorized according to
Presence & absence of disease
Ex: A group of cats with urolithiasis (the disease) can be compared with a group of cats without urolithiasis with respect to consumption of dry cat food (the factor) to determine whether that type of food has an effect on the pathogenesis of the disease<br>
slide11. Quantitative investigation b. Cohort study: In a cohort study, a group exposed to factors is compared with a group not exposed to the factors with respect to the development of a disease
Animals are categorized according to
Hypothesized causal factors
Ex: A group of cats is categorized with respect to consumption of dry cat food (the factor) with to determine whether that type of food has an effect on the pathogenesis of the urolithiasis (the disease)<br>
slide12. Quantitative investigation 2x2 contingency table:
In cohort studies (a + b) and ( c + d) are predetermined
In case-control studies (a + c) and ( b + d) are predetermined
In cross-sectional studies only n can be predetermined<br>
slide13. Synonyms of studies<br>
slide14. Cross Sectional Studies:
Advantages:
1.When random samples of the target population is selected, proportions exposed and unexposed in the target population can be estimated
2. Relatively quick to mount and conduct
3. Relatively inexpensive
4. Require relatively few subjects (unless disease is rare)
5. Current records occasionally can be used
6. No risk to subjects
7. Allow study of multiple potential cause of disease Comparison of the studies<br>
slide15. Cross Sectional Studies:
Disadvantages:
1. Moderate sample sizes are required to study rare diseases
2. Control of extraneous variables may be incomplete
3. Incidence in exposed and un exposed individuals can not be estimated. Comparison of the studies<br>
slide16. Case control Studies:
Advantages:
1. Well suited for the study of rare diseases or the disease with long incubation periods
2. Relatively quick to mount and conduct
3. Relatively inexpensive
4. Require relatively few subjects (unless disease is rare)
5. Existing records occasionally can be used
6. No risk to subjects
7. Allow study of multiple potential cause of disease Comparison of the studies<br>
slide17. Case control Studies:
Disadvantages:
Exposed and unexposed proportion in target population can not be estimated.
Rely on recall or records for information on past expenses
Validation of information is difficult or sometimes impossible
Control of extraneous variables may be incomplete
Selection of an appropriate comparison group may be difficult.
Incidence in exposed and un exposed individuals can not be estimated. Comparison of the studies<br>
slide18. Cohort Studies:
Advantages:
Incidence in exposed and un exposed individuals can be estimated
Permit flexibility in choosing variables to be systematically recorded. Comparison of the studies<br>
slide19. Cohort Studies:
Disadvantages:
Large number of subject is required to study rare diseases
Potentially long duration for follow-up
Relatively expensive to conduct
Maintaining follow-up is difficult
Control of extraneous variables may be incomplete Comparison of the studies<br>
slide20. An hypothesis of association between disease and a
factor can be tested using the x2 test
(This test cannot be used to measure the degree of association)
Degree of association Measures of association The absolute difference between disease occurrence in 'exposed' and 'unexposed' groups, estimated by determining the difference between the two proportions
(Attributable risk) The ratio of disease occurrence between the two groups can be calculated
Relative measure
(Relative risk & Odd ratio)<br>
slide21. Relative risk (RR) RR is the ratio of the incidence relative risk, of disease in exposed animals to the incidence in unexposed animals
Incidence exposed = a/(a + b),
Incidence unexposed = c!(c + d);
therefore, RR = {a/(a + b))/{c/(c + d )
The RR can only be estimated directly in cohort study<br>
slide22. Example: Incidence rates
Among smokers 70/7000 = 10 per 1000
Among Non-Smokers 3/3000 = 1 per 1000<br>
slide23. RR = {a/(a + b))/{c/(c + d )
RR=
Incidence of disease among exposed____
Incidence of disease among Un-exposed
= 10/1
* Smokers are 10 times at greater risk of developing lung cancer than non-smokers<br>
slide24. Attributable risk ‘Attributable risk: Describes absolute difference
Incidence of lung cancer in smokers, a/(a + b), is greater than the incidence in non smokers, (c/c + d ),
(Risk difference/attributable risk)
Delta exp = a/(a + b) - c/(c + d)/a/(a+b) X 100
= 10-1 X 100 = 90%
10
Attributable risk indicates to what extent the disease under study can be attributed to the exposure.
*The association between smoking and lung cancer is causal …90% of the lung cancer among smokers was due to their smoking<br>
slide25. Attributable proportion: expresses these differences in relative terms
Delta exp = (RR - l )/RR<br>
slide26. Odds ratio (OR) The (psi), is another odds ratio (relative odds), relative measure based on 'odds': the ratio of the probability of an event occurring to the probability of it not occurring<br>
slide27. Odds ratio (OR) In a cohort study, a disease odds ratio, ψd is estimated; this is the ratio of the odds of disease in exposed individuals to the odds in those unexposed
This simplifies to ad/bc, the cross-product ratio, which therefore is a synonym for the odds ratio
In a case-control study, a different odds ratio, the exposure odds ratio, ψe is determined
A prevalence odds ratio, is derived in a cross sectional study, thus: ad/bc<br>
slide30. Example: Exposure rates
Cases= a/(a+c)= 33/35 = 94.2%
Control= b/(b+d)= 55/82 = 67%<br>
slide31. Odds Ratio= ad/bc
= 33X27/ 55X2
= 8.1
Smokers of less than 5 cigarettes per day showed a risk of having lung cancer 8.1 times that of Non smokers
Odds ratio is the key parameter in the analysis of case control study<br>