Cost Driver Analysis: General Approach to the Work Expert Team Meeting Denver, Colorado August 27, 2014 The Challenge Find a way to convey to policymakers and the general public The factors that determine the costs of educating a student
"Cost Driver Analysis: General Approach to the Work" is the property of its rightful owner. Permission is granted to
download and print the materials on this website for personal, non-commercial use only, and to display it
on your personal computer provided you do not modify the materials and that you retain all copyright
notices contained in the materials. By downloading content from our website, you accept the terms of this
agreement.
Presentation Transcript
01
Cost Driver Analysis: General Approach to the Work Expert Team Meeting Denver, Colorado August 27, 2014<br>
02
The Challenge Find a way to convey to policymakers and the general public
The factors that determine the costs of educating a student and why those costs differ in different types of institutions
The factors that determine prices charged to students
The extent to which Colorado institutions have managed to control cost and prices
Put state appropriations in the context of overall institutional finance
Base the story line on sound analyses
Build trust by increasing transparency of cost and pricing considerations 2<br>
03
Cost Driver Analyses – General Approach Separate analyses for different types of institutions – tentatively
Research 1
Research 2
Other 4-year
2-year
Identify those factors that explain most of the variation in cost
Compare Colorado institutions to other, similar institutions on these variables
Work hard at developing graphic presentations that tell the story 3<br>
04
General Approach Conduct majority of analyses using national data
Cast a wide net
Add granularity by using data compiled from CDHE and institutions
Every effort made to minimize impact on institutions
Address cost driver analyses first, pricing second
Inform mission metric decisions in funding model 4<br>
05
Cost Driver Analyses Dependent variables
Expenditures on instruction
Expenditures on student-related functions
Instruction
Student services
[I/(I+P.S+Res)] Academic Support 5<br>
06
Independent Variables Basic institutional characteristics
Sector (Carnegie classifications)
Locale
Rural
Small town
Suburban
Urban
Median wages of county/area in which institution is located
Size – annual FTE enrollment 6<br>
07
Independent Variables (continued) Student characteristics
Preparation – entering ACT/SAT
% Part-time
% Pell
% Underrepresented minorities
Hispanic
African-American
American Indians
% older than 25
% of entering students requiring remediation
% headcount enrollments that are graduate and professional 7<br>
08
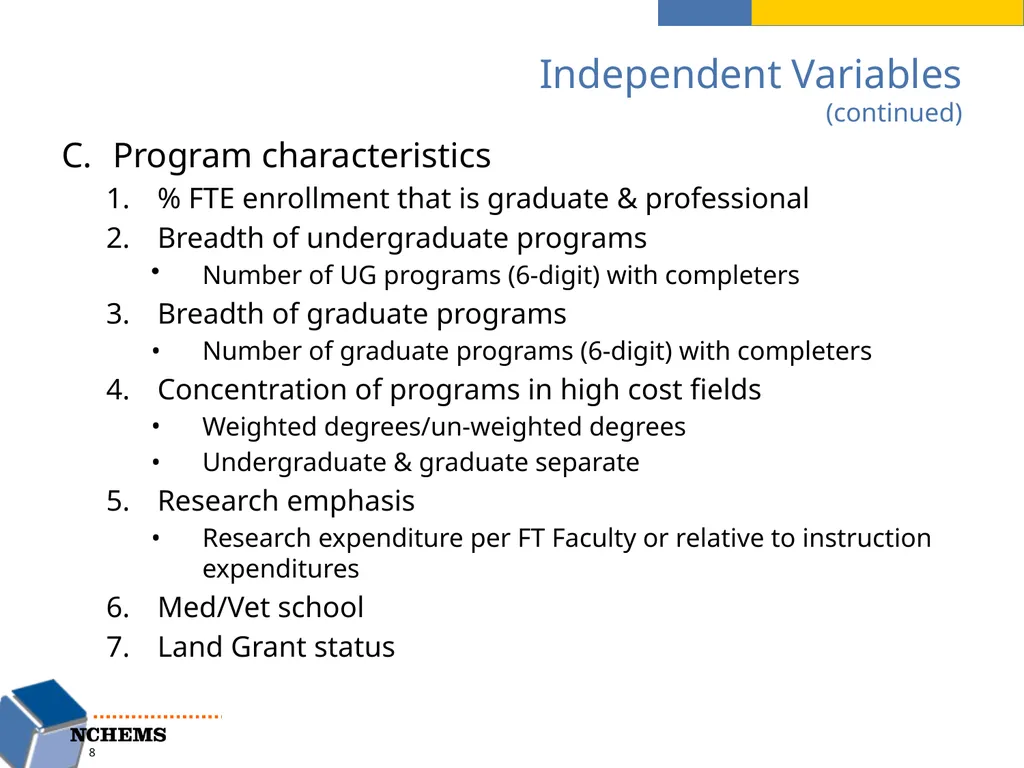
Independent Variables (continued) Program characteristics
% FTE enrollment that is graduate & professional
Breadth of undergraduate programs
Number of UG programs (6-digit) with completers
Breadth of graduate programs
Number of graduate programs (6-digit) with completers
Concentration of programs in high cost fields
Weighted degrees/un-weighted degrees
Undergraduate & graduate separate
Research emphasis
Research expenditure per FT Faculty or relative to instruction expenditures
Med/Vet school
Land Grant status 8<br>
09
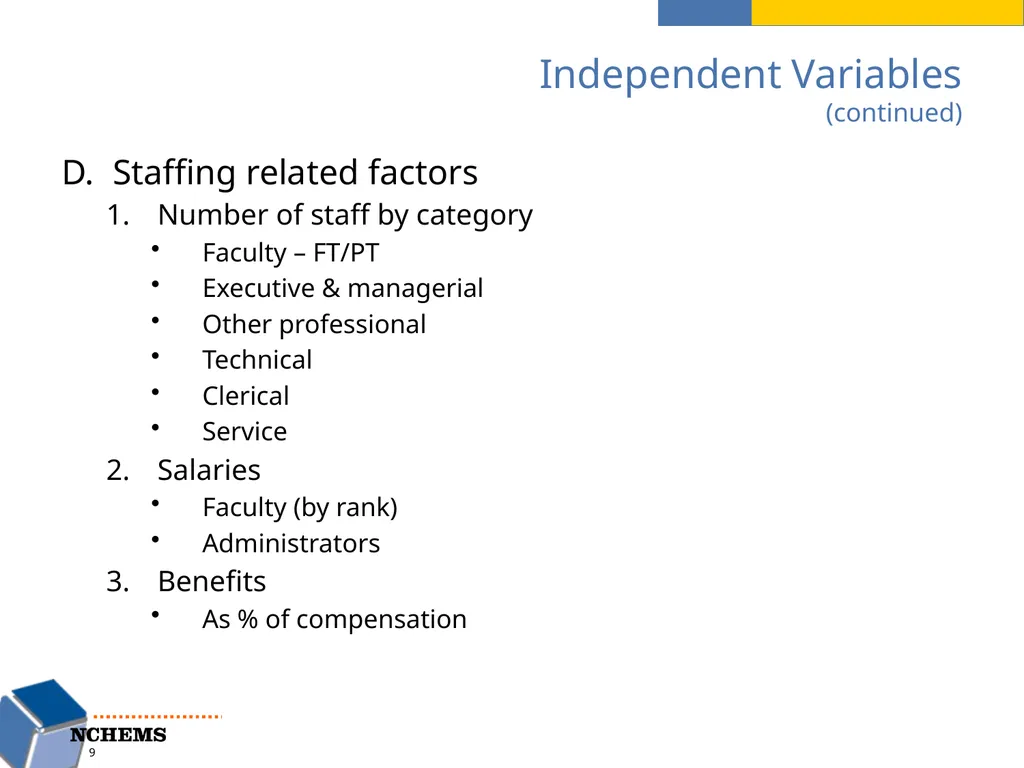
Independent Variables (continued) Staffing related factors
Number of staff by category
Faculty – FT/PT
Executive & managerial
Other professional
Technical
Clerical
Service
Salaries
Faculty (by rank)
Administrators
Benefits
As % of compensation 9<br>
10
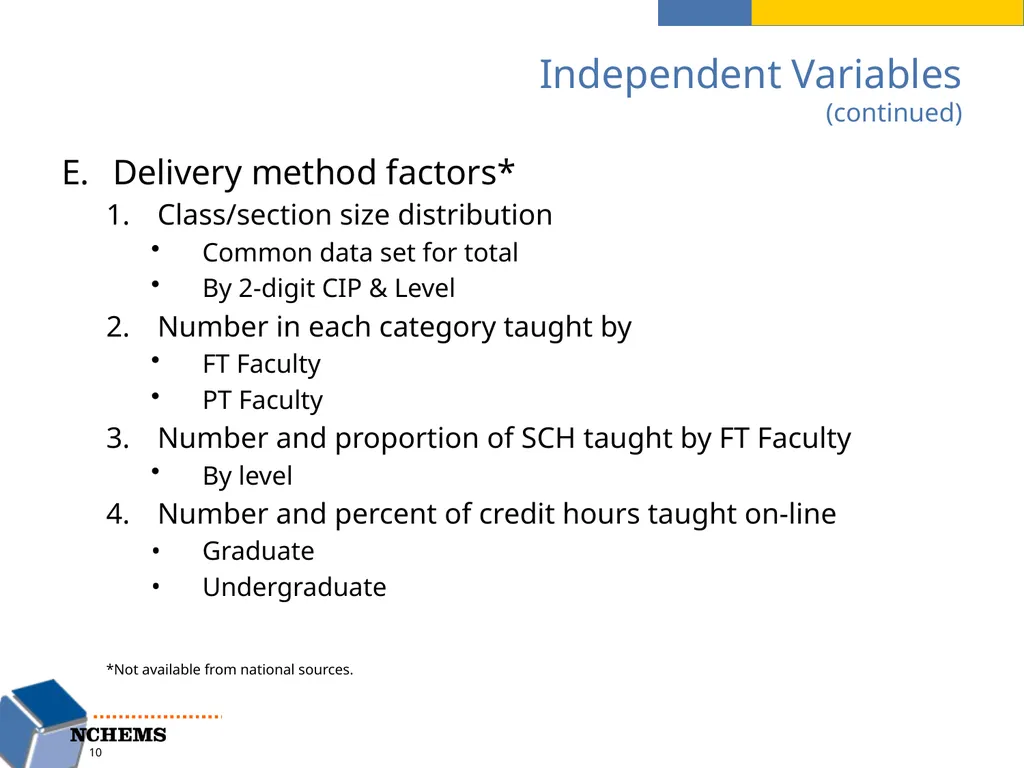
Independent Variables (continued) Delivery method factors*
Class/section size distribution
Common data set for total
By 2-digit CIP & Level
Number in each category taught by
FT Faculty
PT Faculty
Number and proportion of SCH taught by FT Faculty
By level
Number and percent of credit hours taught on-line
Graduate
Undergraduate 10 *Not available from national sources.<br>
11
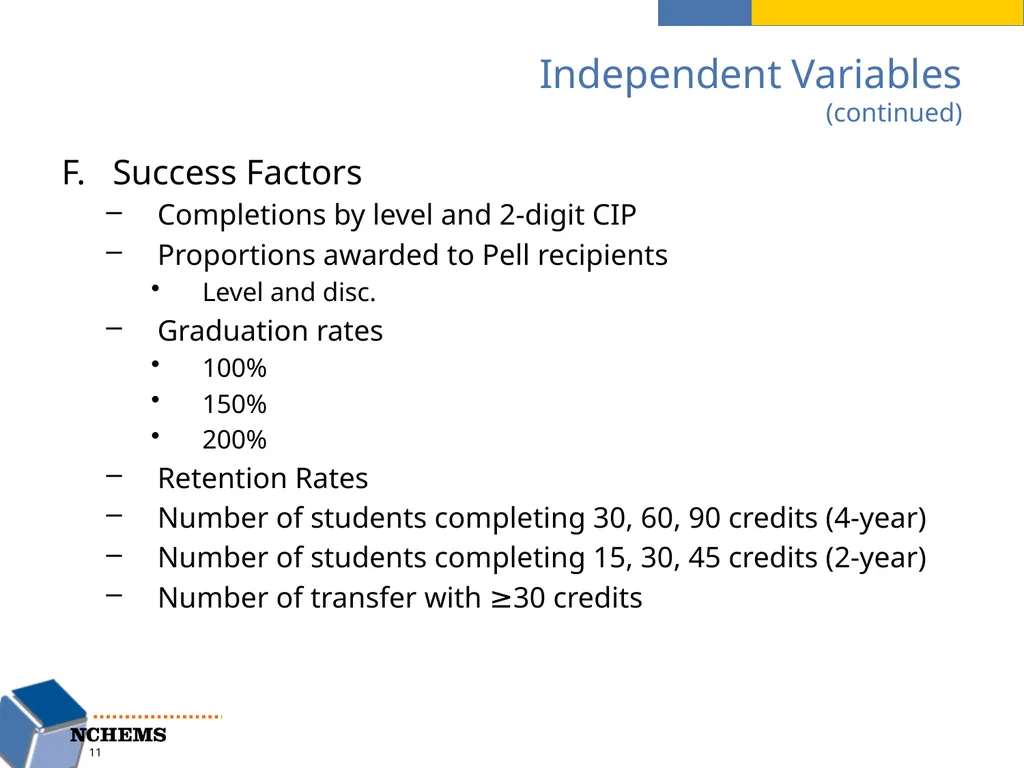
Independent Variables (continued) Success Factors
Completions by level and 2-digit CIP
Proportions awarded to Pell recipients
Level and disc.
Graduation rates
100%
150%
200%
Retention Rates
Number of students completing 30, 60, 90 credits (4-year)
Number of students completing 15, 30, 45 credits (2-year)
Number of transfer with ≥30 credits 11<br>
12
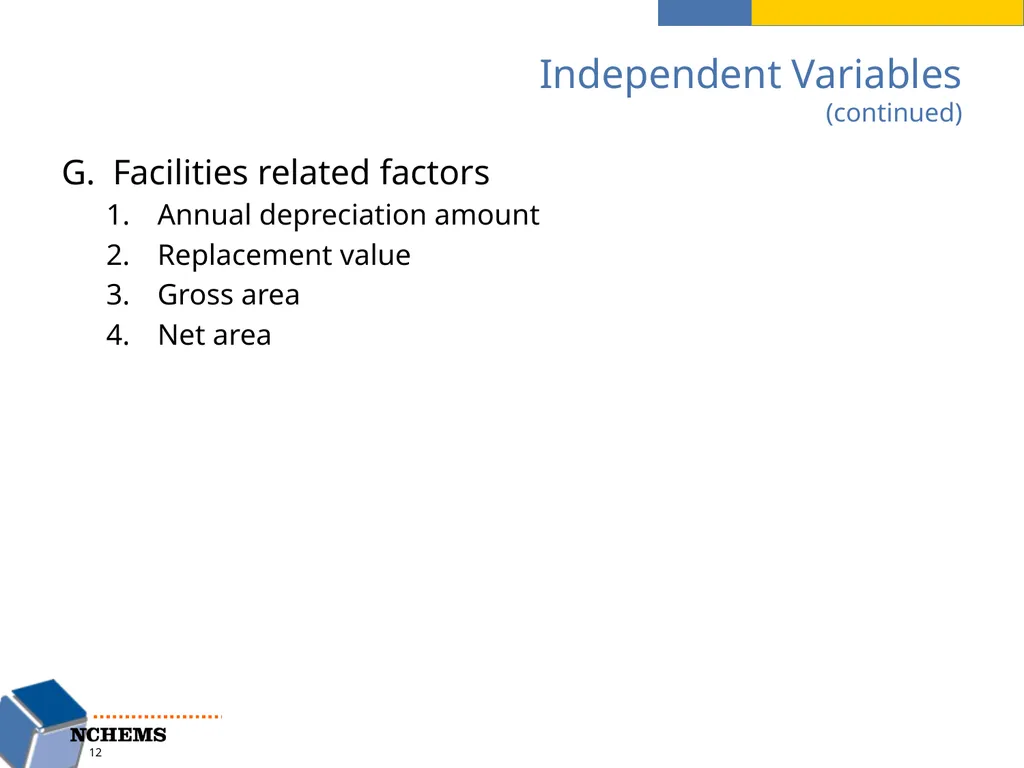
Independent Variables (continued) Facilities related factors
Annual depreciation amount
Replacement value
Gross area
Net area 12<br>
13
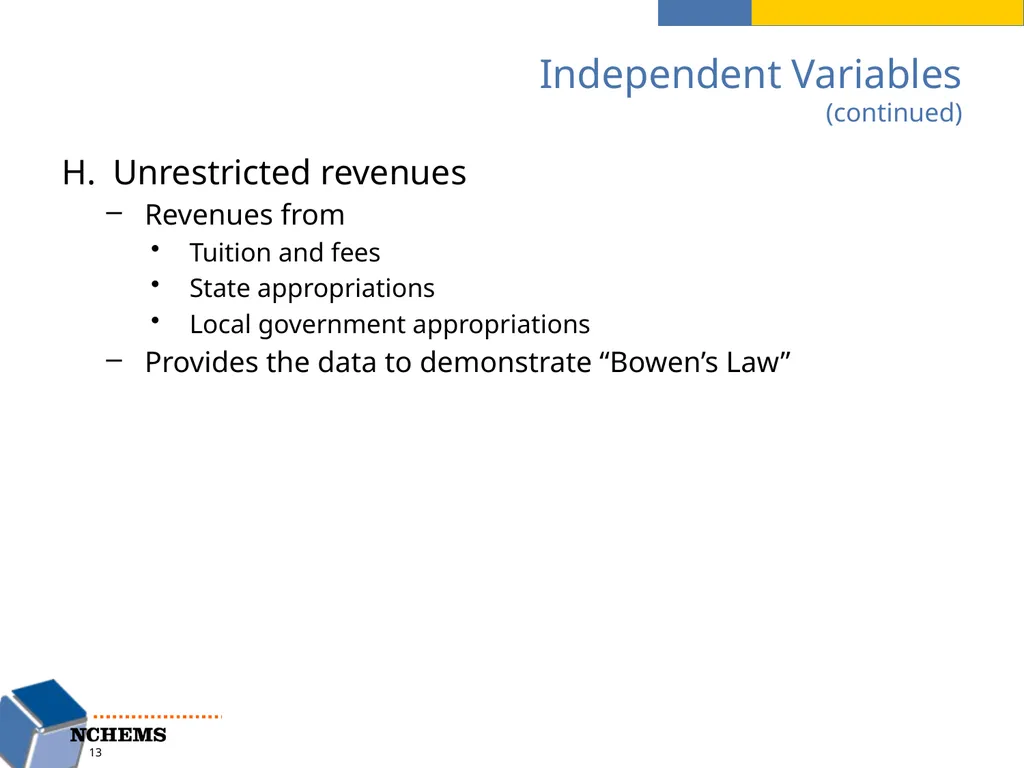
Independent Variables (continued) Unrestricted revenues
Revenues from
Tuition and fees
State appropriations
Local government appropriations
Provides the data to demonstrate “Bowen’s Law” 13<br>
14
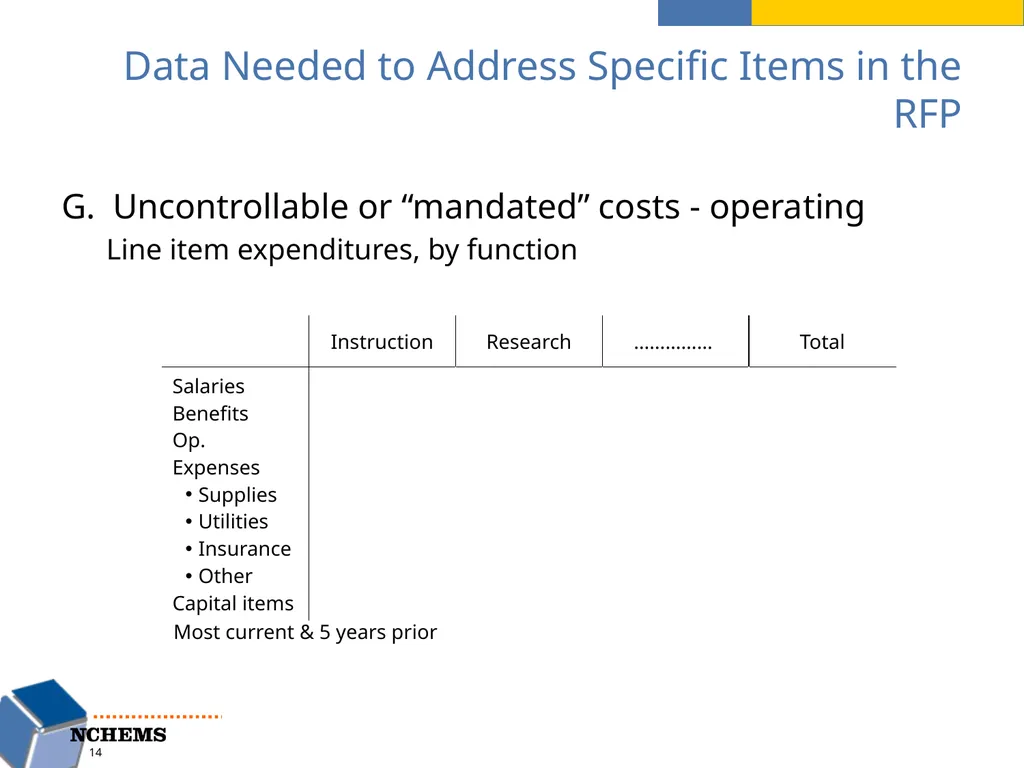
Data Needed to Address Specific Items in the RFP Uncontrollable or “mandated” costs - operating
Line item expenditures, by function 14 Most current & 5 years prior<br>
15
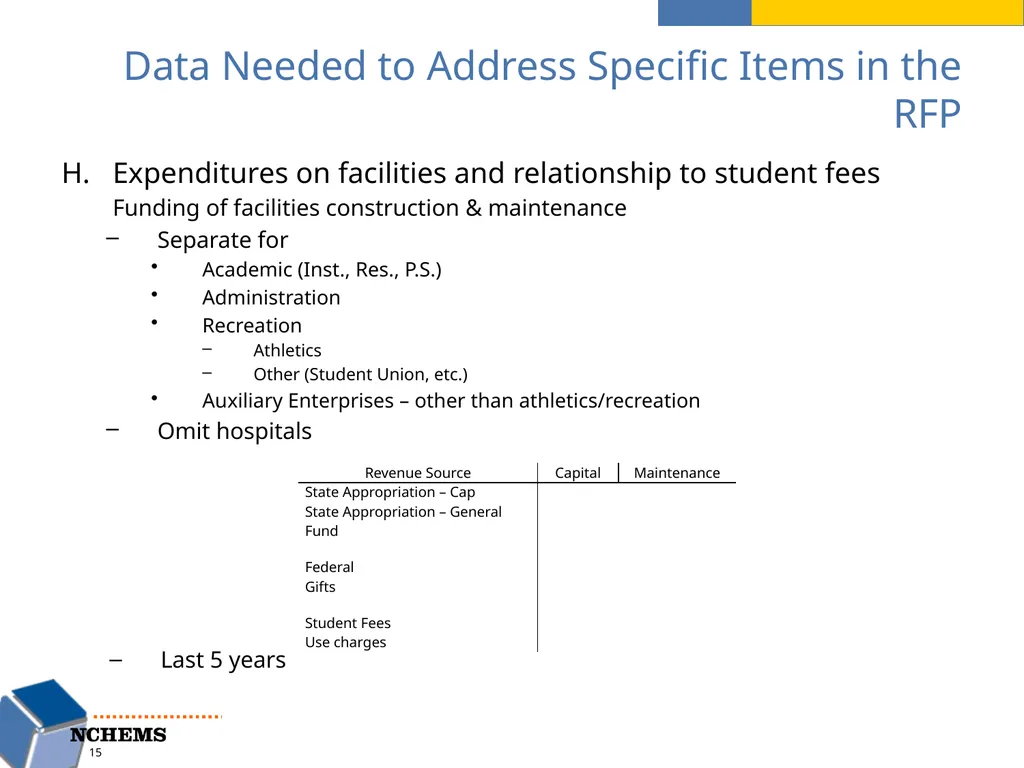
Data Needed to Address Specific Items in the RFP Expenditures on facilities and relationship to student fees
Funding of facilities construction & maintenance
Separate for
Academic (Inst., Res., P.S.)
Administration
Recreation
Athletics
Other (Student Union, etc.)
Auxiliary Enterprises – other than athletics/recreation
Omit hospitals 15 Last 5 years<br>
16
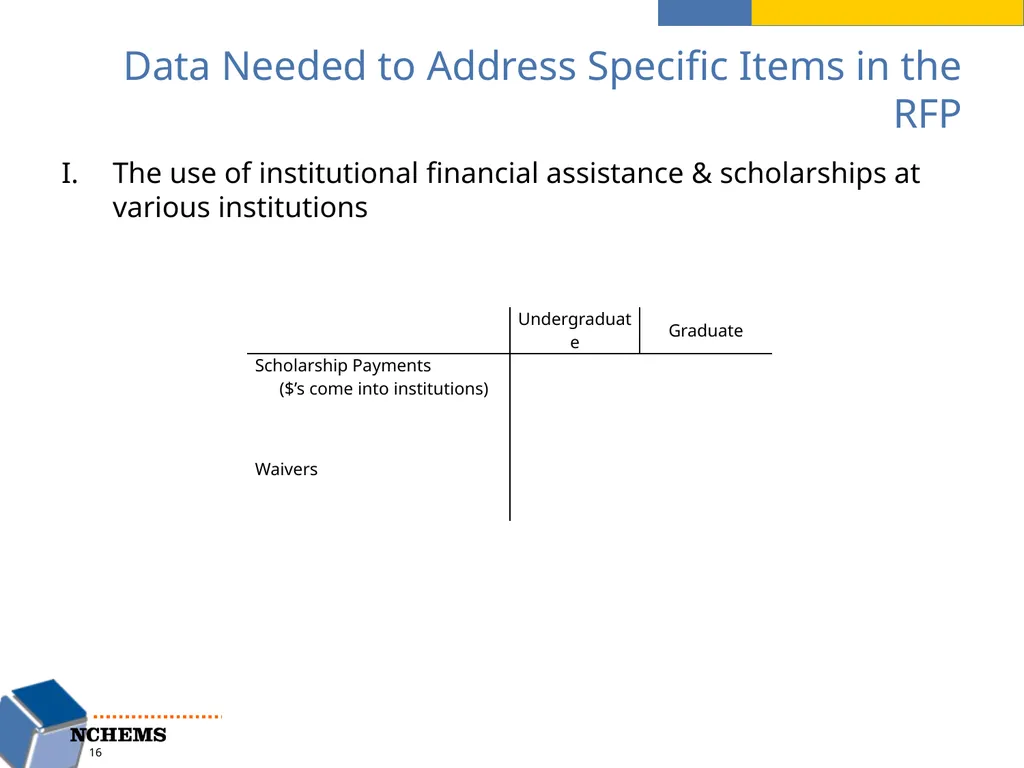
Data Needed to Address Specific Items in the RFP The use of institutional financial assistance & scholarships at various institutions 16<br>