
CSE503: Software Engineering Research approaches,


Description: CSE503: Software Engineering Research approaches, economics and governance David Notkin Spring 2011 Evaluation of SE research 503 11sp UW CSE D. Notkin What convinces you? Why? 2 Possible answers include Intuition Quantitative
Related Topics
Download Presentation
"CSE503: Software Engineering Research approaches," is the property of its rightful owner. Permission is granted to download and print the materials on this website for personal, non-commercial use only, and to display it on your personal computer provided you do not modify the materials and that you retain all copyright notices contained in the materials. By downloading content from our website, you accept the terms of this agreement.
Presentation Transcript
slide1. CSE503:
Software Engineering Research approaches, economics and governance David Notkin
Spring 2011<br>
slide2. Evaluation of SE research 503 11sp © UW CSE • D. Notkin What convinces you?
Why? 2<br>
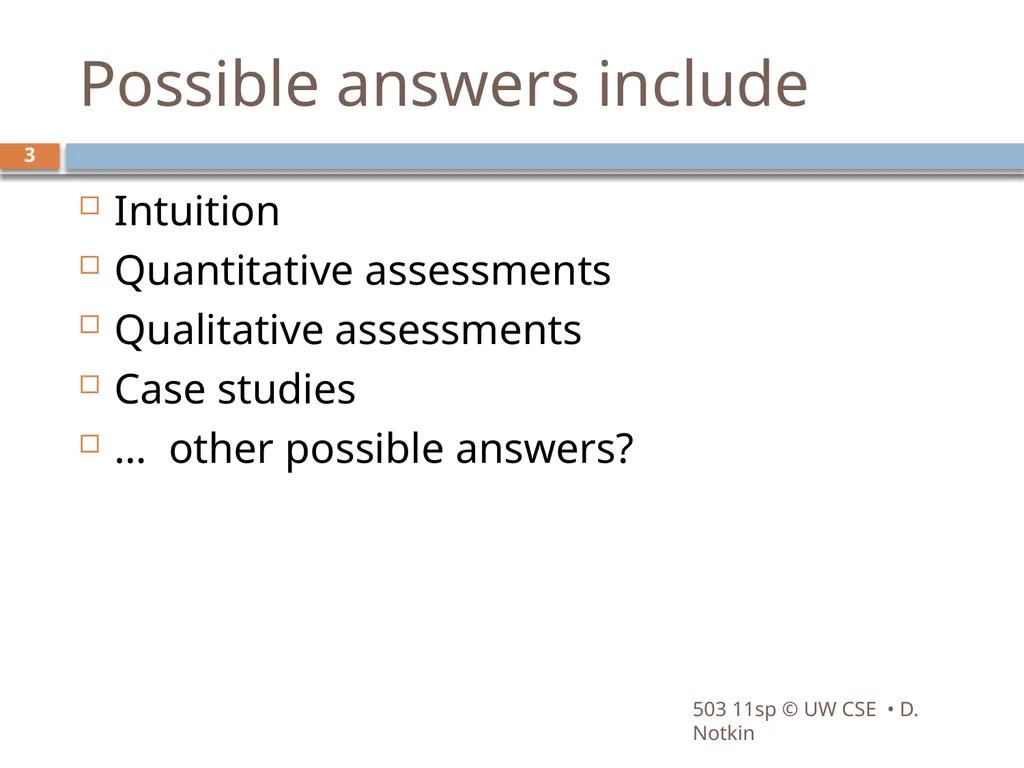
slide3. Possible answers include Intuition
Quantitative assessments
Qualitative assessments
Case studies
… other possible answers? 503 11sp © UW CSE • D. Notkin 3<br>
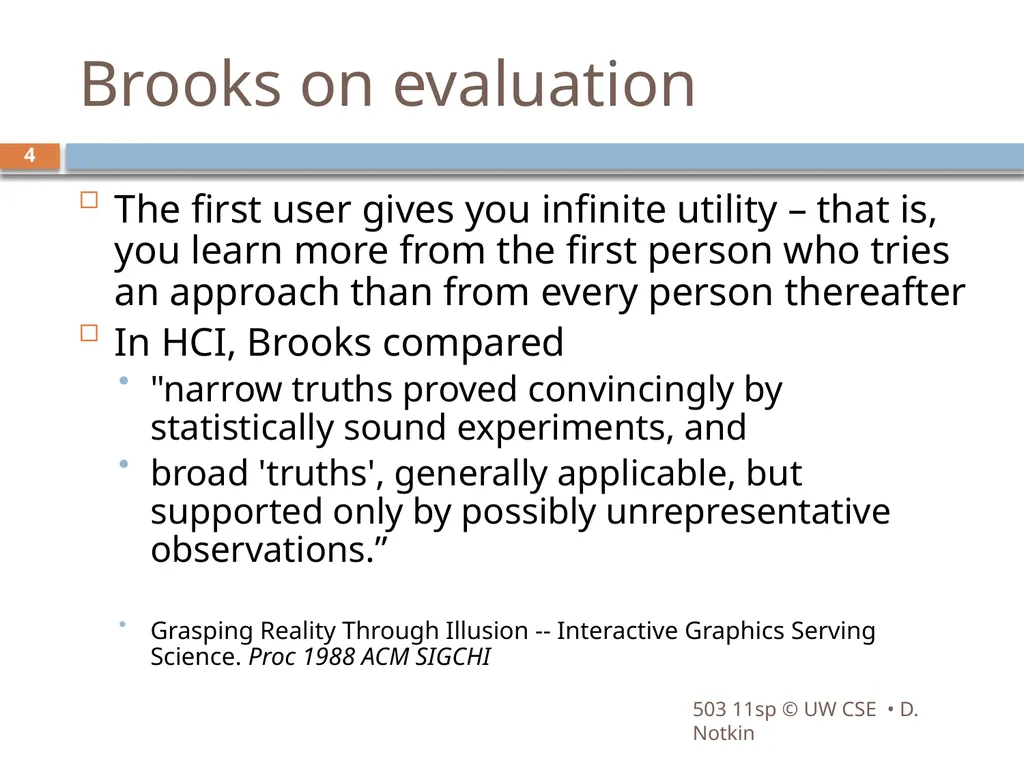
slide4. Brooks on evaluation The first user gives you infinite utility – that is, you learn more from the first person who tries an approach than from every person thereafter
In HCI, Brooks compared
"narrow truths proved convincingly by statistically sound experiments, and
broad 'truths', generally applicable, but supported only by possibly unrepresentative observations.”
Grasping Reality Through Illusion -- Interactive Graphics Serving Science. Proc 1988 ACM SIGCHI 503 11sp © UW CSE • D. Notkin 4<br>
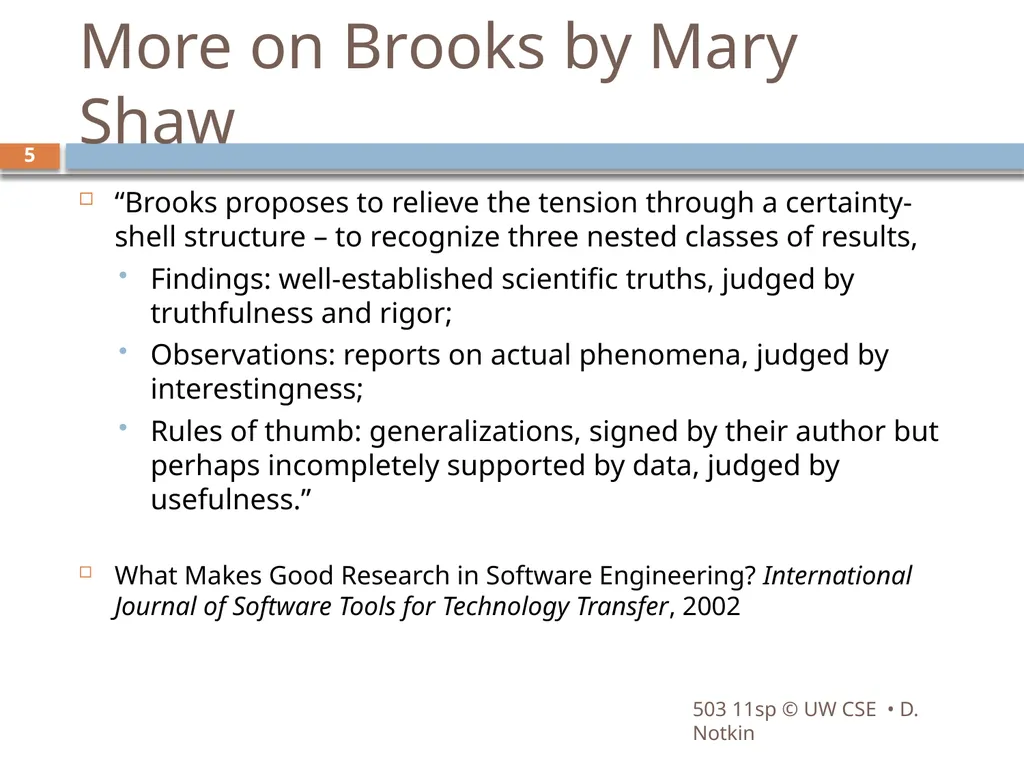
slide5. More on Brooks by Mary Shaw “Brooks proposes to relieve the tension through a certainty-shell structure – to recognize three nested classes of results,
Findings: well-established scientific truths, judged by truthfulness and rigor;
Observations: reports on actual phenomena, judged by interestingness;
Rules of thumb: generalizations, signed by their author but perhaps incompletely supported by data, judged by usefulness.”
What Makes Good Research in Software Engineering? International Journal of Software Tools for Technology Transfer, 2002 503 11sp © UW CSE • D. Notkin 5<br>
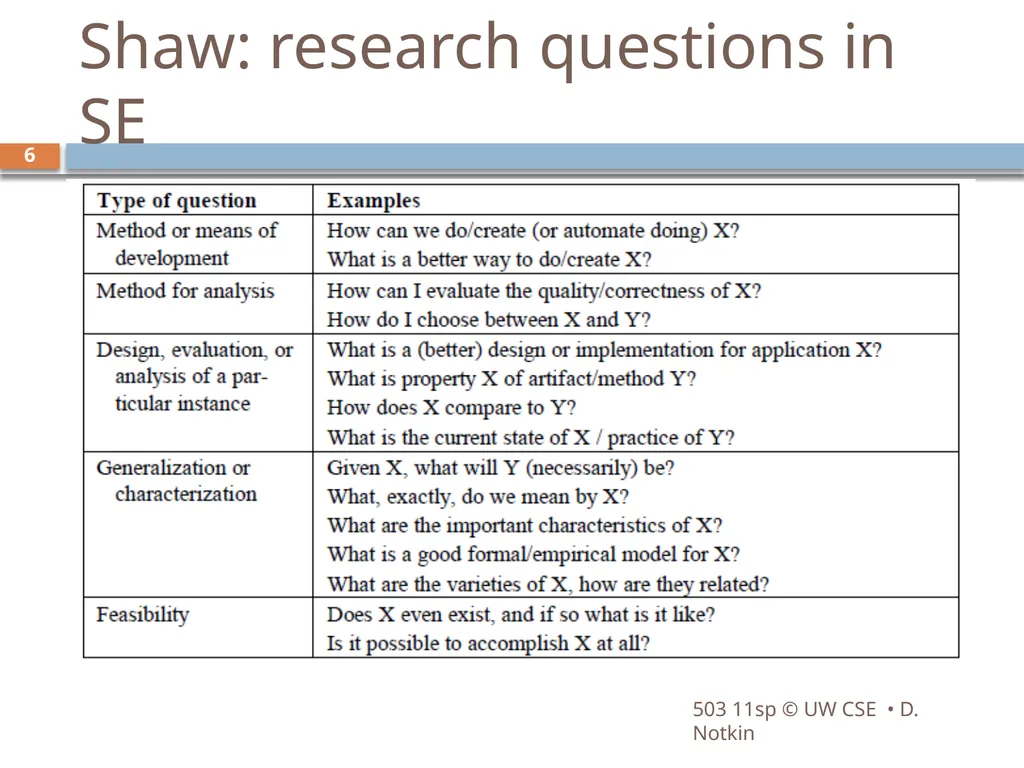
slide6. Shaw: research questions in SE 503 11sp © UW CSE • D. Notkin 6<br>
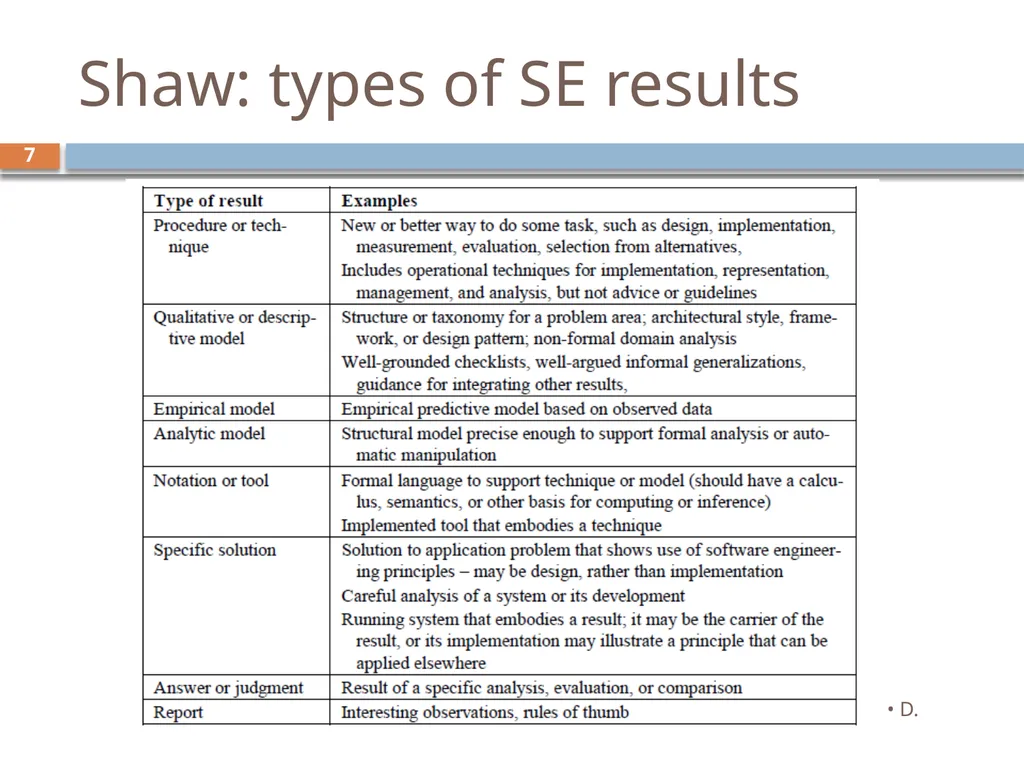
slide7. Shaw: types of SE results 503 11sp © UW CSE • D. Notkin 7<br>
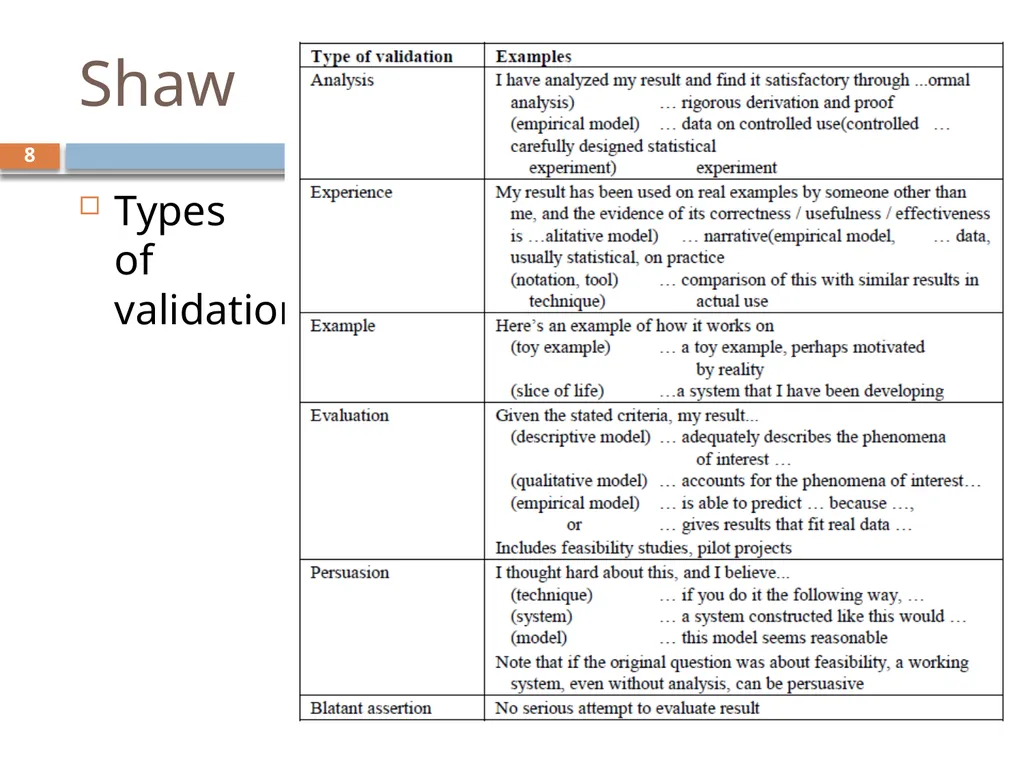
slide8. Shaw Types of validation 503 11sp © UW CSE • D. Notkin 8<br>
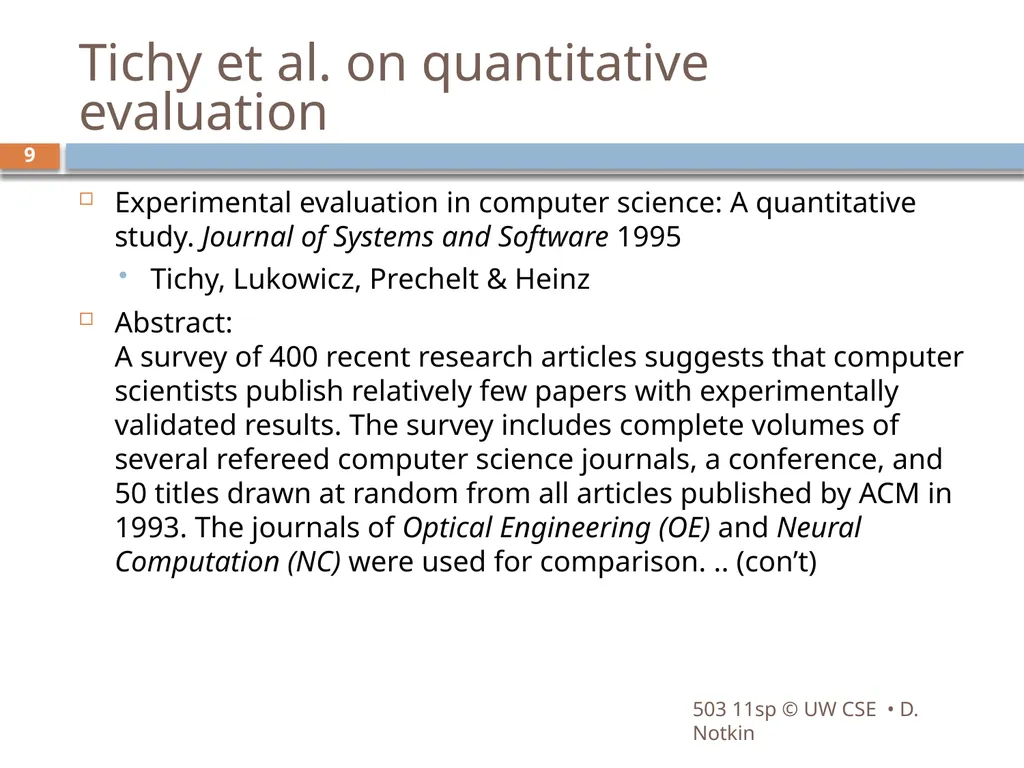
slide9. Tichy et al. on quantitative evaluation Experimental evaluation in computer science: A quantitative study. Journal of Systems and Software 1995
Tichy, Lukowicz, Prechelt & Heinz
Abstract: A survey of 400 recent research articles suggests that computer scientists publish relatively few papers with experimentally validated results. The survey includes complete volumes of several refereed computer science journals, a conference, and 50 titles drawn at random from all articles published by ACM in 1993. The journals of Optical Engineering (OE) and Neural Computation (NC) were used for comparison. .. (con’t) 503 11sp © UW CSE • D. Notkin 9<br>
slide10. Con’t Of the papers in the random sample that would require experimental validation, 40% have none at all. In journals related to software engineering, this fraction is 50%. In comparison, the fraction of papers lacking quantitative evaluation in OE and NC is only 15% and 12%, respectively. Conversely, the fraction of papers that devote one fifth or more of their space to experimental validation is almost 70% for OE and NC, while it is a mere 30% for the computer science (CS) random sample and 20% for software engineering. The low ratio of validated results appears to be a serious weakness in computer science research. This weakness should be rectified for the long-term health of the field. The fundamental principle of science, the definition almost, is this: the sole test of the validity of any idea is experiment. —Richard P. Feynman. Beware of bugs in the above code; I have only proved it correct, not tried it. —Donald E. Knuth 503 11sp © UW CSE • D. Notkin 10<br>
slide11. Technology transfer: briefly Not a consumer problem
Not a producer problem
An ecosystem issue 503 11sp © UW CSE • D. Notkin 11<br>
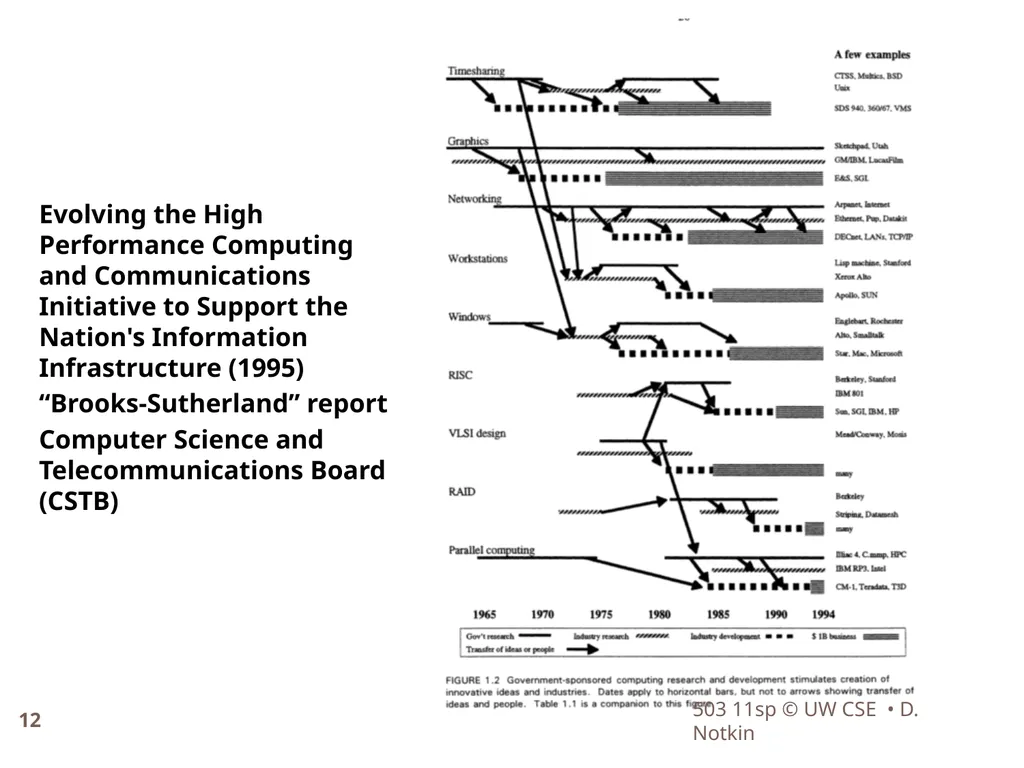
slide12. Evolving the High Performance Computing and Communications Initiative to Support the Nation's Information Infrastructure (1995)
“Brooks-Sutherland” report
Computer Science and Telecommunications Board (CSTB) 503 11sp © UW CSE • D. Notkin 12<br>
slide13. Software engineering economics The phrase dates to around 1981, when Barry Boehm published his tome with the same title
Boehm identified engineering economics as one “scientific principle” in which software engineering fell short of hardware engineering
To the first order, the focus of his book was on how to better estimate effort, cost and schedule for large software projects – COCOMO (COnstructive COst MOdel) 503 11sp © UW CSE • D. Notkin 13<br>
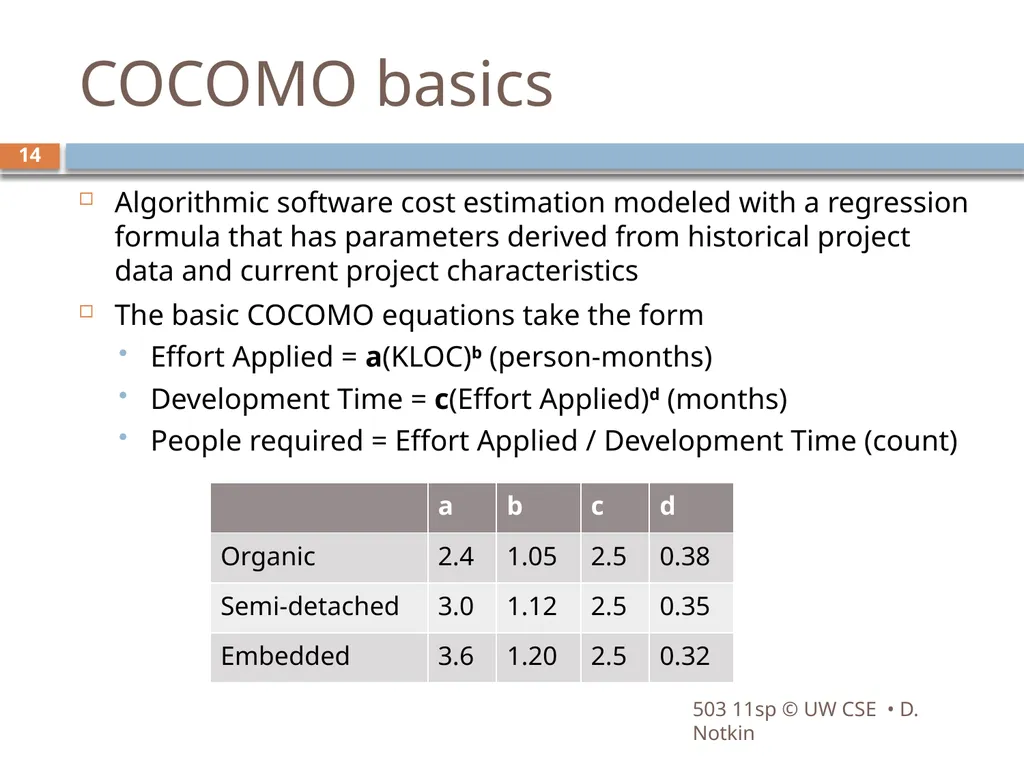
slide14. COCOMO basics Algorithmic software cost estimation modeled with a regression formula that has parameters derived from historical project data and current project characteristics
The basic COCOMO equations take the form
Effort Applied = a(KLOC)b (person-months)
Development Time = c(Effort Applied)d (months)
People required = Effort Applied / Development Time (count) 503 11sp © UW CSE • D. Notkin 14<br>
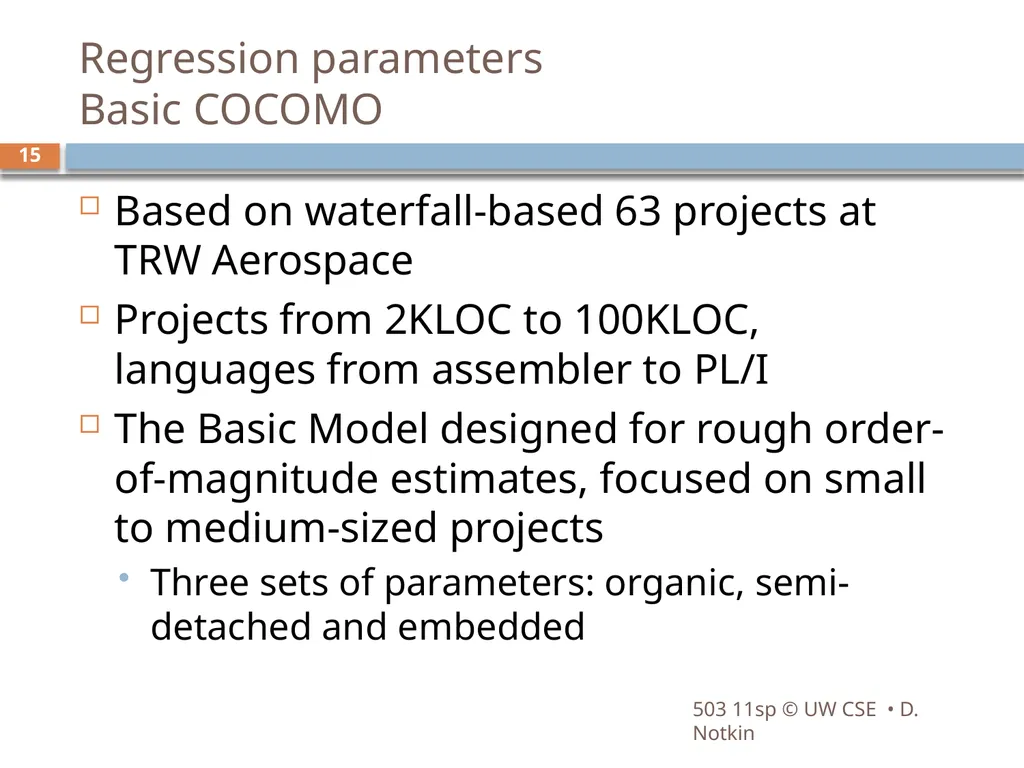
slide15. Regression parameters Basic COCOMO Based on waterfall-based 63 projects at TRW Aerospace
Projects from 2KLOC to 100KLOC, languages from assembler to PL/I
The Basic Model designed for rough order-of-magnitude estimates, focused on small to medium-sized projects
Three sets of parameters: organic, semi-detached and embedded 503 11sp © UW CSE • D. Notkin 15<br>
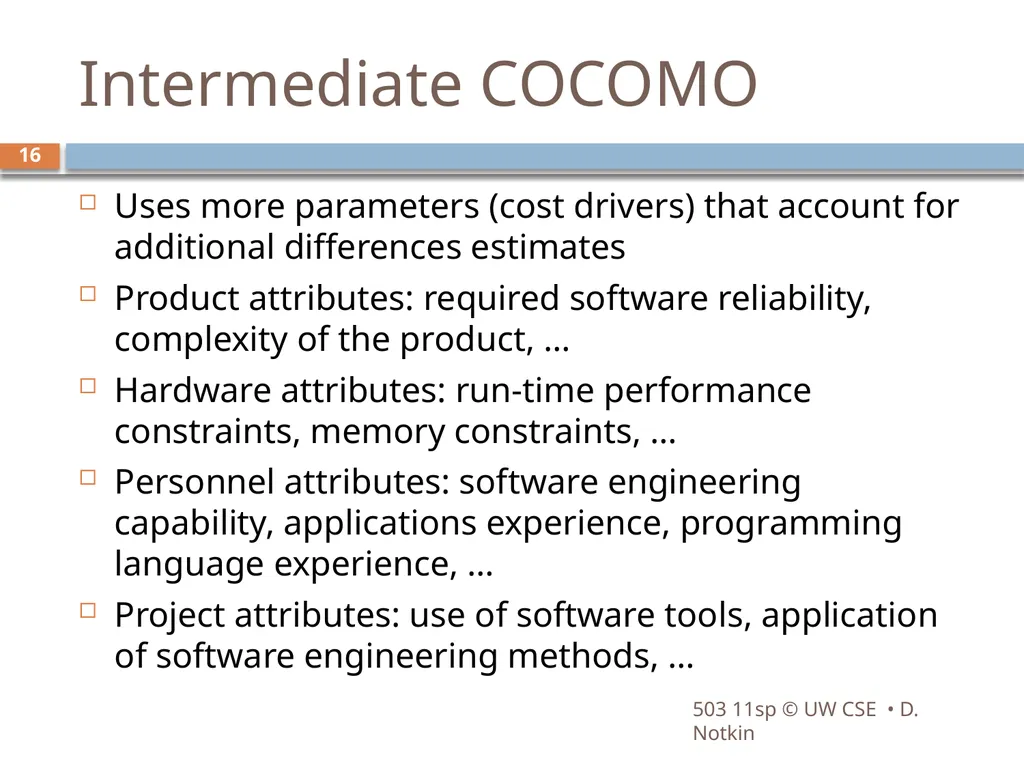
slide16. Intermediate COCOMO Uses more parameters (cost drivers) that account for additional differences estimates
Product attributes: required software reliability, complexity of the product, …
Hardware attributes: run-time performance constraints, memory constraints, …
Personnel attributes: software engineering capability, applications experience, programming language experience, …
Project attributes: use of software tools, application of software engineering methods, … 503 11sp © UW CSE • D. Notkin 16<br>
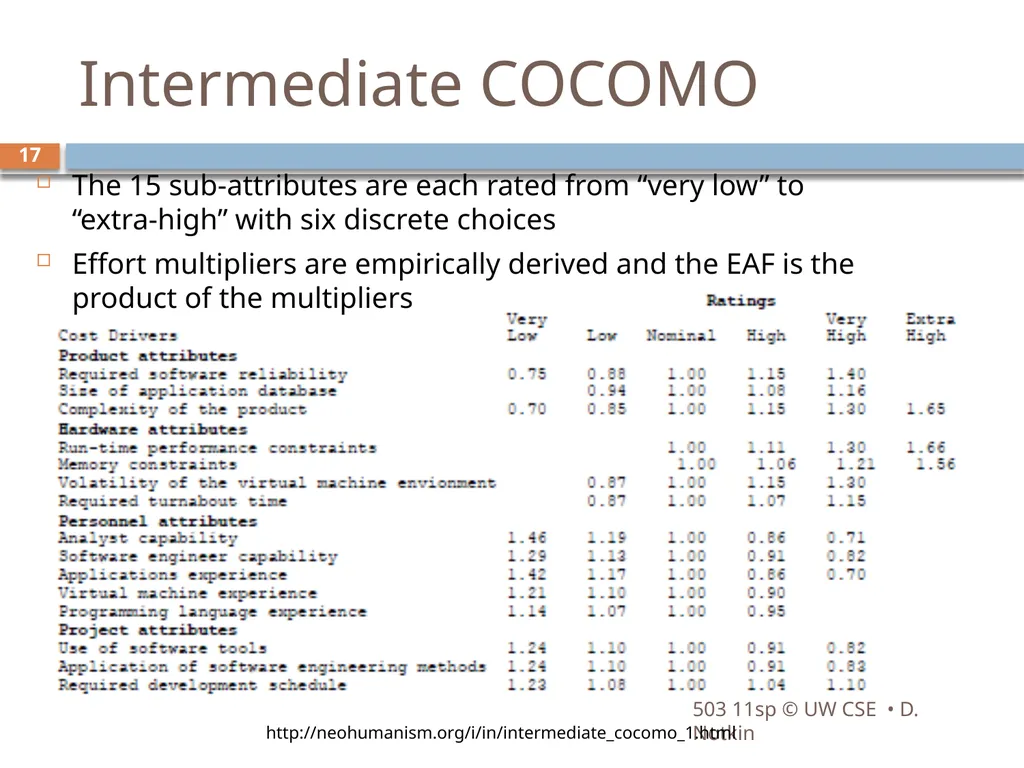
slide17. Intermediate COCOMO The 15 sub-attributes are each rated from “very low” to “extra-high” with six discrete choices
Effort multipliers are empirically derived and the EAF is the product of the multipliers 503 11sp © UW CSE • D. Notkin http://neohumanism.org/i/in/intermediate_cocomo_1.html 17<br>
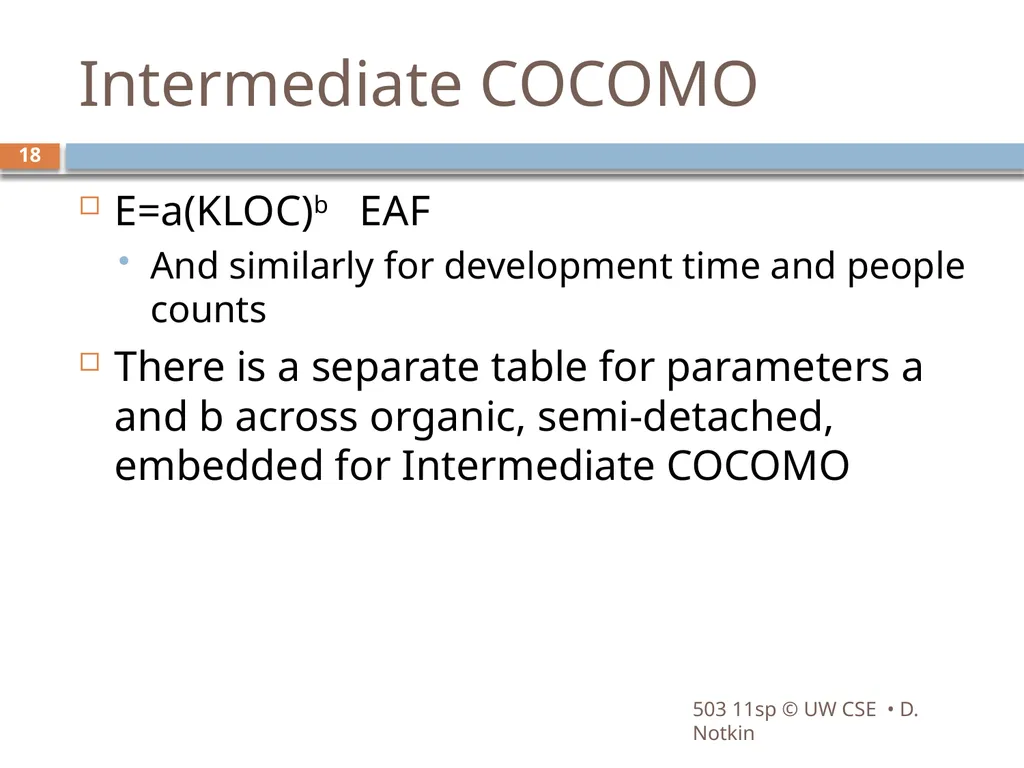
slide18. Intermediate COCOMO E=a(KLOC)b EAF
And similarly for development time and people counts
There is a separate table for parameters a and b across organic, semi-detached, embedded for Intermediate COCOMO 503 11sp © UW CSE • D. Notkin 18<br>
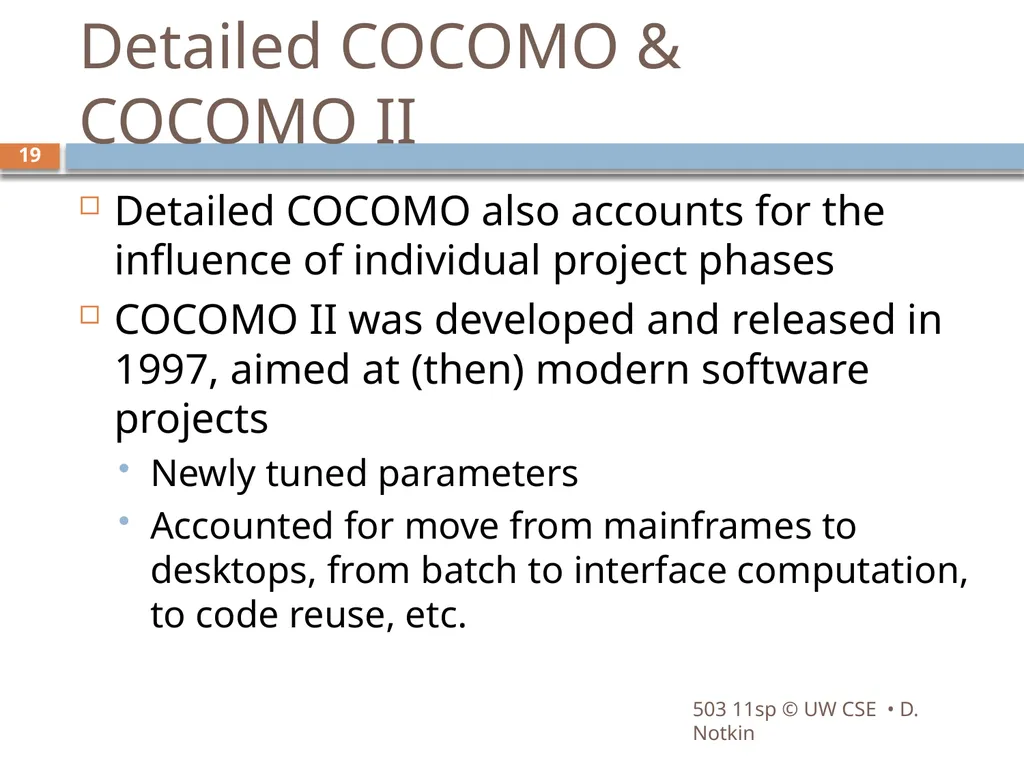
slide19. Detailed COCOMO & COCOMO II Detailed COCOMO also accounts for the influence of individual project phases
COCOMO II was developed and released in 1997, aimed at (then) modern software projects
Newly tuned parameters
Accounted for move from mainframes to desktops, from batch to interface computation, to code reuse, etc. 503 11sp © UW CSE • D. Notkin 19<br>
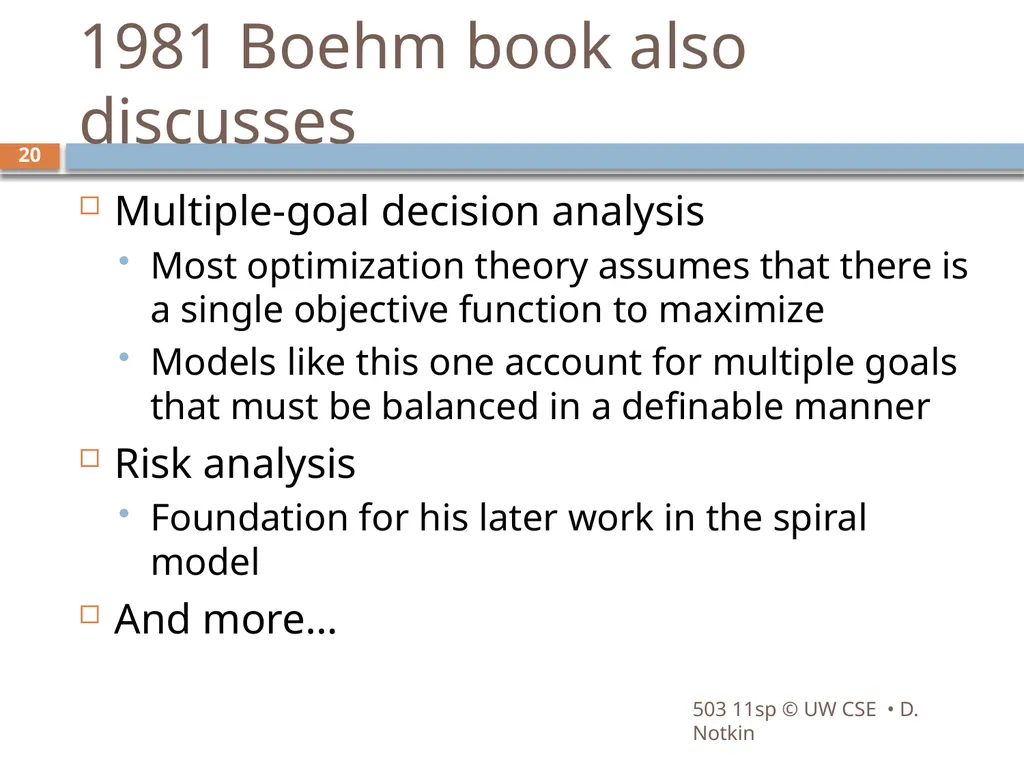
slide20. 1981 Boehm book also discusses Multiple-goal decision analysis
Most optimization theory assumes that there is a single objective function to maximize
Models like this one account for multiple goals that must be balanced in a definable manner
Risk analysis
Foundation for his later work in the spiral model
And more… 503 11sp © UW CSE • D. Notkin 20<br>
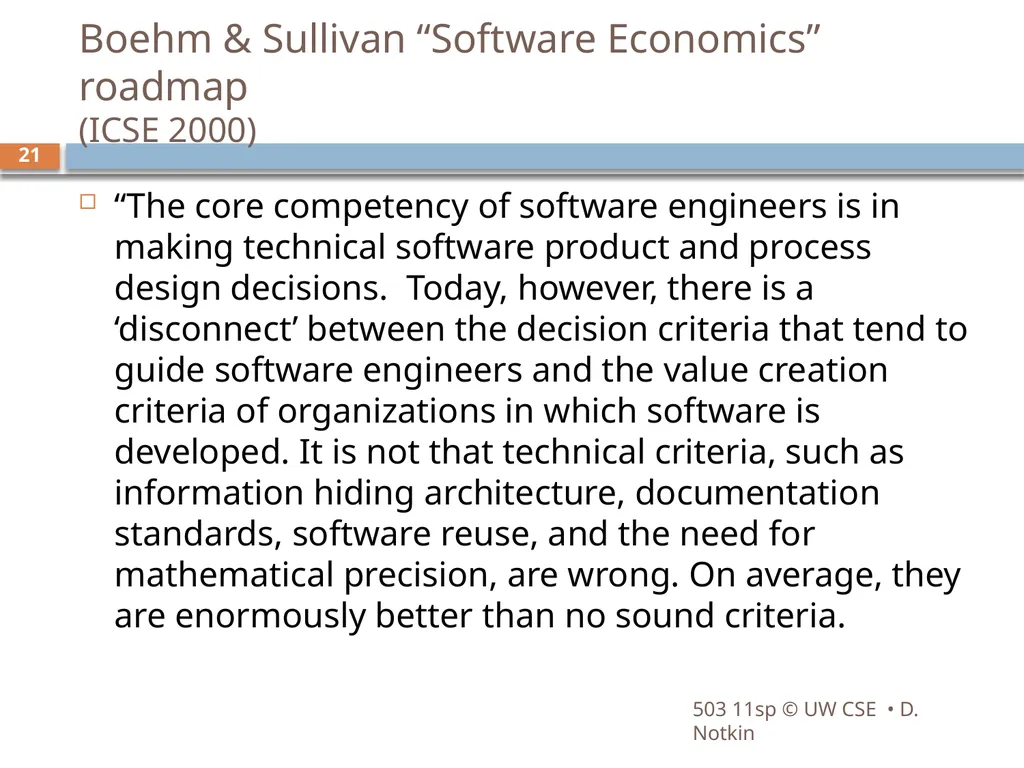
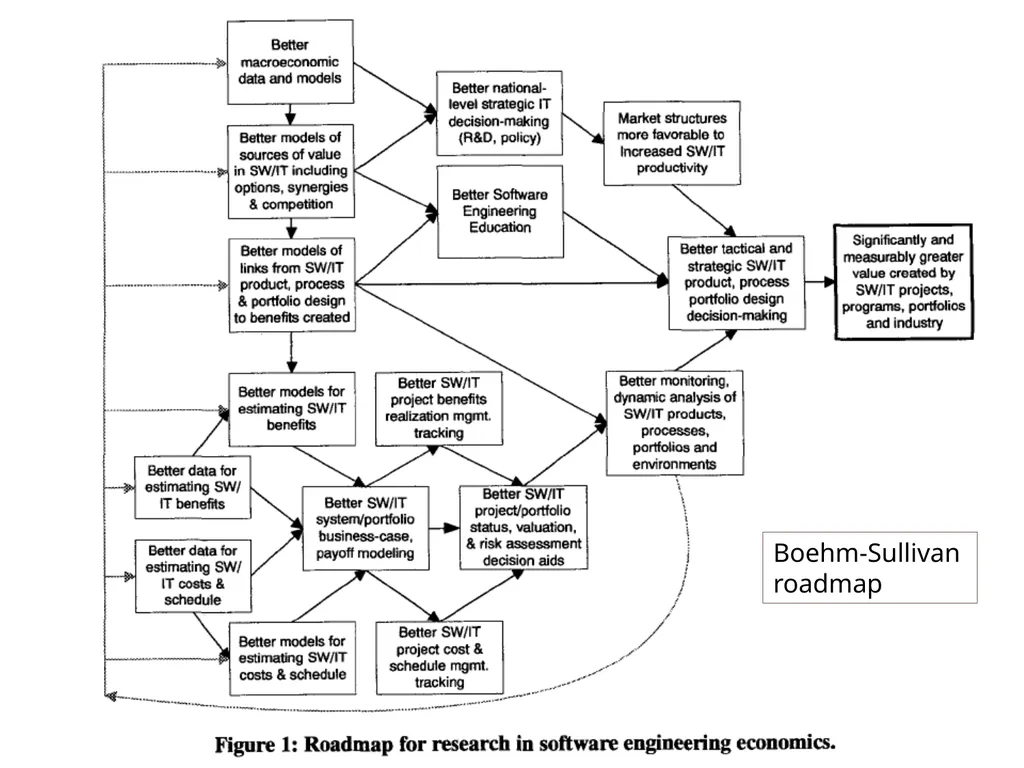
slide21. Boehm & Sullivan “Software Economics” roadmap (ICSE 2000) “The core competency of software engineers is in making technical software product and process design decisions. Today, however, there is a ‘disconnect’ between the decision criteria that tend to guide software engineers and the value creation criteria of organizations in which software is developed. It is not that technical criteria, such as information hiding architecture, documentation standards, software reuse, and the need for mathematical precision, are wrong. On average, they are enormously better than no sound criteria. 503 11sp © UW CSE • D. Notkin 21<br>
slide22. Con’t “However, software engineers are usually not involved in or often do not understand enterprise-level value creation objectives. The connections between technical parameters and value creation are understood vaguely, if at all. There is rarely any real measurement or analysis of how software engineering investments contribute to value creation. And senior management often does not understand success criteria for software development or how investments at the technical level can contribute fundamentally to value creation. As a result, technical criteria tend to be applied in ways that in general are not connected to, and are thus usually not optimal for, value creation.” 503 11sp © UW CSE • D. Notkin 22<br>
slide23. Thinking about value Decision theory (or utility theory) defines a framework for decisions under uncertainty, depending on the risk characteristics of decision makers
This is closely related to (again) multi-objective decision-making
Classical corporate finance uses net present value (NPV) as an investment decision criterion and computes it by discounted cash flow analysis (DCF) – can’t make a business case without these 503 11sp © UW CSE • D. Notkin 23<br>
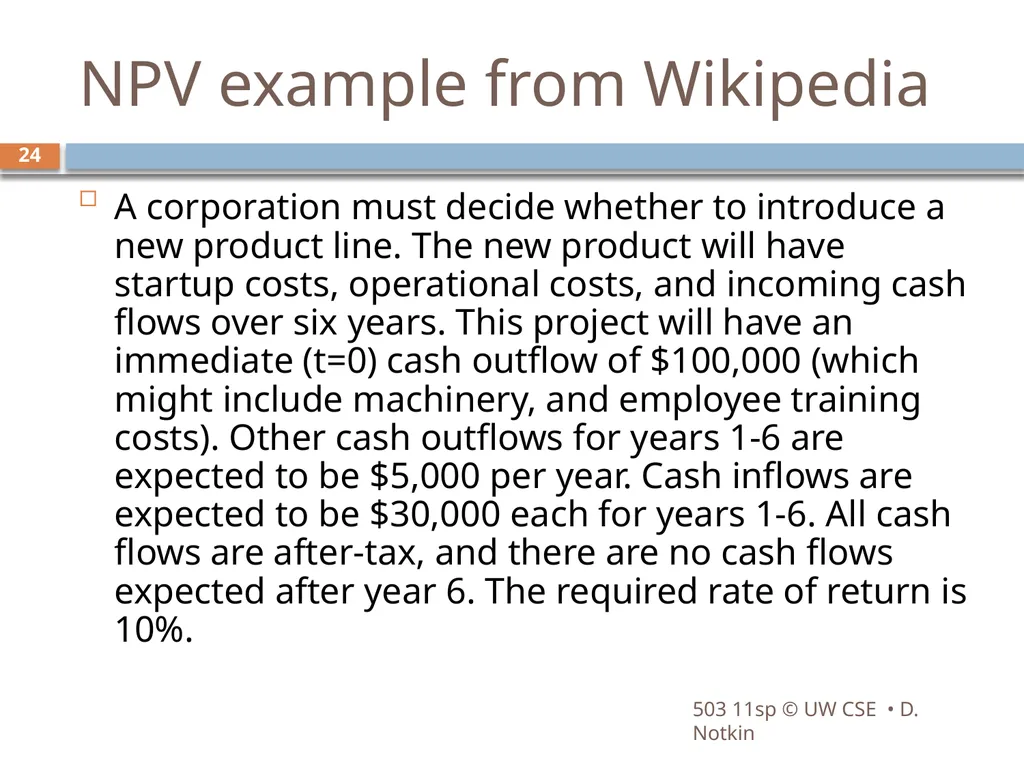
slide24. NPV example from Wikipedia A corporation must decide whether to introduce a new product line. The new product will have startup costs, operational costs, and incoming cash flows over six years. This project will have an immediate (t=0) cash outflow of $100,000 (which might include machinery, and employee training costs). Other cash outflows for years 1-6 are expected to be $5,000 per year. Cash inflows are expected to be $30,000 each for years 1-6. All cash flows are after-tax, and there are no cash flows expected after year 6. The required rate of return is 10%. 503 11sp © UW CSE • D. Notkin 24<br>
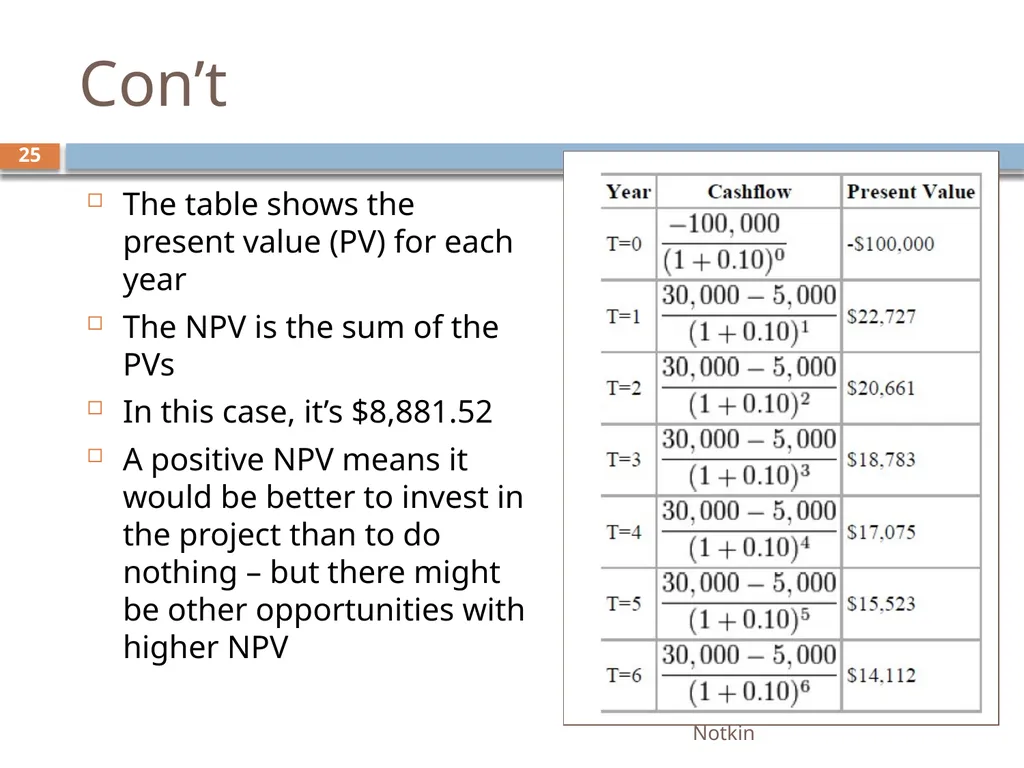
slide25. Con’t The table shows the present value (PV) for each year
The NPV is the sum of the PVs
In this case, it’s $8,881.52
A positive NPV means it would be better to invest in the project than to do nothing – but there might be other opportunities with higher NPV 503 11sp © UW CSE • D. Notkin 25<br>
slide26. Real options DCF/NPV treats assets as passively held – not actively managed
But projects are (or can be ) actively managed
Management usually has the flexibility to make changes to real investments in light of new information. (e.g., to abandon a project, enter a new market, etc.)
The key idea of real options is to treat such flexibility as an option, and to (in some cases) price them using techniques related to those for financial options 503 11sp © UW CSE • D. Notkin 26<br>
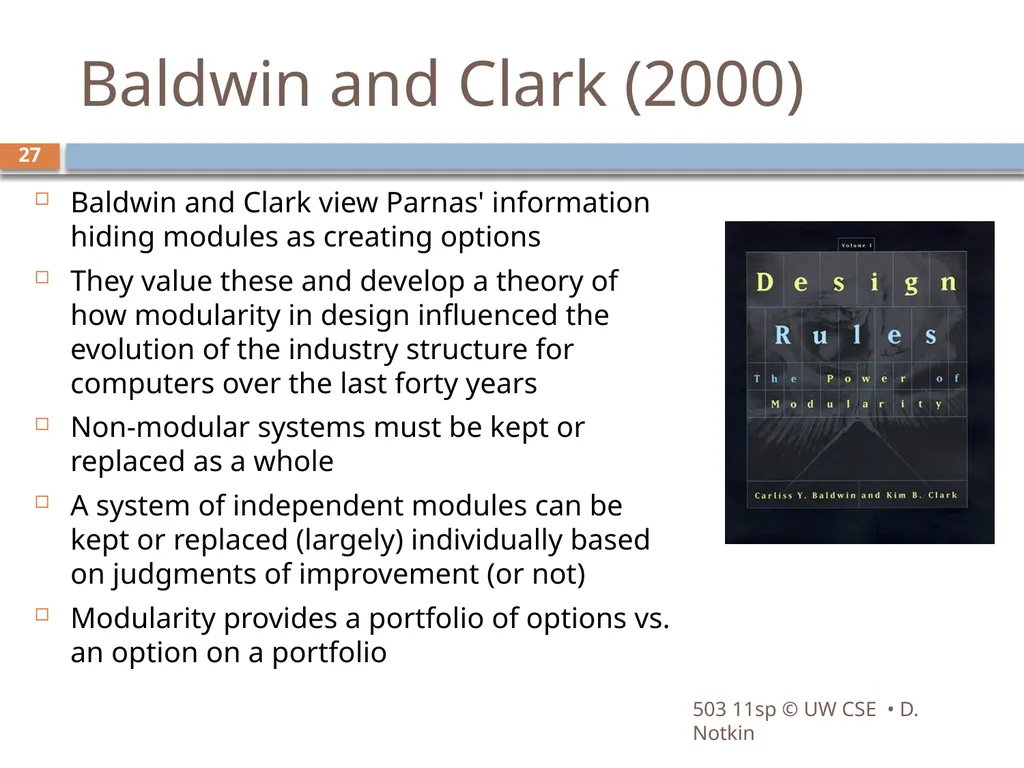
slide27. Baldwin and Clark (2000) Baldwin and Clark view Parnas' information hiding modules as creating options
They value these and develop a theory of how modularity in design influenced the evolution of the industry structure for computers over the last forty years
Non-modular systems must be kept or replaced as a whole
A system of independent modules can be kept or replaced (largely) individually based on judgments of improvement (or not)
Modularity provides a portfolio of options vs. an option on a portfolio 503 11sp © UW CSE • D. Notkin 27<br>
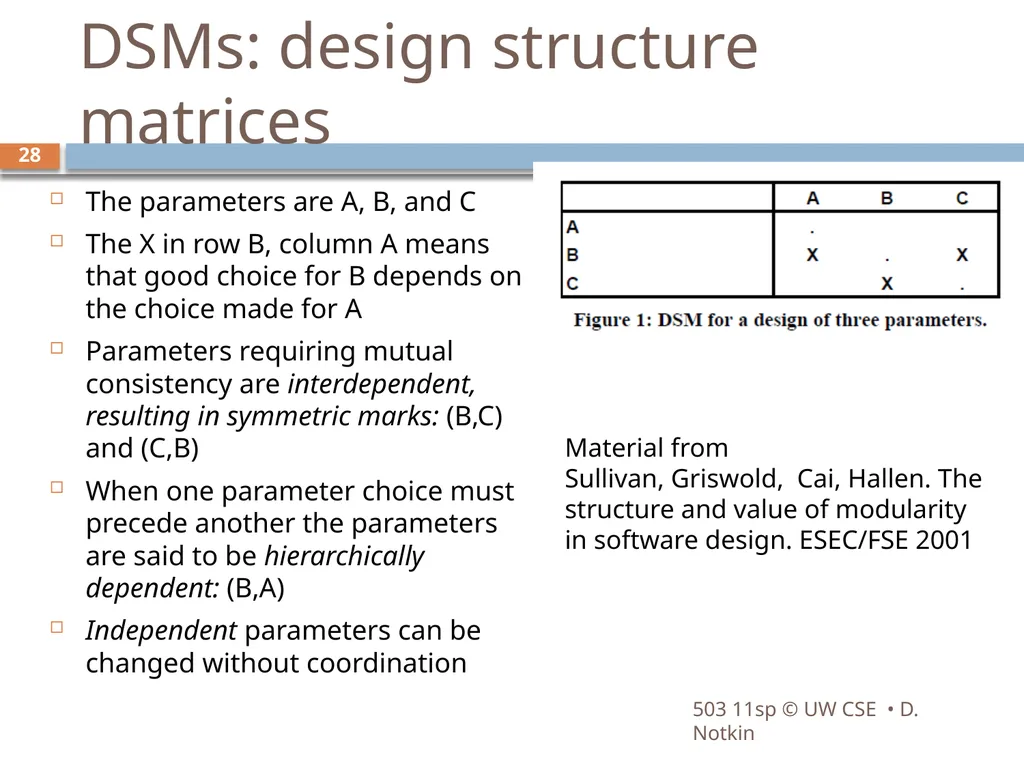
slide28. DSMs: design structure matrices The parameters are A, B, and C
The X in row B, column A means that good choice for B depends on the choice made for A
Parameters requiring mutual consistency are interdependent, resulting in symmetric marks: (B,C) and (C,B)
When one parameter choice must precede another the parameters are said to be hierarchically dependent: (B,A)
Independent parameters can be changed without coordination 503 11sp © UW CSE • D. Notkin Material from Sullivan, Griswold, Cai, Hallen. The structure and value of modularity in software design. ESEC/FSE 2001 28<br>
slide29. Splitting DSMs may not show largely independent designs
In these cases, one approach is to apply splitting
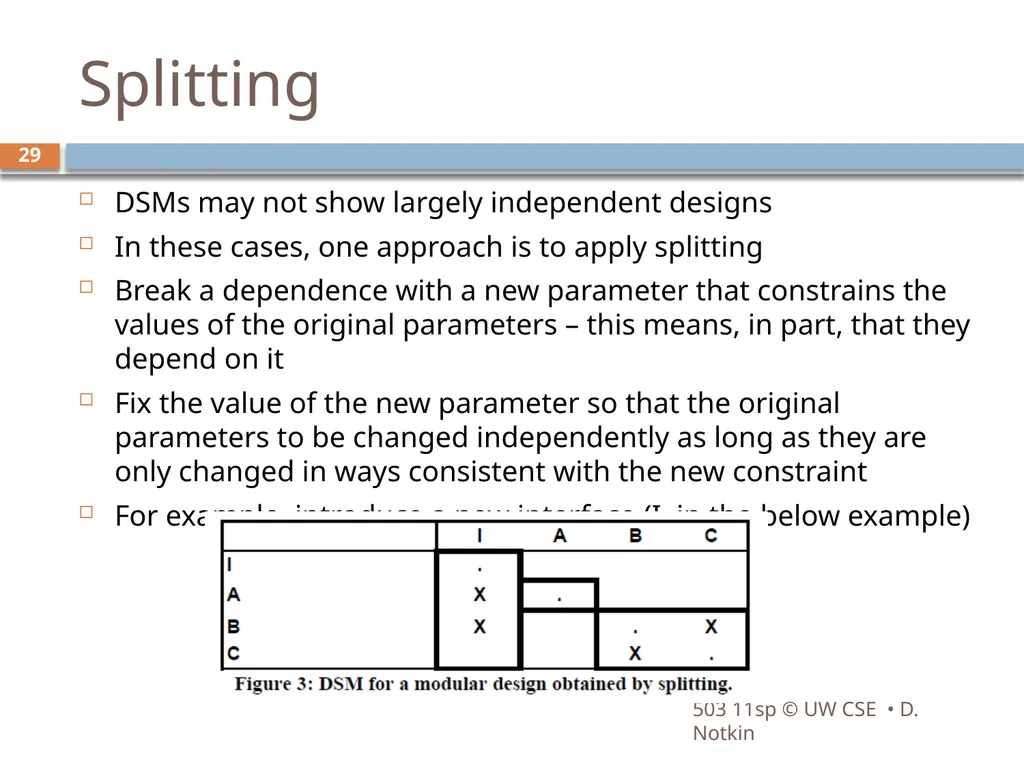
Break a dependence with a new parameter that constrains the values of the original parameters – this means, in part, that they depend on it
Fix the value of the new parameter so that the original parameters to be changed independently as long as they are only changed in ways consistent with the new constraint
For example, introduce a new interface (I, in the below example) 503 11sp © UW CSE • D. Notkin 29<br>
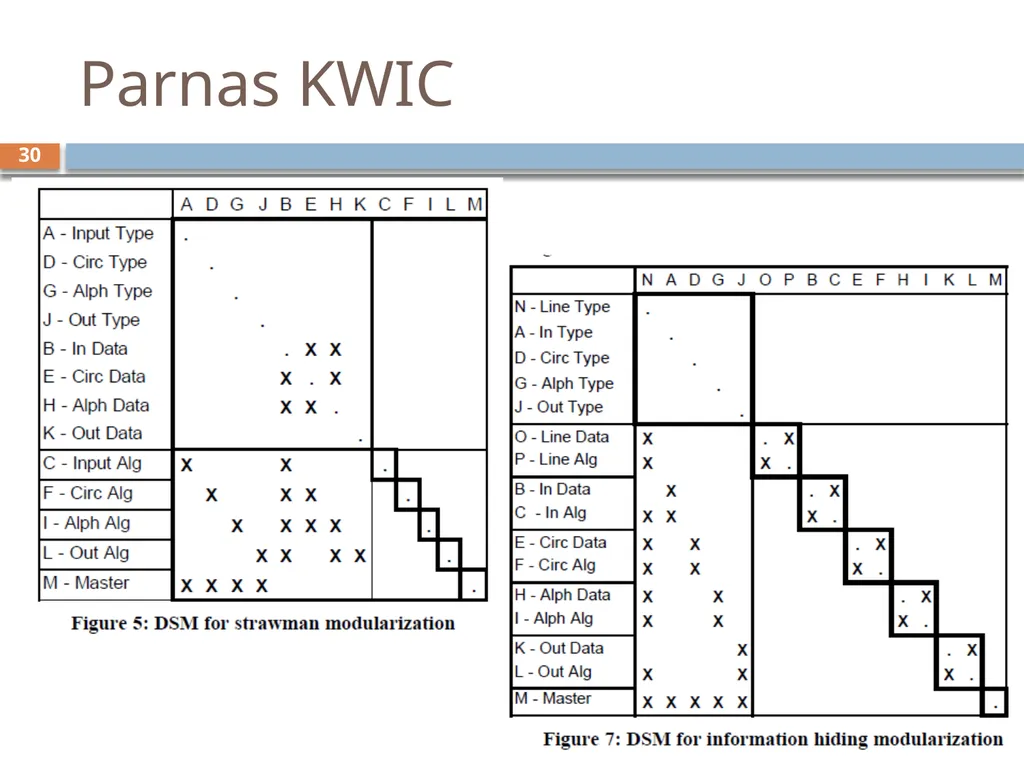
slide30. Parnas KWIC 503 11sp © UW CSE • D. Notkin 30<br>
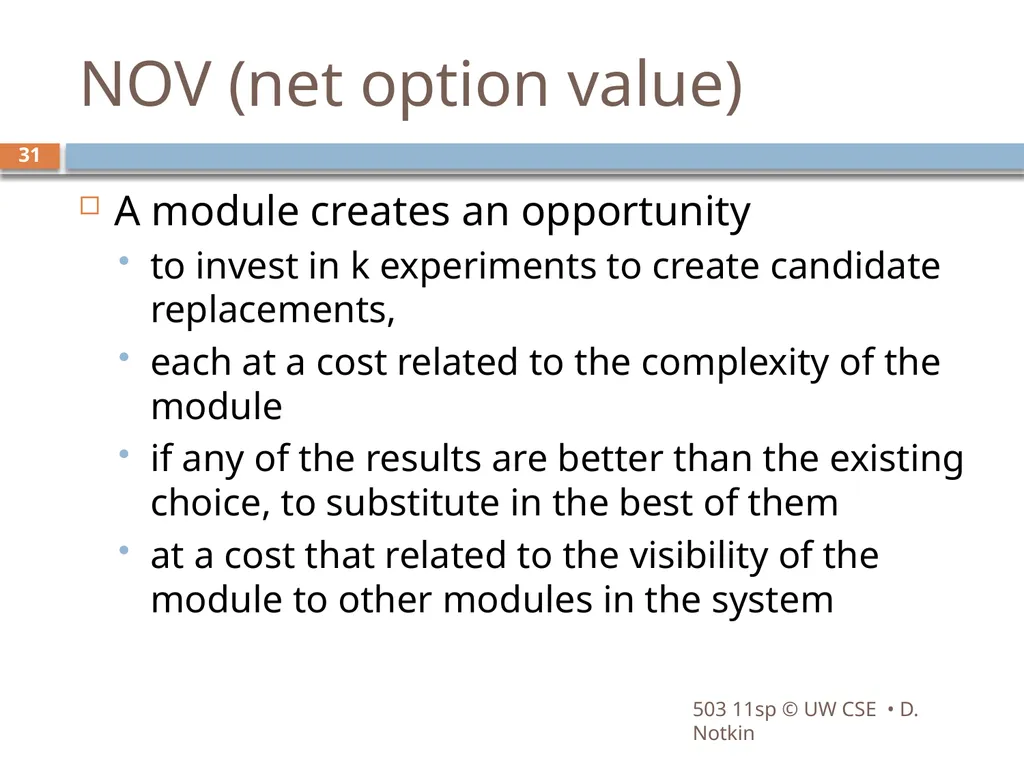
slide31. NOV (net option value) A module creates an opportunity
to invest in k experiments to create candidate replacements,
each at a cost related to the complexity of the module
if any of the results are better than the existing choice, to substitute in the best of them
at a cost that related to the visibility of the module to other modules in the system 503 11sp © UW CSE • D. Notkin 31<br>
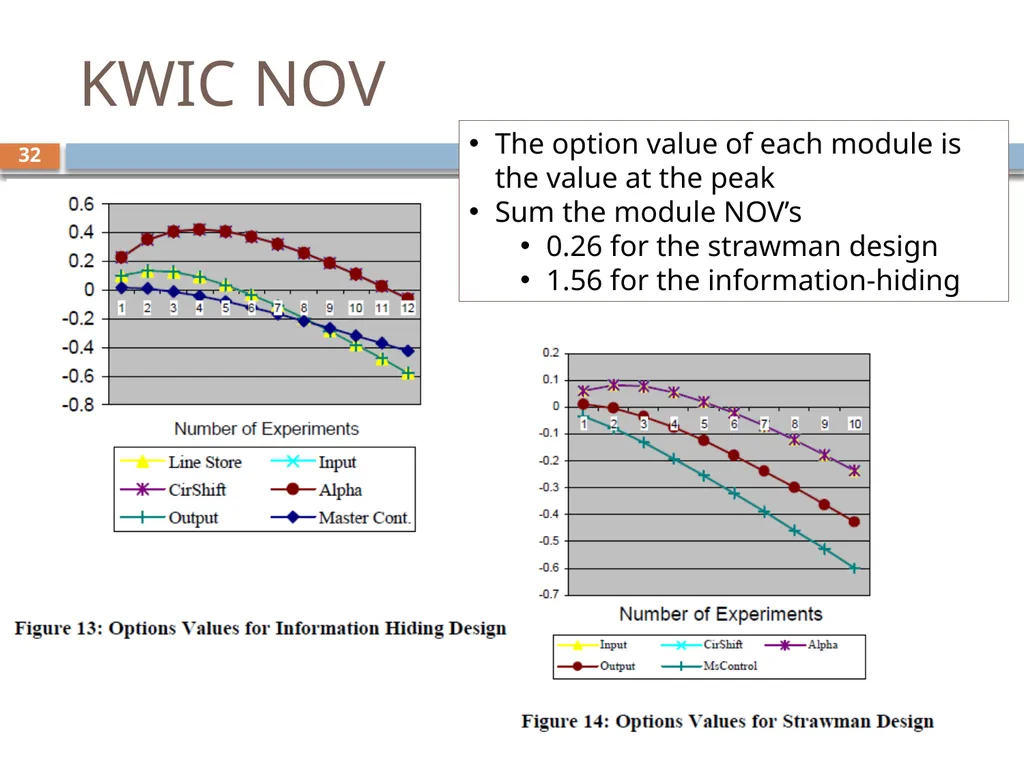
slide32. KWIC NOV 503 11sp © UW CSE • D. Notkin The option value of each module is the value at the peak
Sum the module NOV’s
0.26 for the strawman design
1.56 for the information-hiding 32<br>
slide33. Status The basic idea seems to make sense to many people
One of the core problems is the notion of how to tune the model parameters
Financial markets set parameters based primarily on scads of historic data
COCOMO set parameters based on careful studies of a reasonably large set of reasonably similar software projects
Tuning parameters for modularity seems more complicated 503 11sp © UW CSE • D. Notkin 33<br>
slide34. 503 11sp © UW CSE • D. Notkin Boehm-Sullivan roadmap Boehm-Sullivan roadmap 34<br>
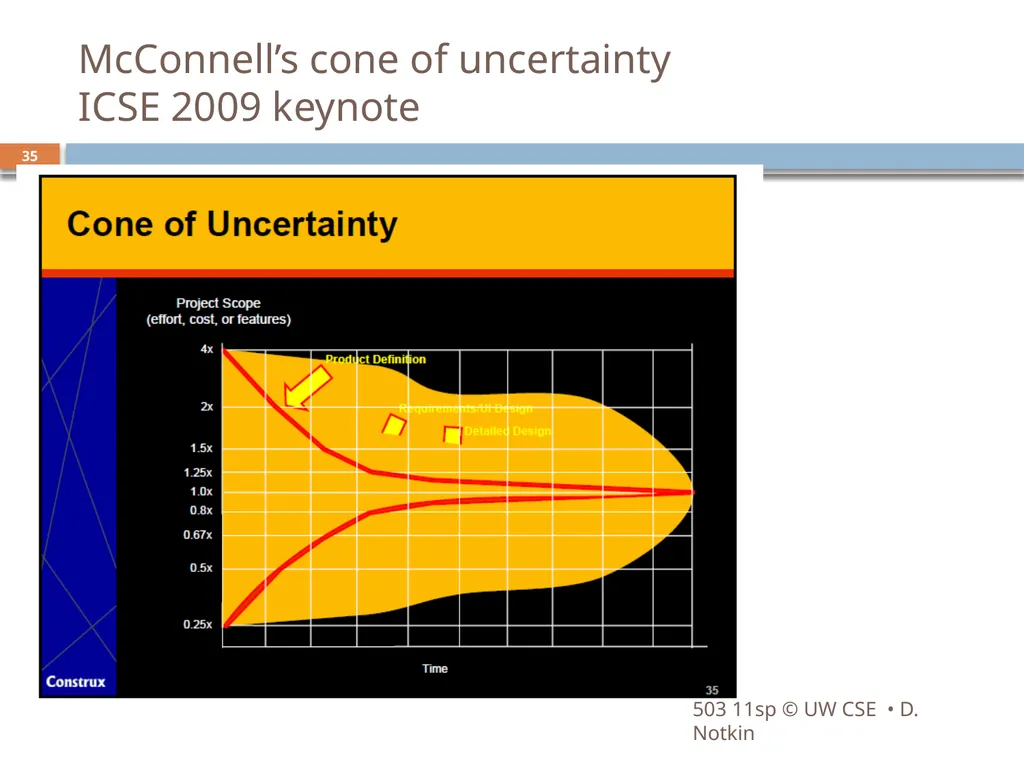
slide35. McConnell’s cone of uncertainty ICSE 2009 keynote 503 11sp © UW CSE • D. Notkin 35<br>
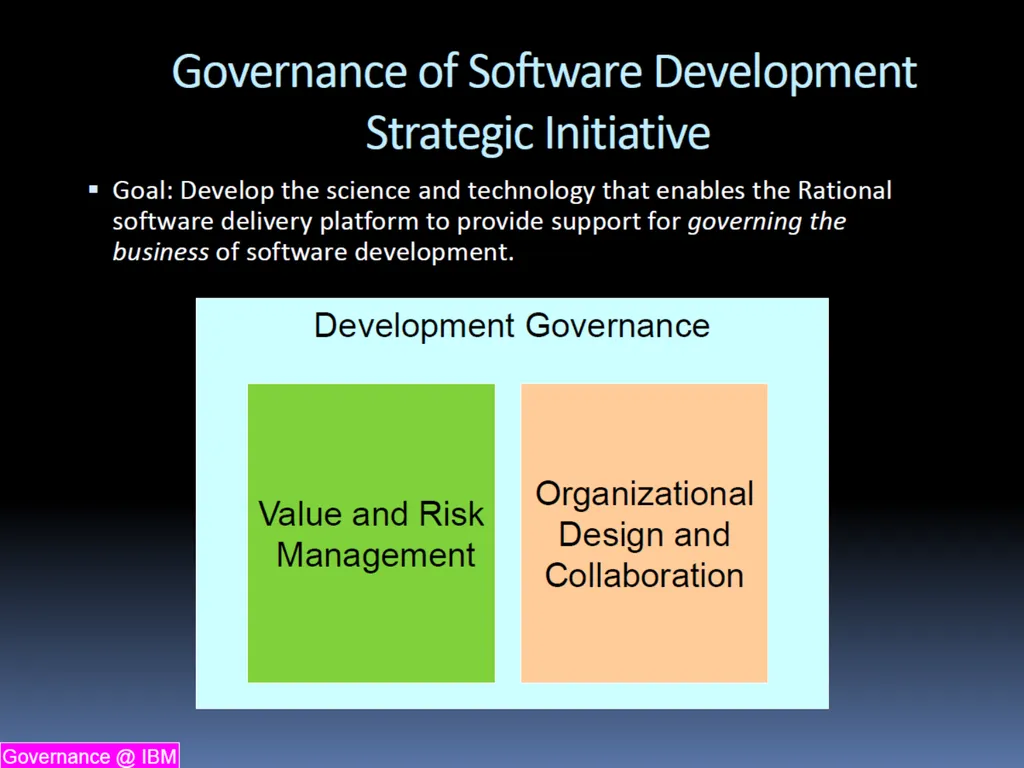
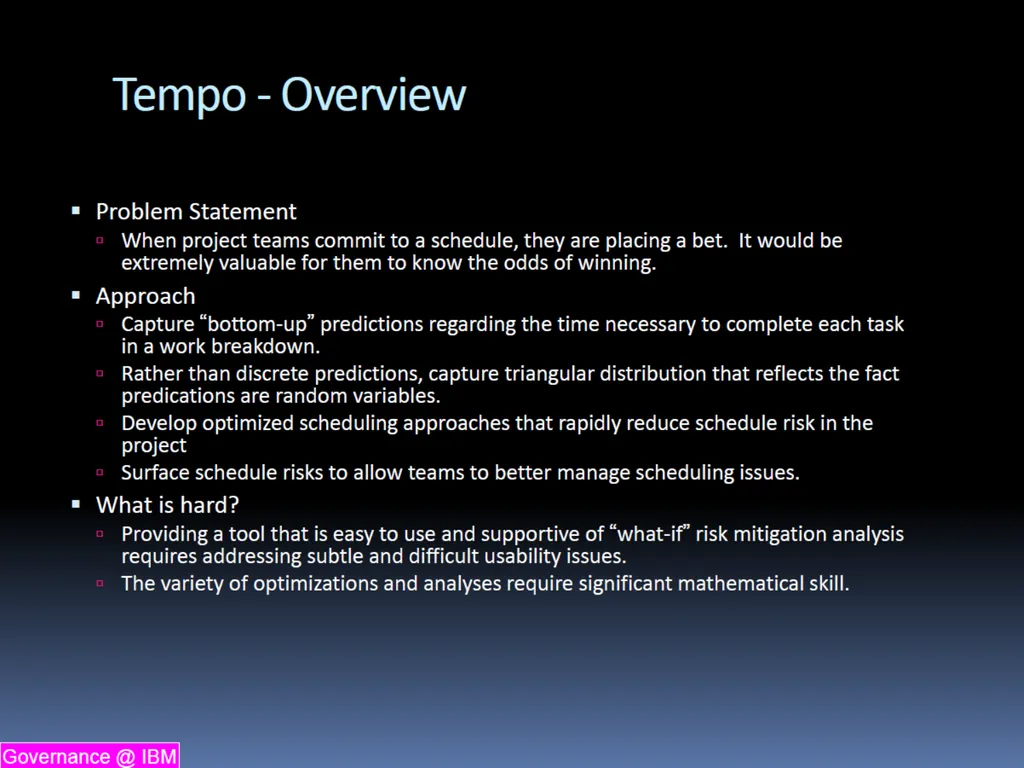
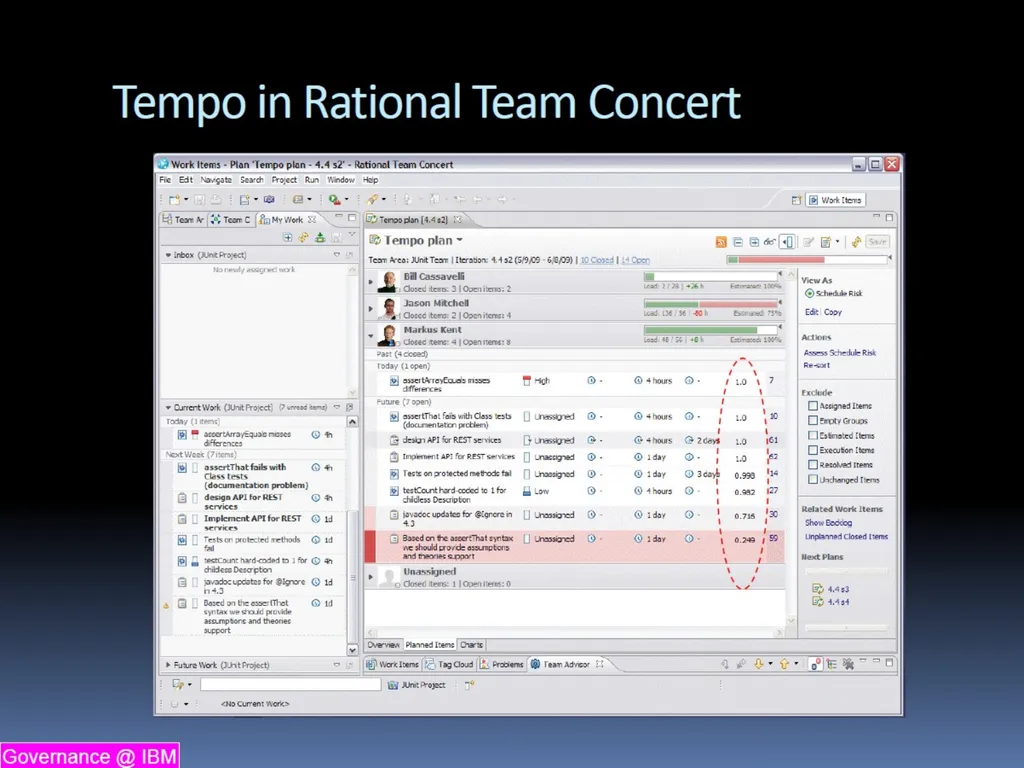
slide36. Governance of Software Development Clay Williams, IBM Research
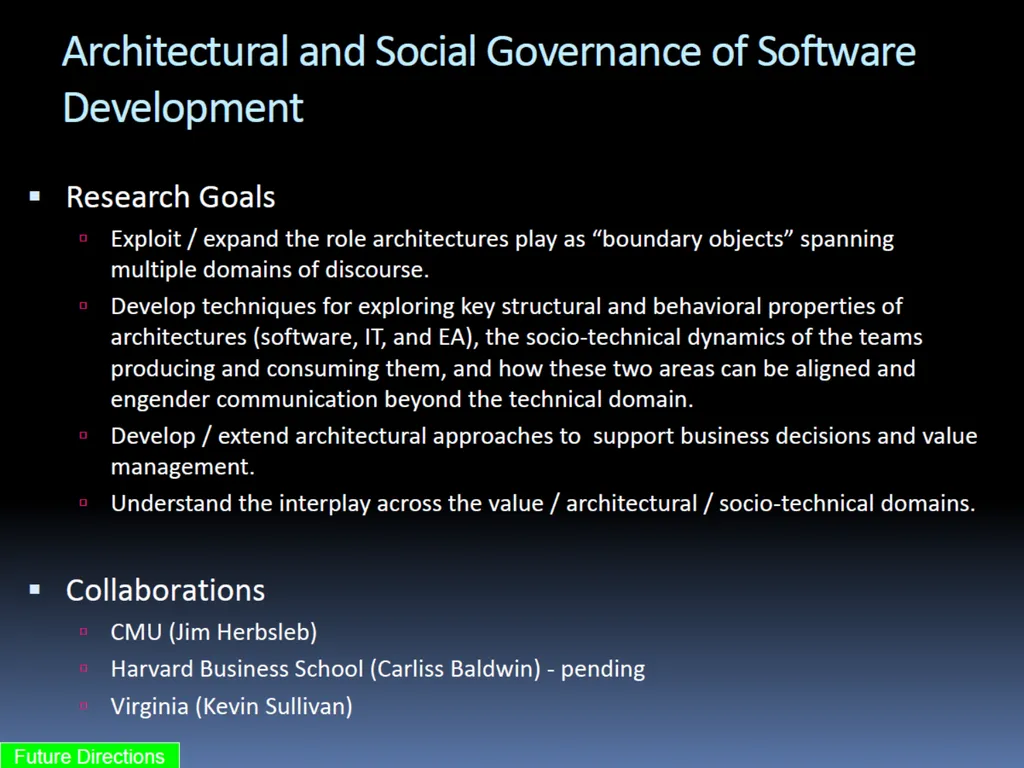
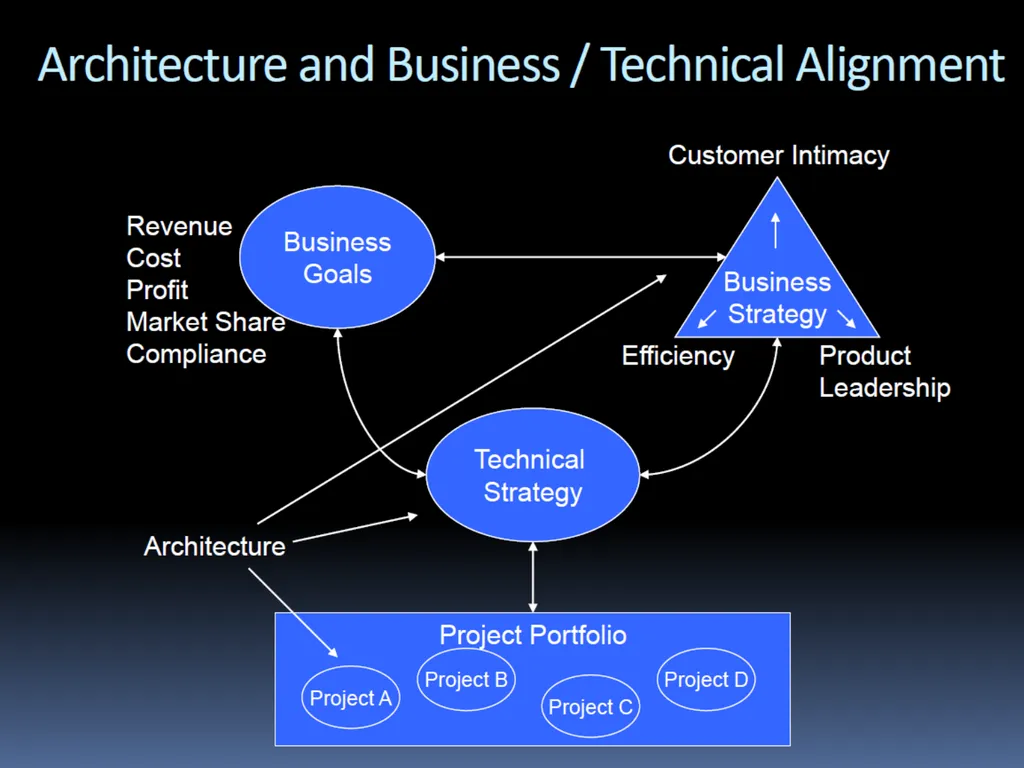
Slides directly taken from an NSF workshop presentation 503 11sp © UW CSE • D. Notkin 36 Governance @ IBM Future Directions<br>
slide37. 503 11sp © UW CSE • D. Notkin 37<br>
slide38. 503 11sp © UW CSE • D. Notkin 38<br>
slide39. 503 11sp © UW CSE • D. Notkin 39<br>
slide40. 503 11sp © UW CSE • D. Notkin 40<br>
slide41. 503 11sp © UW CSE • D. Notkin 41<br>
slide42. My bottom line The long-term goal of software engineering economics is to help everybody make more sensible decisions
Technical decisions
Business decisions
Project management decisions
Not one of these is primary with the others secondary – but that is how we each seem to treat the others
Better understanding the links among them is crucial; the models may give us opportunities to better understand these links
I am always scared that quantification tends to lead to a focus on the quantities, and there is often a disconnect between the quantities we can measure and want we want to do 503 11sp © UW CSE • D. Notkin 42<br>
Spring 2011<br>
slide2. Evaluation of SE research 503 11sp © UW CSE • D. Notkin What convinces you?
Why? 2<br>
slide3. Possible answers include Intuition
Quantitative assessments
Qualitative assessments
Case studies
… other possible answers? 503 11sp © UW CSE • D. Notkin 3<br>
slide4. Brooks on evaluation The first user gives you infinite utility – that is, you learn more from the first person who tries an approach than from every person thereafter
In HCI, Brooks compared
"narrow truths proved convincingly by statistically sound experiments, and
broad 'truths', generally applicable, but supported only by possibly unrepresentative observations.”
Grasping Reality Through Illusion -- Interactive Graphics Serving Science. Proc 1988 ACM SIGCHI 503 11sp © UW CSE • D. Notkin 4<br>
slide5. More on Brooks by Mary Shaw “Brooks proposes to relieve the tension through a certainty-shell structure – to recognize three nested classes of results,
Findings: well-established scientific truths, judged by truthfulness and rigor;
Observations: reports on actual phenomena, judged by interestingness;
Rules of thumb: generalizations, signed by their author but perhaps incompletely supported by data, judged by usefulness.”
What Makes Good Research in Software Engineering? International Journal of Software Tools for Technology Transfer, 2002 503 11sp © UW CSE • D. Notkin 5<br>
slide6. Shaw: research questions in SE 503 11sp © UW CSE • D. Notkin 6<br>
slide7. Shaw: types of SE results 503 11sp © UW CSE • D. Notkin 7<br>
slide8. Shaw Types of validation 503 11sp © UW CSE • D. Notkin 8<br>
slide9. Tichy et al. on quantitative evaluation Experimental evaluation in computer science: A quantitative study. Journal of Systems and Software 1995
Tichy, Lukowicz, Prechelt & Heinz
Abstract: A survey of 400 recent research articles suggests that computer scientists publish relatively few papers with experimentally validated results. The survey includes complete volumes of several refereed computer science journals, a conference, and 50 titles drawn at random from all articles published by ACM in 1993. The journals of Optical Engineering (OE) and Neural Computation (NC) were used for comparison. .. (con’t) 503 11sp © UW CSE • D. Notkin 9<br>
slide10. Con’t Of the papers in the random sample that would require experimental validation, 40% have none at all. In journals related to software engineering, this fraction is 50%. In comparison, the fraction of papers lacking quantitative evaluation in OE and NC is only 15% and 12%, respectively. Conversely, the fraction of papers that devote one fifth or more of their space to experimental validation is almost 70% for OE and NC, while it is a mere 30% for the computer science (CS) random sample and 20% for software engineering. The low ratio of validated results appears to be a serious weakness in computer science research. This weakness should be rectified for the long-term health of the field. The fundamental principle of science, the definition almost, is this: the sole test of the validity of any idea is experiment. —Richard P. Feynman. Beware of bugs in the above code; I have only proved it correct, not tried it. —Donald E. Knuth 503 11sp © UW CSE • D. Notkin 10<br>
slide11. Technology transfer: briefly Not a consumer problem
Not a producer problem
An ecosystem issue 503 11sp © UW CSE • D. Notkin 11<br>
slide12. Evolving the High Performance Computing and Communications Initiative to Support the Nation's Information Infrastructure (1995)
“Brooks-Sutherland” report
Computer Science and Telecommunications Board (CSTB) 503 11sp © UW CSE • D. Notkin 12<br>
slide13. Software engineering economics The phrase dates to around 1981, when Barry Boehm published his tome with the same title
Boehm identified engineering economics as one “scientific principle” in which software engineering fell short of hardware engineering
To the first order, the focus of his book was on how to better estimate effort, cost and schedule for large software projects – COCOMO (COnstructive COst MOdel) 503 11sp © UW CSE • D. Notkin 13<br>
slide14. COCOMO basics Algorithmic software cost estimation modeled with a regression formula that has parameters derived from historical project data and current project characteristics
The basic COCOMO equations take the form
Effort Applied = a(KLOC)b (person-months)
Development Time = c(Effort Applied)d (months)
People required = Effort Applied / Development Time (count) 503 11sp © UW CSE • D. Notkin 14<br>
slide15. Regression parameters Basic COCOMO Based on waterfall-based 63 projects at TRW Aerospace
Projects from 2KLOC to 100KLOC, languages from assembler to PL/I
The Basic Model designed for rough order-of-magnitude estimates, focused on small to medium-sized projects
Three sets of parameters: organic, semi-detached and embedded 503 11sp © UW CSE • D. Notkin 15<br>
slide16. Intermediate COCOMO Uses more parameters (cost drivers) that account for additional differences estimates
Product attributes: required software reliability, complexity of the product, …
Hardware attributes: run-time performance constraints, memory constraints, …
Personnel attributes: software engineering capability, applications experience, programming language experience, …
Project attributes: use of software tools, application of software engineering methods, … 503 11sp © UW CSE • D. Notkin 16<br>
slide17. Intermediate COCOMO The 15 sub-attributes are each rated from “very low” to “extra-high” with six discrete choices
Effort multipliers are empirically derived and the EAF is the product of the multipliers 503 11sp © UW CSE • D. Notkin http://neohumanism.org/i/in/intermediate_cocomo_1.html 17<br>
slide18. Intermediate COCOMO E=a(KLOC)b EAF
And similarly for development time and people counts
There is a separate table for parameters a and b across organic, semi-detached, embedded for Intermediate COCOMO 503 11sp © UW CSE • D. Notkin 18<br>
slide19. Detailed COCOMO & COCOMO II Detailed COCOMO also accounts for the influence of individual project phases
COCOMO II was developed and released in 1997, aimed at (then) modern software projects
Newly tuned parameters
Accounted for move from mainframes to desktops, from batch to interface computation, to code reuse, etc. 503 11sp © UW CSE • D. Notkin 19<br>
slide20. 1981 Boehm book also discusses Multiple-goal decision analysis
Most optimization theory assumes that there is a single objective function to maximize
Models like this one account for multiple goals that must be balanced in a definable manner
Risk analysis
Foundation for his later work in the spiral model
And more… 503 11sp © UW CSE • D. Notkin 20<br>
slide21. Boehm & Sullivan “Software Economics” roadmap (ICSE 2000) “The core competency of software engineers is in making technical software product and process design decisions. Today, however, there is a ‘disconnect’ between the decision criteria that tend to guide software engineers and the value creation criteria of organizations in which software is developed. It is not that technical criteria, such as information hiding architecture, documentation standards, software reuse, and the need for mathematical precision, are wrong. On average, they are enormously better than no sound criteria. 503 11sp © UW CSE • D. Notkin 21<br>
slide22. Con’t “However, software engineers are usually not involved in or often do not understand enterprise-level value creation objectives. The connections between technical parameters and value creation are understood vaguely, if at all. There is rarely any real measurement or analysis of how software engineering investments contribute to value creation. And senior management often does not understand success criteria for software development or how investments at the technical level can contribute fundamentally to value creation. As a result, technical criteria tend to be applied in ways that in general are not connected to, and are thus usually not optimal for, value creation.” 503 11sp © UW CSE • D. Notkin 22<br>
slide23. Thinking about value Decision theory (or utility theory) defines a framework for decisions under uncertainty, depending on the risk characteristics of decision makers
This is closely related to (again) multi-objective decision-making
Classical corporate finance uses net present value (NPV) as an investment decision criterion and computes it by discounted cash flow analysis (DCF) – can’t make a business case without these 503 11sp © UW CSE • D. Notkin 23<br>
slide24. NPV example from Wikipedia A corporation must decide whether to introduce a new product line. The new product will have startup costs, operational costs, and incoming cash flows over six years. This project will have an immediate (t=0) cash outflow of $100,000 (which might include machinery, and employee training costs). Other cash outflows for years 1-6 are expected to be $5,000 per year. Cash inflows are expected to be $30,000 each for years 1-6. All cash flows are after-tax, and there are no cash flows expected after year 6. The required rate of return is 10%. 503 11sp © UW CSE • D. Notkin 24<br>
slide25. Con’t The table shows the present value (PV) for each year
The NPV is the sum of the PVs
In this case, it’s $8,881.52
A positive NPV means it would be better to invest in the project than to do nothing – but there might be other opportunities with higher NPV 503 11sp © UW CSE • D. Notkin 25<br>
slide26. Real options DCF/NPV treats assets as passively held – not actively managed
But projects are (or can be ) actively managed
Management usually has the flexibility to make changes to real investments in light of new information. (e.g., to abandon a project, enter a new market, etc.)
The key idea of real options is to treat such flexibility as an option, and to (in some cases) price them using techniques related to those for financial options 503 11sp © UW CSE • D. Notkin 26<br>
slide27. Baldwin and Clark (2000) Baldwin and Clark view Parnas' information hiding modules as creating options
They value these and develop a theory of how modularity in design influenced the evolution of the industry structure for computers over the last forty years
Non-modular systems must be kept or replaced as a whole
A system of independent modules can be kept or replaced (largely) individually based on judgments of improvement (or not)
Modularity provides a portfolio of options vs. an option on a portfolio 503 11sp © UW CSE • D. Notkin 27<br>
slide28. DSMs: design structure matrices The parameters are A, B, and C
The X in row B, column A means that good choice for B depends on the choice made for A
Parameters requiring mutual consistency are interdependent, resulting in symmetric marks: (B,C) and (C,B)
When one parameter choice must precede another the parameters are said to be hierarchically dependent: (B,A)
Independent parameters can be changed without coordination 503 11sp © UW CSE • D. Notkin Material from Sullivan, Griswold, Cai, Hallen. The structure and value of modularity in software design. ESEC/FSE 2001 28<br>
slide29. Splitting DSMs may not show largely independent designs
In these cases, one approach is to apply splitting
Break a dependence with a new parameter that constrains the values of the original parameters – this means, in part, that they depend on it
Fix the value of the new parameter so that the original parameters to be changed independently as long as they are only changed in ways consistent with the new constraint
For example, introduce a new interface (I, in the below example) 503 11sp © UW CSE • D. Notkin 29<br>
slide30. Parnas KWIC 503 11sp © UW CSE • D. Notkin 30<br>
slide31. NOV (net option value) A module creates an opportunity
to invest in k experiments to create candidate replacements,
each at a cost related to the complexity of the module
if any of the results are better than the existing choice, to substitute in the best of them
at a cost that related to the visibility of the module to other modules in the system 503 11sp © UW CSE • D. Notkin 31<br>
slide32. KWIC NOV 503 11sp © UW CSE • D. Notkin The option value of each module is the value at the peak
Sum the module NOV’s
0.26 for the strawman design
1.56 for the information-hiding 32<br>
slide33. Status The basic idea seems to make sense to many people
One of the core problems is the notion of how to tune the model parameters
Financial markets set parameters based primarily on scads of historic data
COCOMO set parameters based on careful studies of a reasonably large set of reasonably similar software projects
Tuning parameters for modularity seems more complicated 503 11sp © UW CSE • D. Notkin 33<br>
slide34. 503 11sp © UW CSE • D. Notkin Boehm-Sullivan roadmap Boehm-Sullivan roadmap 34<br>
slide35. McConnell’s cone of uncertainty ICSE 2009 keynote 503 11sp © UW CSE • D. Notkin 35<br>
slide36. Governance of Software Development Clay Williams, IBM Research
Slides directly taken from an NSF workshop presentation 503 11sp © UW CSE • D. Notkin 36 Governance @ IBM Future Directions<br>
slide37. 503 11sp © UW CSE • D. Notkin 37<br>
slide38. 503 11sp © UW CSE • D. Notkin 38<br>
slide39. 503 11sp © UW CSE • D. Notkin 39<br>
slide40. 503 11sp © UW CSE • D. Notkin 40<br>
slide41. 503 11sp © UW CSE • D. Notkin 41<br>
slide42. My bottom line The long-term goal of software engineering economics is to help everybody make more sensible decisions
Technical decisions
Business decisions
Project management decisions
Not one of these is primary with the others secondary – but that is how we each seem to treat the others
Better understanding the links among them is crucial; the models may give us opportunities to better understand these links
I am always scared that quantification tends to lead to a focus on the quantities, and there is often a disconnect between the quantities we can measure and want we want to do 503 11sp © UW CSE • D. Notkin 42<br>