
CSL 112 (Apolipoprotein A-I) Infusions and

Description: CSL 112 (Apolipoprotein A-I) Infusions and Cardiovascular Outcomes in Patients With Acute Myocardial Infarction Hyperlipidemial (ApoA-I Event ReducinG in Ischemic Syndromes II (AEGIS-II) Trial) C. Michael Gibson, MD; Danielle Duffy, MD;
Related Topics
Download Presentation
"CSL 112 (Apolipoprotein A-I) Infusions and" is the property of its rightful owner. Permission is granted to download and print the materials on this website for personal, non-commercial use only, and to display it on your personal computer provided you do not modify the materials and that you retain all copyright notices contained in the materials. By downloading content from our website, you accept the terms of this agreement.
Presentation Transcript
slide1. CSL 112 (Apolipoprotein A-I) Infusions and Cardiovascular Outcomes in Patients With Acute Myocardial Infarction & Hyperlipidemial (ApoA-I Event ReducinG in Ischemic Syndromes II (AEGIS-II) Trial) C. Michael Gibson, MD; Danielle Duffy, MD; M. Cecilia Bahit, MD; Gerald Chi, MD; Harvey White, DSC; Serge Korjian, MD; John H. Alexander, MD; A. Michael Lincoff, MD; Mark Heise, PhD.; Bronwyn A. Kingwell; Jose C. Nicolau, MD; Renato D. Lopes, MD; Jan H. Cornel, MD; Basil S. Lewis, MD; Dragos Vinereanu, MD; Shaun G. Goodman, MD; Christoph Bode, MD; Ph. Gabriel Steg, MD; Peter Libby, MD; Frank M. Sacks, MD; Kevin R. Bainey, MD; Paul M. Ridker, MD; Kenneth W. Mahaffey, MD; Philip Aylward, PhD; Stephen J. Nicholls, PhD; Stuart J. Pocock, PhD; Roxana Mehran, MD; Robert A. Harrington; for the AEGIS-II
On Behalf of the AEGIS-II Committees and Investigators<br>
slide2. Disclosures Present Research/Grant Funding
Janssen/Johnson & Johnson
CSL Behring
SCAD Alliance
Baim Institute
Patents and Stocks: None
Equity:
nference, Inc.
Dyad Medical
Absolutys
Fortress Biotech
FlowTherapy Spouse: Employee of Boston Clinical Research Institute, has equity Consultant<br>
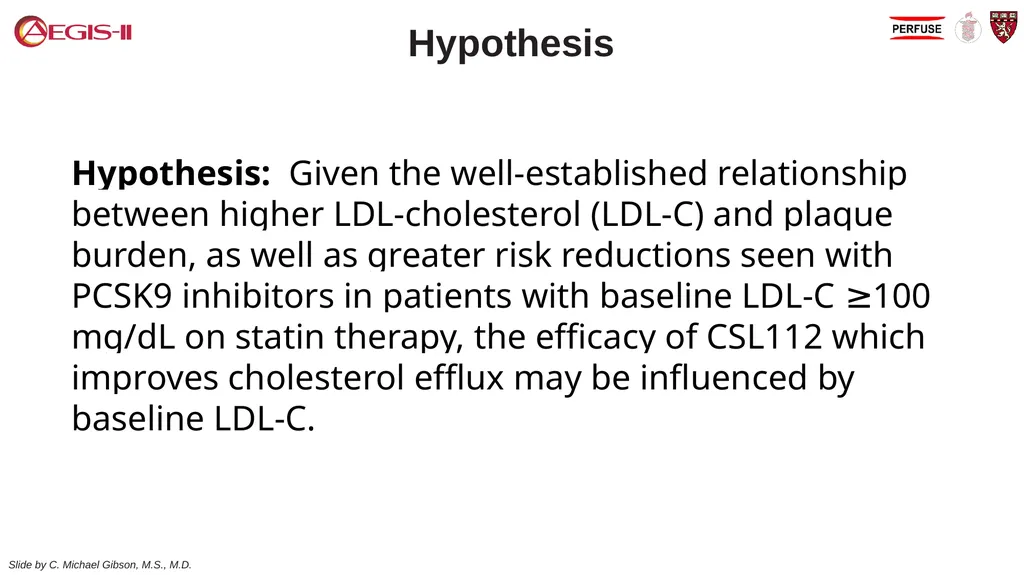
slide3. Hypothesis: Given the well-established relationship between higher LDL-cholesterol (LDL-C) and plaque burden, as well as greater risk reductions seen with PCSK9 inhibitors in patients with baseline LDL-C ≥100 mg/dL on statin therapy, the efficacy of CSL112 which improves cholesterol efflux may be influenced by baseline LDL-C. Hypothesis<br>
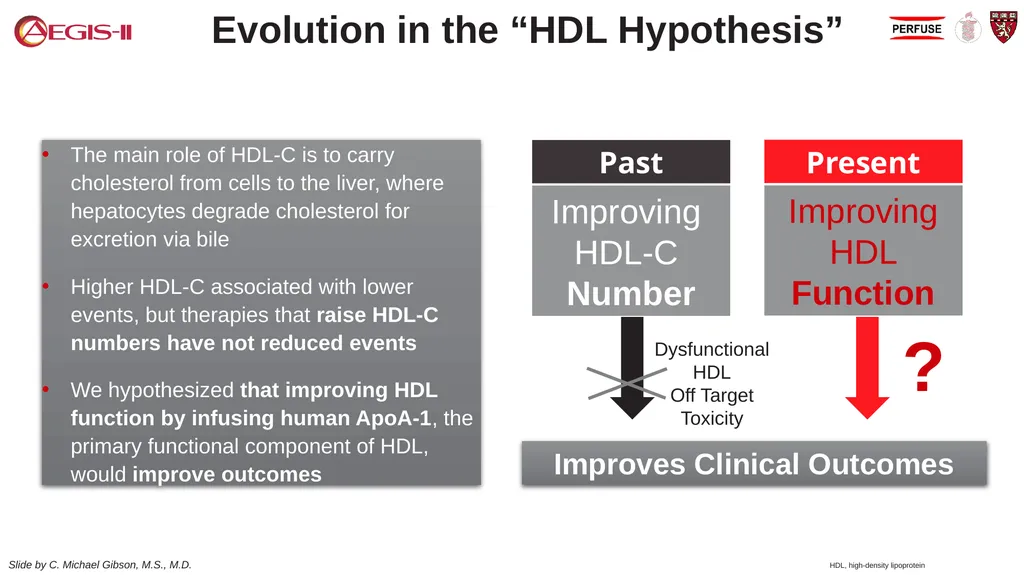
slide4. Improves Clinical Outcomes Evolution in the “HDL Hypothesis” HDL, high-density lipoprotein The main role of HDL-C is to carry cholesterol from cells to the liver, where hepatocytes degrade cholesterol for excretion via bile
Higher HDL-C associated with lower events, but therapies that raise HDL-C numbers have not reduced events
We hypothesized that improving HDL function by infusing human ApoA-1, the primary functional component of HDL, would improve outcomes ? Dysfunctional HDL
Off Target Toxicity<br>
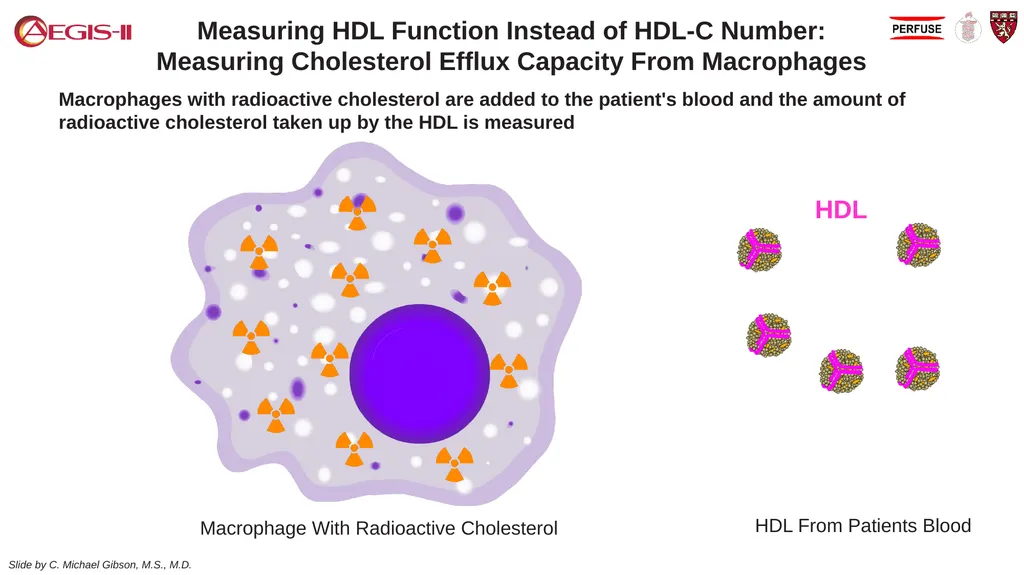
slide5. HDL Measuring HDL Function Instead of HDL-C Number: Measuring Cholesterol Efflux Capacity From Macrophages Macrophages with radioactive cholesterol are added to the patient's blood and the amount of radioactive cholesterol taken up by the HDL is measured Macrophage With Radioactive Cholesterol HDL From Patients Blood<br>
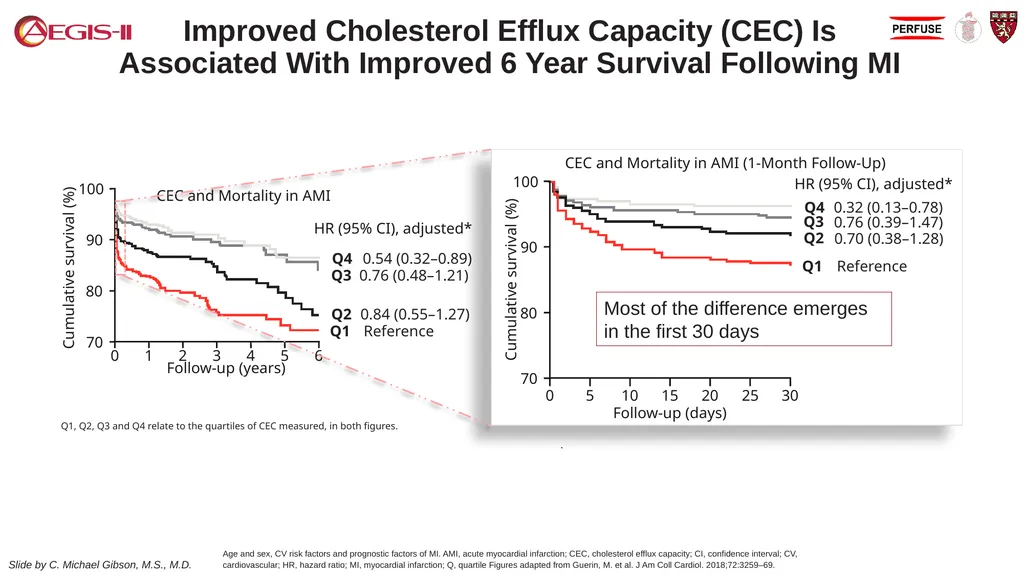
slide6. 6 Age and sex, CV risk factors and prognostic factors of MI. AMI, acute myocardial infarction; CEC, cholesterol efflux capacity; CI, confidence interval; CV, cardiovascular; HR, hazard ratio; MI, myocardial infarction; Q, quartile Figures adapted from Guerin, M. et al. J Am Coll Cardiol. 2018;72:3259–69. . Q1, Q2, Q3 and Q4 relate to the quartiles of CEC measured, in both figures. Improved Cholesterol Efflux Capacity (CEC) Is Associated With Improved 6 Year Survival Following MI Most of the difference emerges in the first 30 days<br>
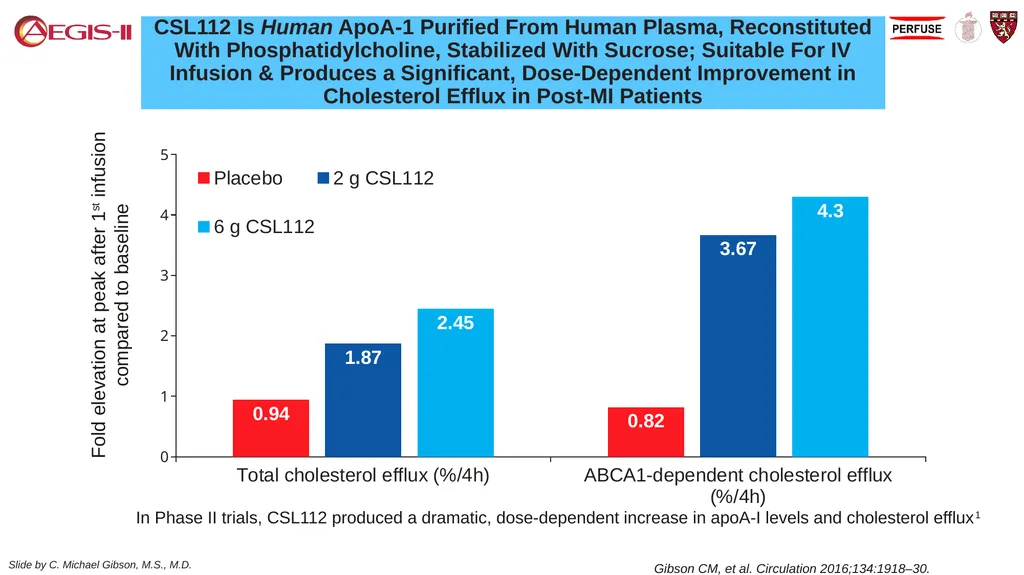
slide7. CSL112 Is Human ApoA-1 Purified From Human Plasma, Reconstituted With Phosphatidylcholine, Stabilized With Sucrose; Suitable For IV Infusion & Produces a Significant, Dose-Dependent Improvement in Cholesterol Efflux in Post-MI Patients Gibson CM, et al. Circulation 2016;134:1918–30. In Phase II trials, CSL112 produced a dramatic, dose-dependent increase in apoA-I levels and cholesterol efflux1 Fold elevation at peak after 1st infusion compared to baseline<br>
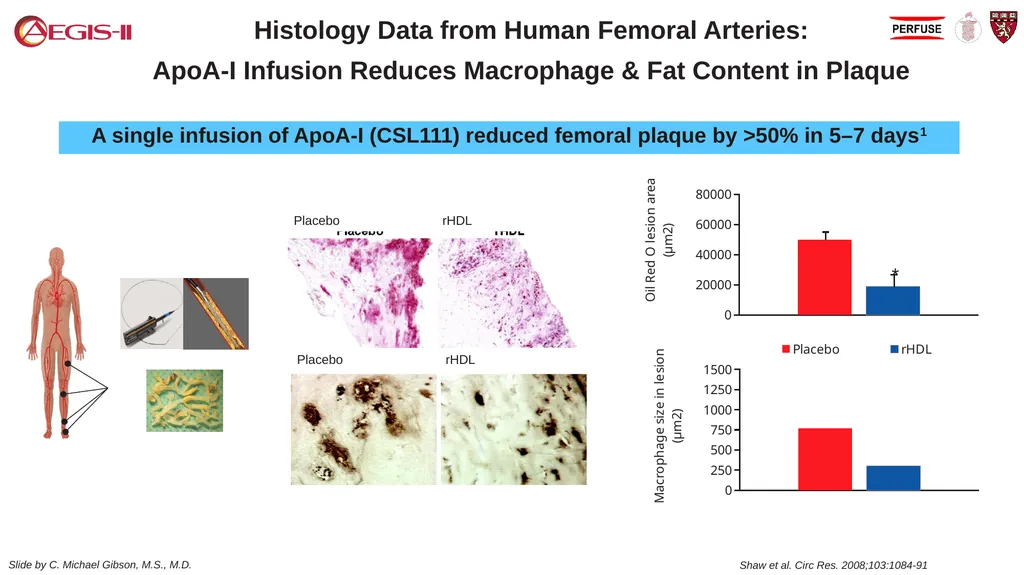
slide8. Histology Data from Human Femoral Arteries:
ApoA-I Infusion Reduces Macrophage & Fat Content in Plaque Shaw et al. Circ Res. 2008;103:1084-91 A single infusion of ApoA-I (CSL111) reduced femoral plaque by >50% in 5–7 days1<br>
slide9. AMI, acute myocardial infarction; MI, myocardial infarction; NSTEMI, non-ST-elevation myocardial infarction; PCI, percutaneous coronary intervention; STEMI, ST-elevation myocardial infarction. Gibson CM, et al. Am Heart J. 2021;231:121–7. 18,219 AMI patients
Stratification by:
STEMI/NSTEMI
PCI/medical management
Region Randomization Infusion:
Visit:
Study day: 1
2
1 2
3
8
(-2/+1) 3
4
15
(-2/+1) 4
5
22
(-2/+1) 6
29
(±2) 7
60
(±10) 8
90
(±10) 10
270
(±10) 9
180 C
(±10) 11
365
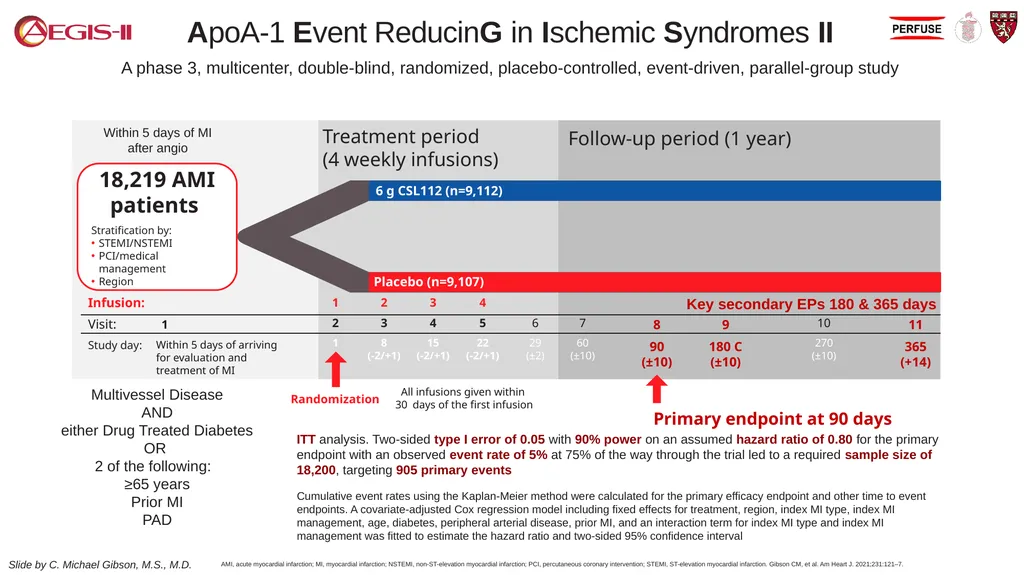
(+14) Treatment period (4 weekly infusions) Follow-up period (1 year) 1 Within 5 days of arriving for evaluation and treatment of MI All infusions given within 30days of the first infusion Primary endpoint at 90 days ApoA-1 Event ReducinG in Ischemic Syndromes II A phase 3, multicenter, double-blind, randomized, placebo-controlled, event-driven, parallel-group study Multivessel Disease
AND
either Drug Treated Diabetes
OR
2 of the following:
≥65 years
Prior MI
PAD Within 5 days of MI after angio ITT analysis. Two-sided type I error of 0.05 with 90% power on an assumed hazard ratio of 0.80 for the primary endpoint with an observed event rate of 5% at 75% of the way through the trial led to a required sample size of 18,200, targeting 905 primary events Cumulative event rates using the Kaplan-Meier method were calculated for the primary efficacy endpoint and other time to event endpoints. A covariate-adjusted Cox regression model including fixed effects for treatment, region, index MI type, index MI management, age, diabetes, peripheral arterial disease, prior MI, and an interaction term for index MI type and index MI management was fitted to estimate the hazard ratio and two-sided 95% confidence interval Placebo (n=9,107) 6 g CSL112 (n=9,112) Key secondary EPs 180 & 365 days<br>
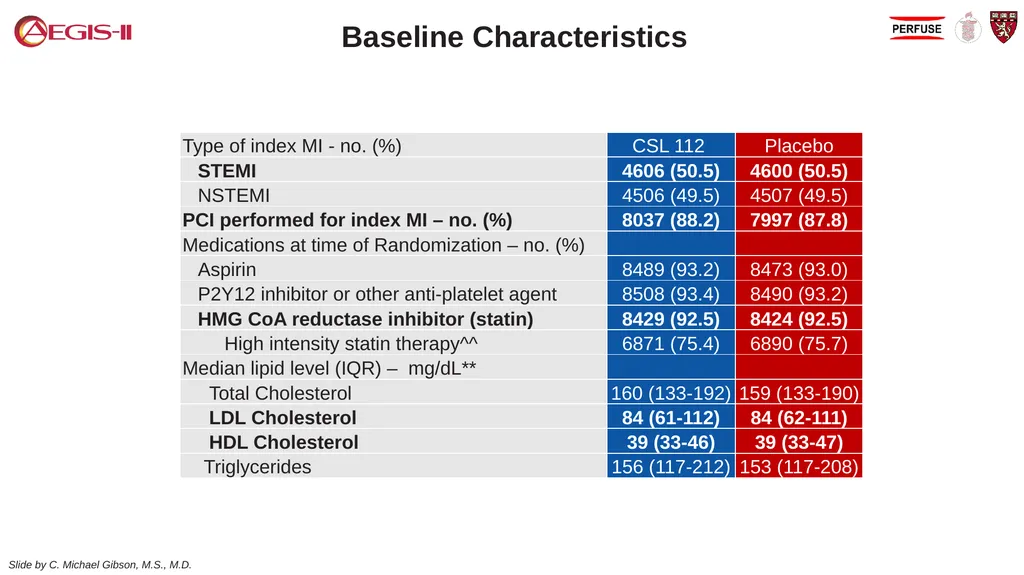
slide10. Baseline Characteristics<br>
slide11. Time to First Occurrence of CV Death, MI or Stroke 7790
7761 9112
9107 8714
8714 8581
8562 8470
8442 8364
8329 8264
8232 8188
8155 8121
8093 Key Secondary
Endpoint
180 days
6.9% vs. 7.6%
HR=0.91
(0.81-1.01)
p=0.077 Primary Endpoint
90 days
4.9% vs. 5.2%
HR=0.93
(0.81-1.05)
p=0.24 Key Secondary
Endpoint
365 days
9.8% vs. 10.5%
HR=0.93
(0.85-1.02)
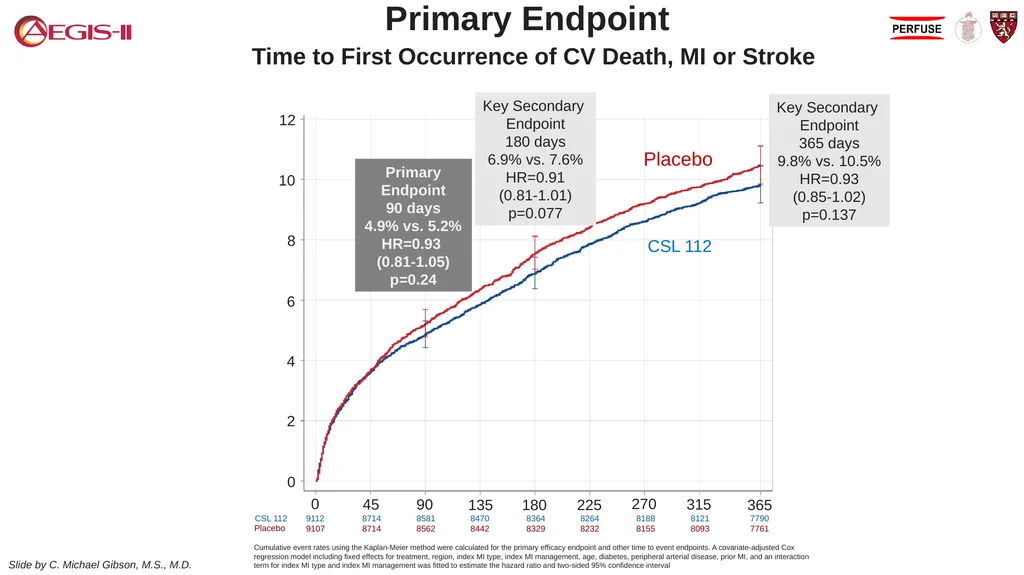
p=0.137 0 45 90 135 180 225 270 315 365 0 2 4 6 8 10 12 Primary Endpoint Cumulative event rates using the Kaplan-Meier method were calculated for the primary efficacy endpoint and other time to event endpoints. A covariate-adjusted Cox regression model including fixed effects for treatment, region, index MI type, index MI management, age, diabetes, peripheral arterial disease, prior MI, and an interaction term for index MI type and index MI management was fitted to estimate the hazard ratio and two-sided 95% confidence interval CSL 112 Placebo CSL 112 Placebo<br>
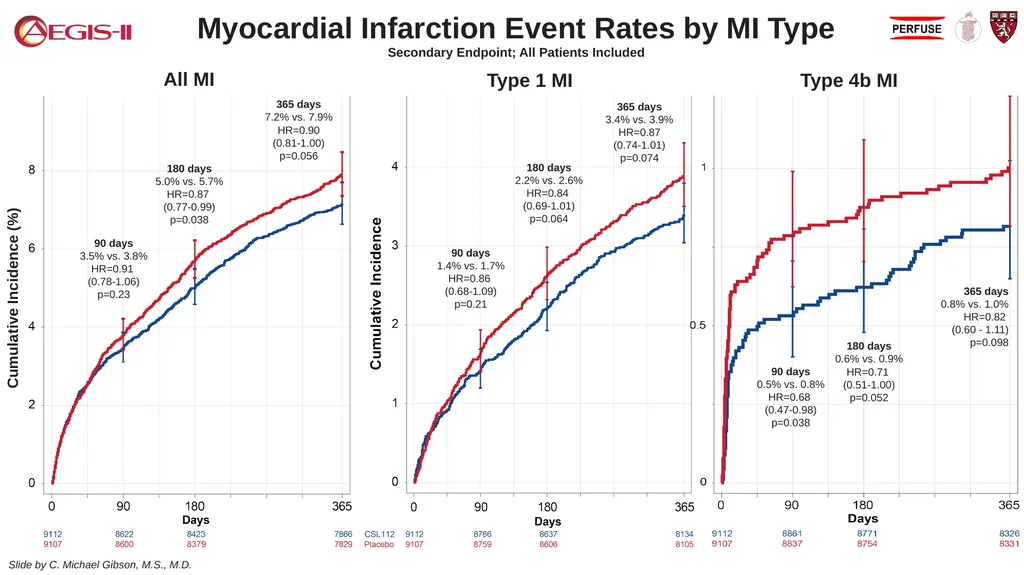
slide12. Cumulative Incidence (%) Type 1 MI Myocardial Infarction Event Rates by MI Type
Secondary Endpoint; All Patients Included 90 days
1.4% vs. 1.7%
HR=0.86
(0.68-1.09)
p=0.21 180 days
2.2% vs. 2.6%
HR=0.84
(0.69-1.01)
p=0.064 365 days
3.4% vs. 3.9%
HR=0.87
(0.74-1.01)
p=0.074<br>
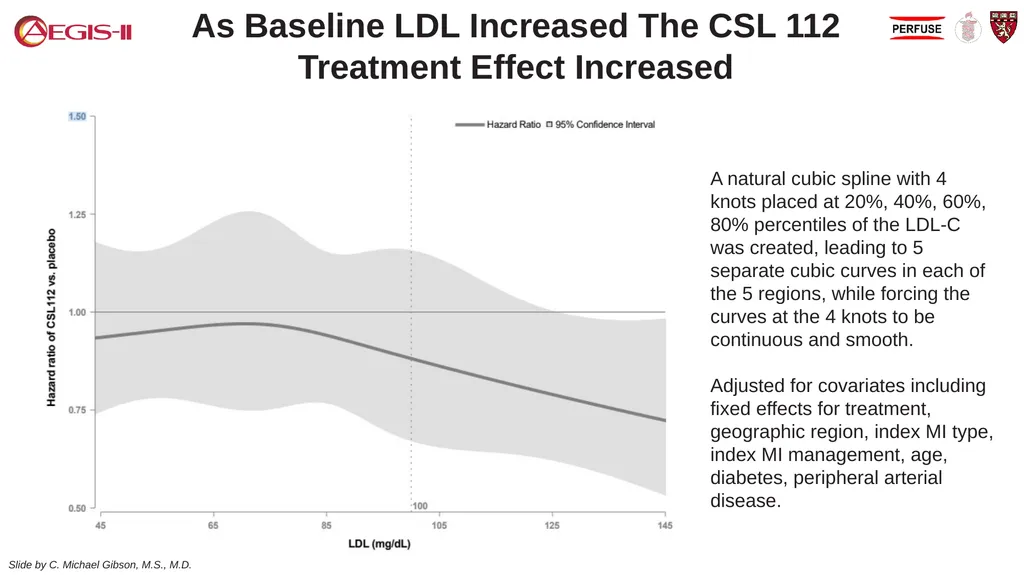
slide13. As Baseline LDL Increased The CSL 112 Treatment Effect Increased A natural cubic spline with 4 knots placed at 20%, 40%, 60%, 80% percentiles of the LDL-C was created, leading to 5 separate cubic curves in each of the 5 regions, while forcing the curves at the 4 knots to be continuous and smooth.
Adjusted for covariates including fixed effects for treatment, geographic region, index MI type, index MI management, age, diabetes, peripheral arterial disease.<br>
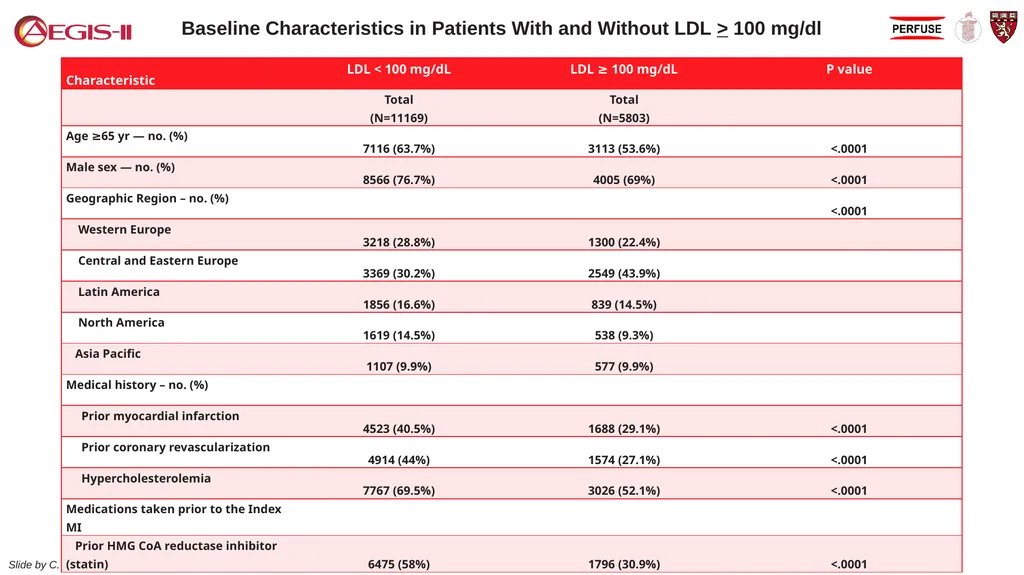
slide14. Baseline Characteristics in Patients With and Without LDL > 100 mg/dl<br>
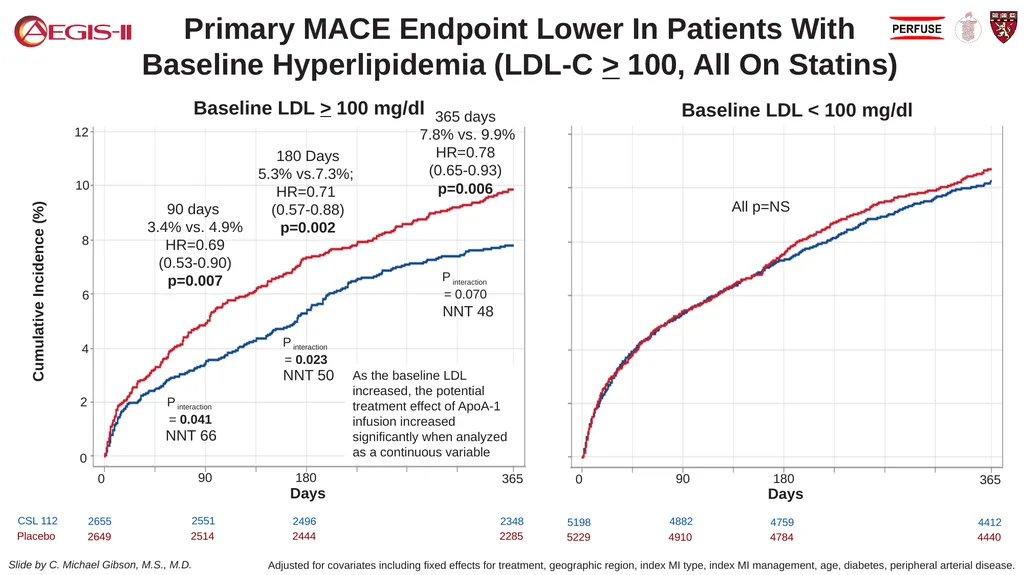
slide15. Primary MACE Endpoint Lower In Patients With Baseline Hyperlipidemia (LDL-C > 100, All On Statins) Baseline LDL > 100 mg/dl Baseline LDL < 100 mg/dl Days 6 90 180 365 0 0 4 2 12 8 10 CSL 112 2655 2551 2496 2348 Placebo 2649 2514 2444 2285 Days 90 180 365 0 5198 4882 4759 4412 5229 4910 4784 4440 180 Days
5.3% vs.7.3%;
HR=0.71
(0.57-0.88)
p=0.002 365 days
7.8% vs. 9.9%
HR=0.78
(0.65-0.93)
p=0.006 90 days
3.4% vs. 4.9%
HR=0.69
(0.53-0.90)
p=0.007 Cumulative Incidence (%) P interaction
= 0.041 P interaction
= 0.023 P interaction
= 0.070 As the baseline LDL increased, the potential treatment effect of ApoA-1 infusion increased significantly when analyzed as a continuous variable All p=NS NNT 66 NNT 50 NNT 48 Adjusted for covariates including fixed effects for treatment, geographic region, index MI type, index MI management, age, diabetes, peripheral arterial disease.<br>
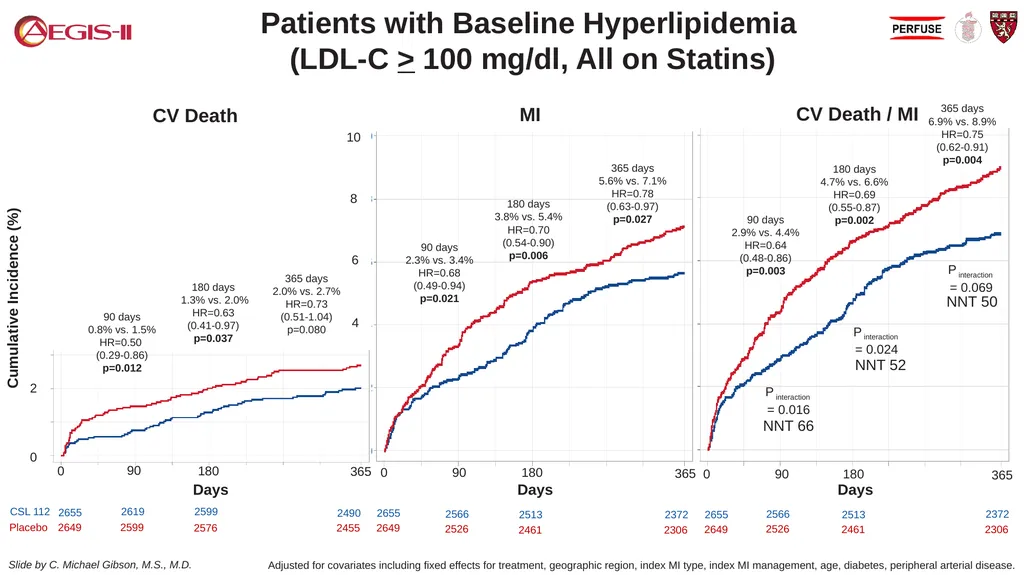
slide16. Patients with Baseline Hyperlipidemia
(LDL-C > 100 mg/dl, All on Statins) Days 90 180 365 0 0 2 CSL 112 2655 2619 2599 2490 Placebo 2649 2599 2576 2455 Days 90 180 365 0 2566 2372 2526 2306 6 4 8 10 90 days
0.8% vs. 1.5%
HR=0.50
(0.29-0.86)
p=0.012 180 days
1.3% vs. 2.0%
HR=0.63
(0.41-0.97)
p=0.037 365 days
2.0% vs. 2.7%
HR=0.73
(0.51-1.04)
p=0.080 CV Death MI CV Death / MI 90 days
2.3% vs. 3.4%
HR=0.68
(0.49-0.94)
p=0.021 180 days
3.8% vs. 5.4%
HR=0.70
(0.54-0.90)
p=0.006 365 days
5.6% vs. 7.1%
HR=0.78
(0.63-0.97)
p=0.027 90 days
2.9% vs. 4.4%
HR=0.64
(0.48-0.86)
p=0.003 180 days
4.7% vs. 6.6%
HR=0.69
(0.55-0.87)
p=0.002 365 days
6.9% vs. 8.9%
HR=0.75
(0.62-0.91)
p=0.004 90 180 365 0 2655 2649 2513 2461 2655 2649 2566 2526 2513 2461 2372 2306 Days Cumulative Incidence (%) P interaction
= 0.016 P interaction
= 0.024 P interaction
= 0.069 NNT 52 NNT 50 NNT 66 Adjusted for covariates including fixed effects for treatment, geographic region, index MI type, index MI management, age, diabetes, peripheral arterial disease.<br>
slide17. As the baseline LDL-C increased, the potential treatment effect of ApoA-1 infusion increased significantly when analyzed as a continuous variable.
There was a positive interaction term such that the treatment effect in those patients with an LDL-C > 100 mg / dl was statistically significant while it was not in those with an LDL < 100 mg/dl.
The benefit on ApoA-1 infusions in hyperlipidemic patients is biologically plausible, but the observation is hypothesis generating and requires prospective validation.
The trends seen for the individual components of CV death and MI are consistent with the a priori proposed biologic effect of plaque stabilization. Conclusions of Exploratory Analysis of Patients with Baseline LDL-C > 100 mg/dl<br>
On Behalf of the AEGIS-II Committees and Investigators<br>
slide2. Disclosures Present Research/Grant Funding
Janssen/Johnson & Johnson
CSL Behring
SCAD Alliance
Baim Institute
Patents and Stocks: None
Equity:
nference, Inc.
Dyad Medical
Absolutys
Fortress Biotech
FlowTherapy Spouse: Employee of Boston Clinical Research Institute, has equity Consultant<br>
slide3. Hypothesis: Given the well-established relationship between higher LDL-cholesterol (LDL-C) and plaque burden, as well as greater risk reductions seen with PCSK9 inhibitors in patients with baseline LDL-C ≥100 mg/dL on statin therapy, the efficacy of CSL112 which improves cholesterol efflux may be influenced by baseline LDL-C. Hypothesis<br>
slide4. Improves Clinical Outcomes Evolution in the “HDL Hypothesis” HDL, high-density lipoprotein The main role of HDL-C is to carry cholesterol from cells to the liver, where hepatocytes degrade cholesterol for excretion via bile
Higher HDL-C associated with lower events, but therapies that raise HDL-C numbers have not reduced events
We hypothesized that improving HDL function by infusing human ApoA-1, the primary functional component of HDL, would improve outcomes ? Dysfunctional HDL
Off Target Toxicity<br>
slide5. HDL Measuring HDL Function Instead of HDL-C Number: Measuring Cholesterol Efflux Capacity From Macrophages Macrophages with radioactive cholesterol are added to the patient's blood and the amount of radioactive cholesterol taken up by the HDL is measured Macrophage With Radioactive Cholesterol HDL From Patients Blood<br>
slide6. 6 Age and sex, CV risk factors and prognostic factors of MI. AMI, acute myocardial infarction; CEC, cholesterol efflux capacity; CI, confidence interval; CV, cardiovascular; HR, hazard ratio; MI, myocardial infarction; Q, quartile Figures adapted from Guerin, M. et al. J Am Coll Cardiol. 2018;72:3259–69. . Q1, Q2, Q3 and Q4 relate to the quartiles of CEC measured, in both figures. Improved Cholesterol Efflux Capacity (CEC) Is Associated With Improved 6 Year Survival Following MI Most of the difference emerges in the first 30 days<br>
slide7. CSL112 Is Human ApoA-1 Purified From Human Plasma, Reconstituted With Phosphatidylcholine, Stabilized With Sucrose; Suitable For IV Infusion & Produces a Significant, Dose-Dependent Improvement in Cholesterol Efflux in Post-MI Patients Gibson CM, et al. Circulation 2016;134:1918–30. In Phase II trials, CSL112 produced a dramatic, dose-dependent increase in apoA-I levels and cholesterol efflux1 Fold elevation at peak after 1st infusion compared to baseline<br>
slide8. Histology Data from Human Femoral Arteries:
ApoA-I Infusion Reduces Macrophage & Fat Content in Plaque Shaw et al. Circ Res. 2008;103:1084-91 A single infusion of ApoA-I (CSL111) reduced femoral plaque by >50% in 5–7 days1<br>
slide9. AMI, acute myocardial infarction; MI, myocardial infarction; NSTEMI, non-ST-elevation myocardial infarction; PCI, percutaneous coronary intervention; STEMI, ST-elevation myocardial infarction. Gibson CM, et al. Am Heart J. 2021;231:121–7. 18,219 AMI patients
Stratification by:
STEMI/NSTEMI
PCI/medical management
Region Randomization Infusion:
Visit:
Study day: 1
2
1 2
3
8
(-2/+1) 3
4
15
(-2/+1) 4
5
22
(-2/+1) 6
29
(±2) 7
60
(±10) 8
90
(±10) 10
270
(±10) 9
180 C
(±10) 11
365
(+14) Treatment period (4 weekly infusions) Follow-up period (1 year) 1 Within 5 days of arriving for evaluation and treatment of MI All infusions given within 30days of the first infusion Primary endpoint at 90 days ApoA-1 Event ReducinG in Ischemic Syndromes II A phase 3, multicenter, double-blind, randomized, placebo-controlled, event-driven, parallel-group study Multivessel Disease
AND
either Drug Treated Diabetes
OR
2 of the following:
≥65 years
Prior MI
PAD Within 5 days of MI after angio ITT analysis. Two-sided type I error of 0.05 with 90% power on an assumed hazard ratio of 0.80 for the primary endpoint with an observed event rate of 5% at 75% of the way through the trial led to a required sample size of 18,200, targeting 905 primary events Cumulative event rates using the Kaplan-Meier method were calculated for the primary efficacy endpoint and other time to event endpoints. A covariate-adjusted Cox regression model including fixed effects for treatment, region, index MI type, index MI management, age, diabetes, peripheral arterial disease, prior MI, and an interaction term for index MI type and index MI management was fitted to estimate the hazard ratio and two-sided 95% confidence interval Placebo (n=9,107) 6 g CSL112 (n=9,112) Key secondary EPs 180 & 365 days<br>
slide10. Baseline Characteristics<br>
slide11. Time to First Occurrence of CV Death, MI or Stroke 7790
7761 9112
9107 8714
8714 8581
8562 8470
8442 8364
8329 8264
8232 8188
8155 8121
8093 Key Secondary
Endpoint
180 days
6.9% vs. 7.6%
HR=0.91
(0.81-1.01)
p=0.077 Primary Endpoint
90 days
4.9% vs. 5.2%
HR=0.93
(0.81-1.05)
p=0.24 Key Secondary
Endpoint
365 days
9.8% vs. 10.5%
HR=0.93
(0.85-1.02)
p=0.137 0 45 90 135 180 225 270 315 365 0 2 4 6 8 10 12 Primary Endpoint Cumulative event rates using the Kaplan-Meier method were calculated for the primary efficacy endpoint and other time to event endpoints. A covariate-adjusted Cox regression model including fixed effects for treatment, region, index MI type, index MI management, age, diabetes, peripheral arterial disease, prior MI, and an interaction term for index MI type and index MI management was fitted to estimate the hazard ratio and two-sided 95% confidence interval CSL 112 Placebo CSL 112 Placebo<br>
slide12. Cumulative Incidence (%) Type 1 MI Myocardial Infarction Event Rates by MI Type
Secondary Endpoint; All Patients Included 90 days
1.4% vs. 1.7%
HR=0.86
(0.68-1.09)
p=0.21 180 days
2.2% vs. 2.6%
HR=0.84
(0.69-1.01)
p=0.064 365 days
3.4% vs. 3.9%
HR=0.87
(0.74-1.01)
p=0.074<br>
slide13. As Baseline LDL Increased The CSL 112 Treatment Effect Increased A natural cubic spline with 4 knots placed at 20%, 40%, 60%, 80% percentiles of the LDL-C was created, leading to 5 separate cubic curves in each of the 5 regions, while forcing the curves at the 4 knots to be continuous and smooth.
Adjusted for covariates including fixed effects for treatment, geographic region, index MI type, index MI management, age, diabetes, peripheral arterial disease.<br>
slide14. Baseline Characteristics in Patients With and Without LDL > 100 mg/dl<br>
slide15. Primary MACE Endpoint Lower In Patients With Baseline Hyperlipidemia (LDL-C > 100, All On Statins) Baseline LDL > 100 mg/dl Baseline LDL < 100 mg/dl Days 6 90 180 365 0 0 4 2 12 8 10 CSL 112 2655 2551 2496 2348 Placebo 2649 2514 2444 2285 Days 90 180 365 0 5198 4882 4759 4412 5229 4910 4784 4440 180 Days
5.3% vs.7.3%;
HR=0.71
(0.57-0.88)
p=0.002 365 days
7.8% vs. 9.9%
HR=0.78
(0.65-0.93)
p=0.006 90 days
3.4% vs. 4.9%
HR=0.69
(0.53-0.90)
p=0.007 Cumulative Incidence (%) P interaction
= 0.041 P interaction
= 0.023 P interaction
= 0.070 As the baseline LDL increased, the potential treatment effect of ApoA-1 infusion increased significantly when analyzed as a continuous variable All p=NS NNT 66 NNT 50 NNT 48 Adjusted for covariates including fixed effects for treatment, geographic region, index MI type, index MI management, age, diabetes, peripheral arterial disease.<br>
slide16. Patients with Baseline Hyperlipidemia
(LDL-C > 100 mg/dl, All on Statins) Days 90 180 365 0 0 2 CSL 112 2655 2619 2599 2490 Placebo 2649 2599 2576 2455 Days 90 180 365 0 2566 2372 2526 2306 6 4 8 10 90 days
0.8% vs. 1.5%
HR=0.50
(0.29-0.86)
p=0.012 180 days
1.3% vs. 2.0%
HR=0.63
(0.41-0.97)
p=0.037 365 days
2.0% vs. 2.7%
HR=0.73
(0.51-1.04)
p=0.080 CV Death MI CV Death / MI 90 days
2.3% vs. 3.4%
HR=0.68
(0.49-0.94)
p=0.021 180 days
3.8% vs. 5.4%
HR=0.70
(0.54-0.90)
p=0.006 365 days
5.6% vs. 7.1%
HR=0.78
(0.63-0.97)
p=0.027 90 days
2.9% vs. 4.4%
HR=0.64
(0.48-0.86)
p=0.003 180 days
4.7% vs. 6.6%
HR=0.69
(0.55-0.87)
p=0.002 365 days
6.9% vs. 8.9%
HR=0.75
(0.62-0.91)
p=0.004 90 180 365 0 2655 2649 2513 2461 2655 2649 2566 2526 2513 2461 2372 2306 Days Cumulative Incidence (%) P interaction
= 0.016 P interaction
= 0.024 P interaction
= 0.069 NNT 52 NNT 50 NNT 66 Adjusted for covariates including fixed effects for treatment, geographic region, index MI type, index MI management, age, diabetes, peripheral arterial disease.<br>
slide17. As the baseline LDL-C increased, the potential treatment effect of ApoA-1 infusion increased significantly when analyzed as a continuous variable.
There was a positive interaction term such that the treatment effect in those patients with an LDL-C > 100 mg / dl was statistically significant while it was not in those with an LDL < 100 mg/dl.
The benefit on ApoA-1 infusions in hyperlipidemic patients is biologically plausible, but the observation is hypothesis generating and requires prospective validation.
The trends seen for the individual components of CV death and MI are consistent with the a priori proposed biologic effect of plaque stabilization. Conclusions of Exploratory Analysis of Patients with Baseline LDL-C > 100 mg/dl<br>