
Data Mining Prof V B More Data Mining Data Mining
Description: Data Mining Prof V B More Data Mining Data Mining Data Mining is defined as finding hidden information in a database. Data Mining involves many different algorithms to accomplish different tasks. The algorithm examine the data and determine
Related Topics
Download Presentation
"Data Mining Prof V B More Data Mining Data Mining" is the property of its rightful owner. Permission is granted to download and print the materials on this website for personal, non-commercial use only, and to display it on your personal computer provided you do not modify the materials and that you retain all copyright notices contained in the materials. By downloading content from our website, you accept the terms of this agreement.
Presentation Transcript
slide1. Data Mining Prof V B More<br>
slide2. Data Mining Data Mining
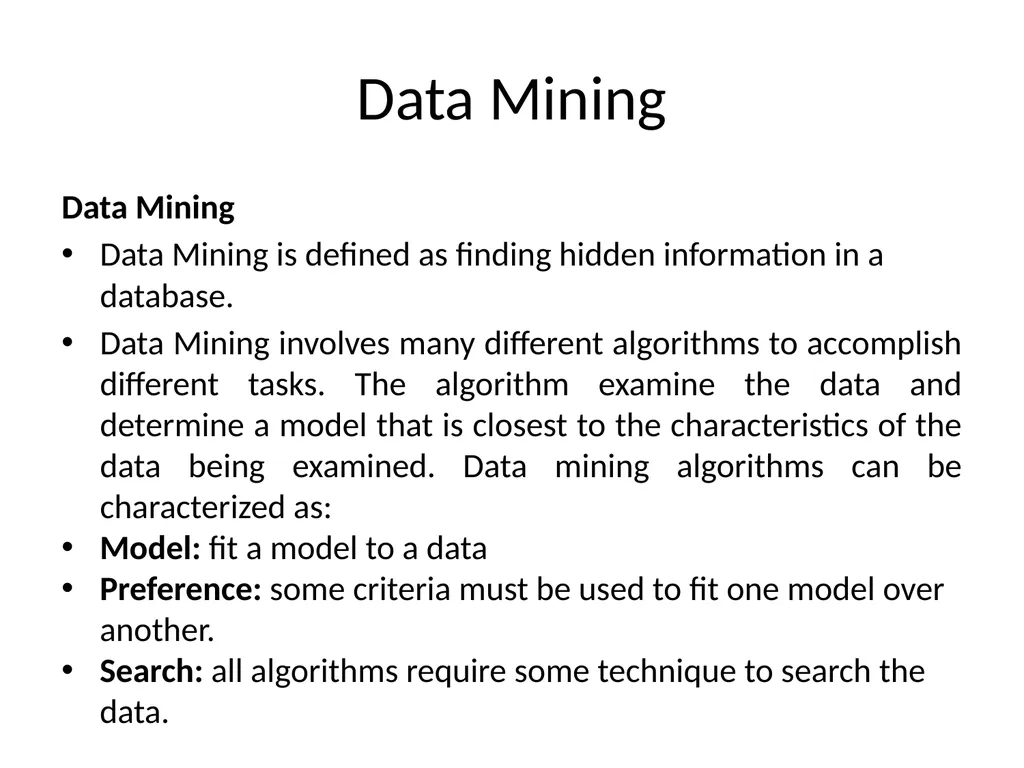
Data Mining is defined as finding hidden information in a database.
Data Mining involves many different algorithms to accomplish different tasks. The algorithm examine the data and determine a model that is closest to the characteristics of the data being examined. Data mining algorithms can be characterized as:
Model: fit a model to a data
Preference: some criteria must be used to fit one model over another.
Search: all algorithms require some technique to search the data.<br>
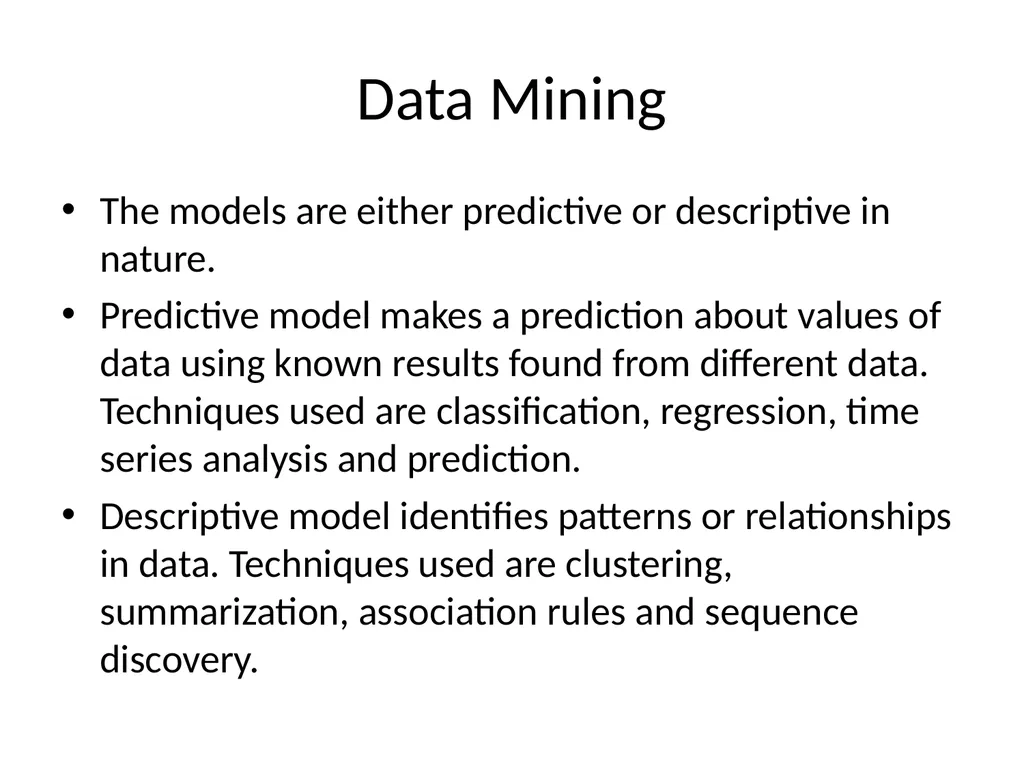
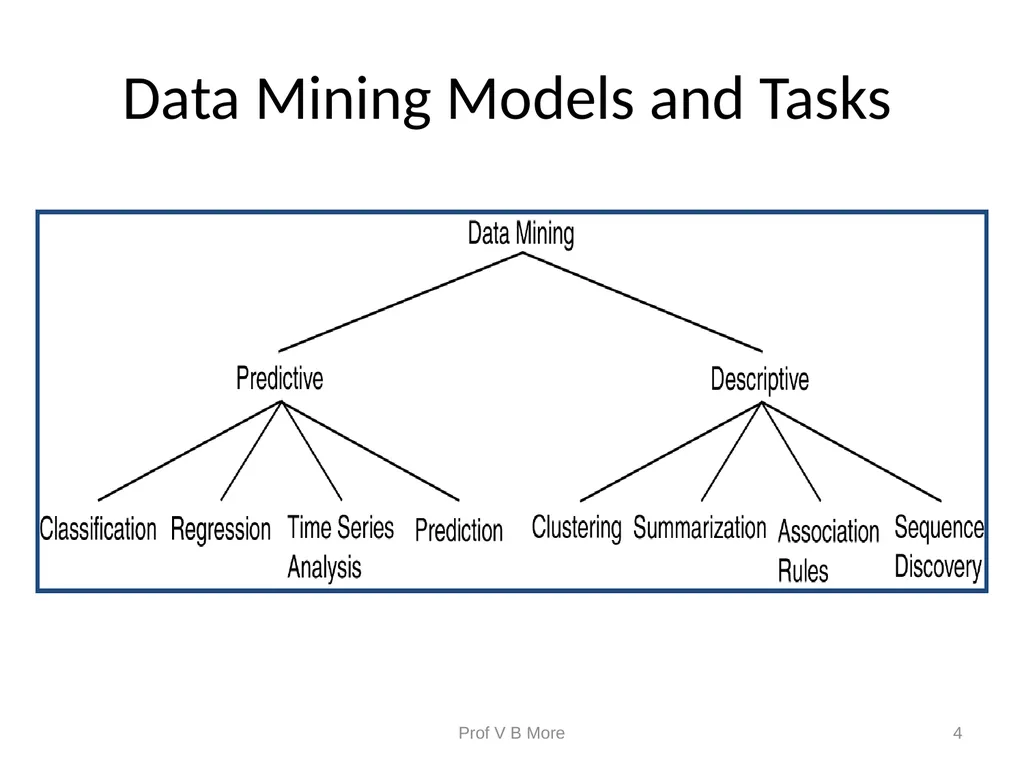
slide3. Data Mining The models are either predictive or descriptive in nature.
Predictive model makes a prediction about values of data using known results found from different data. Techniques used are classification, regression, time series analysis and prediction.
Descriptive model identifies patterns or relationships in data. Techniques used are clustering, summarization, association rules and sequence discovery.<br>
slide4. Prof V B More 4 Data Mining Models and Tasks<br>
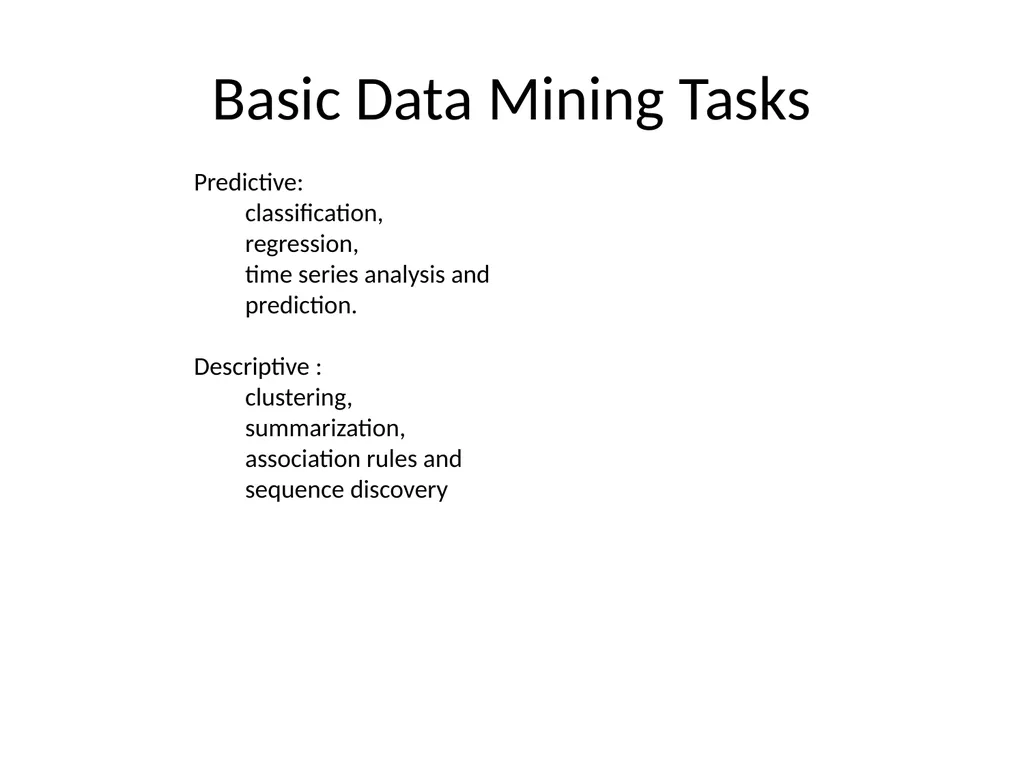
slide5. Basic Data Mining Tasks Predictive:
classification,
regression,
time series analysis and
prediction.
Descriptive :
clustering,
summarization,
association rules and
sequence discovery<br>
slide6. Classification Classification maps data into predefined groups or classes. It is often referred to as supervised learning because the classes are determined before examining the data. Example of classification applications are determining whether to make a bank loan and identifying credit risks. Classification algorithms require that the classes be defined based on data attribute values. They often describe these classes by looking at the characteristics of data already known to belong to the classes. Pattern recognition is a type of classification where an input pattern is classified into one of several classes based on its similarity to these predefined classes.<br>
slide7. Example 1
Credit card companies must determine whether to authorie credit card purchases. Suppose that based on past historical information about purchases, each purchase is placed into one of four classes:
Authorize
Ask for further identification before authorization
Do not authorize
Do not authorize but contact police.
The data mining functions here are twofold. First the historical data must be examined to determine how the data fit into the four classes. Then the problem is to apply this model to each new purchase. Although the second part indeed may be stated as a simple database query, the first part cannot be associated with known offenders<br>
slide8. Example 2
An airport security screening station is used to determine if passengers are potential terrorists or criminals. To do this the face of each passenger is scanned and its basic pattern (distance between eyes, size and shape of mouth, shape of head, etc.) is identified. This pattern is compared to entries in database to see if it matches any patterns that are<br>
slide9. Regression Regression is used to map a data item to a real valued prediction variable. In actuality, regression involves the learning of the function that does this mapping. Regression assumes that the target data fir into some known type of function (e.g. linear, logistic, etc) and then determines the best function of this type that models the given data. Some type of error analysis is used to determine which function is “best.”
Example 3
An employee wishes to reach a certain level of savings before his retirement. Periodically, he predicts what his retirement savings will be based on its current value and several past values. He uses a simple linear regression formula to predict this value by fitting past behaviour to a linear function and then using this function to predict the values at points in the future. Based on these values, he alters his investment portfolio.<br>
slide10. Time Series Analysis The value of an attribute is examined as it varies over time. The values usually are obtained as evenly spaced time points (daily, weekly, hourly, etc.). A time series plot (graph) is used to visualize the time series.
Example 4
Mr Raghavan is trying to determine whether to purchase stock from companies X, Y, or Z. For a period of one month he prepare daily stock value chart for these companies. Using this, and similar information available from his stockbroker, Mr Raghavan decides to purchase stock X because it is less volatile while overall showing a slightly larger relative amount of growth than either of the other stocks.<br>
slide11. Prediction Identify future data states based on past and current data. Prediction can be viewed as a type of classification. Prediction predicts future state rather than current state. Applications are flooding, speech recognition, machine learning, pattern recognition.
Example 5
Prediction flooding is a difficult task. Monitors are placed in various places in a river. These monitors collect data relevant to flood prediction: water level, rain amount, time, humidity, etc. Then water level as potential flooding point in the river collects data by the sensors upriver from this point. Prediction is calculated with respect to the time on which the data is collected.<br>
slide12. Clustering Clustering is similar to classification except that the groups are not predefined, bur rather defined by the data alone.
Clustering is alternatively referred to as unsupervised learning. It can be thought of as partitioning the data into groups that might or might not be disjointed. Clustering is determined using similarity among the data on predefined attributes. Most similar data is grouped into clusters.<br>
slide13. Summarization Summarization maps data into subsets with associated simple descriptions. Summarization is also called as characterization or generalization. It extracts or derives representative information about the database. Summary information like mean of some numeric attribute can be derived from the data. Finding out average of score to determine intellectual level of students.<br>
slide14. Association Finding out relationship among data is also called as link analysis or affinity analysis. An association rule is a model that identifies specific types of data associations. These associations are often used in the retail sales community to identify items that are frequently purchased together. E.g. Market Basket analysis.<br>
slide15. Sequence Discovery Sequential analysis or sequence discovery is used to determine sequential patterns in data. These patterns are based on a time sequence of actions. These patterns are similar to associations in that data (or events) are formed to be related. The association is based on time (Temporal association rule).
E.g. The webmaster of XYZ Corp. Periodically analyzes the web log data to determine how users of the XYZ’s web pages access them. He is interested in determining what sequences of pages are frequently accessed. He determines that 70 percent of the users of page A follow one of the following patterns of behaviour: (A, B, C) or (A, D, B, C) or (A, E, B, C). He then add a link directly from page A to C.<br>
slide2. Data Mining Data Mining
Data Mining is defined as finding hidden information in a database.
Data Mining involves many different algorithms to accomplish different tasks. The algorithm examine the data and determine a model that is closest to the characteristics of the data being examined. Data mining algorithms can be characterized as:
Model: fit a model to a data
Preference: some criteria must be used to fit one model over another.
Search: all algorithms require some technique to search the data.<br>
slide3. Data Mining The models are either predictive or descriptive in nature.
Predictive model makes a prediction about values of data using known results found from different data. Techniques used are classification, regression, time series analysis and prediction.
Descriptive model identifies patterns or relationships in data. Techniques used are clustering, summarization, association rules and sequence discovery.<br>
slide4. Prof V B More 4 Data Mining Models and Tasks<br>
slide5. Basic Data Mining Tasks Predictive:
classification,
regression,
time series analysis and
prediction.
Descriptive :
clustering,
summarization,
association rules and
sequence discovery<br>
slide6. Classification Classification maps data into predefined groups or classes. It is often referred to as supervised learning because the classes are determined before examining the data. Example of classification applications are determining whether to make a bank loan and identifying credit risks. Classification algorithms require that the classes be defined based on data attribute values. They often describe these classes by looking at the characteristics of data already known to belong to the classes. Pattern recognition is a type of classification where an input pattern is classified into one of several classes based on its similarity to these predefined classes.<br>
slide7. Example 1
Credit card companies must determine whether to authorie credit card purchases. Suppose that based on past historical information about purchases, each purchase is placed into one of four classes:
Authorize
Ask for further identification before authorization
Do not authorize
Do not authorize but contact police.
The data mining functions here are twofold. First the historical data must be examined to determine how the data fit into the four classes. Then the problem is to apply this model to each new purchase. Although the second part indeed may be stated as a simple database query, the first part cannot be associated with known offenders<br>
slide8. Example 2
An airport security screening station is used to determine if passengers are potential terrorists or criminals. To do this the face of each passenger is scanned and its basic pattern (distance between eyes, size and shape of mouth, shape of head, etc.) is identified. This pattern is compared to entries in database to see if it matches any patterns that are<br>
slide9. Regression Regression is used to map a data item to a real valued prediction variable. In actuality, regression involves the learning of the function that does this mapping. Regression assumes that the target data fir into some known type of function (e.g. linear, logistic, etc) and then determines the best function of this type that models the given data. Some type of error analysis is used to determine which function is “best.”
Example 3
An employee wishes to reach a certain level of savings before his retirement. Periodically, he predicts what his retirement savings will be based on its current value and several past values. He uses a simple linear regression formula to predict this value by fitting past behaviour to a linear function and then using this function to predict the values at points in the future. Based on these values, he alters his investment portfolio.<br>
slide10. Time Series Analysis The value of an attribute is examined as it varies over time. The values usually are obtained as evenly spaced time points (daily, weekly, hourly, etc.). A time series plot (graph) is used to visualize the time series.
Example 4
Mr Raghavan is trying to determine whether to purchase stock from companies X, Y, or Z. For a period of one month he prepare daily stock value chart for these companies. Using this, and similar information available from his stockbroker, Mr Raghavan decides to purchase stock X because it is less volatile while overall showing a slightly larger relative amount of growth than either of the other stocks.<br>
slide11. Prediction Identify future data states based on past and current data. Prediction can be viewed as a type of classification. Prediction predicts future state rather than current state. Applications are flooding, speech recognition, machine learning, pattern recognition.
Example 5
Prediction flooding is a difficult task. Monitors are placed in various places in a river. These monitors collect data relevant to flood prediction: water level, rain amount, time, humidity, etc. Then water level as potential flooding point in the river collects data by the sensors upriver from this point. Prediction is calculated with respect to the time on which the data is collected.<br>
slide12. Clustering Clustering is similar to classification except that the groups are not predefined, bur rather defined by the data alone.
Clustering is alternatively referred to as unsupervised learning. It can be thought of as partitioning the data into groups that might or might not be disjointed. Clustering is determined using similarity among the data on predefined attributes. Most similar data is grouped into clusters.<br>
slide13. Summarization Summarization maps data into subsets with associated simple descriptions. Summarization is also called as characterization or generalization. It extracts or derives representative information about the database. Summary information like mean of some numeric attribute can be derived from the data. Finding out average of score to determine intellectual level of students.<br>
slide14. Association Finding out relationship among data is also called as link analysis or affinity analysis. An association rule is a model that identifies specific types of data associations. These associations are often used in the retail sales community to identify items that are frequently purchased together. E.g. Market Basket analysis.<br>
slide15. Sequence Discovery Sequential analysis or sequence discovery is used to determine sequential patterns in data. These patterns are based on a time sequence of actions. These patterns are similar to associations in that data (or events) are formed to be related. The association is based on time (Temporal association rule).
E.g. The webmaster of XYZ Corp. Periodically analyzes the web log data to determine how users of the XYZ’s web pages access them. He is interested in determining what sequences of pages are frequently accessed. He determines that 70 percent of the users of page A follow one of the following patterns of behaviour: (A, B, C) or (A, D, B, C) or (A, E, B, C). He then add a link directly from page A to C.<br>