
Data Science MODULE-1 (Introduction to core
Description: Data Science MODULE-1 (Introduction to core concepts and technologies) Presented by Dr. N. Ramana Associate Professor Kakatiya University Data Science MODULE-1 (Introduction to core concepts and technologies) Introduction Terminology data
Related Topics
Download Presentation
"Data Science MODULE-1 (Introduction to core" is the property of its rightful owner. Permission is granted to download and print the materials on this website for personal, non-commercial use only, and to display it on your personal computer provided you do not modify the materials and that you retain all copyright notices contained in the materials. By downloading content from our website, you accept the terms of this agreement.
Presentation Transcript
slide1. Data Science
MODULE-1
(Introduction to core concepts and technologies) Presented by
Dr. N. Ramana
Associate Professor
Kakatiya University<br>
slide2. Data Science MODULE-1 (Introduction to core concepts and technologies)<br>
slide3. Introduction
Terminology
data science process
data science toolkit
Types of data
Example applications. Agenda<br>
slide4. Introduction: What Is Data Science? Data science is the practice of mining large data sets of raw data, both structured and unstructured, to identify patterns and extract actionable insight from them.
This is an interdisciplinary field, and the foundations of data science include statistics, inference, computer science, predictive analytics, machine learning algorithm development, and new technologies to gain insights from big data.
Data science enables businesses to process huge amounts of structured and unstructured big data to detect patterns.<br>
slide5. A huge amount of data is being generated every second from every corner of the world, but we do not know what to do with it.
In other words, we have a lot of data with us, but we are not trying to find out any insights from it.
And this need to understand and analyze data to make better decisions is what gave birth to Data Science.
Allows companies to increase efficiencies, manage costs, identify new market opportunities, and boost their market advantage Why Data Science?<br>
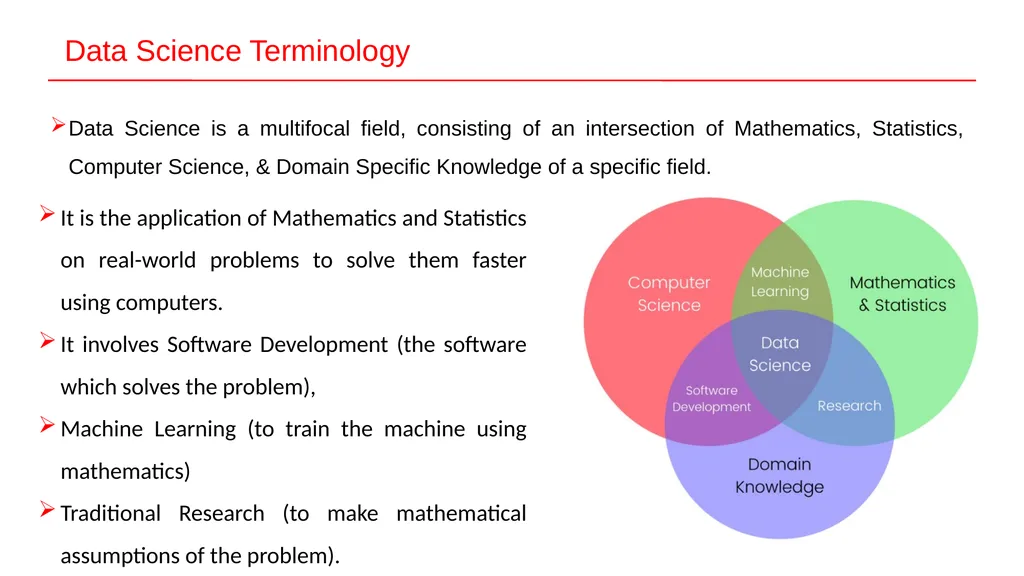
slide6. Data Science Terminology Data Science is a multifocal field, consisting of an intersection of Mathematics, Statistics, Computer Science, & Domain Specific Knowledge of a specific field. It is the application of Mathematics and Statistics on real-world problems to solve them faster using computers.
It involves Software Development (the software which solves the problem),
Machine Learning (to train the machine using mathematics)
Traditional Research (to make mathematical assumptions of the problem).<br>
slide7. The Data Science Process<br>
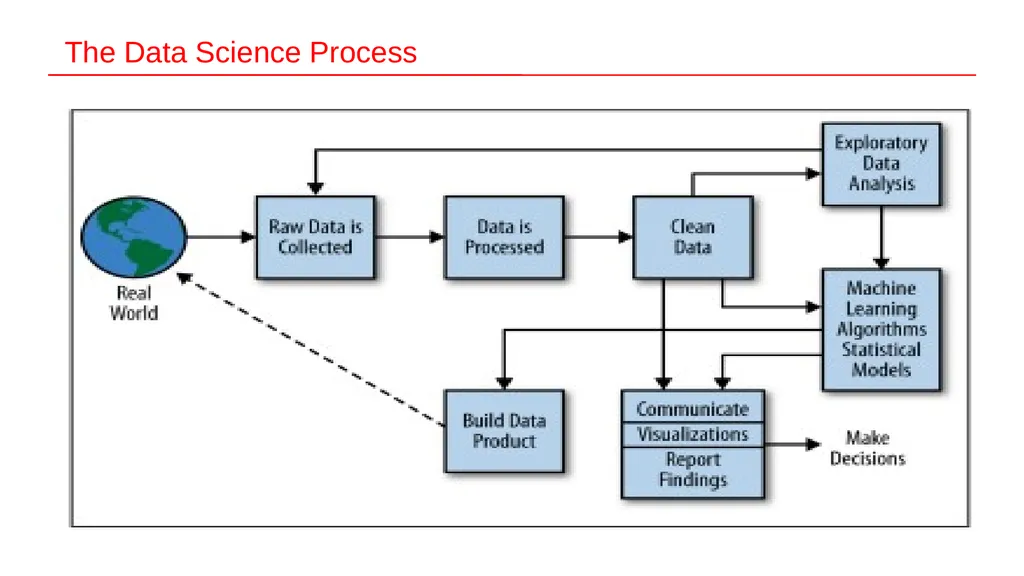
slide8. The Data Science Process The data science process is a systematic approach to solving a data problem.
It provides a structured framework for articulating your problem as a question, deciding how to solve it, and then presenting the solution to stakeholders.
Data science process is a workflow process that begins with collecting data, and ends with deploying a model that will hopefully answer your questions.<br>
slide9. The steps include
Step1 : Framing the Problem
Understanding and framing the problem is the first step of the data science life cycle. This framing will help you build an effective model that will have a positive impact on your organization.
Step2 : Collecting Data
The next step is to collect the right set of data. High-quality, targeted data
Most of the data you collect during the collection phase will be unstructured, irrelevant, and unfiltered. Bad data produces bad results, so the accuracy and efficacy of your analysis will depend heavily on the quality of your data. The Data Science Process<br>
slide10. Step3 : Cleaning data
Cleaning data eliminates duplicate and null values, corrupt data, inconsistent data types, invalid entries, missing data, and improper formatting.
This step is the most time-intensive process, but finding and resolving flaws in your data is essential to building effective models
Step4 :Exploratory Data Analysis (EDA)
Now that you have a large amount of organized, high-quality data, you can begin conducting an exploratory data analysis (EDA).
Effective EDA uncover valuable insights that will be useful in the next phase of the data science lifecycle
Step5 : Model Building and Deployment
uses machine learning, statistical models, and algorithms to extract high-value insights and predictions.<br>
slide11. Example : Real World Let consider the Real World,
Step1 : inside the Real World a lots of people busy at various activities. Some people are using Google+, others are competing in the Olympics; there are spammers sending spam, and there are people getting their blood drawn.
Say we have data on one of these things.
Step2 : We start with raw data—logs, Olympics records, employee emails, or recorded genetic material
Step3 : We want to process this to make it clean for analysis.
So we build and use pipelines of data munging: joining, scraping, wrangling, or whatever you want to call it.<br>
slide12. Example : Real World To do this we use tools such as Python, shell scripts, R, or SQL, or all of the above.
Eventually we get the data down to a nice format, like something with columns:
name | event | year | gender | event time
Step4 : Once we have this clean dataset, we do some kind of Exploratory Data Analysis.
In the course of doing EDA, we may realize that it isn’t actually clean because of duplicates, missing values, absurd outliers, and data that wasn’t actually logged or incorrectly logged.
If that’s the case, we may have to go back to collect more data, or spend more time cleaning the dataset.<br>
slide13. Example : Real World Step5 : Next, we design our model to use some algorithm like k-nearest neighbor
(k-NN), linear regression, Naive Bayes, or something else.
The model we choose depends on the type of problem we’re trying to solve
We then can interpret, visualize, report, or communicate our results.
Alternatively, our goal may be to build or prototype a “data product”;
Example
a spam classifier
a search ranking algorithm
a recommendation system.<br>
slide14. Data science tools Data scientists rely on popular programming languages to conduct exploratory data analysis and statistical regression.
These open source tools support pre-built statistical modeling, machine learning, and graphics capabilities.
Studio: An open source programming language and environment for developing statistical computing and graphics.
Python: It is a dynamic and flexible programming language. The Python includes numerous libraries, such as NumPy, Pandas, Matplotlib, for analyzing data quickly.<br>
slide15. Data science tools Some data scientists may prefer a user interface, and two common enterprise tools for statistical analysis include:
SAS: A comprehensive tool suite, including visualizations and interactive dashboards, for analyzing, reporting, data mining, and predictive modelling.
IBM SPSS: Offers advanced statistical analysis, a large library of machine learning algorithms, text analysis, open source extensibility, integration with big data, and seamless deployment into applications.<br>
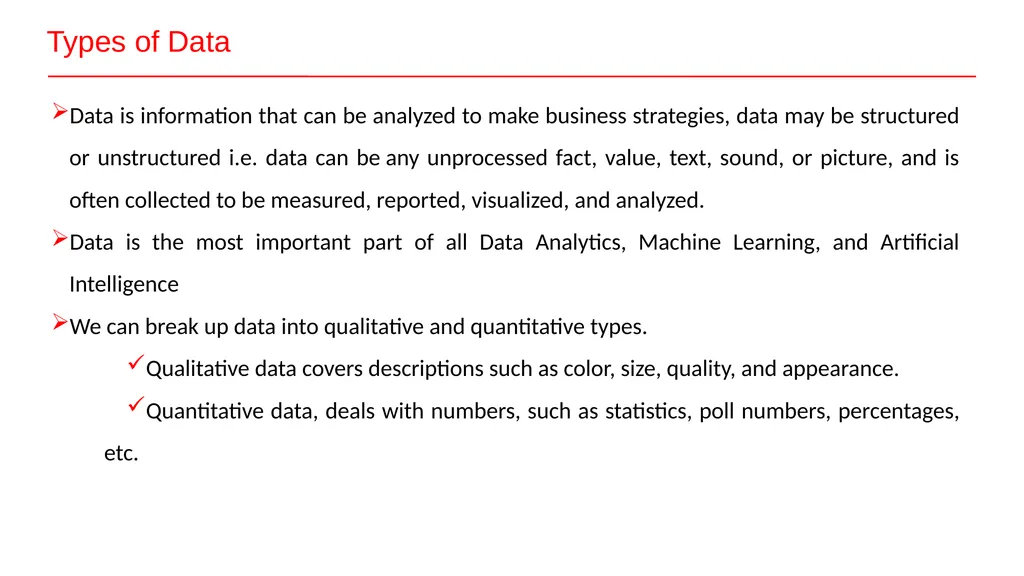
slide16. Types of Data Data is information that can be analyzed to make business strategies, data may be structured or unstructured i.e. data can be any unprocessed fact, value, text, sound, or picture, and is often collected to be measured, reported, visualized, and analyzed.
Data is the most important part of all Data Analytics, Machine Learning, and Artificial Intelligence
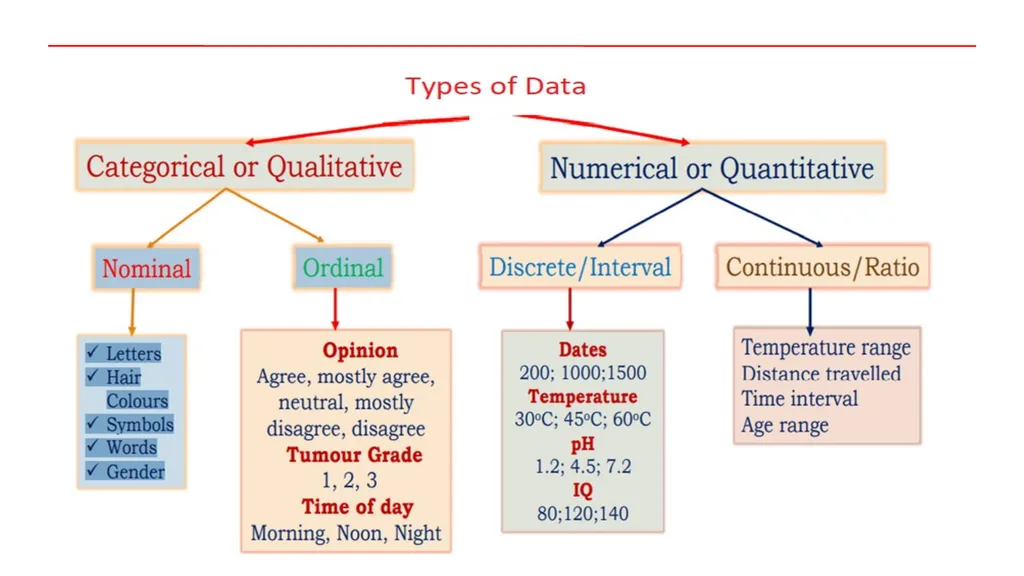
We can break up data into qualitative and quantitative types.
Qualitative data covers descriptions such as color, size, quality, and appearance.
Quantitative data, deals with numbers, such as statistics, poll numbers, percentages, etc.<br>
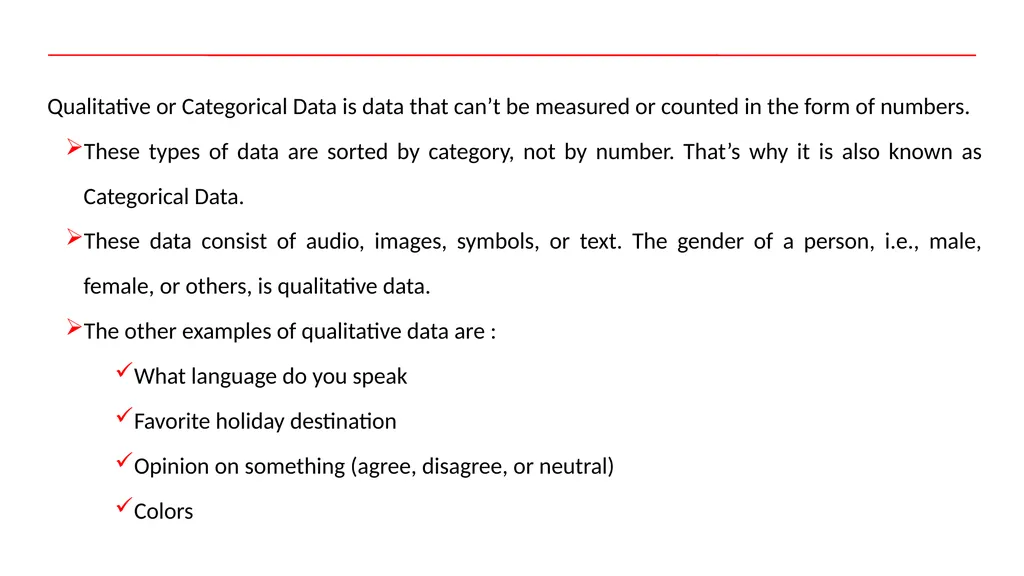
slide18. Qualitative or Categorical Data is data that can’t be measured or counted in the form of numbers.
These types of data are sorted by category, not by number. That’s why it is also known as Categorical Data.
These data consist of audio, images, symbols, or text. The gender of a person, i.e., male, female, or others, is qualitative data.
The other examples of qualitative data are :
What language do you speak
Favorite holiday destination
Opinion on something (agree, disagree, or neutral)
Colors<br>
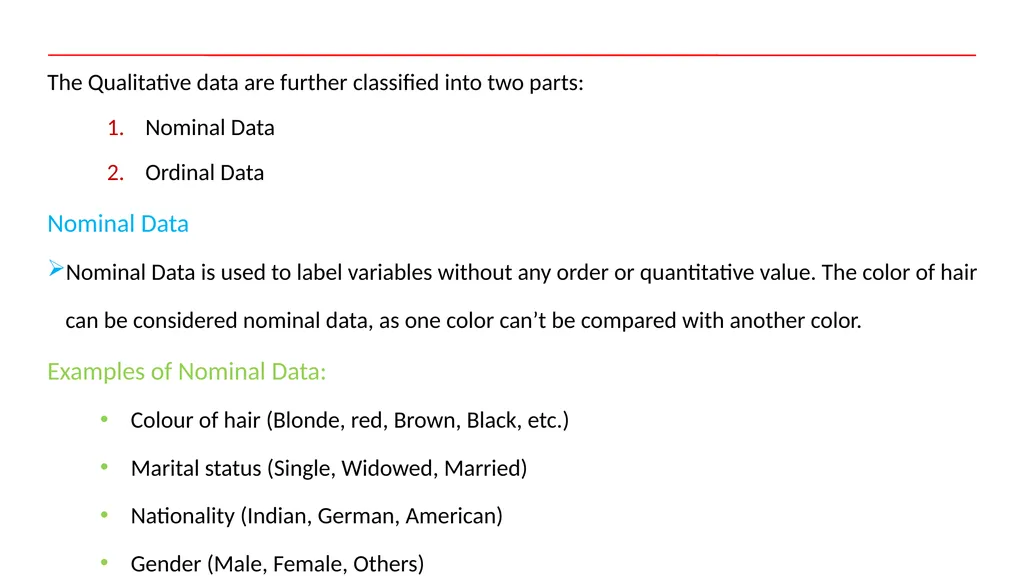
slide19. The Qualitative data are further classified into two parts:
Nominal Data
Ordinal Data
Nominal Data
Nominal Data is used to label variables without any order or quantitative value. The color of hair can be considered nominal data, as one color can’t be compared with another color.
Examples of Nominal Data:
Colour of hair (Blonde, red, Brown, Black, etc.)
Marital status (Single, Widowed, Married)
Nationality (Indian, German, American)
Gender (Male, Female, Others)<br>
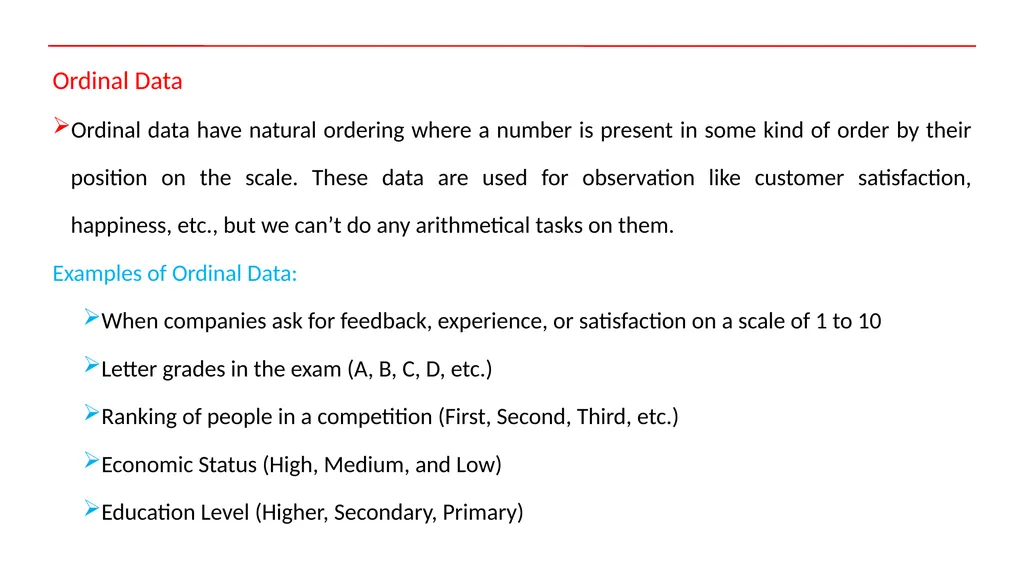
slide20. Ordinal Data
Ordinal data have natural ordering where a number is present in some kind of order by their position on the scale. These data are used for observation like customer satisfaction, happiness, etc., but we can’t do any arithmetical tasks on them.
Examples of Ordinal Data:
When companies ask for feedback, experience, or satisfaction on a scale of 1 to 10
Letter grades in the exam (A, B, C, D, etc.)
Ranking of people in a competition (First, Second, Third, etc.)
Economic Status (High, Medium, and Low)
Education Level (Higher, Secondary, Primary)<br>
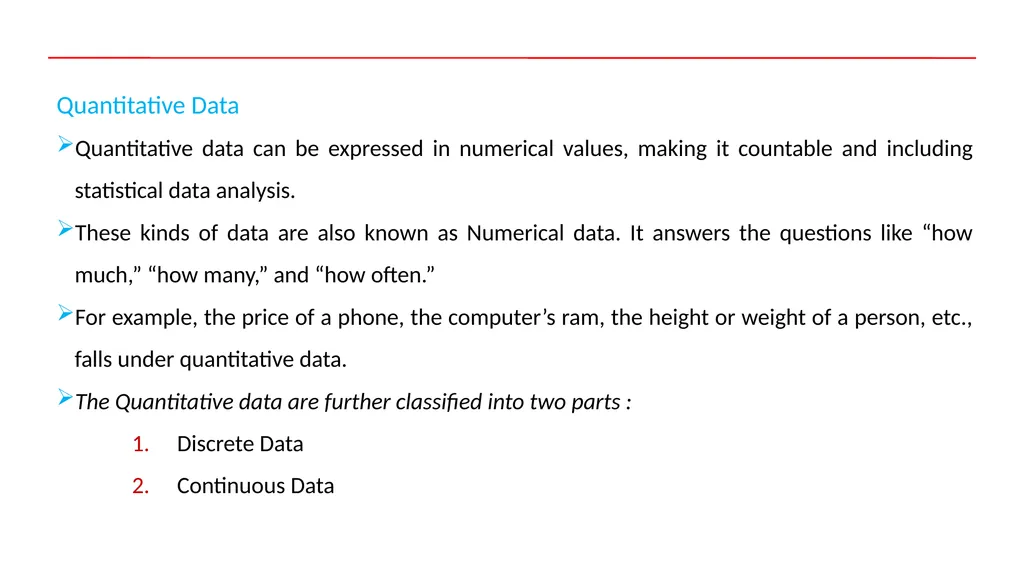
slide21. Quantitative Data
Quantitative data can be expressed in numerical values, making it countable and including statistical data analysis.
These kinds of data are also known as Numerical data. It answers the questions like “how much,” “how many,” and “how often.”
For example, the price of a phone, the computer’s ram, the height or weight of a person, etc., falls under quantitative data.
The Quantitative data are further classified into two parts :
Discrete Data
Continuous Data<br>
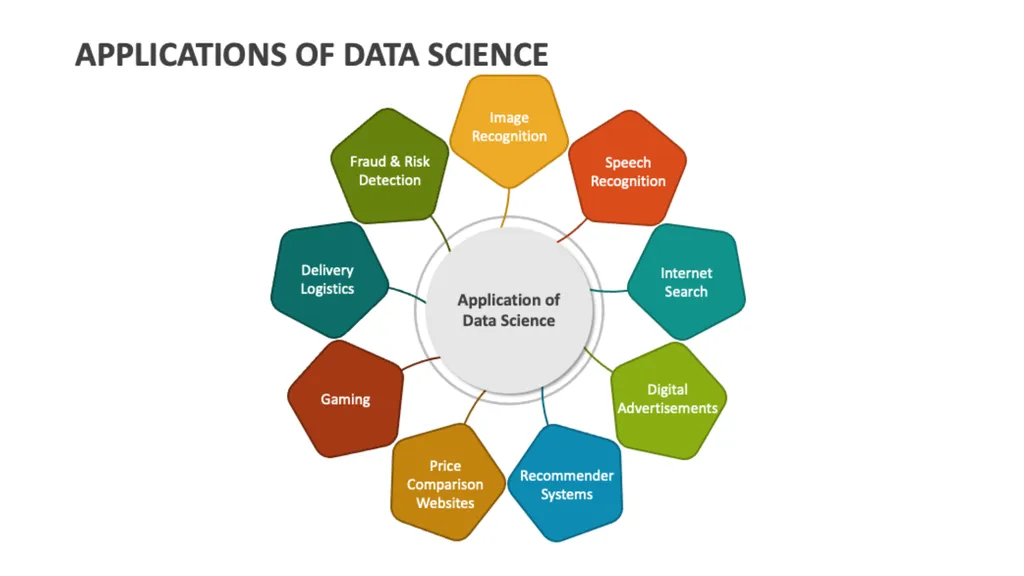
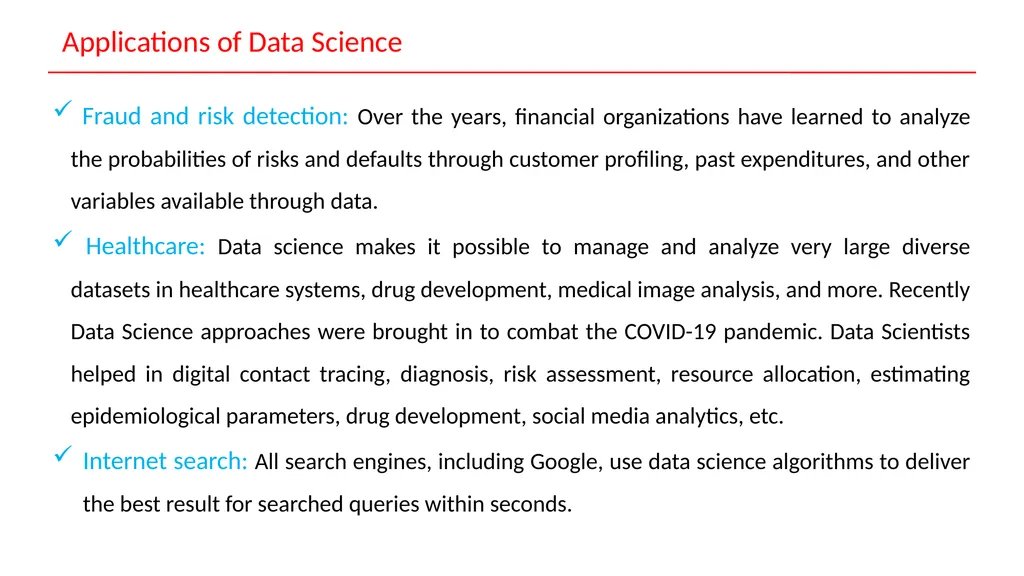
slide23. Fraud and risk detection: Over the years, financial organizations have learned to analyze the probabilities of risks and defaults through customer profiling, past expenditures, and other variables available through data.
Healthcare: Data science makes it possible to manage and analyze very large diverse datasets in healthcare systems, drug development, medical image analysis, and more. Recently Data Science approaches were brought in to combat the COVID-19 pandemic. Data Scientists helped in digital contact tracing, diagnosis, risk assessment, resource allocation, estimating epidemiological parameters, drug development, social media analytics, etc.
Internet search: All search engines, including Google, use data science algorithms to deliver the best result for searched queries within seconds. Applications of Data Science<br>
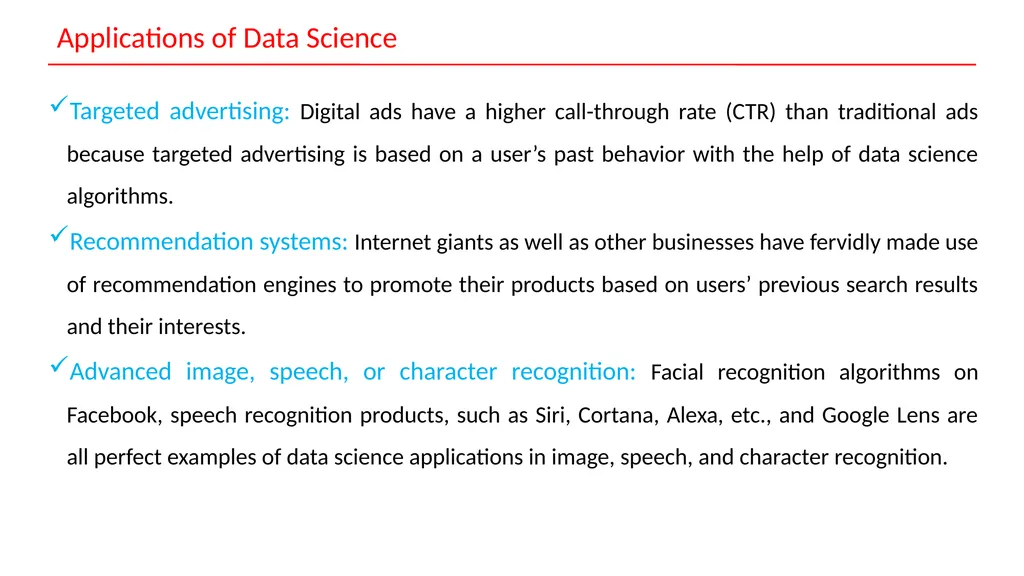
slide24. Targeted advertising: Digital ads have a higher call-through rate (CTR) than traditional ads because targeted advertising is based on a user’s past behavior with the help of data science algorithms.
Recommendation systems: Internet giants as well as other businesses have fervidly made use of recommendation engines to promote their products based on users’ previous search results and their interests.
Advanced image, speech, or character recognition: Facial recognition algorithms on Facebook, speech recognition products, such as Siri, Cortana, Alexa, etc., and Google Lens are all perfect examples of data science applications in image, speech, and character recognition. Applications of Data Science<br>
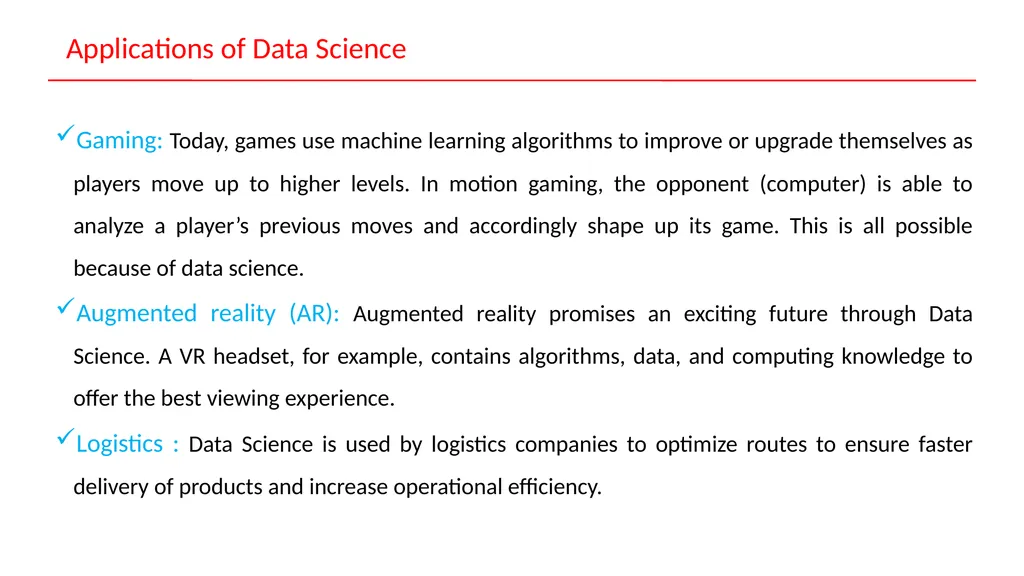
slide25. Gaming: Today, games use machine learning algorithms to improve or upgrade themselves as players move up to higher levels. In motion gaming, the opponent (computer) is able to analyze a player’s previous moves and accordingly shape up its game. This is all possible because of data science.
Augmented reality (AR): Augmented reality promises an exciting future through Data Science. A VR headset, for example, contains algorithms, data, and computing knowledge to offer the best viewing experience.
Logistics : Data Science is used by logistics companies to optimize routes to ensure faster delivery of products and increase operational efficiency. Applications of Data Science<br>
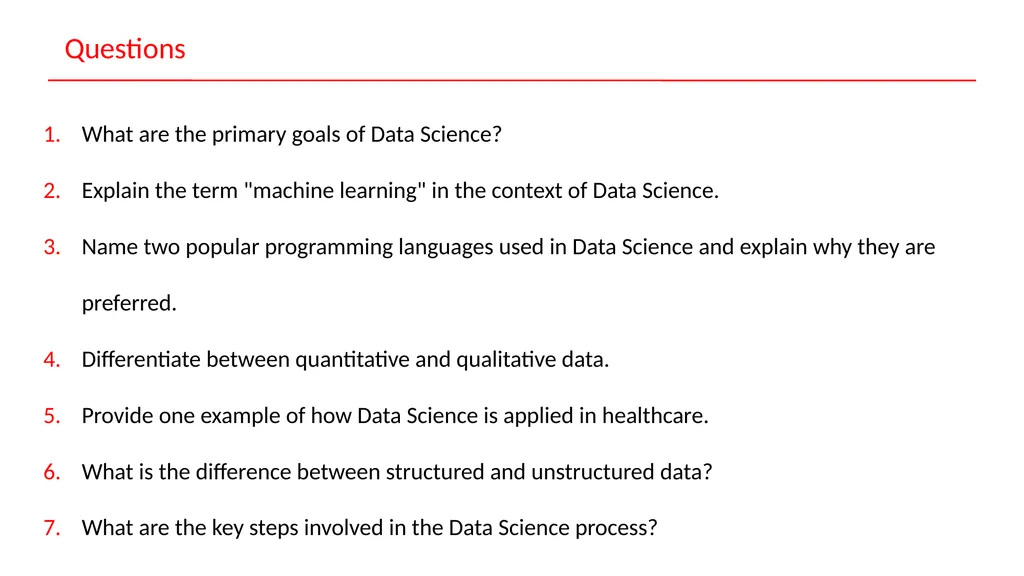
slide26. Questions What are the primary goals of Data Science?
Explain the term "machine learning" in the context of Data Science.
Name two popular programming languages used in Data Science and explain why they are preferred.
Differentiate between quantitative and qualitative data.
Provide one example of how Data Science is applied in healthcare.
What is the difference between structured and unstructured data?
What are the key steps involved in the Data Science process?<br>
Dr. N. Ramana
Associate Professor
Kakatiya University<br>
slide2. Data Science MODULE-1 (Introduction to core concepts and technologies)<br>
slide3. Introduction
Terminology
data science process
data science toolkit
Types of data
Example applications. Agenda<br>
slide4. Introduction: What Is Data Science? Data science is the practice of mining large data sets of raw data, both structured and unstructured, to identify patterns and extract actionable insight from them.
This is an interdisciplinary field, and the foundations of data science include statistics, inference, computer science, predictive analytics, machine learning algorithm development, and new technologies to gain insights from big data.
Data science enables businesses to process huge amounts of structured and unstructured big data to detect patterns.<br>
slide5. A huge amount of data is being generated every second from every corner of the world, but we do not know what to do with it.
In other words, we have a lot of data with us, but we are not trying to find out any insights from it.
And this need to understand and analyze data to make better decisions is what gave birth to Data Science.
Allows companies to increase efficiencies, manage costs, identify new market opportunities, and boost their market advantage Why Data Science?<br>
slide6. Data Science Terminology Data Science is a multifocal field, consisting of an intersection of Mathematics, Statistics, Computer Science, & Domain Specific Knowledge of a specific field. It is the application of Mathematics and Statistics on real-world problems to solve them faster using computers.
It involves Software Development (the software which solves the problem),
Machine Learning (to train the machine using mathematics)
Traditional Research (to make mathematical assumptions of the problem).<br>
slide7. The Data Science Process<br>
slide8. The Data Science Process The data science process is a systematic approach to solving a data problem.
It provides a structured framework for articulating your problem as a question, deciding how to solve it, and then presenting the solution to stakeholders.
Data science process is a workflow process that begins with collecting data, and ends with deploying a model that will hopefully answer your questions.<br>
slide9. The steps include
Step1 : Framing the Problem
Understanding and framing the problem is the first step of the data science life cycle. This framing will help you build an effective model that will have a positive impact on your organization.
Step2 : Collecting Data
The next step is to collect the right set of data. High-quality, targeted data
Most of the data you collect during the collection phase will be unstructured, irrelevant, and unfiltered. Bad data produces bad results, so the accuracy and efficacy of your analysis will depend heavily on the quality of your data. The Data Science Process<br>
slide10. Step3 : Cleaning data
Cleaning data eliminates duplicate and null values, corrupt data, inconsistent data types, invalid entries, missing data, and improper formatting.
This step is the most time-intensive process, but finding and resolving flaws in your data is essential to building effective models
Step4 :Exploratory Data Analysis (EDA)
Now that you have a large amount of organized, high-quality data, you can begin conducting an exploratory data analysis (EDA).
Effective EDA uncover valuable insights that will be useful in the next phase of the data science lifecycle
Step5 : Model Building and Deployment
uses machine learning, statistical models, and algorithms to extract high-value insights and predictions.<br>
slide11. Example : Real World Let consider the Real World,
Step1 : inside the Real World a lots of people busy at various activities. Some people are using Google+, others are competing in the Olympics; there are spammers sending spam, and there are people getting their blood drawn.
Say we have data on one of these things.
Step2 : We start with raw data—logs, Olympics records, employee emails, or recorded genetic material
Step3 : We want to process this to make it clean for analysis.
So we build and use pipelines of data munging: joining, scraping, wrangling, or whatever you want to call it.<br>
slide12. Example : Real World To do this we use tools such as Python, shell scripts, R, or SQL, or all of the above.
Eventually we get the data down to a nice format, like something with columns:
name | event | year | gender | event time
Step4 : Once we have this clean dataset, we do some kind of Exploratory Data Analysis.
In the course of doing EDA, we may realize that it isn’t actually clean because of duplicates, missing values, absurd outliers, and data that wasn’t actually logged or incorrectly logged.
If that’s the case, we may have to go back to collect more data, or spend more time cleaning the dataset.<br>
slide13. Example : Real World Step5 : Next, we design our model to use some algorithm like k-nearest neighbor
(k-NN), linear regression, Naive Bayes, or something else.
The model we choose depends on the type of problem we’re trying to solve
We then can interpret, visualize, report, or communicate our results.
Alternatively, our goal may be to build or prototype a “data product”;
Example
a spam classifier
a search ranking algorithm
a recommendation system.<br>
slide14. Data science tools Data scientists rely on popular programming languages to conduct exploratory data analysis and statistical regression.
These open source tools support pre-built statistical modeling, machine learning, and graphics capabilities.
Studio: An open source programming language and environment for developing statistical computing and graphics.
Python: It is a dynamic and flexible programming language. The Python includes numerous libraries, such as NumPy, Pandas, Matplotlib, for analyzing data quickly.<br>
slide15. Data science tools Some data scientists may prefer a user interface, and two common enterprise tools for statistical analysis include:
SAS: A comprehensive tool suite, including visualizations and interactive dashboards, for analyzing, reporting, data mining, and predictive modelling.
IBM SPSS: Offers advanced statistical analysis, a large library of machine learning algorithms, text analysis, open source extensibility, integration with big data, and seamless deployment into applications.<br>
slide16. Types of Data Data is information that can be analyzed to make business strategies, data may be structured or unstructured i.e. data can be any unprocessed fact, value, text, sound, or picture, and is often collected to be measured, reported, visualized, and analyzed.
Data is the most important part of all Data Analytics, Machine Learning, and Artificial Intelligence
We can break up data into qualitative and quantitative types.
Qualitative data covers descriptions such as color, size, quality, and appearance.
Quantitative data, deals with numbers, such as statistics, poll numbers, percentages, etc.<br>
slide18. Qualitative or Categorical Data is data that can’t be measured or counted in the form of numbers.
These types of data are sorted by category, not by number. That’s why it is also known as Categorical Data.
These data consist of audio, images, symbols, or text. The gender of a person, i.e., male, female, or others, is qualitative data.
The other examples of qualitative data are :
What language do you speak
Favorite holiday destination
Opinion on something (agree, disagree, or neutral)
Colors<br>
slide19. The Qualitative data are further classified into two parts:
Nominal Data
Ordinal Data
Nominal Data
Nominal Data is used to label variables without any order or quantitative value. The color of hair can be considered nominal data, as one color can’t be compared with another color.
Examples of Nominal Data:
Colour of hair (Blonde, red, Brown, Black, etc.)
Marital status (Single, Widowed, Married)
Nationality (Indian, German, American)
Gender (Male, Female, Others)<br>
slide20. Ordinal Data
Ordinal data have natural ordering where a number is present in some kind of order by their position on the scale. These data are used for observation like customer satisfaction, happiness, etc., but we can’t do any arithmetical tasks on them.
Examples of Ordinal Data:
When companies ask for feedback, experience, or satisfaction on a scale of 1 to 10
Letter grades in the exam (A, B, C, D, etc.)
Ranking of people in a competition (First, Second, Third, etc.)
Economic Status (High, Medium, and Low)
Education Level (Higher, Secondary, Primary)<br>
slide21. Quantitative Data
Quantitative data can be expressed in numerical values, making it countable and including statistical data analysis.
These kinds of data are also known as Numerical data. It answers the questions like “how much,” “how many,” and “how often.”
For example, the price of a phone, the computer’s ram, the height or weight of a person, etc., falls under quantitative data.
The Quantitative data are further classified into two parts :
Discrete Data
Continuous Data<br>
slide23. Fraud and risk detection: Over the years, financial organizations have learned to analyze the probabilities of risks and defaults through customer profiling, past expenditures, and other variables available through data.
Healthcare: Data science makes it possible to manage and analyze very large diverse datasets in healthcare systems, drug development, medical image analysis, and more. Recently Data Science approaches were brought in to combat the COVID-19 pandemic. Data Scientists helped in digital contact tracing, diagnosis, risk assessment, resource allocation, estimating epidemiological parameters, drug development, social media analytics, etc.
Internet search: All search engines, including Google, use data science algorithms to deliver the best result for searched queries within seconds. Applications of Data Science<br>
slide24. Targeted advertising: Digital ads have a higher call-through rate (CTR) than traditional ads because targeted advertising is based on a user’s past behavior with the help of data science algorithms.
Recommendation systems: Internet giants as well as other businesses have fervidly made use of recommendation engines to promote their products based on users’ previous search results and their interests.
Advanced image, speech, or character recognition: Facial recognition algorithms on Facebook, speech recognition products, such as Siri, Cortana, Alexa, etc., and Google Lens are all perfect examples of data science applications in image, speech, and character recognition. Applications of Data Science<br>
slide25. Gaming: Today, games use machine learning algorithms to improve or upgrade themselves as players move up to higher levels. In motion gaming, the opponent (computer) is able to analyze a player’s previous moves and accordingly shape up its game. This is all possible because of data science.
Augmented reality (AR): Augmented reality promises an exciting future through Data Science. A VR headset, for example, contains algorithms, data, and computing knowledge to offer the best viewing experience.
Logistics : Data Science is used by logistics companies to optimize routes to ensure faster delivery of products and increase operational efficiency. Applications of Data Science<br>
slide26. Questions What are the primary goals of Data Science?
Explain the term "machine learning" in the context of Data Science.
Name two popular programming languages used in Data Science and explain why they are preferred.
Differentiate between quantitative and qualitative data.
Provide one example of how Data Science is applied in healthcare.
What is the difference between structured and unstructured data?
What are the key steps involved in the Data Science process?<br>