
Data Sources and Conversion Feeding the GIS Dr.



Description: Data Sources and Conversion Feeding the GIS Dr. Ahmad Bin Touq abintouquaeu.ac.ae http:faculty.uaeu.ac.aeabintouq GEO 440: GIS for Urban Regional Planning Data Sources and Conversion Feeding the GIS Discussion here focuses more on
Related Topics
Download Presentation
"Data Sources and Conversion Feeding the GIS Dr." is the property of its rightful owner. Permission is granted to download and print the materials on this website for personal, non-commercial use only, and to display it on your personal computer provided you do not modify the materials and that you retain all copyright notices contained in the materials. By downloading content from our website, you accept the terms of this agreement.
Presentation Transcript
slide1. Data Sources and Conversion Feeding the GIS Dr. Ahmad Bin Touq
abintouq@uaeu.ac.ae
http://faculty.uaeu.ac.ae/~abintouq
GEO 440: GIS for Urban & Regional Planning<br>
slide2. Data Sources and Conversion Feeding the GIS Discussion here focuses more on projects than organization-wide implementation.
Like a teenager, a GIS can consume more than data you ever imagined!
Often, data collection is an end in itself. Almost invariably, it’s the costliest element of any project-- > 80%.<br>
slide3. Data Sources and Conversion Feeding the GIS. Discussion here focuses more on projects than organization-wide implementation.
Like a teenager, a GIS can consume more than data you ever imagined!
Often, data collection is an end in itself. Almost invariably, it’s the costliest element of any project-- > 80%.<br>
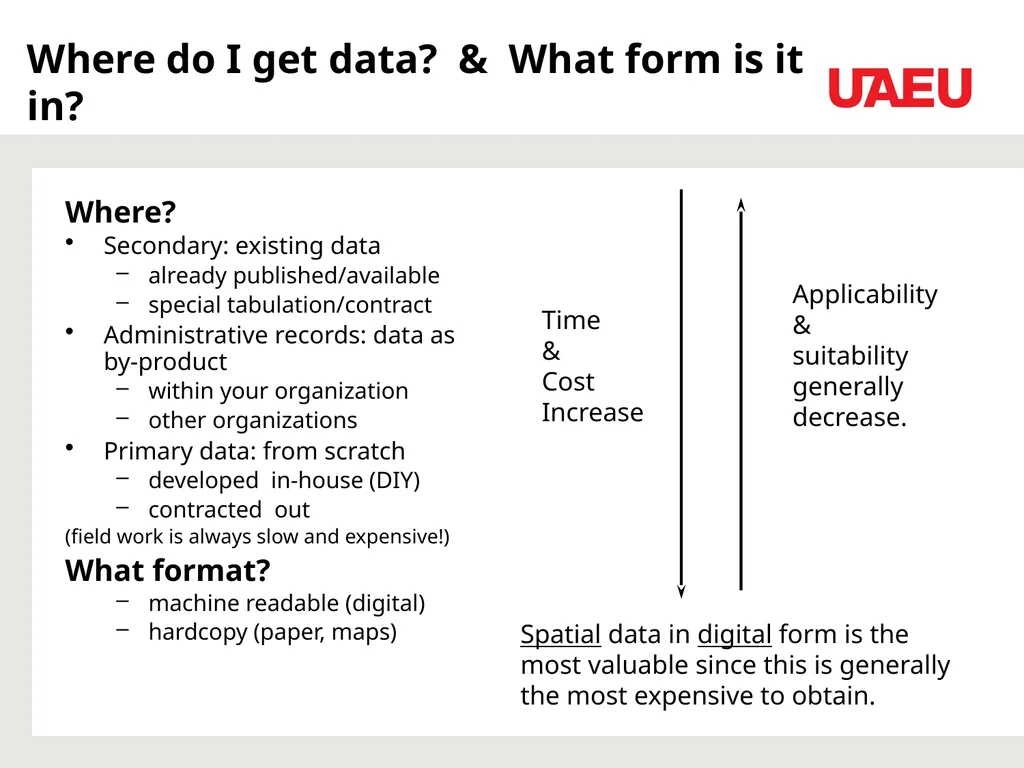
slide4. Where do I get data? & What form is it in? Where?
Secondary: existing data
already published/available
special tabulation/contract
Administrative records: data as by-product
within your organization
other organizations
Primary data: from scratch
developed in-house (DIY)
contracted out
(field work is always slow and expensive!)
What format?
machine readable (digital)
hardcopy (paper, maps) Spatial data in digital form is the most valuable since this is generally the most expensive to obtain.<br>
slide5. Don’t forget to look in-house! collected by your organization as data
by-product of normal agency operations
acquired for some other project
Don’t forget to look, especially if it’s a large organization. There may already be a GIS project in existense or about to be launched!<br>
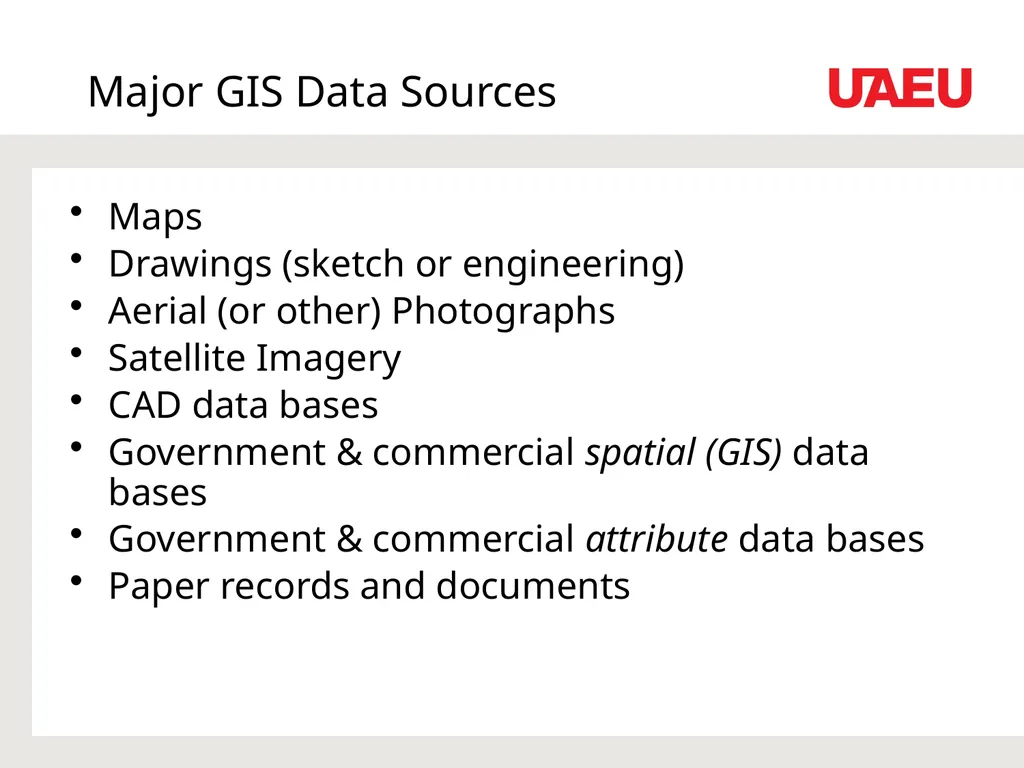
slide6. Major GIS Data Sources Maps
Drawings (sketch or engineering)
Aerial (or other) Photographs
Satellite Imagery
CAD data bases
Government & commercial spatial (GIS) data bases
Government & commercial attribute data bases
Paper records and documents<br>
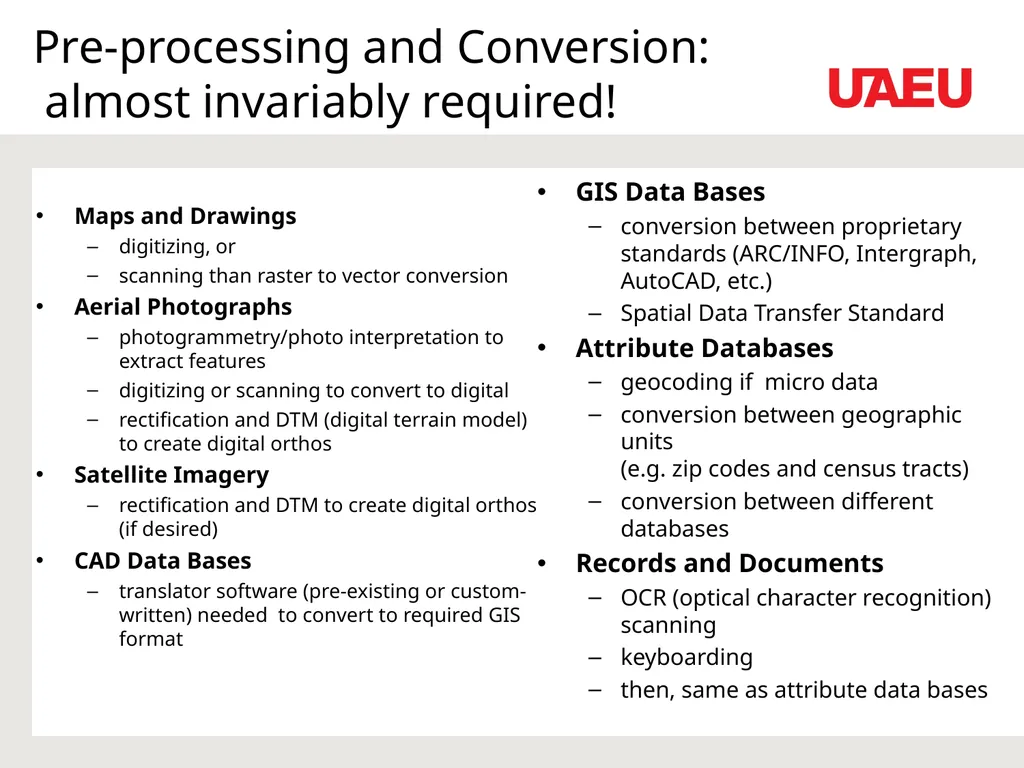
slide7. Pre-processing and Conversion: almost invariably required! Maps and Drawings
digitizing, or
scanning than raster to vector conversion
Aerial Photographs
photogrammetry/photo interpretation to extract features
digitizing or scanning to convert to digital
rectification and DTM (digital terrain model) to create digital orthos
Satellite Imagery
rectification and DTM to create digital orthos (if desired)
CAD Data Bases
translator software (pre-existing or custom-written) needed to convert to required GIS format GIS Data Bases
conversion between proprietary standards (ARC/INFO, Intergraph, AutoCAD, etc.)
Spatial Data Transfer Standard
Attribute Databases
geocoding if micro data
conversion between geographic units (e.g. zip codes and census tracts)
conversion between different databases
Records and Documents
OCR (optical character recognition) scanning
keyboarding
then, same as attribute data bases<br>
slide8. Data Conversions: general comments Paper Maps to Digital
generally the most complex & expensive
automated extraction of layers problematic and error prone
requires scanning then raster to vector conversion
digitizing may be freehand with tablet, or “heads-up” on screen<br>
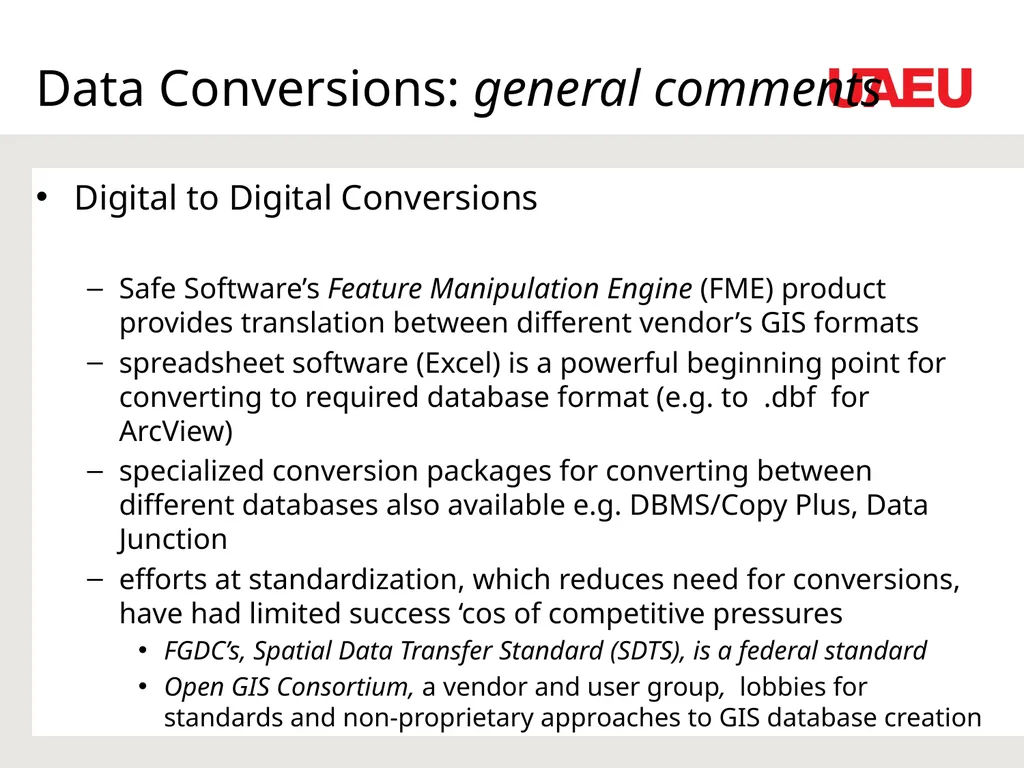
slide9. Data Conversions: general comments Digital to Digital Conversions
Safe Software’s Feature Manipulation Engine (FME) product provides translation between different vendor’s GIS formats
spreadsheet software (Excel) is a powerful beginning point for converting to required database format (e.g. to .dbf for ArcView)
specialized conversion packages for converting between different databases also available e.g. DBMS/Copy Plus, Data Junction
efforts at standardization, which reduces need for conversions, have had limited success ‘cos of competitive pressures
FGDC’s, Spatial Data Transfer Standard (SDTS), is a federal standard
Open GIS Consortium, a vendor and user group, lobbies for standards and non-proprietary approaches to GIS database creation<br>
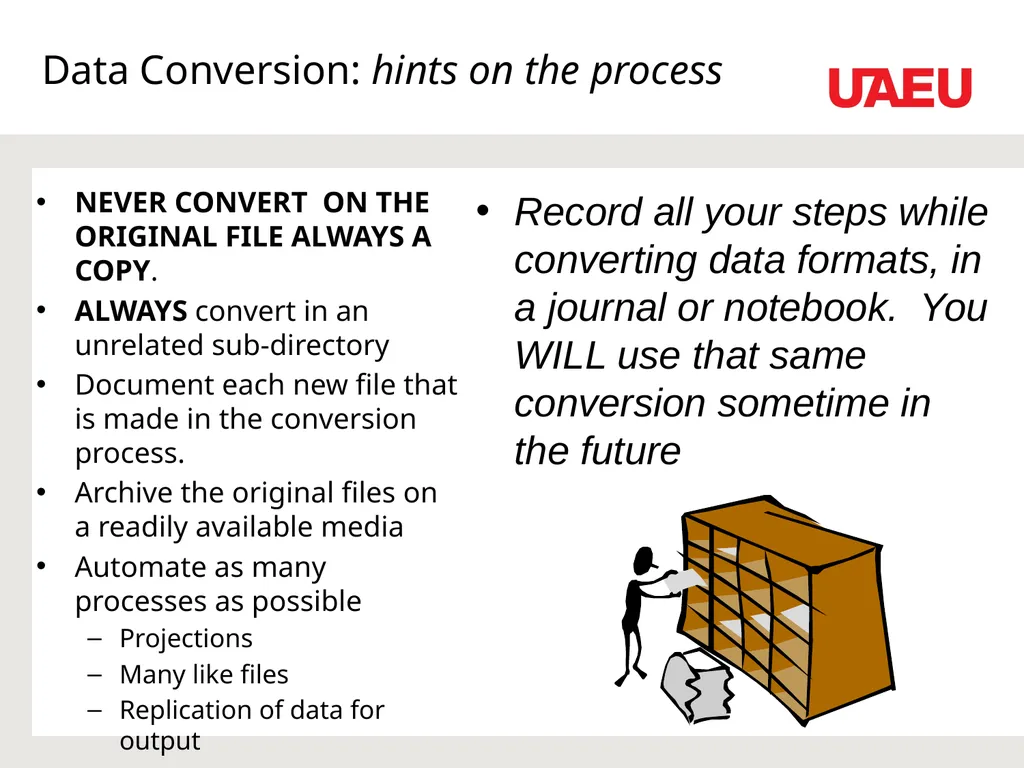
slide10. Data Conversion: hints on the process NEVER CONVERT ON THE ORIGINAL FILE ALWAYS A COPY.
ALWAYS convert in an unrelated sub-directory
Document each new file that is made in the conversion process.
Archive the original files on a readily available media
Automate as many processes as possible
Projections
Many like files
Replication of data for output Record all your steps while converting data formats, in a journal or notebook. You WILL use that same conversion sometime in the future<br>
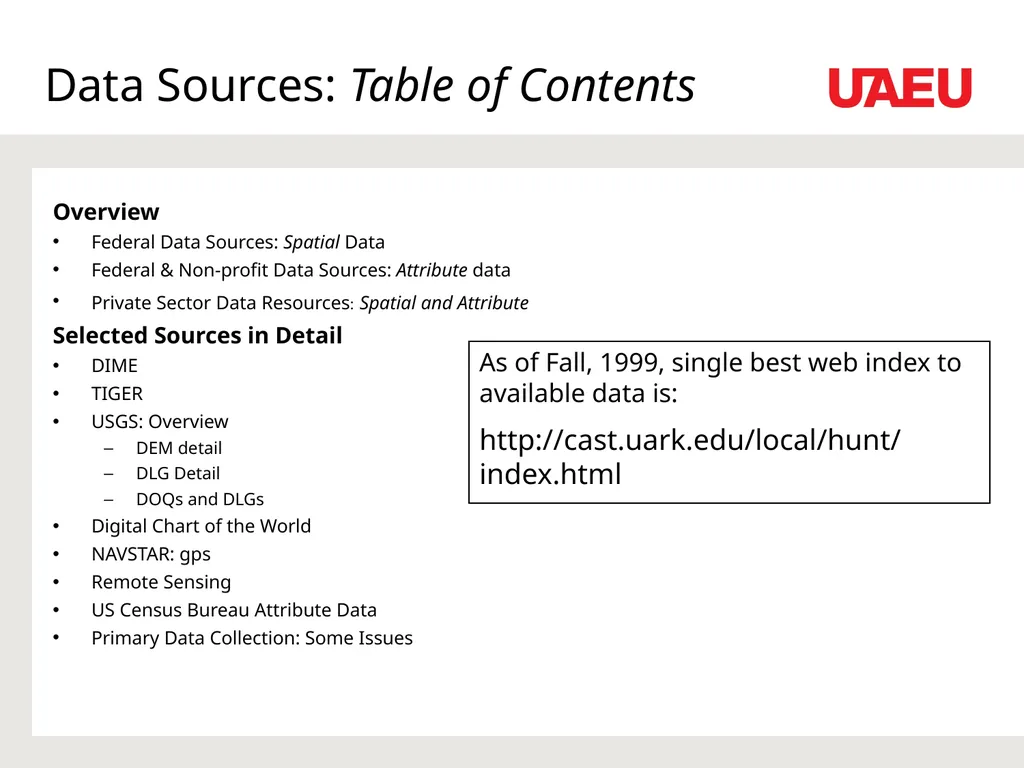
slide11. Data Sources: Table of Contents Overview
Federal Data Sources: Spatial Data
Federal & Non-profit Data Sources: Attribute data
Private Sector Data Resources: Spatial and Attribute
Selected Sources in Detail
DIME
TIGER
USGS: Overview
DEM detail
DLG Detail
DOQs and DLGs
Digital Chart of the World
NAVSTAR: gps
Remote Sensing
US Census Bureau Attribute Data
Primary Data Collection: Some Issues As of Fall, 1999, single best web index to available data is:
http://cast.uark.edu/local/hunt/index.html<br>
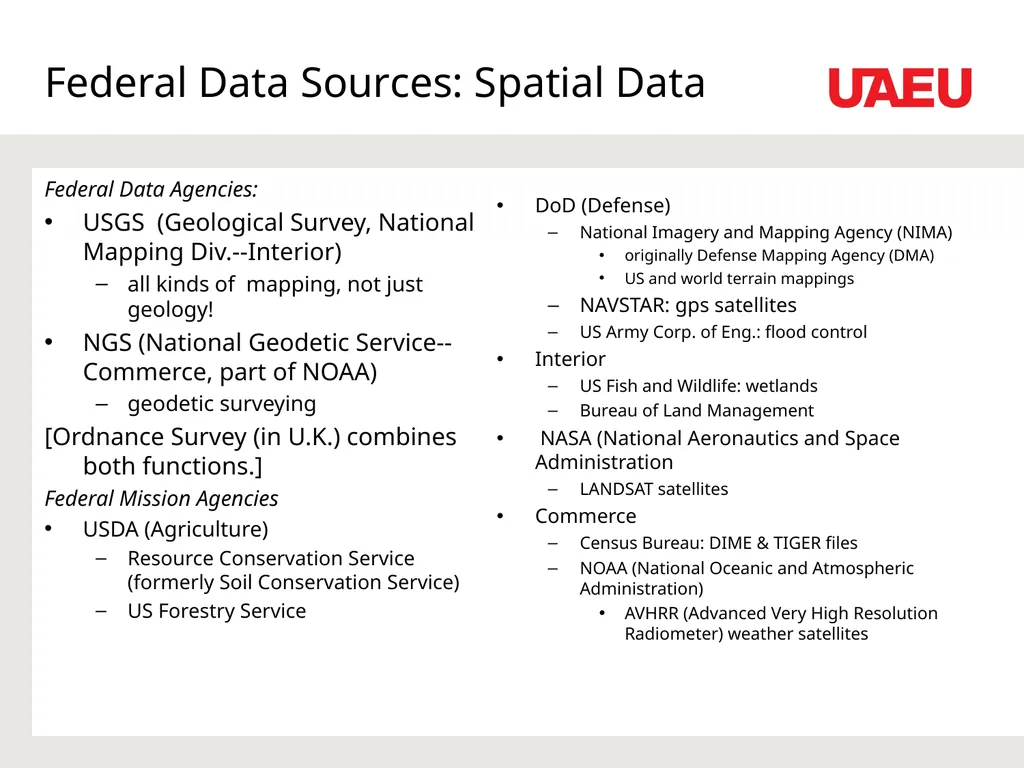
slide12. Federal Data Sources: Spatial Data Federal Data Agencies:
USGS (Geological Survey, National Mapping Div.--Interior)
all kinds of mapping, not just geology!
NGS (National Geodetic Service-- Commerce, part of NOAA)
geodetic surveying
[Ordnance Survey (in U.K.) combines both functions.]
Federal Mission Agencies
USDA (Agriculture)
Resource Conservation Service (formerly Soil Conservation Service)
US Forestry Service DoD (Defense)
National Imagery and Mapping Agency (NIMA)
originally Defense Mapping Agency (DMA)
US and world terrain mappings
NAVSTAR: gps satellites
US Army Corp. of Eng.: flood control
Interior
US Fish and Wildlife: wetlands
Bureau of Land Management
NASA (National Aeronautics and Space Administration
LANDSAT satellites
Commerce
Census Bureau: DIME & TIGER files
NOAA (National Oceanic and Atmospheric Administration)
AVHRR (Advanced Very High Resolution Radiometer) weather satellites<br>
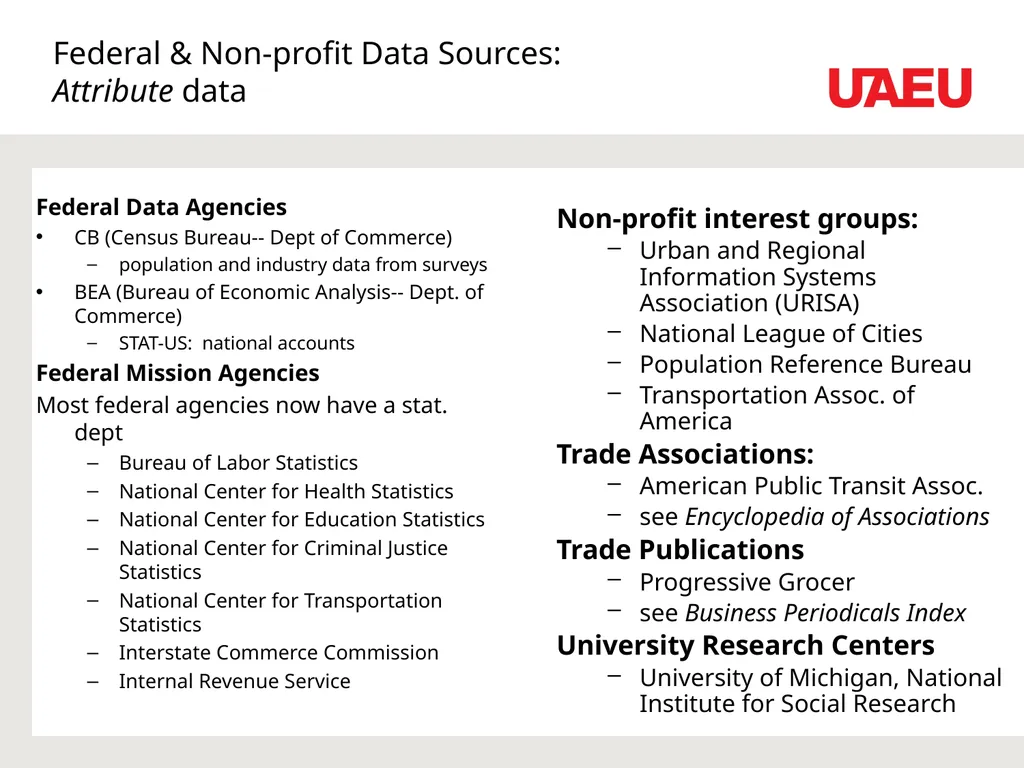
slide13. Federal & Non-profit Data Sources: Attribute data Federal Data Agencies
CB (Census Bureau-- Dept of Commerce)
population and industry data from surveys
BEA (Bureau of Economic Analysis-- Dept. of Commerce)
STAT-US: national accounts
Federal Mission Agencies
Most federal agencies now have a stat. dept
Bureau of Labor Statistics
National Center for Health Statistics
National Center for Education Statistics
National Center for Criminal Justice Statistics
National Center for Transportation Statistics
Interstate Commerce Commission
Internal Revenue Service Non-profit interest groups:
Urban and Regional Information Systems Association (URISA)
National League of Cities
Population Reference Bureau
Transportation Assoc. of America
Trade Associations:
American Public Transit Assoc.
see Encyclopedia of Associations
Trade Publications
Progressive Grocer
see Business Periodicals Index
University Research Centers
University of Michigan, National Institute for Social Research<br>
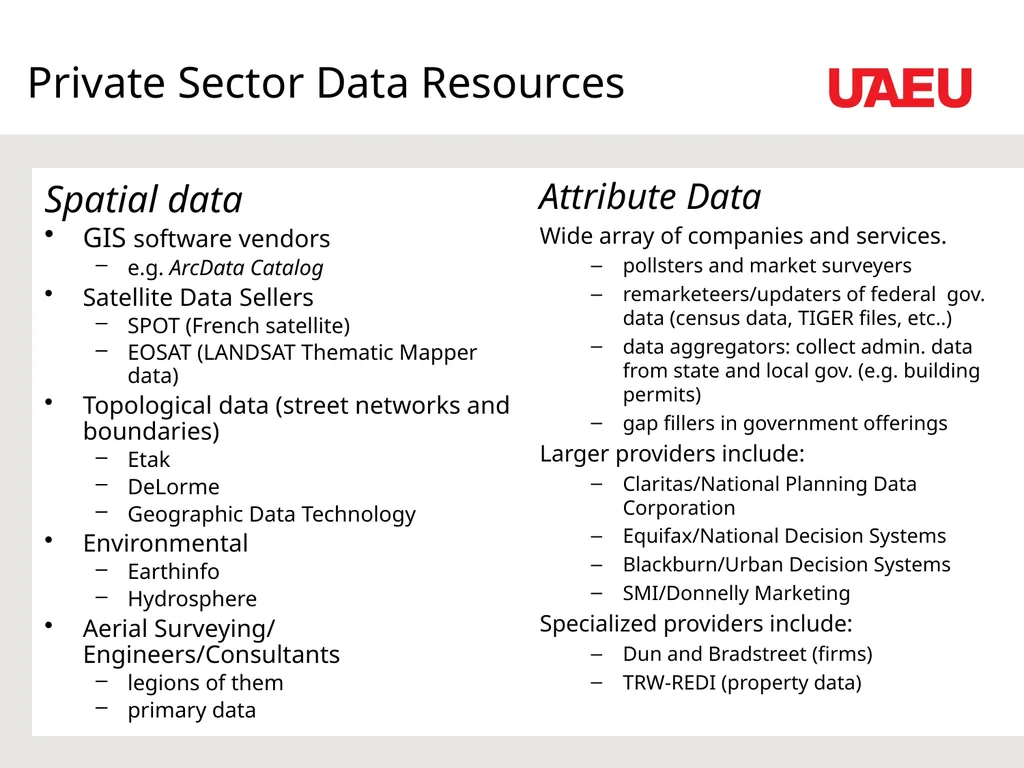
slide14. Private Sector Data Resources Spatial data
GIS software vendors
e.g. ArcData Catalog
Satellite Data Sellers
SPOT (French satellite)
EOSAT (LANDSAT Thematic Mapper data)
Topological data (street networks and boundaries)
Etak
DeLorme
Geographic Data Technology
Environmental
Earthinfo
Hydrosphere
Aerial Surveying/ Engineers/Consultants
legions of them
primary data Attribute Data
Wide array of companies and services.
pollsters and market surveyers
remarketeers/updaters of federal gov. data (census data, TIGER files, etc..)
data aggregators: collect admin. data from state and local gov. (e.g. building permits)
gap fillers in government offerings
Larger providers include:
Claritas/National Planning Data Corporation
Equifax/National Decision Systems
Blackburn/Urban Decision Systems
SMI/Donnelly Marketing
Specialized providers include:
Dun and Bradstreet (firms)
TRW-REDI (property data)<br>
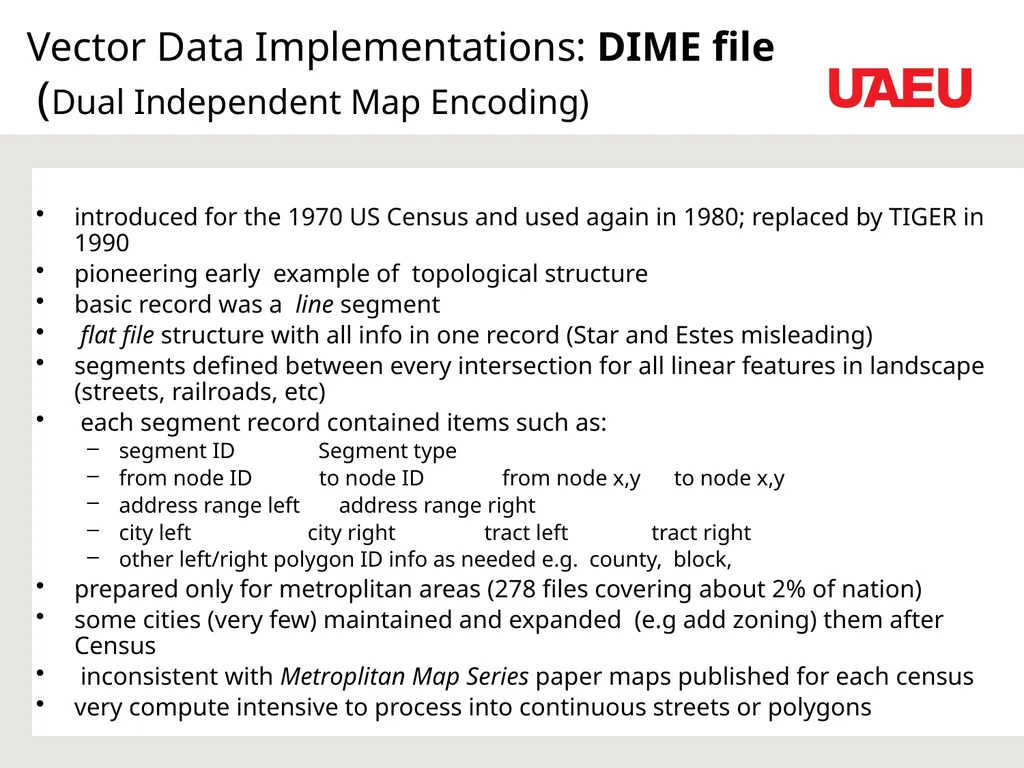
slide15. Vector Data Implementations: DIME file (Dual Independent Map Encoding) introduced for the 1970 US Census and used again in 1980; replaced by TIGER in 1990
pioneering early example of topological structure
basic record was a line segment
flat file structure with all info in one record (Star and Estes misleading)
segments defined between every intersection for all linear features in landscape (streets, railroads, etc)
each segment record contained items such as:
segment ID Segment type
from node ID to node ID from node x,y to node x,y
address range left address range right
city left city right tract left tract right
other left/right polygon ID info as needed e.g. county, block,
prepared only for metroplitan areas (278 files covering about 2% of nation)
some cities (very few) maintained and expanded (e.g add zoning) them after Census
inconsistent with Metroplitan Map Series paper maps published for each census
very compute intensive to process into continuous streets or polygons<br>
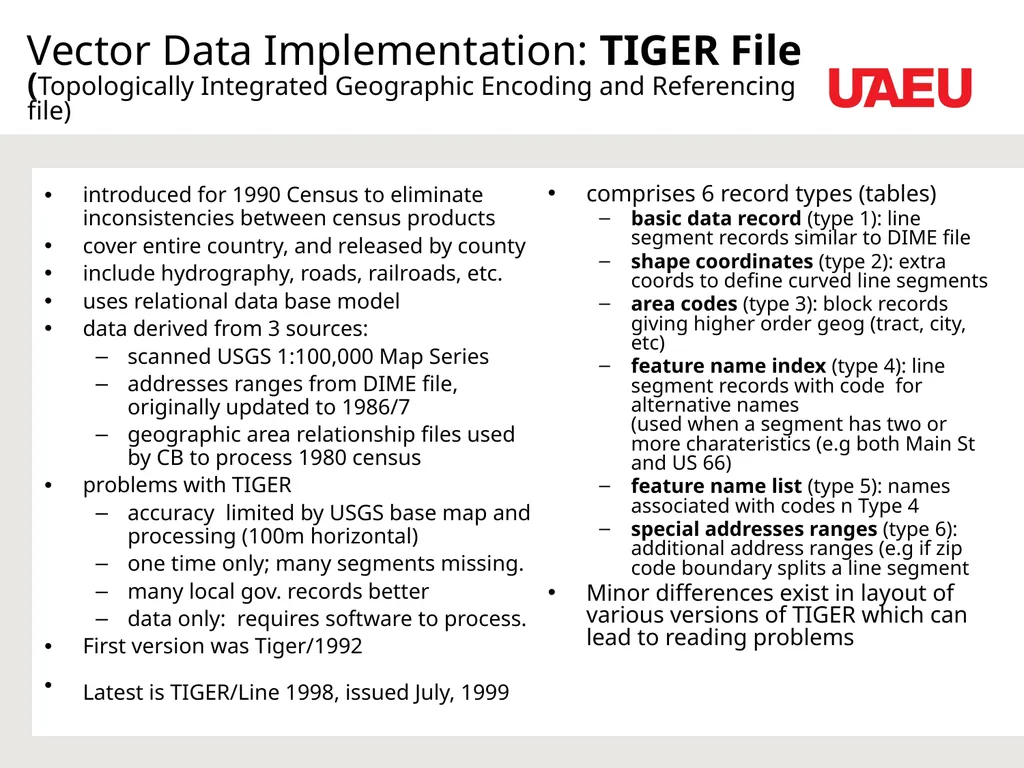
slide16. Vector Data Implementation: TIGER File (Topologically Integrated Geographic Encoding and Referencing file) introduced for 1990 Census to eliminate inconsistencies between census products
cover entire country, and released by county
include hydrography, roads, railroads, etc.
uses relational data base model
data derived from 3 sources:
scanned USGS 1:100,000 Map Series
addresses ranges from DIME file, originally updated to 1986/7
geographic area relationship files used by CB to process 1980 census
problems with TIGER
accuracy limited by USGS base map and processing (100m horizontal)
one time only; many segments missing.
many local gov. records better
data only: requires software to process.
First version was Tiger/1992
Latest is TIGER/Line 1998, issued July, 1999 comprises 6 record types (tables)
basic data record (type 1): line segment records similar to DIME file
shape coordinates (type 2): extra coords to define curved line segments
area codes (type 3): block records giving higher order geog (tract, city, etc)
feature name index (type 4): line segment records with code for alternative names (used when a segment has two or more charateristics (e.g both Main St and US 66)
feature name list (type 5): names associated with codes n Type 4
special addresses ranges (type 6): additional address ranges (e.g if zip code boundary splits a line segment
Minor differences exist in layout of various versions of TIGER which can lead to reading problems<br>
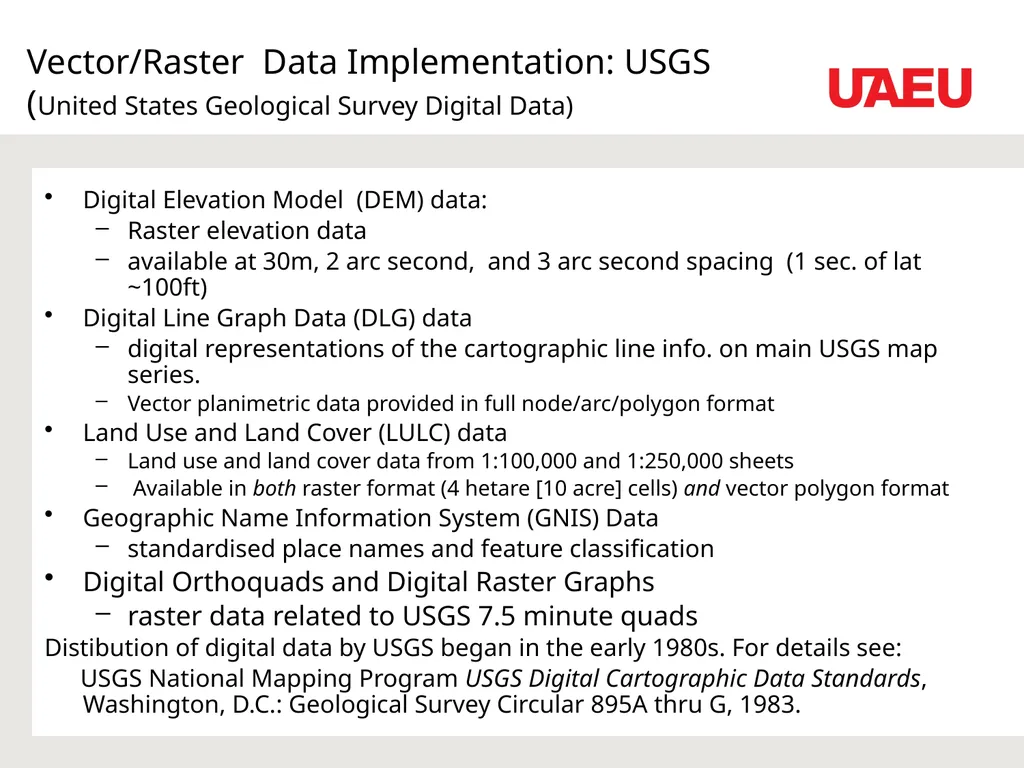
slide17. Vector/Raster Data Implementation: USGS (United States Geological Survey Digital Data) Digital Elevation Model (DEM) data:
Raster elevation data
available at 30m, 2 arc second, and 3 arc second spacing (1 sec. of lat ~100ft)
Digital Line Graph Data (DLG) data
digital representations of the cartographic line info. on main USGS map series.
Vector planimetric data provided in full node/arc/polygon format
Land Use and Land Cover (LULC) data
Land use and land cover data from 1:100,000 and 1:250,000 sheets
Available in both raster format (4 hetare [10 acre] cells) and vector polygon format
Geographic Name Information System (GNIS) Data
standardised place names and feature classification
Digital Orthoquads and Digital Raster Graphs
raster data related to USGS 7.5 minute quads
Distibution of digital data by USGS began in the early 1980s. For details see:
USGS National Mapping Program USGS Digital Cartographic Data Standards, Washington, D.C.: Geological Survey Circular 895A thru G, 1983.<br>
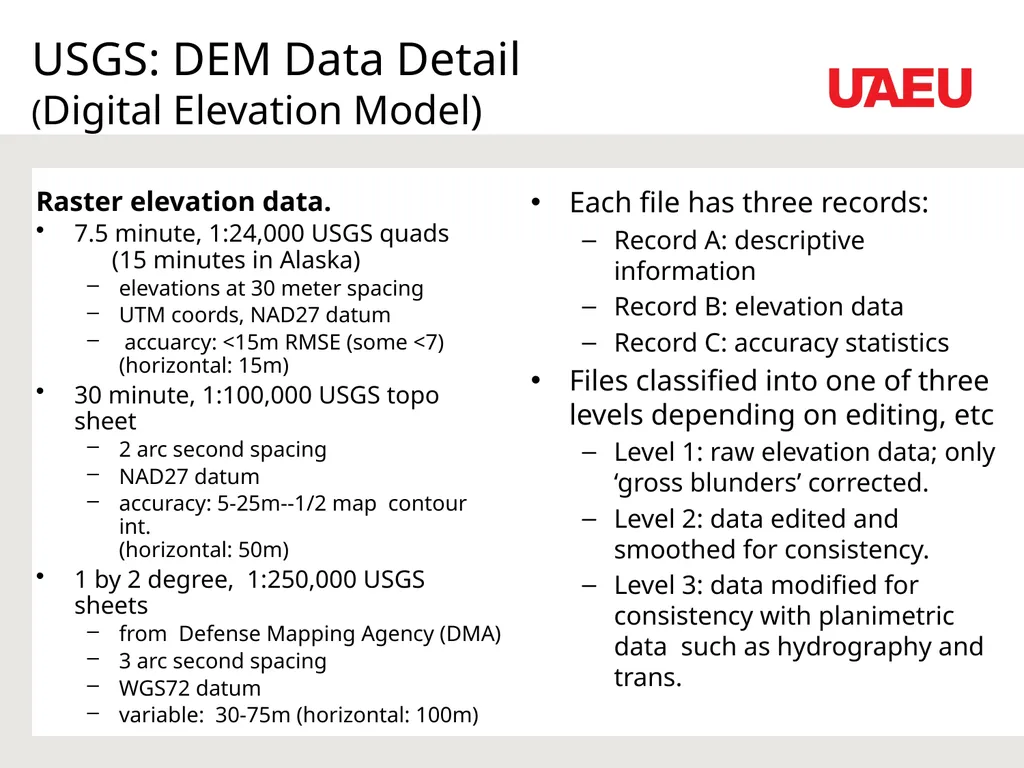
slide18. USGS: DEM Data Detail (Digital Elevation Model) Raster elevation data.
7.5 minute, 1:24,000 USGS quads (15 minutes in Alaska)
elevations at 30 meter spacing
UTM coords, NAD27 datum
accuarcy: <15m RMSE (some <7) (horizontal: 15m)
30 minute, 1:100,000 USGS topo sheet
2 arc second spacing
NAD27 datum
accuracy: 5-25m--1/2 map contour int. (horizontal: 50m)
1 by 2 degree, 1:250,000 USGS sheets
from Defense Mapping Agency (DMA)
3 arc second spacing
WGS72 datum
variable: 30-75m (horizontal: 100m) Each file has three records:
Record A: descriptive information
Record B: elevation data
Record C: accuracy statistics
Files classified into one of three levels depending on editing, etc
Level 1: raw elevation data; only ‘gross blunders’ corrected.
Level 2: data edited and smoothed for consistency.
Level 3: data modified for consistency with planimetric data such as hydrography and trans.<br>
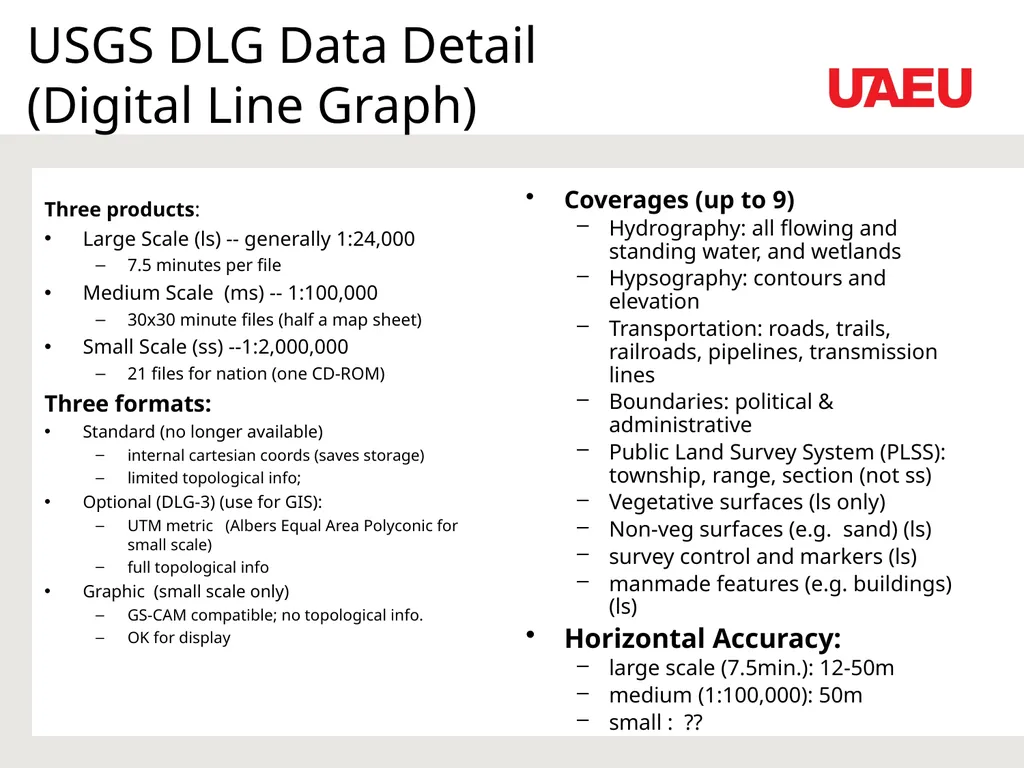
slide19. USGS DLG Data Detail (Digital Line Graph) Three products:
Large Scale (ls) -- generally 1:24,000
7.5 minutes per file
Medium Scale (ms) -- 1:100,000
30x30 minute files (half a map sheet)
Small Scale (ss) --1:2,000,000
21 files for nation (one CD-ROM)
Three formats:
Standard (no longer available)
internal cartesian coords (saves storage)
limited topological info;
Optional (DLG-3) (use for GIS):
UTM metric (Albers Equal Area Polyconic for small scale)
full topological info
Graphic (small scale only)
GS-CAM compatible; no topological info.
OK for display Coverages (up to 9)
Hydrography: all flowing and standing water, and wetlands
Hypsography: contours and elevation
Transportation: roads, trails, railroads, pipelines, transmission lines
Boundaries: political & administrative
Public Land Survey System (PLSS): township, range, section (not ss)
Vegetative surfaces (ls only)
Non-veg surfaces (e.g. sand) (ls)
survey control and markers (ls)
manmade features (e.g. buildings)(ls)
Horizontal Accuracy:
large scale (7.5min.): 12-50m
medium (1:100,000): 50m
small : ??<br>
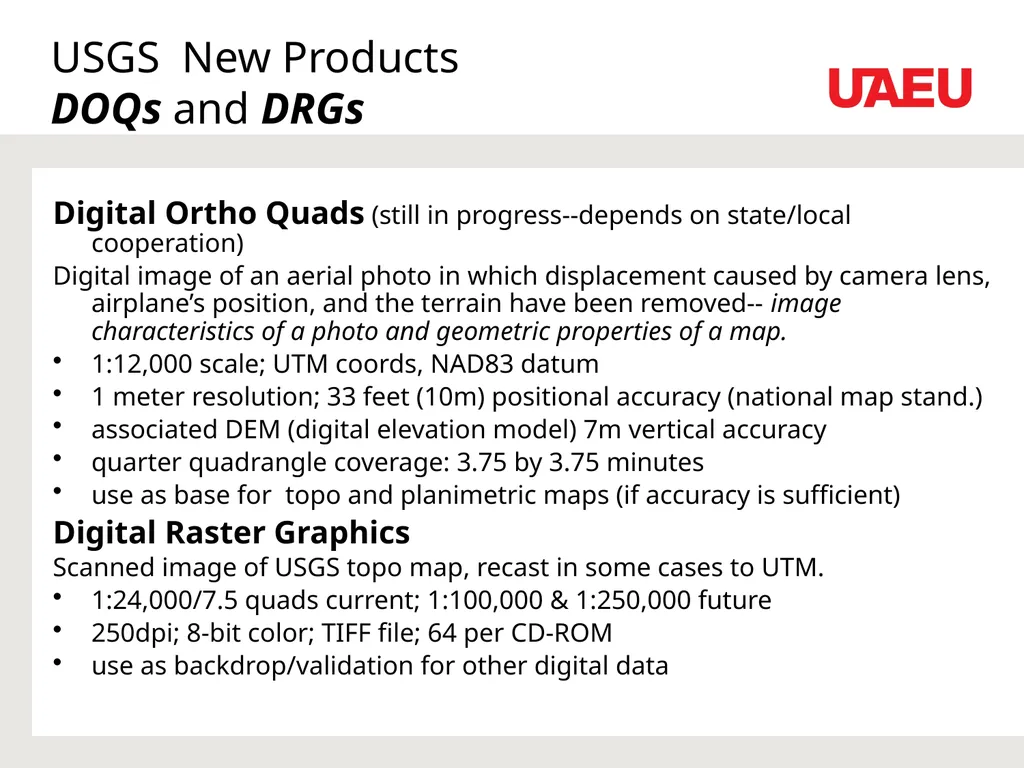
slide20. USGS New Products DOQs and DRGs Digital Ortho Quads (still in progress--depends on state/local cooperation)
Digital image of an aerial photo in which displacement caused by camera lens, airplane’s position, and the terrain have been removed-- image characteristics of a photo and geometric properties of a map.
1:12,000 scale; UTM coords, NAD83 datum
1 meter resolution; 33 feet (10m) positional accuracy (national map stand.)
associated DEM (digital elevation model) 7m vertical accuracy
quarter quadrangle coverage: 3.75 by 3.75 minutes
use as base for topo and planimetric maps (if accuracy is sufficient)
Digital Raster Graphics
Scanned image of USGS topo map, recast in some cases to UTM.
1:24,000/7.5 quads current; 1:100,000 & 1:250,000 future
250dpi; 8-bit color; TIFF file; 64 per CD-ROM
use as backdrop/validation for other digital data<br>
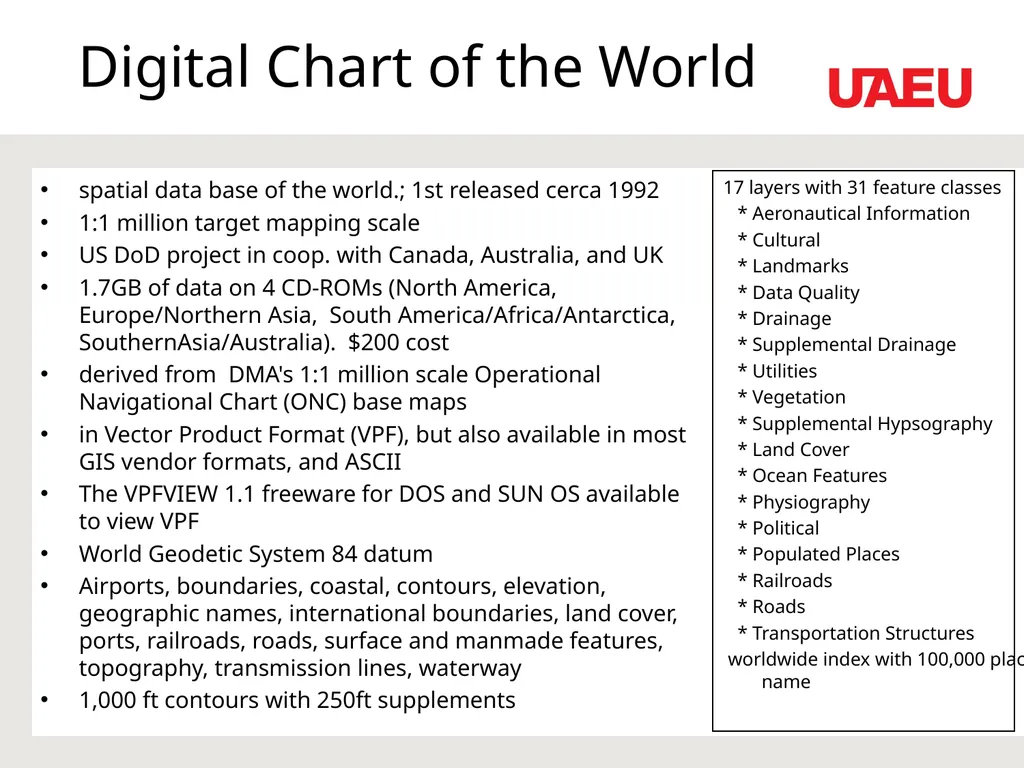
slide21. Digital Chart of the World spatial data base of the world.; 1st released cerca 1992
1:1 million target mapping scale
US DoD project in coop. with Canada, Australia, and UK
1.7GB of data on 4 CD-ROMs (North America, Europe/Northern Asia, South America/Africa/Antarctica, SouthernAsia/Australia). $200 cost
derived from DMA's 1:1 million scale Operational Navigational Chart (ONC) base maps
in Vector Product Format (VPF), but also available in most GIS vendor formats, and ASCII
The VPFVIEW 1.1 freeware for DOS and SUN OS available to view VPF
World Geodetic System 84 datum
Airports, boundaries, coastal, contours, elevation, geographic names, international boundaries, land cover, ports, railroads, roads, surface and manmade features, topography, transmission lines, waterway
1,000 ft contours with 250ft supplements 17 layers with 31 feature classes
* Aeronautical Information
* Cultural
* Landmarks
* Data Quality
* Drainage
* Supplemental Drainage
* Utilities
* Vegetation
* Supplemental Hypsography
* Land Cover
* Ocean Features
* Physiography
* Political
* Populated Places
* Railroads
* Roads
* Transportation Structures
worldwide index with 100,000 place name<br>
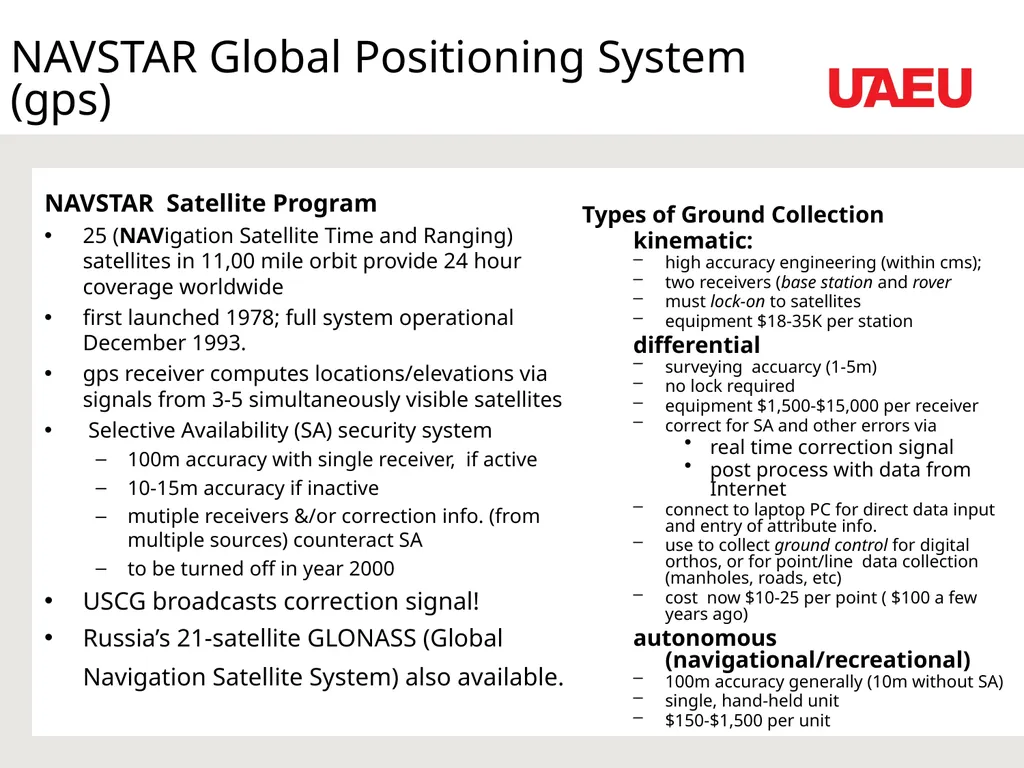
slide22. NAVSTAR Global Positioning System (gps) NAVSTAR Satellite Program
25 (NAVigation Satellite Time and Ranging) satellites in 11,00 mile orbit provide 24 hour coverage worldwide
first launched 1978; full system operational December 1993.
gps receiver computes locations/elevations via signals from 3-5 simultaneously visible satellites
Selective Availability (SA) security system
100m accuracy with single receiver, if active
10-15m accuracy if inactive
mutiple receivers &/or correction info. (from multiple sources) counteract SA
to be turned off in year 2000
USCG broadcasts correction signal!
Russia’s 21-satellite GLONASS (Global Navigation Satellite System) also available. Types of Ground Collection
kinematic:
high accuracy engineering (within cms);
two receivers (base station and rover
must lock-on to satellites
equipment $18-35K per station
differential
surveying accuarcy (1-5m)
no lock required
equipment $1,500-$15,000 per receiver
correct for SA and other errors via
real time correction signal
post process with data from Internet
connect to laptop PC for direct data input and entry of attribute info.
use to collect ground control for digital orthos, or for point/line data collection (manholes, roads, etc)
cost now $10-25 per point ( $100 a few years ago)
autonomous (navigational/recreational)
100m accuracy generally (10m without SA)
single, hand-held unit
$150-$1,500 per unit<br>
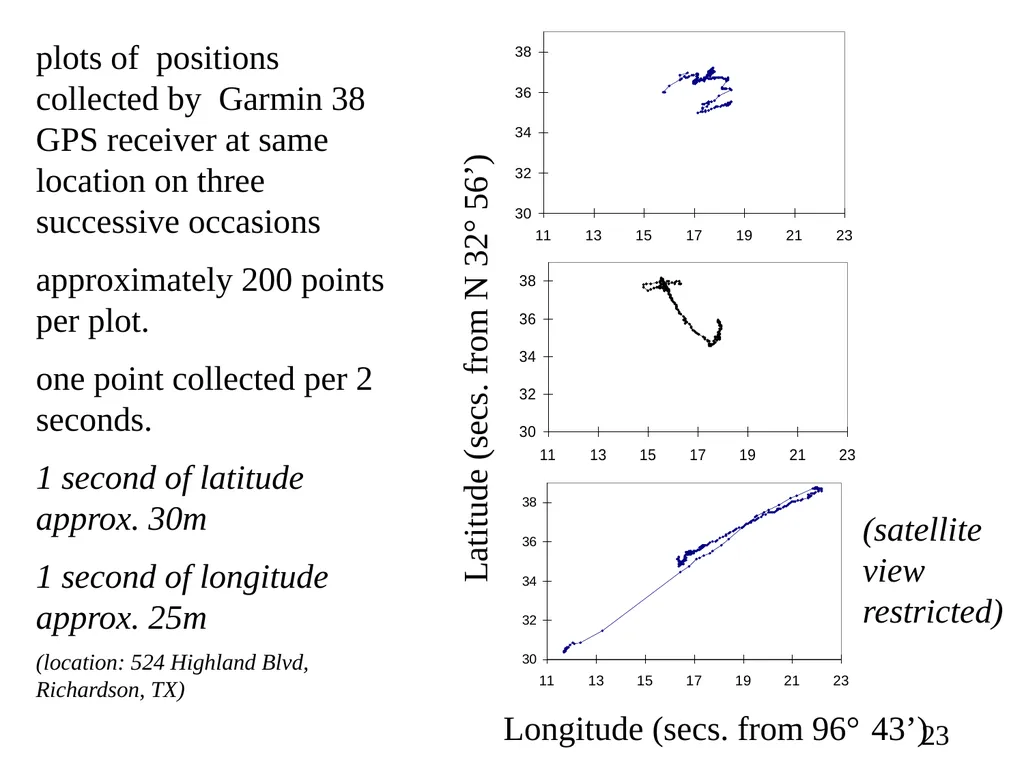
slide23. Longitude (secs. from 96° 43’) Latitude (secs. from N 32° 56’) plots of positions collected by Garmin 38 GPS receiver at same location on three successive occasions
approximately 200 points per plot.
one point collected per 2 seconds.
1 second of latitude approx. 30m
1 second of longitude approx. 25m
(location: 524 Highland Blvd, Richardson, TX) (satellite
view
restricted)<br>
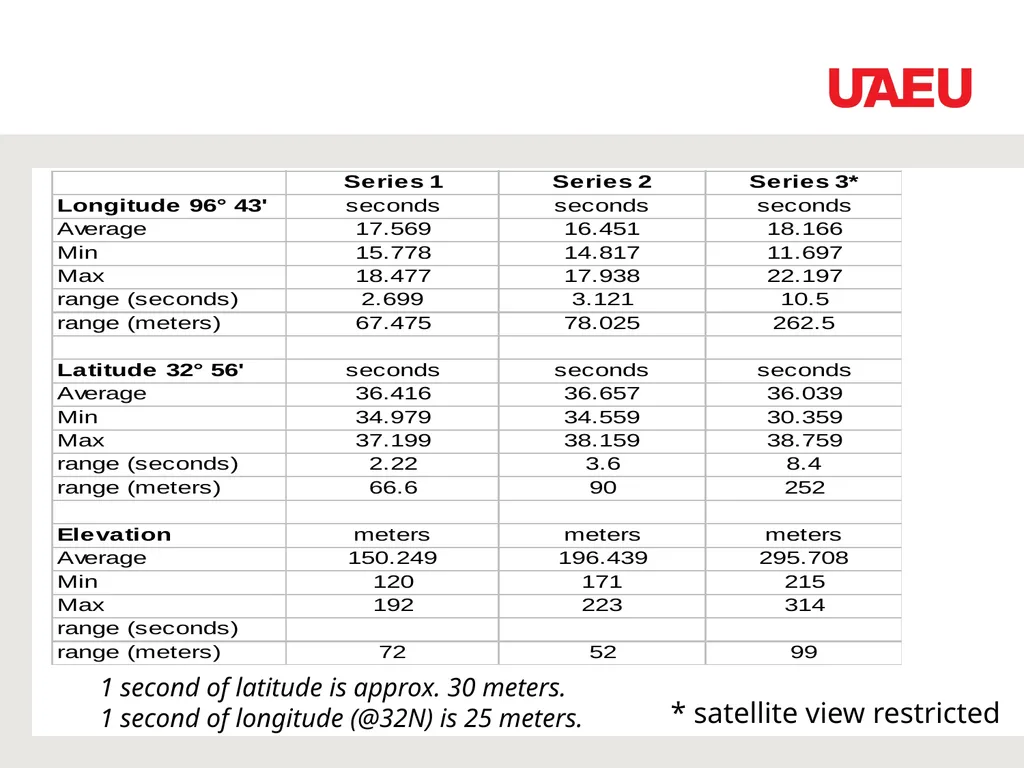
slide24. 1 second of latitude is approx. 30 meters.
1 second of longitude (@32N) is 25 meters. * satellite view restricted<br>
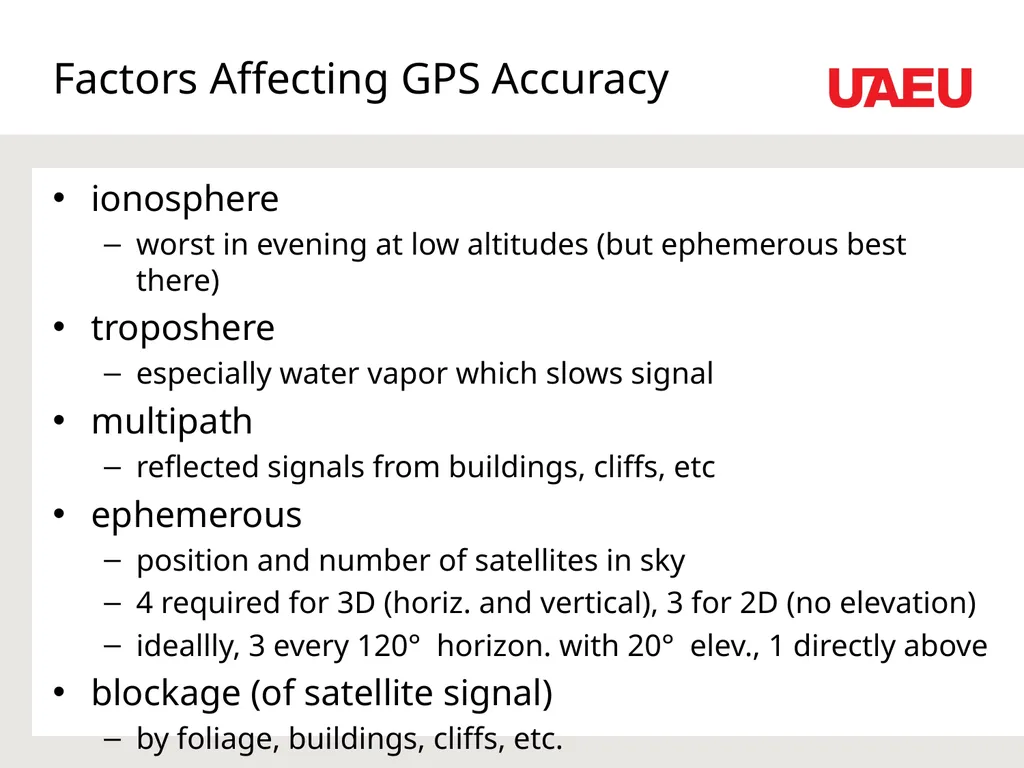
slide25. Factors Affecting GPS Accuracy ionosphere
worst in evening at low altitudes (but ephemerous best there)
troposhere
especially water vapor which slows signal
multipath
reflected signals from buildings, cliffs, etc
ephemerous
position and number of satellites in sky
4 required for 3D (horiz. and vertical), 3 for 2D (no elevation)
ideallly, 3 every 120° horizon. with 20° elev., 1 directly above
blockage (of satellite signal)
by foliage, buildings, cliffs, etc.<br>
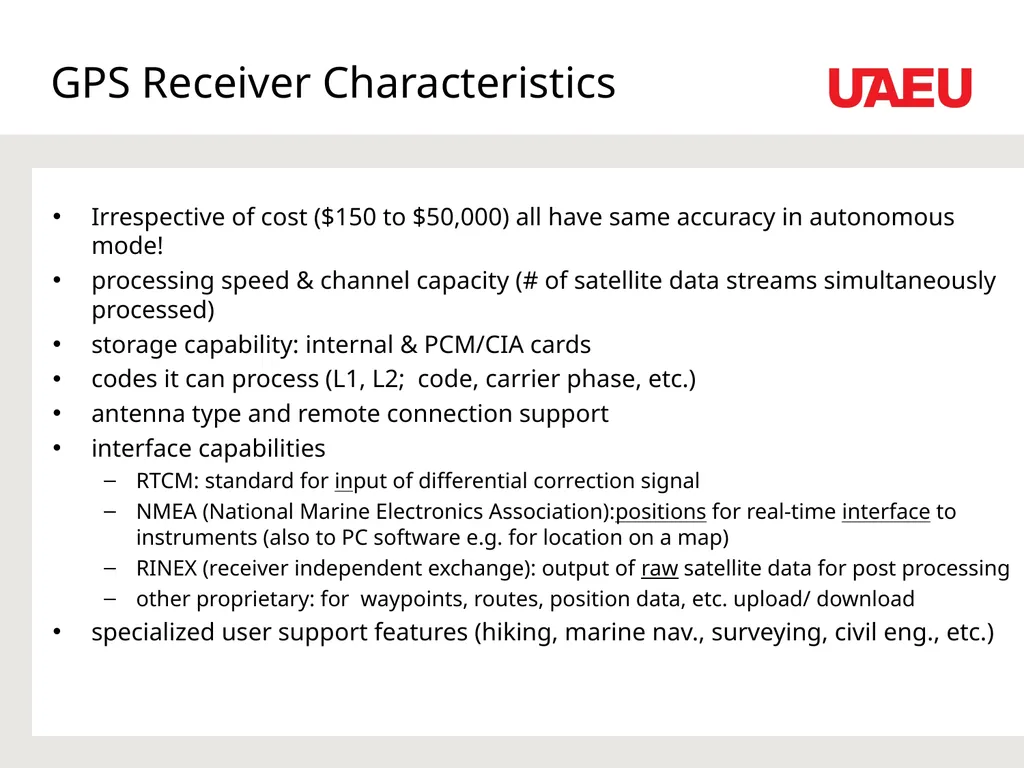
slide26. GPS Receiver Characteristics Irrespective of cost ($150 to $50,000) all have same accuracy in autonomous mode!
processing speed & channel capacity (# of satellite data streams simultaneously processed)
storage capability: internal & PCM/CIA cards
codes it can process (L1, L2; code, carrier phase, etc.)
antenna type and remote connection support
interface capabilities
RTCM: standard for input of differential correction signal
NMEA (National Marine Electronics Association):positions for real-time interface to instruments (also to PC software e.g. for location on a map)
RINEX (receiver independent exchange): output of raw satellite data for post processing
other proprietary: for waypoints, routes, position data, etc. upload/ download
specialized user support features (hiking, marine nav., surveying, civil eng., etc.)<br>
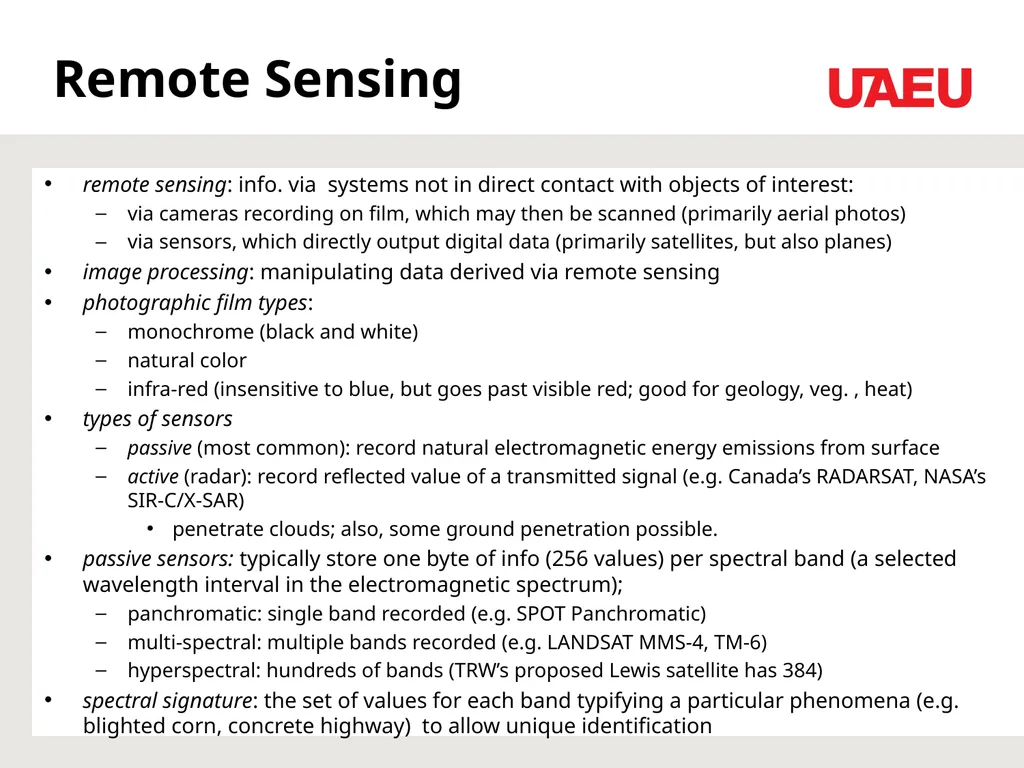
slide27. Remote Sensing remote sensing: info. via systems not in direct contact with objects of interest:
via cameras recording on film, which may then be scanned (primarily aerial photos)
via sensors, which directly output digital data (primarily satellites, but also planes)
image processing: manipulating data derived via remote sensing
photographic film types:
monochrome (black and white)
natural color
infra-red (insensitive to blue, but goes past visible red; good for geology, veg. , heat)
types of sensors
passive (most common): record natural electromagnetic energy emissions from surface
active (radar): record reflected value of a transmitted signal (e.g. Canada’s RADARSAT, NASA’s SIR-C/X-SAR)
penetrate clouds; also, some ground penetration possible.
passive sensors: typically store one byte of info (256 values) per spectral band (a selected wavelength interval in the electromagnetic spectrum);
panchromatic: single band recorded (e.g. SPOT Panchromatic)
multi-spectral: multiple bands recorded (e.g. LANDSAT MMS-4, TM-6)
hyperspectral: hundreds of bands (TRW’s proposed Lewis satellite has 384)
spectral signature: the set of values for each band typifying a particular phenomena (e.g. blighted corn, concrete highway) to allow unique identification<br>
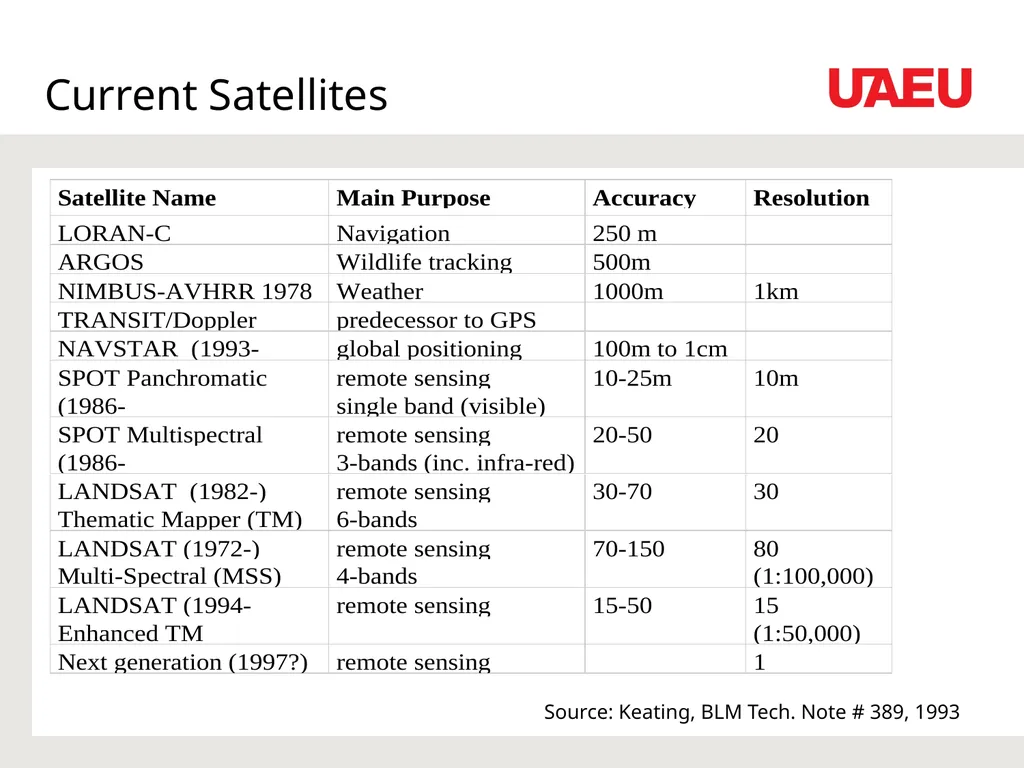
slide28. Current Satellites Source: Keating, BLM Tech. Note # 389, 1993<br>
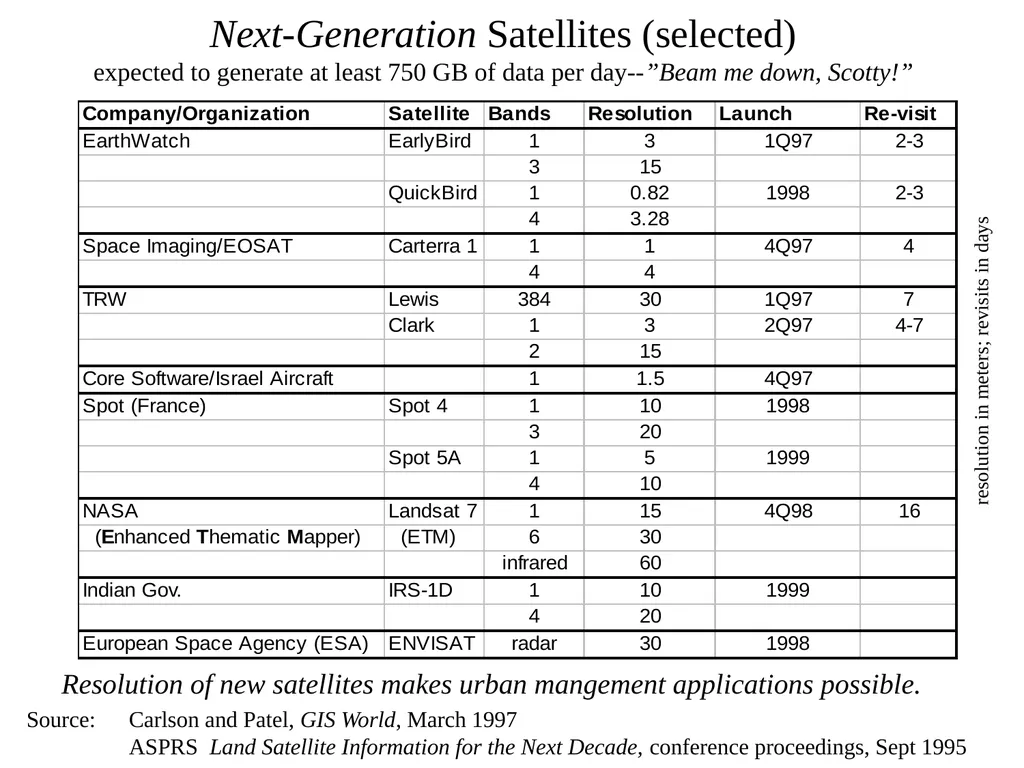
slide29. Next-Generation Satellites (selected) expected to generate at least 750 GB of data per day--”Beam me down, Scotty!” Source: Carlson and Patel, GIS World, March 1997
ASPRS Land Satellite Information for the Next Decade, conference proceedings, Sept 1995 resolution in meters; revisits in days Resolution of new satellites makes urban mangement applications possible.<br>
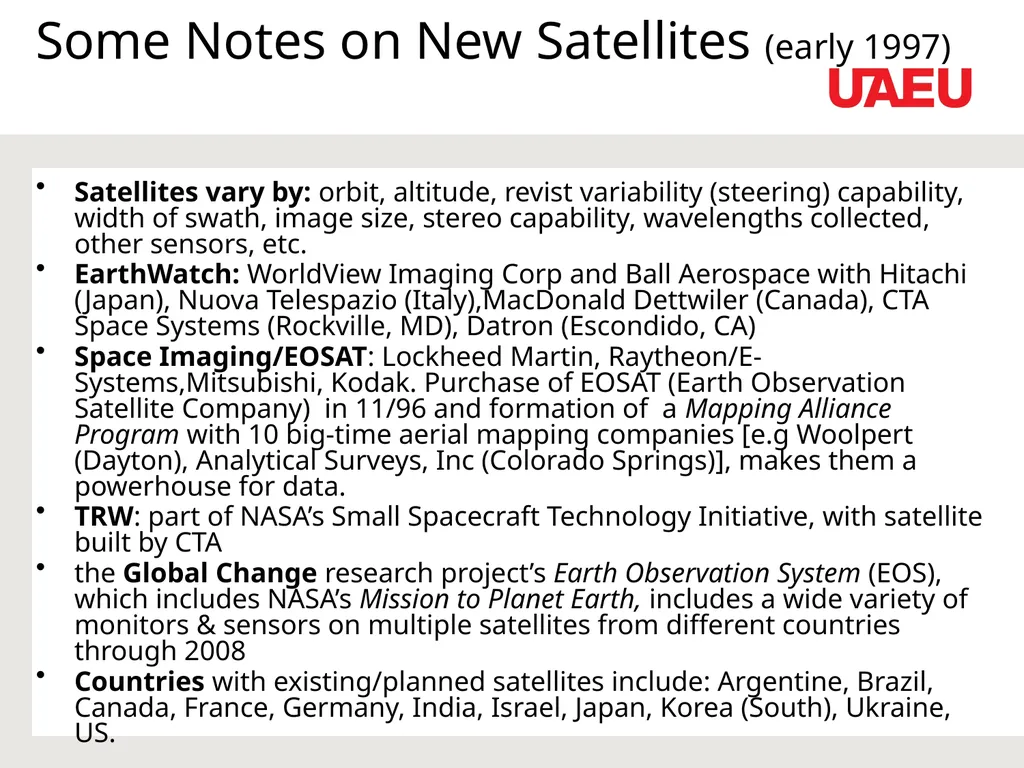
slide30. Some Notes on New Satellites (early 1997) Satellites vary by: orbit, altitude, revist variability (steering) capability, width of swath, image size, stereo capability, wavelengths collected, other sensors, etc.
EarthWatch: WorldView Imaging Corp and Ball Aerospace with Hitachi (Japan), Nuova Telespazio (Italy),MacDonald Dettwiler (Canada), CTA Space Systems (Rockville, MD), Datron (Escondido, CA)
Space Imaging/EOSAT: Lockheed Martin, Raytheon/E-Systems,Mitsubishi, Kodak. Purchase of EOSAT (Earth Observation Satellite Company) in 11/96 and formation of a Mapping Alliance Program with 10 big-time aerial mapping companies [e.g Woolpert (Dayton), Analytical Surveys, Inc (Colorado Springs)], makes them a powerhouse for data.
TRW: part of NASA’s Small Spacecraft Technology Initiative, with satellite built by CTA
the Global Change research project’s Earth Observation System (EOS), which includes NASA’s Mission to Planet Earth, includes a wide variety of monitors & sensors on multiple satellites from different countries through 2008
Countries with existing/planned satellites include: Argentine, Brazil, Canada, France, Germany, India, Israel, Japan, Korea (South), Ukraine, US.<br>
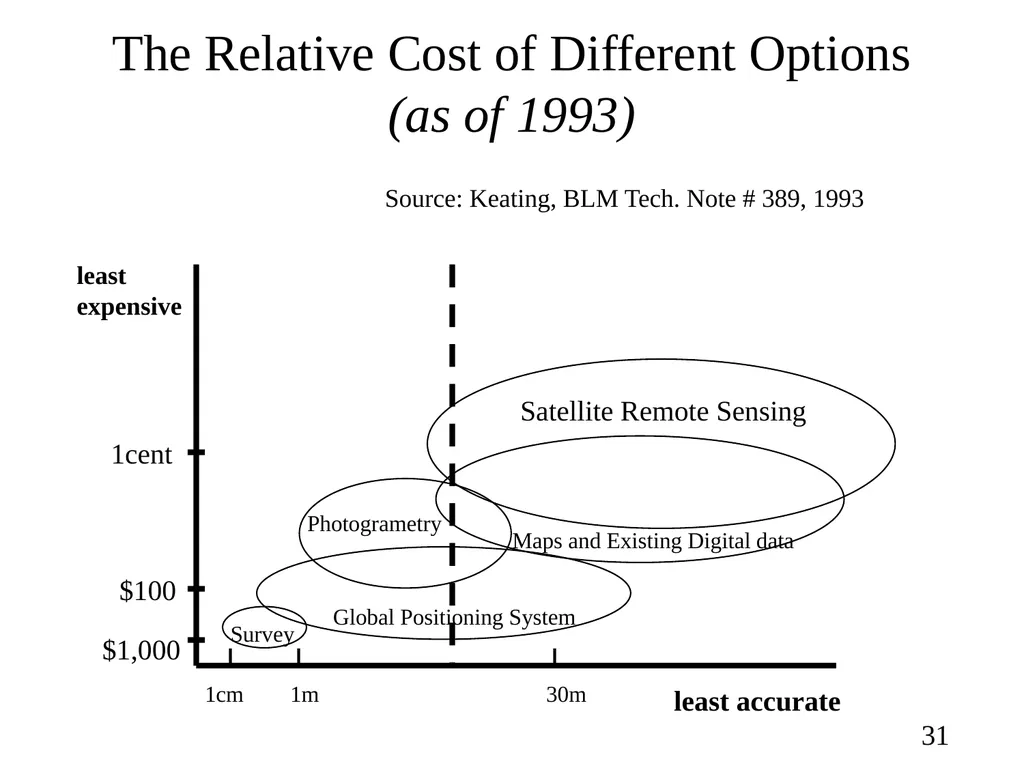
slide31. The Relative Cost of Different Options (as of 1993) Satellite Remote Sensing Maps and Existing Digital data Photogrametry Global Positioning System Survey 1cm 1m 30m 1cent $100 $1,000 least accurate least
expensive Source: Keating, BLM Tech. Note # 389, 1993<br>
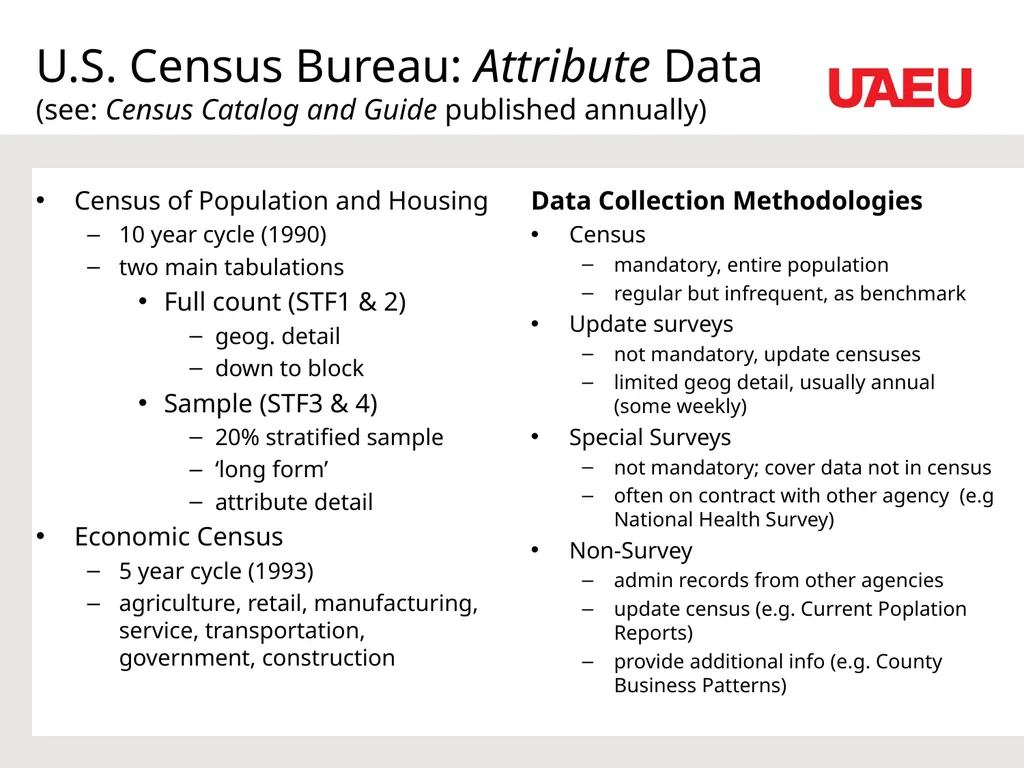
slide32. U.S. Census Bureau: Attribute Data (see: Census Catalog and Guide published annually) Census of Population and Housing
10 year cycle (1990)
two main tabulations
Full count (STF1 & 2)
geog. detail
down to block
Sample (STF3 & 4)
20% stratified sample
‘long form’
attribute detail
Economic Census
5 year cycle (1993)
agriculture, retail, manufacturing, service, transportation, government, construction Data Collection Methodologies
Census
mandatory, entire population
regular but infrequent, as benchmark
Update surveys
not mandatory, update censuses
limited geog detail, usually annual (some weekly)
Special Surveys
not mandatory; cover data not in census
often on contract with other agency (e.g National Health Survey)
Non-Survey
admin records from other agencies
update census (e.g. Current Poplation Reports)
provide additional info (e.g. County Business Patterns)<br>
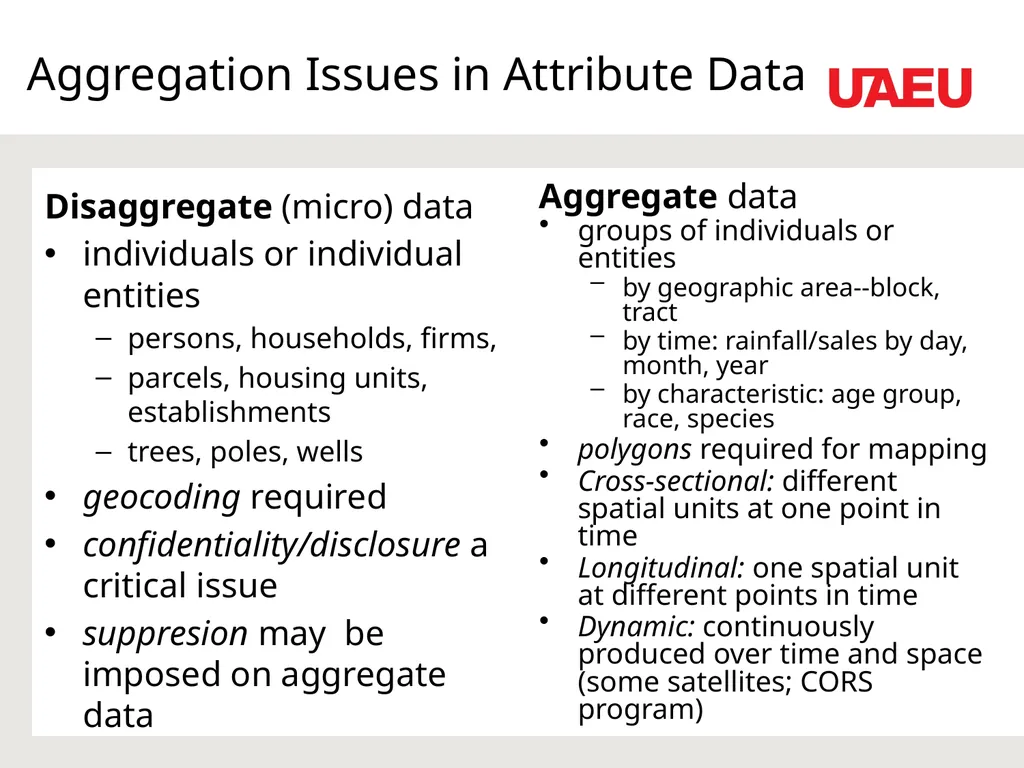
slide33. Aggregation Issues in Attribute Data Disaggregate (micro) data
individuals or individual entities
persons, households, firms,
parcels, housing units, establishments
trees, poles, wells
geocoding required
confidentiality/disclosure a critical issue
suppresion may be imposed on aggregate data Aggregate data
groups of individuals or entities
by geographic area--block, tract
by time: rainfall/sales by day, month, year
by characteristic: age group, race, species
polygons required for mapping
Cross-sectional: different spatial units at one point in time
Longitudinal: one spatial unit at different points in time
Dynamic: continuously produced over time and space (some satellites; CORS program)<br>
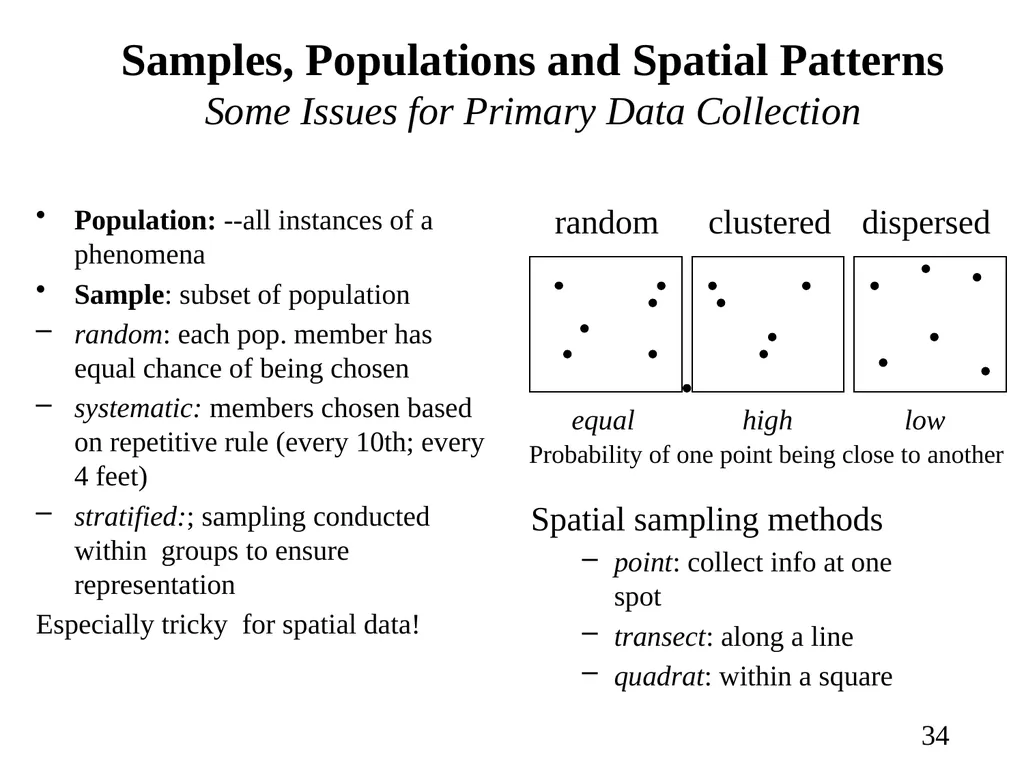
slide34. Samples, Populations and Spatial Patterns Some Issues for Primary Data Collection Population: --all instances of a phenomena
Sample: subset of population
random: each pop. member has equal chance of being chosen
systematic: members chosen based on repetitive rule (every 10th; every 4 feet)
stratified:; sampling conducted within groups to ensure representation
Especially tricky for spatial data! random Spatial sampling methods
point: collect info at one spot
transect: along a line
quadrat: within a square clustered dispersed Probability of one point being close to another equal high low<br>
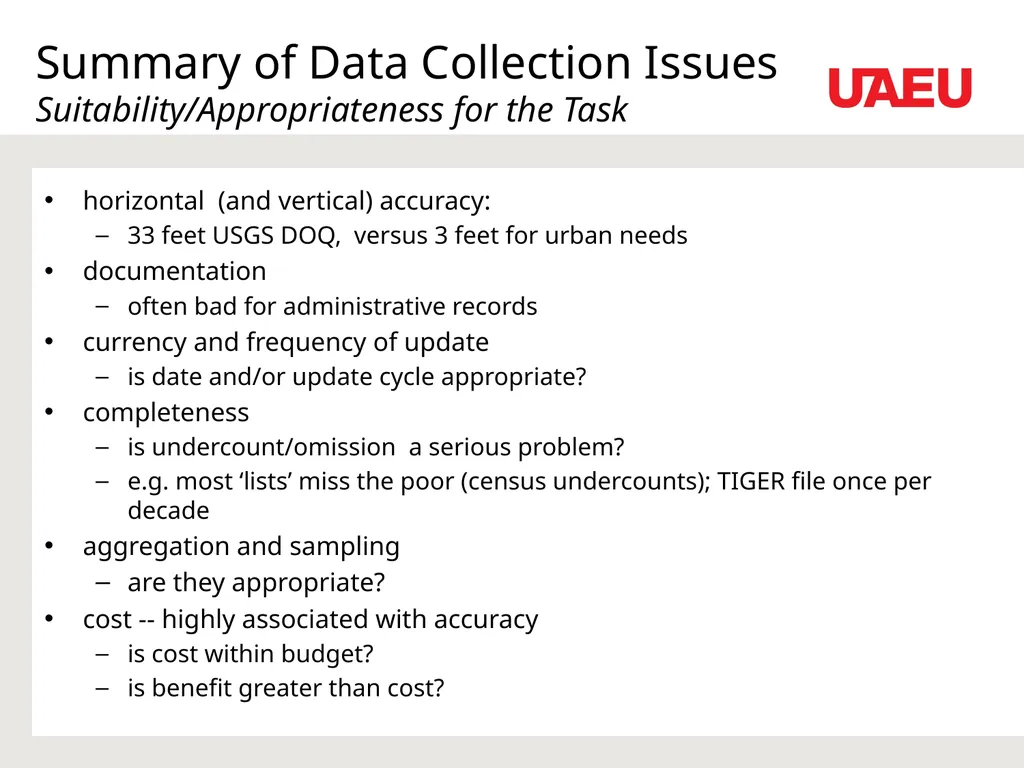
slide35. Summary of Data Collection Issues Suitability/Appropriateness for the Task horizontal (and vertical) accuracy:
33 feet USGS DOQ, versus 3 feet for urban needs
documentation
often bad for administrative records
currency and frequency of update
is date and/or update cycle appropriate?
completeness
is undercount/omission a serious problem?
e.g. most ‘lists’ miss the poor (census undercounts); TIGER file once per decade
aggregation and sampling
are they appropriate?
cost -- highly associated with accuracy
is cost within budget?
is benefit greater than cost?<br>
abintouq@uaeu.ac.ae
http://faculty.uaeu.ac.ae/~abintouq
GEO 440: GIS for Urban & Regional Planning<br>
slide2. Data Sources and Conversion Feeding the GIS Discussion here focuses more on projects than organization-wide implementation.
Like a teenager, a GIS can consume more than data you ever imagined!
Often, data collection is an end in itself. Almost invariably, it’s the costliest element of any project-- > 80%.<br>
slide3. Data Sources and Conversion Feeding the GIS. Discussion here focuses more on projects than organization-wide implementation.
Like a teenager, a GIS can consume more than data you ever imagined!
Often, data collection is an end in itself. Almost invariably, it’s the costliest element of any project-- > 80%.<br>
slide4. Where do I get data? & What form is it in? Where?
Secondary: existing data
already published/available
special tabulation/contract
Administrative records: data as by-product
within your organization
other organizations
Primary data: from scratch
developed in-house (DIY)
contracted out
(field work is always slow and expensive!)
What format?
machine readable (digital)
hardcopy (paper, maps) Spatial data in digital form is the most valuable since this is generally the most expensive to obtain.<br>
slide5. Don’t forget to look in-house! collected by your organization as data
by-product of normal agency operations
acquired for some other project
Don’t forget to look, especially if it’s a large organization. There may already be a GIS project in existense or about to be launched!<br>
slide6. Major GIS Data Sources Maps
Drawings (sketch or engineering)
Aerial (or other) Photographs
Satellite Imagery
CAD data bases
Government & commercial spatial (GIS) data bases
Government & commercial attribute data bases
Paper records and documents<br>
slide7. Pre-processing and Conversion: almost invariably required! Maps and Drawings
digitizing, or
scanning than raster to vector conversion
Aerial Photographs
photogrammetry/photo interpretation to extract features
digitizing or scanning to convert to digital
rectification and DTM (digital terrain model) to create digital orthos
Satellite Imagery
rectification and DTM to create digital orthos (if desired)
CAD Data Bases
translator software (pre-existing or custom-written) needed to convert to required GIS format GIS Data Bases
conversion between proprietary standards (ARC/INFO, Intergraph, AutoCAD, etc.)
Spatial Data Transfer Standard
Attribute Databases
geocoding if micro data
conversion between geographic units (e.g. zip codes and census tracts)
conversion between different databases
Records and Documents
OCR (optical character recognition) scanning
keyboarding
then, same as attribute data bases<br>
slide8. Data Conversions: general comments Paper Maps to Digital
generally the most complex & expensive
automated extraction of layers problematic and error prone
requires scanning then raster to vector conversion
digitizing may be freehand with tablet, or “heads-up” on screen<br>
slide9. Data Conversions: general comments Digital to Digital Conversions
Safe Software’s Feature Manipulation Engine (FME) product provides translation between different vendor’s GIS formats
spreadsheet software (Excel) is a powerful beginning point for converting to required database format (e.g. to .dbf for ArcView)
specialized conversion packages for converting between different databases also available e.g. DBMS/Copy Plus, Data Junction
efforts at standardization, which reduces need for conversions, have had limited success ‘cos of competitive pressures
FGDC’s, Spatial Data Transfer Standard (SDTS), is a federal standard
Open GIS Consortium, a vendor and user group, lobbies for standards and non-proprietary approaches to GIS database creation<br>
slide10. Data Conversion: hints on the process NEVER CONVERT ON THE ORIGINAL FILE ALWAYS A COPY.
ALWAYS convert in an unrelated sub-directory
Document each new file that is made in the conversion process.
Archive the original files on a readily available media
Automate as many processes as possible
Projections
Many like files
Replication of data for output Record all your steps while converting data formats, in a journal or notebook. You WILL use that same conversion sometime in the future<br>
slide11. Data Sources: Table of Contents Overview
Federal Data Sources: Spatial Data
Federal & Non-profit Data Sources: Attribute data
Private Sector Data Resources: Spatial and Attribute
Selected Sources in Detail
DIME
TIGER
USGS: Overview
DEM detail
DLG Detail
DOQs and DLGs
Digital Chart of the World
NAVSTAR: gps
Remote Sensing
US Census Bureau Attribute Data
Primary Data Collection: Some Issues As of Fall, 1999, single best web index to available data is:
http://cast.uark.edu/local/hunt/index.html<br>
slide12. Federal Data Sources: Spatial Data Federal Data Agencies:
USGS (Geological Survey, National Mapping Div.--Interior)
all kinds of mapping, not just geology!
NGS (National Geodetic Service-- Commerce, part of NOAA)
geodetic surveying
[Ordnance Survey (in U.K.) combines both functions.]
Federal Mission Agencies
USDA (Agriculture)
Resource Conservation Service (formerly Soil Conservation Service)
US Forestry Service DoD (Defense)
National Imagery and Mapping Agency (NIMA)
originally Defense Mapping Agency (DMA)
US and world terrain mappings
NAVSTAR: gps satellites
US Army Corp. of Eng.: flood control
Interior
US Fish and Wildlife: wetlands
Bureau of Land Management
NASA (National Aeronautics and Space Administration
LANDSAT satellites
Commerce
Census Bureau: DIME & TIGER files
NOAA (National Oceanic and Atmospheric Administration)
AVHRR (Advanced Very High Resolution Radiometer) weather satellites<br>
slide13. Federal & Non-profit Data Sources: Attribute data Federal Data Agencies
CB (Census Bureau-- Dept of Commerce)
population and industry data from surveys
BEA (Bureau of Economic Analysis-- Dept. of Commerce)
STAT-US: national accounts
Federal Mission Agencies
Most federal agencies now have a stat. dept
Bureau of Labor Statistics
National Center for Health Statistics
National Center for Education Statistics
National Center for Criminal Justice Statistics
National Center for Transportation Statistics
Interstate Commerce Commission
Internal Revenue Service Non-profit interest groups:
Urban and Regional Information Systems Association (URISA)
National League of Cities
Population Reference Bureau
Transportation Assoc. of America
Trade Associations:
American Public Transit Assoc.
see Encyclopedia of Associations
Trade Publications
Progressive Grocer
see Business Periodicals Index
University Research Centers
University of Michigan, National Institute for Social Research<br>
slide14. Private Sector Data Resources Spatial data
GIS software vendors
e.g. ArcData Catalog
Satellite Data Sellers
SPOT (French satellite)
EOSAT (LANDSAT Thematic Mapper data)
Topological data (street networks and boundaries)
Etak
DeLorme
Geographic Data Technology
Environmental
Earthinfo
Hydrosphere
Aerial Surveying/ Engineers/Consultants
legions of them
primary data Attribute Data
Wide array of companies and services.
pollsters and market surveyers
remarketeers/updaters of federal gov. data (census data, TIGER files, etc..)
data aggregators: collect admin. data from state and local gov. (e.g. building permits)
gap fillers in government offerings
Larger providers include:
Claritas/National Planning Data Corporation
Equifax/National Decision Systems
Blackburn/Urban Decision Systems
SMI/Donnelly Marketing
Specialized providers include:
Dun and Bradstreet (firms)
TRW-REDI (property data)<br>
slide15. Vector Data Implementations: DIME file (Dual Independent Map Encoding) introduced for the 1970 US Census and used again in 1980; replaced by TIGER in 1990
pioneering early example of topological structure
basic record was a line segment
flat file structure with all info in one record (Star and Estes misleading)
segments defined between every intersection for all linear features in landscape (streets, railroads, etc)
each segment record contained items such as:
segment ID Segment type
from node ID to node ID from node x,y to node x,y
address range left address range right
city left city right tract left tract right
other left/right polygon ID info as needed e.g. county, block,
prepared only for metroplitan areas (278 files covering about 2% of nation)
some cities (very few) maintained and expanded (e.g add zoning) them after Census
inconsistent with Metroplitan Map Series paper maps published for each census
very compute intensive to process into continuous streets or polygons<br>
slide16. Vector Data Implementation: TIGER File (Topologically Integrated Geographic Encoding and Referencing file) introduced for 1990 Census to eliminate inconsistencies between census products
cover entire country, and released by county
include hydrography, roads, railroads, etc.
uses relational data base model
data derived from 3 sources:
scanned USGS 1:100,000 Map Series
addresses ranges from DIME file, originally updated to 1986/7
geographic area relationship files used by CB to process 1980 census
problems with TIGER
accuracy limited by USGS base map and processing (100m horizontal)
one time only; many segments missing.
many local gov. records better
data only: requires software to process.
First version was Tiger/1992
Latest is TIGER/Line 1998, issued July, 1999 comprises 6 record types (tables)
basic data record (type 1): line segment records similar to DIME file
shape coordinates (type 2): extra coords to define curved line segments
area codes (type 3): block records giving higher order geog (tract, city, etc)
feature name index (type 4): line segment records with code for alternative names (used when a segment has two or more charateristics (e.g both Main St and US 66)
feature name list (type 5): names associated with codes n Type 4
special addresses ranges (type 6): additional address ranges (e.g if zip code boundary splits a line segment
Minor differences exist in layout of various versions of TIGER which can lead to reading problems<br>
slide17. Vector/Raster Data Implementation: USGS (United States Geological Survey Digital Data) Digital Elevation Model (DEM) data:
Raster elevation data
available at 30m, 2 arc second, and 3 arc second spacing (1 sec. of lat ~100ft)
Digital Line Graph Data (DLG) data
digital representations of the cartographic line info. on main USGS map series.
Vector planimetric data provided in full node/arc/polygon format
Land Use and Land Cover (LULC) data
Land use and land cover data from 1:100,000 and 1:250,000 sheets
Available in both raster format (4 hetare [10 acre] cells) and vector polygon format
Geographic Name Information System (GNIS) Data
standardised place names and feature classification
Digital Orthoquads and Digital Raster Graphs
raster data related to USGS 7.5 minute quads
Distibution of digital data by USGS began in the early 1980s. For details see:
USGS National Mapping Program USGS Digital Cartographic Data Standards, Washington, D.C.: Geological Survey Circular 895A thru G, 1983.<br>
slide18. USGS: DEM Data Detail (Digital Elevation Model) Raster elevation data.
7.5 minute, 1:24,000 USGS quads (15 minutes in Alaska)
elevations at 30 meter spacing
UTM coords, NAD27 datum
accuarcy: <15m RMSE (some <7) (horizontal: 15m)
30 minute, 1:100,000 USGS topo sheet
2 arc second spacing
NAD27 datum
accuracy: 5-25m--1/2 map contour int. (horizontal: 50m)
1 by 2 degree, 1:250,000 USGS sheets
from Defense Mapping Agency (DMA)
3 arc second spacing
WGS72 datum
variable: 30-75m (horizontal: 100m) Each file has three records:
Record A: descriptive information
Record B: elevation data
Record C: accuracy statistics
Files classified into one of three levels depending on editing, etc
Level 1: raw elevation data; only ‘gross blunders’ corrected.
Level 2: data edited and smoothed for consistency.
Level 3: data modified for consistency with planimetric data such as hydrography and trans.<br>
slide19. USGS DLG Data Detail (Digital Line Graph) Three products:
Large Scale (ls) -- generally 1:24,000
7.5 minutes per file
Medium Scale (ms) -- 1:100,000
30x30 minute files (half a map sheet)
Small Scale (ss) --1:2,000,000
21 files for nation (one CD-ROM)
Three formats:
Standard (no longer available)
internal cartesian coords (saves storage)
limited topological info;
Optional (DLG-3) (use for GIS):
UTM metric (Albers Equal Area Polyconic for small scale)
full topological info
Graphic (small scale only)
GS-CAM compatible; no topological info.
OK for display Coverages (up to 9)
Hydrography: all flowing and standing water, and wetlands
Hypsography: contours and elevation
Transportation: roads, trails, railroads, pipelines, transmission lines
Boundaries: political & administrative
Public Land Survey System (PLSS): township, range, section (not ss)
Vegetative surfaces (ls only)
Non-veg surfaces (e.g. sand) (ls)
survey control and markers (ls)
manmade features (e.g. buildings)(ls)
Horizontal Accuracy:
large scale (7.5min.): 12-50m
medium (1:100,000): 50m
small : ??<br>
slide20. USGS New Products DOQs and DRGs Digital Ortho Quads (still in progress--depends on state/local cooperation)
Digital image of an aerial photo in which displacement caused by camera lens, airplane’s position, and the terrain have been removed-- image characteristics of a photo and geometric properties of a map.
1:12,000 scale; UTM coords, NAD83 datum
1 meter resolution; 33 feet (10m) positional accuracy (national map stand.)
associated DEM (digital elevation model) 7m vertical accuracy
quarter quadrangle coverage: 3.75 by 3.75 minutes
use as base for topo and planimetric maps (if accuracy is sufficient)
Digital Raster Graphics
Scanned image of USGS topo map, recast in some cases to UTM.
1:24,000/7.5 quads current; 1:100,000 & 1:250,000 future
250dpi; 8-bit color; TIFF file; 64 per CD-ROM
use as backdrop/validation for other digital data<br>
slide21. Digital Chart of the World spatial data base of the world.; 1st released cerca 1992
1:1 million target mapping scale
US DoD project in coop. with Canada, Australia, and UK
1.7GB of data on 4 CD-ROMs (North America, Europe/Northern Asia, South America/Africa/Antarctica, SouthernAsia/Australia). $200 cost
derived from DMA's 1:1 million scale Operational Navigational Chart (ONC) base maps
in Vector Product Format (VPF), but also available in most GIS vendor formats, and ASCII
The VPFVIEW 1.1 freeware for DOS and SUN OS available to view VPF
World Geodetic System 84 datum
Airports, boundaries, coastal, contours, elevation, geographic names, international boundaries, land cover, ports, railroads, roads, surface and manmade features, topography, transmission lines, waterway
1,000 ft contours with 250ft supplements 17 layers with 31 feature classes
* Aeronautical Information
* Cultural
* Landmarks
* Data Quality
* Drainage
* Supplemental Drainage
* Utilities
* Vegetation
* Supplemental Hypsography
* Land Cover
* Ocean Features
* Physiography
* Political
* Populated Places
* Railroads
* Roads
* Transportation Structures
worldwide index with 100,000 place name<br>
slide22. NAVSTAR Global Positioning System (gps) NAVSTAR Satellite Program
25 (NAVigation Satellite Time and Ranging) satellites in 11,00 mile orbit provide 24 hour coverage worldwide
first launched 1978; full system operational December 1993.
gps receiver computes locations/elevations via signals from 3-5 simultaneously visible satellites
Selective Availability (SA) security system
100m accuracy with single receiver, if active
10-15m accuracy if inactive
mutiple receivers &/or correction info. (from multiple sources) counteract SA
to be turned off in year 2000
USCG broadcasts correction signal!
Russia’s 21-satellite GLONASS (Global Navigation Satellite System) also available. Types of Ground Collection
kinematic:
high accuracy engineering (within cms);
two receivers (base station and rover
must lock-on to satellites
equipment $18-35K per station
differential
surveying accuarcy (1-5m)
no lock required
equipment $1,500-$15,000 per receiver
correct for SA and other errors via
real time correction signal
post process with data from Internet
connect to laptop PC for direct data input and entry of attribute info.
use to collect ground control for digital orthos, or for point/line data collection (manholes, roads, etc)
cost now $10-25 per point ( $100 a few years ago)
autonomous (navigational/recreational)
100m accuracy generally (10m without SA)
single, hand-held unit
$150-$1,500 per unit<br>
slide23. Longitude (secs. from 96° 43’) Latitude (secs. from N 32° 56’) plots of positions collected by Garmin 38 GPS receiver at same location on three successive occasions
approximately 200 points per plot.
one point collected per 2 seconds.
1 second of latitude approx. 30m
1 second of longitude approx. 25m
(location: 524 Highland Blvd, Richardson, TX) (satellite
view
restricted)<br>
slide24. 1 second of latitude is approx. 30 meters.
1 second of longitude (@32N) is 25 meters. * satellite view restricted<br>
slide25. Factors Affecting GPS Accuracy ionosphere
worst in evening at low altitudes (but ephemerous best there)
troposhere
especially water vapor which slows signal
multipath
reflected signals from buildings, cliffs, etc
ephemerous
position and number of satellites in sky
4 required for 3D (horiz. and vertical), 3 for 2D (no elevation)
ideallly, 3 every 120° horizon. with 20° elev., 1 directly above
blockage (of satellite signal)
by foliage, buildings, cliffs, etc.<br>
slide26. GPS Receiver Characteristics Irrespective of cost ($150 to $50,000) all have same accuracy in autonomous mode!
processing speed & channel capacity (# of satellite data streams simultaneously processed)
storage capability: internal & PCM/CIA cards
codes it can process (L1, L2; code, carrier phase, etc.)
antenna type and remote connection support
interface capabilities
RTCM: standard for input of differential correction signal
NMEA (National Marine Electronics Association):positions for real-time interface to instruments (also to PC software e.g. for location on a map)
RINEX (receiver independent exchange): output of raw satellite data for post processing
other proprietary: for waypoints, routes, position data, etc. upload/ download
specialized user support features (hiking, marine nav., surveying, civil eng., etc.)<br>
slide27. Remote Sensing remote sensing: info. via systems not in direct contact with objects of interest:
via cameras recording on film, which may then be scanned (primarily aerial photos)
via sensors, which directly output digital data (primarily satellites, but also planes)
image processing: manipulating data derived via remote sensing
photographic film types:
monochrome (black and white)
natural color
infra-red (insensitive to blue, but goes past visible red; good for geology, veg. , heat)
types of sensors
passive (most common): record natural electromagnetic energy emissions from surface
active (radar): record reflected value of a transmitted signal (e.g. Canada’s RADARSAT, NASA’s SIR-C/X-SAR)
penetrate clouds; also, some ground penetration possible.
passive sensors: typically store one byte of info (256 values) per spectral band (a selected wavelength interval in the electromagnetic spectrum);
panchromatic: single band recorded (e.g. SPOT Panchromatic)
multi-spectral: multiple bands recorded (e.g. LANDSAT MMS-4, TM-6)
hyperspectral: hundreds of bands (TRW’s proposed Lewis satellite has 384)
spectral signature: the set of values for each band typifying a particular phenomena (e.g. blighted corn, concrete highway) to allow unique identification<br>
slide28. Current Satellites Source: Keating, BLM Tech. Note # 389, 1993<br>
slide29. Next-Generation Satellites (selected) expected to generate at least 750 GB of data per day--”Beam me down, Scotty!” Source: Carlson and Patel, GIS World, March 1997
ASPRS Land Satellite Information for the Next Decade, conference proceedings, Sept 1995 resolution in meters; revisits in days Resolution of new satellites makes urban mangement applications possible.<br>
slide30. Some Notes on New Satellites (early 1997) Satellites vary by: orbit, altitude, revist variability (steering) capability, width of swath, image size, stereo capability, wavelengths collected, other sensors, etc.
EarthWatch: WorldView Imaging Corp and Ball Aerospace with Hitachi (Japan), Nuova Telespazio (Italy),MacDonald Dettwiler (Canada), CTA Space Systems (Rockville, MD), Datron (Escondido, CA)
Space Imaging/EOSAT: Lockheed Martin, Raytheon/E-Systems,Mitsubishi, Kodak. Purchase of EOSAT (Earth Observation Satellite Company) in 11/96 and formation of a Mapping Alliance Program with 10 big-time aerial mapping companies [e.g Woolpert (Dayton), Analytical Surveys, Inc (Colorado Springs)], makes them a powerhouse for data.
TRW: part of NASA’s Small Spacecraft Technology Initiative, with satellite built by CTA
the Global Change research project’s Earth Observation System (EOS), which includes NASA’s Mission to Planet Earth, includes a wide variety of monitors & sensors on multiple satellites from different countries through 2008
Countries with existing/planned satellites include: Argentine, Brazil, Canada, France, Germany, India, Israel, Japan, Korea (South), Ukraine, US.<br>
slide31. The Relative Cost of Different Options (as of 1993) Satellite Remote Sensing Maps and Existing Digital data Photogrametry Global Positioning System Survey 1cm 1m 30m 1cent $100 $1,000 least accurate least
expensive Source: Keating, BLM Tech. Note # 389, 1993<br>
slide32. U.S. Census Bureau: Attribute Data (see: Census Catalog and Guide published annually) Census of Population and Housing
10 year cycle (1990)
two main tabulations
Full count (STF1 & 2)
geog. detail
down to block
Sample (STF3 & 4)
20% stratified sample
‘long form’
attribute detail
Economic Census
5 year cycle (1993)
agriculture, retail, manufacturing, service, transportation, government, construction Data Collection Methodologies
Census
mandatory, entire population
regular but infrequent, as benchmark
Update surveys
not mandatory, update censuses
limited geog detail, usually annual (some weekly)
Special Surveys
not mandatory; cover data not in census
often on contract with other agency (e.g National Health Survey)
Non-Survey
admin records from other agencies
update census (e.g. Current Poplation Reports)
provide additional info (e.g. County Business Patterns)<br>
slide33. Aggregation Issues in Attribute Data Disaggregate (micro) data
individuals or individual entities
persons, households, firms,
parcels, housing units, establishments
trees, poles, wells
geocoding required
confidentiality/disclosure a critical issue
suppresion may be imposed on aggregate data Aggregate data
groups of individuals or entities
by geographic area--block, tract
by time: rainfall/sales by day, month, year
by characteristic: age group, race, species
polygons required for mapping
Cross-sectional: different spatial units at one point in time
Longitudinal: one spatial unit at different points in time
Dynamic: continuously produced over time and space (some satellites; CORS program)<br>
slide34. Samples, Populations and Spatial Patterns Some Issues for Primary Data Collection Population: --all instances of a phenomena
Sample: subset of population
random: each pop. member has equal chance of being chosen
systematic: members chosen based on repetitive rule (every 10th; every 4 feet)
stratified:; sampling conducted within groups to ensure representation
Especially tricky for spatial data! random Spatial sampling methods
point: collect info at one spot
transect: along a line
quadrat: within a square clustered dispersed Probability of one point being close to another equal high low<br>
slide35. Summary of Data Collection Issues Suitability/Appropriateness for the Task horizontal (and vertical) accuracy:
33 feet USGS DOQ, versus 3 feet for urban needs
documentation
often bad for administrative records
currency and frequency of update
is date and/or update cycle appropriate?
completeness
is undercount/omission a serious problem?
e.g. most ‘lists’ miss the poor (census undercounts); TIGER file once per decade
aggregation and sampling
are they appropriate?
cost -- highly associated with accuracy
is cost within budget?
is benefit greater than cost?<br>