Defending The Pass - Evaluating Defensive Ability Using Passing Data Matt Cane WinnersView Hockey Graphs Puck Ryan Stimson Hockey Graphs Defence and passing Why is defence so hard to evaluate? On defence players have to act as a
"Defending The Pass - Evaluating Defensive Ability" is the property of its rightful owner. Permission is granted to
download and print the materials on this website for personal, non-commercial use only, and to display it
on your personal computer provided you do not modify the materials and that you retain all copyright
notices contained in the materials. By downloading content from our website, you accept the terms of this
agreement.
Presentation Transcript
01
Defending The Pass - Evaluating Defensive Ability Using Passing Data Matt Cane – WinnersView / Hockey Graphs / Puck ++
Ryan Stimson – Hockey Graphs<br>
02
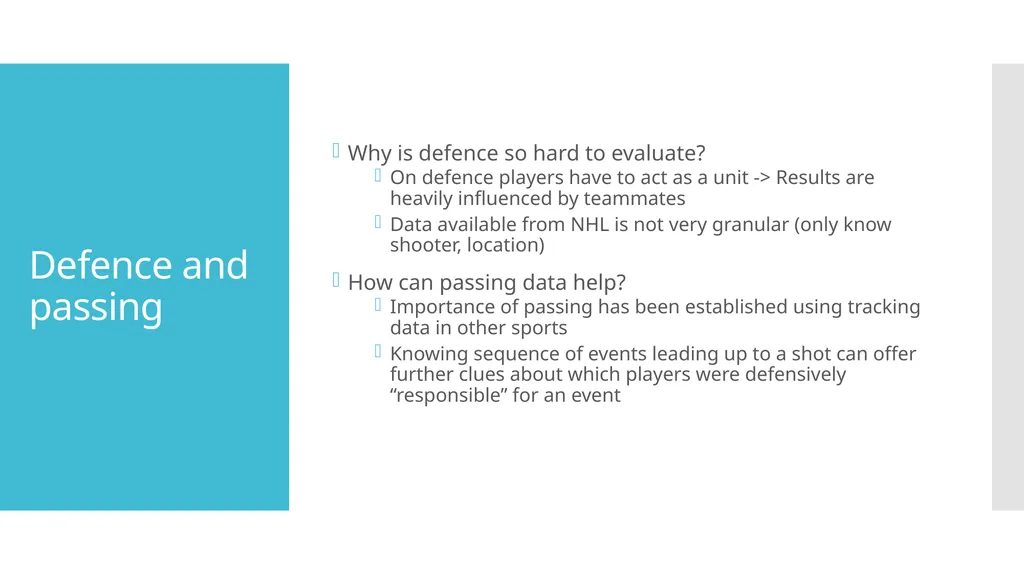
Defence and passing Why is defence so hard to evaluate?
On defence players have to act as a unit -> Results are heavily influenced by teammates
Data available from NHL is not very granular (only know shooter, location)
How can passing data help?
Importance of passing has been established using tracking data in other sports
Knowing sequence of events leading up to a shot can offer further clues about which players were defensively “responsible” for an event<br>
03
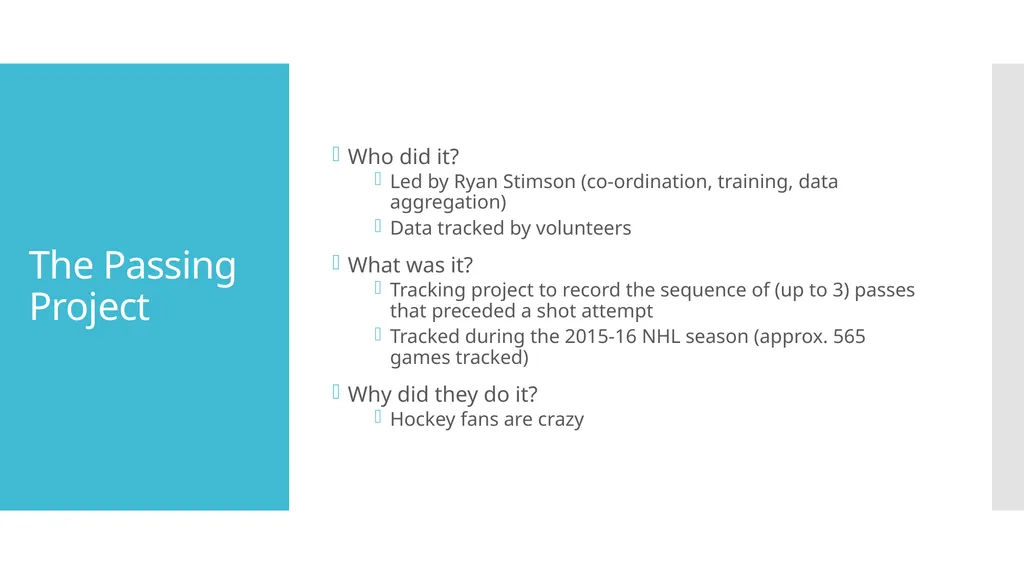
The Passing Project Who did it?
Led by Ryan Stimson (co-ordination, training, data aggregation)
Data tracked by volunteers
What was it?
Tracking project to record the sequence of (up to 3) passes that preceded a shot attempt
Tracked during the 2015-16 NHL season (approx. 565 games tracked)
Why did they do it?
Hockey fans are crazy<br>
04
What kind of passes were tracked? From all the data collected, 7 basic pass types were created<br>
05
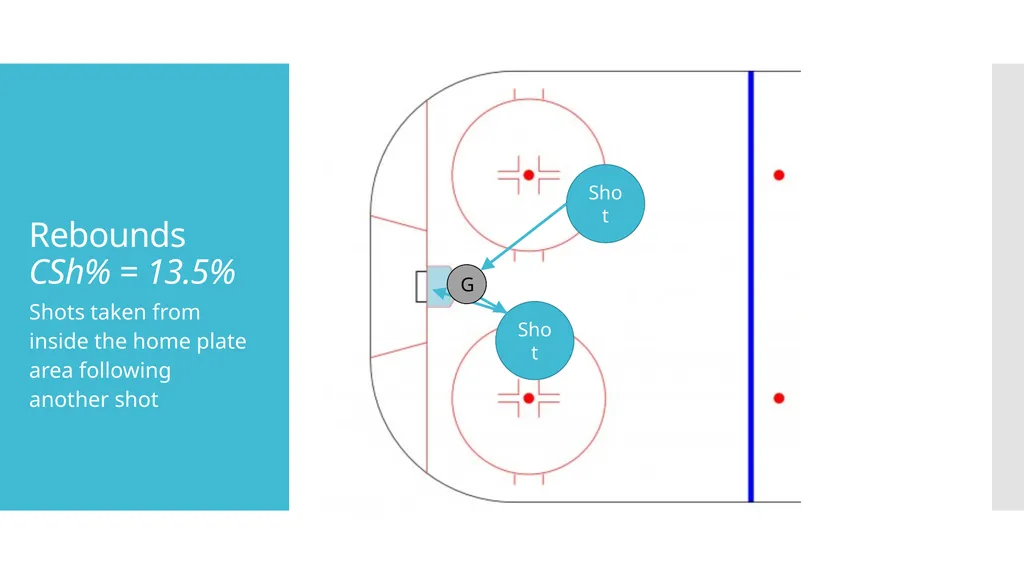
Rebounds CSh% = 13.5% Shots taken from inside the home plate area following another shot Shot Shot G<br>
06
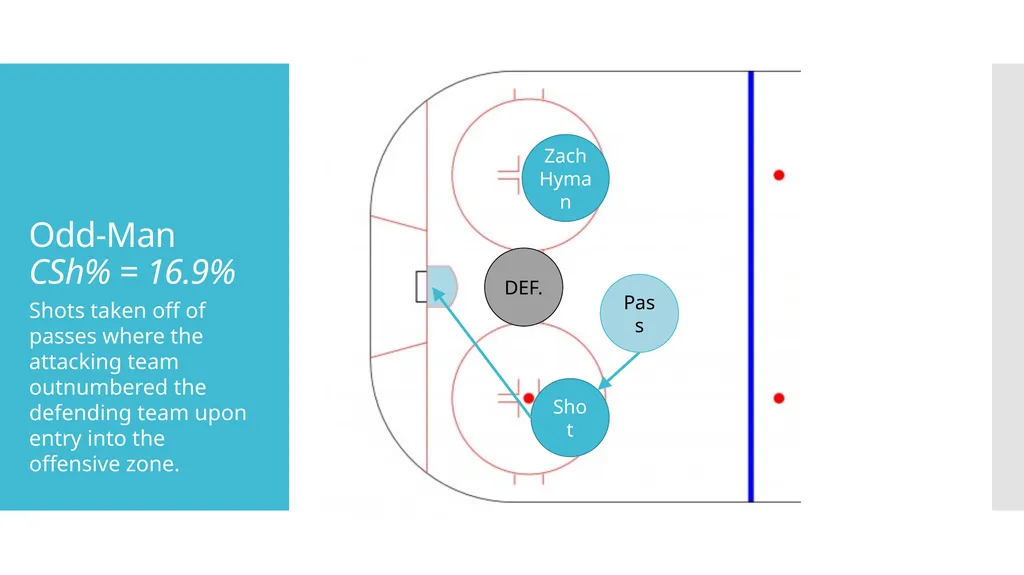
Odd-Man CSh% = 16.9% Shots taken off of passes where the attacking team outnumbered the defending team upon entry into the offensive zone. Pass Shot DEF. Zach Hyman<br>
07
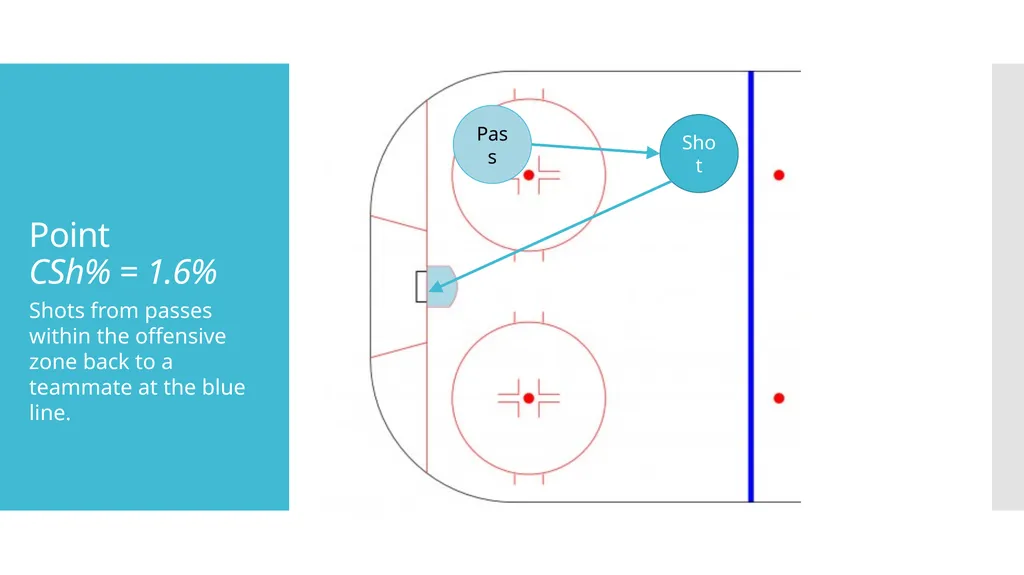
Point CSh% = 1.6% Shots from passes within the offensive zone back to a teammate at the blue line. Pass Shot<br>
08
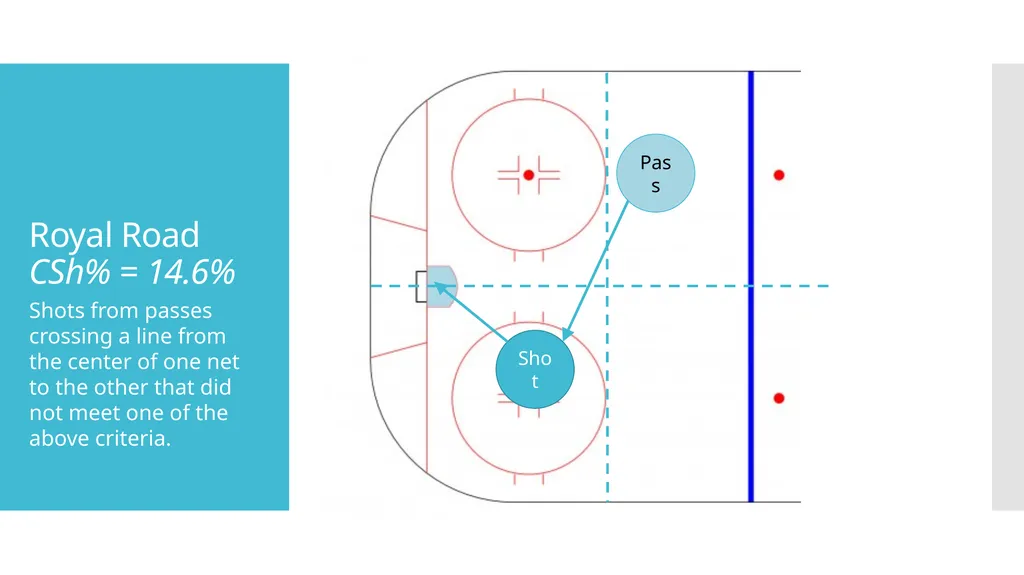
Royal Road CSh% = 14.6% Shots from passes crossing a line from the center of one net to the other that did not meet one of the above criteria. Pass Shot<br>
09
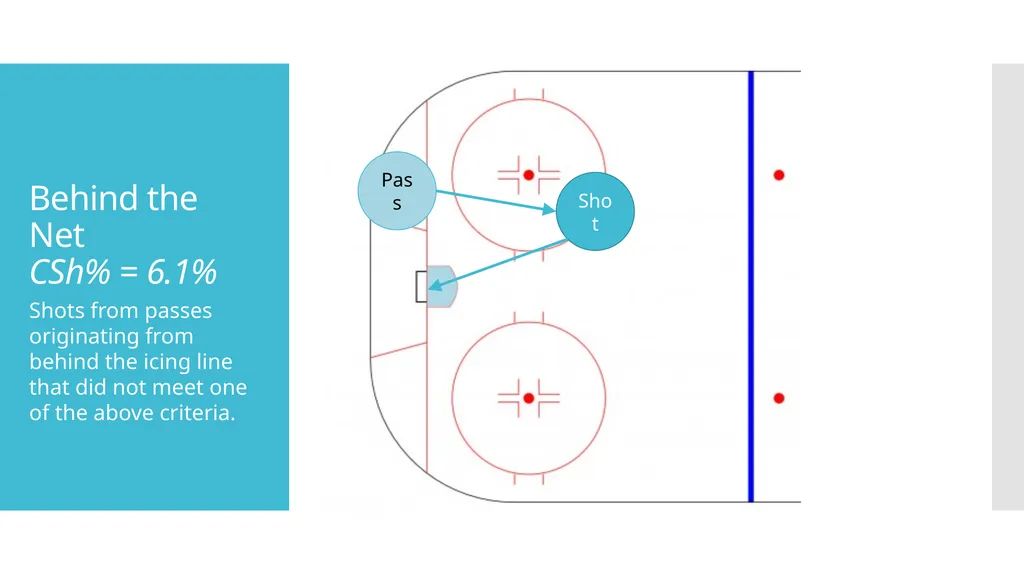
Behind the Net CSh% = 6.1% Shots from passes originating from behind the icing line that did not meet one of the above criteria. Pass Shot<br>
10
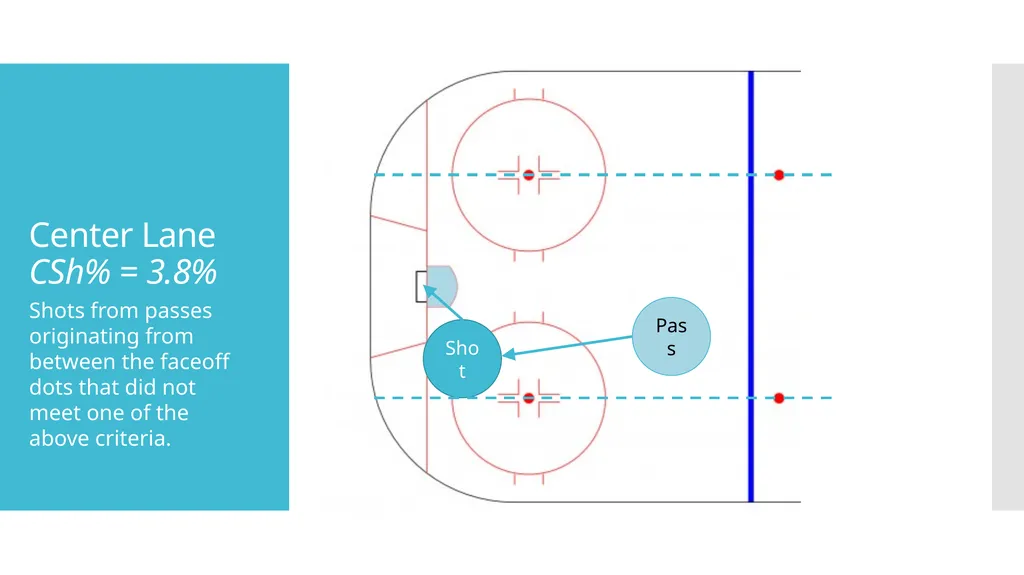
Center Lane CSh% = 3.8% Shots from passes originating from between the faceoff dots that did not meet one of the above criteria. Pass Shot<br>
11
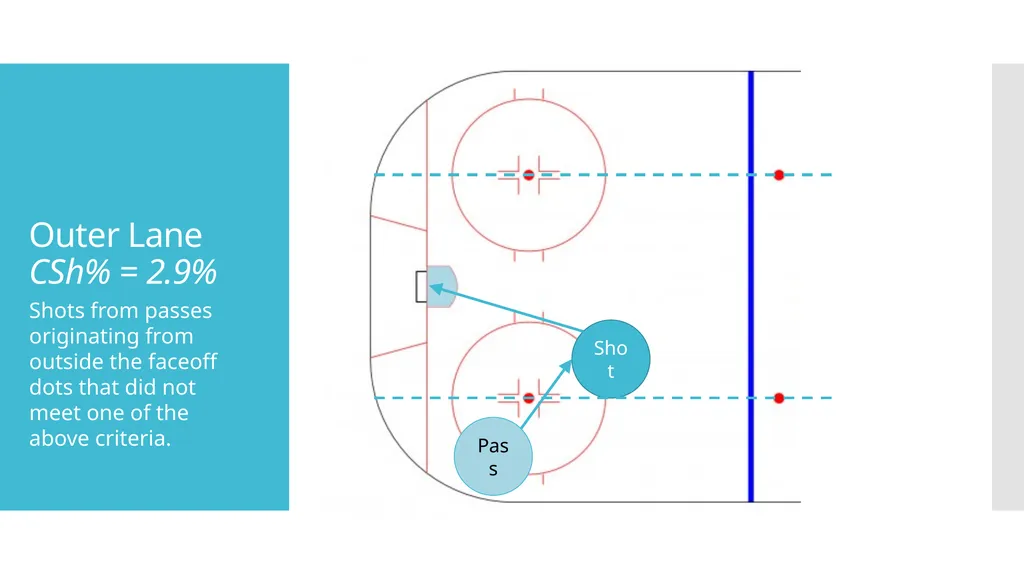
Outer Lane CSh% = 2.9% Shots from passes originating from outside the faceoff dots that did not meet one of the above criteria. Pass Shot<br>
12
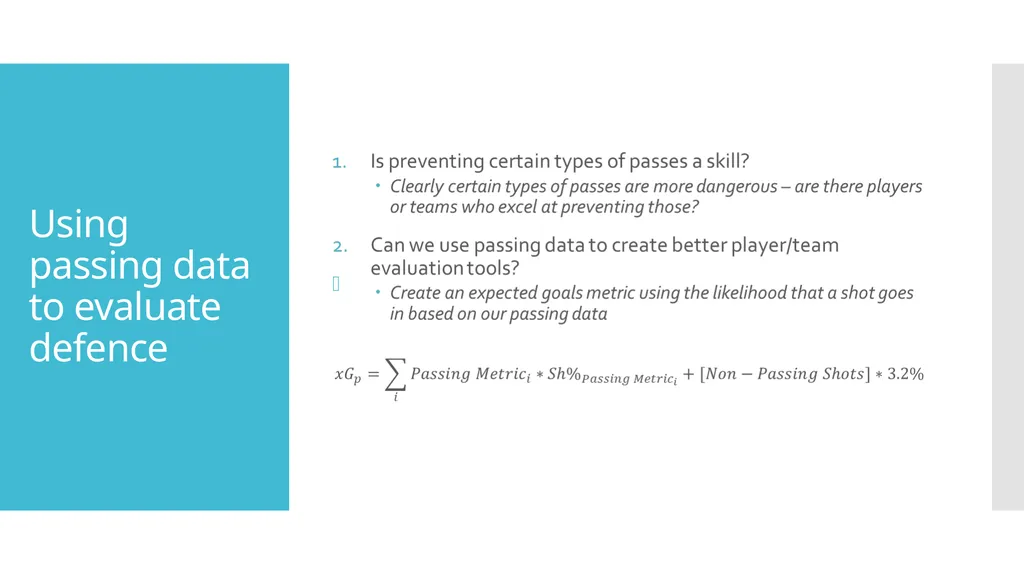
Using passing data to evaluate defence<br>
13
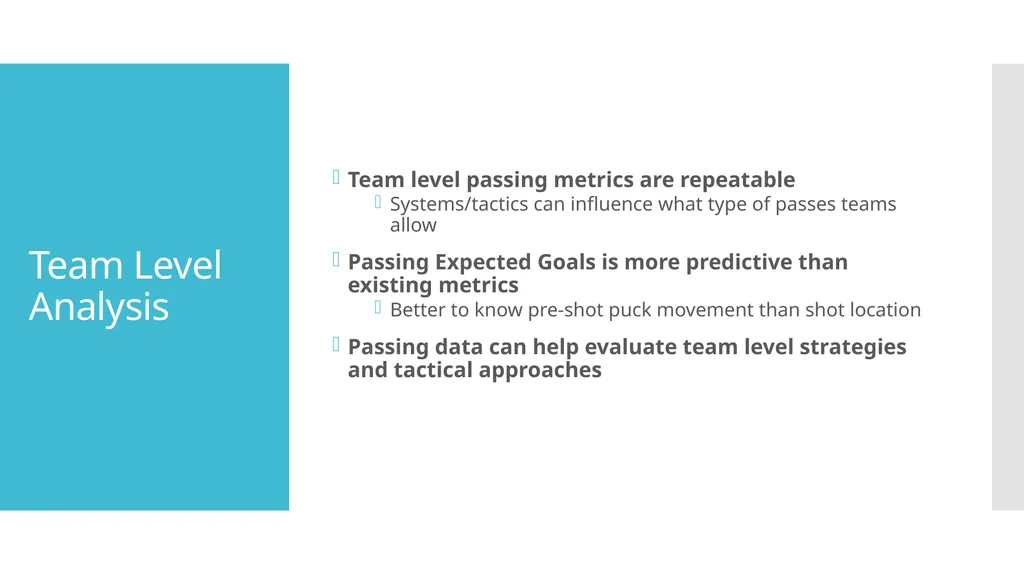
Team Level Analysis Team level passing metrics are repeatable
Systems/tactics can influence what type of passes teams allow
Passing Expected Goals is more predictive than existing metrics
Better to know pre-shot puck movement than shot location
Passing data can help evaluate team level strategies and tactical approaches<br>
14
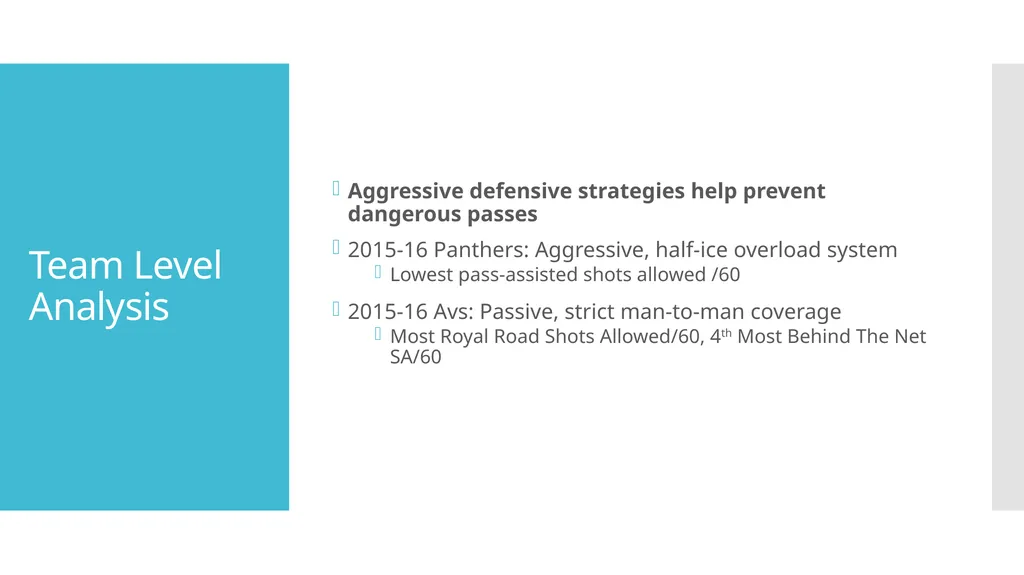
Team Level Analysis Aggressive defensive strategies help prevent dangerous passes
2015-16 Panthers: Aggressive, half-ice overload system
Lowest pass-assisted shots allowed /60
2015-16 Avs: Passive, strict man-to-man coverage
Most Royal Road Shots Allowed/60, 4th Most Behind The Net SA/60<br>
15
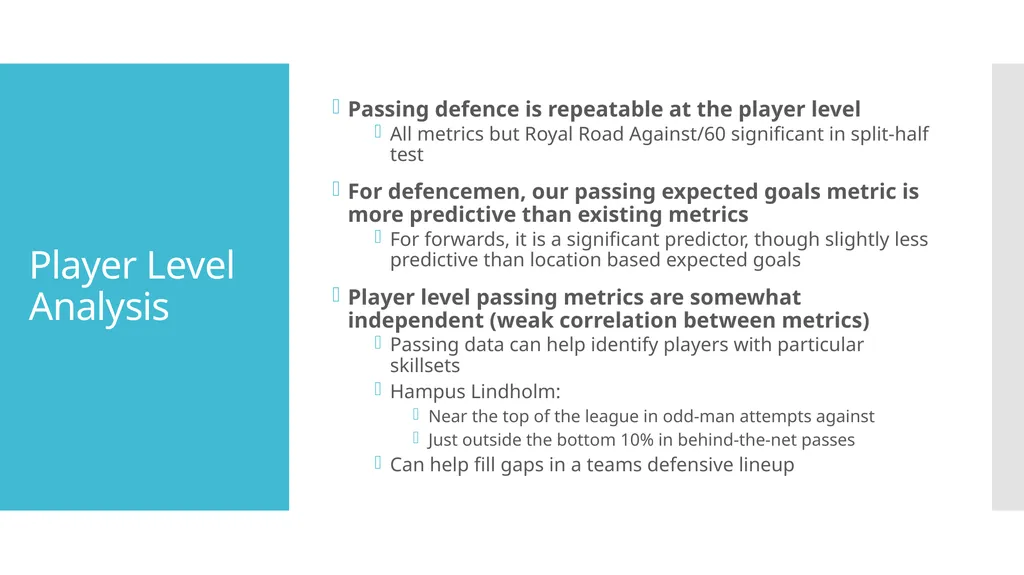
Player Level Analysis Passing defence is repeatable at the player level
All metrics but Royal Road Against/60 significant in split-half test
For defencemen, our passing expected goals metric is more predictive than existing metrics
For forwards, it is a significant predictor, though slightly less predictive than location based expected goals
Player level passing metrics are somewhat independent (weak correlation between metrics)
Passing data can help identify players with particular skillsets
Hampus Lindholm:
Near the top of the league in odd-man attempts against
Just outside the bottom 10% in behind-the-net passes
Can help fill gaps in a teams defensive lineup<br>
16
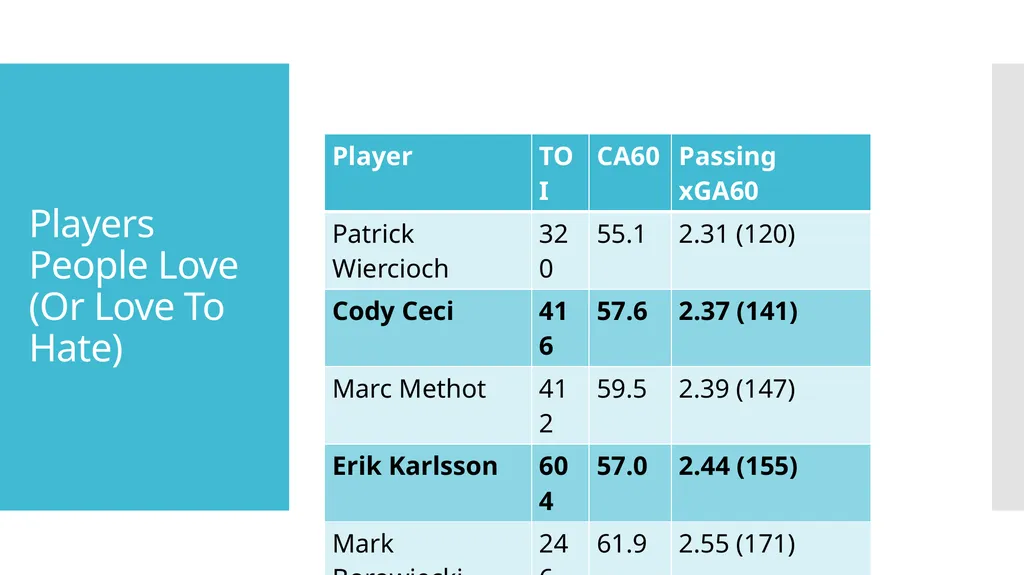
Players People Love (Or Love To Hate)<br>
17
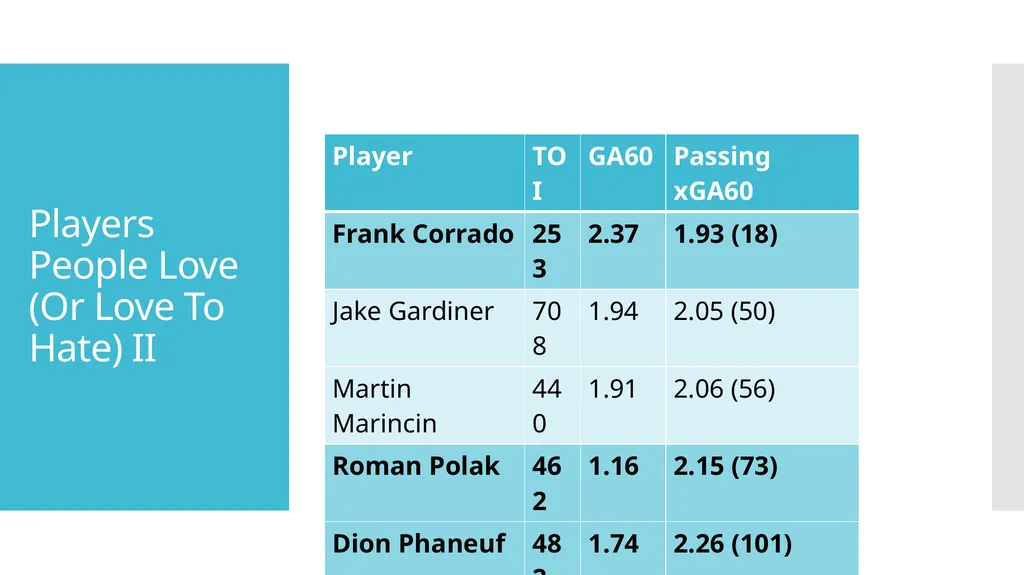
Players People Love (Or Love To Hate) II<br>
18
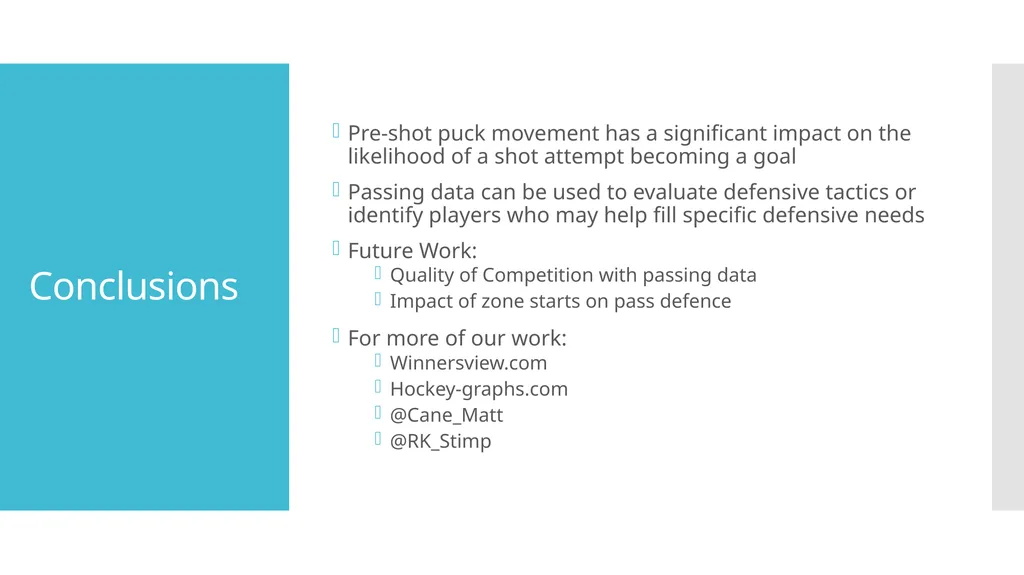
Conclusions Pre-shot puck movement has a significant impact on the likelihood of a shot attempt becoming a goal
Passing data can be used to evaluate defensive tactics or identify players who may help fill specific defensive needs
Future Work:
Quality of Competition with passing data
Impact of zone starts on pass defence
For more of our work:
Winnersview.com
Hockey-graphs.com
@Cane_Matt
@RK_Stimp<br>
19
Thank you! Thank you to all the trackers who made this project possible!<br>