
DELETE THIS SLIDE PRIOR TO PRESENTATION This




Description: DELETE THIS SLIDE PRIOR TO PRESENTATION This PowerPoint serves as a template presentation which introduces topics related to air quality and is part of a suite of presentations provided by the EPA for the Megacities program. See speaker
Related Topics
Download Presentation
"DELETE THIS SLIDE PRIOR TO PRESENTATION This" is the property of its rightful owner. Permission is granted to download and print the materials on this website for personal, non-commercial use only, and to display it on your personal computer provided you do not modify the materials and that you retain all copyright notices contained in the materials. By downloading content from our website, you accept the terms of this agreement.
Presentation Transcript
slide1. DELETE THIS SLIDE PRIOR TO PRESENTATION This PowerPoint serves as a template presentation which introduces topics related to air quality and is part of a suite of presentations provided by the EPA for the Megacities program.
See speaker notes for an additional description of slide content. Slides should be edited or added to as necessary for your particular needs. Slides with highlighted yellow text require the addition of specific context and information for your city. 1<br>
slide2. Ambient Air Quality Monitoring<br>
slide3. Overview 1. Objectives
2. Air Monitoring Basics
3. Monitoring Options
4. Low-Cost Sensors and Remote Satellites
5. Integrated Strategy
6. Infrastructure and Best Practices 3<br>
slide4. Section 1: Objectives 1. Objectives
2. Air Monitoring Basics
3. Monitoring Options
4. Low-Cost Sensors and Remote Satellites
5. Integrated Strategy
6. Infrastructure and Best Practices 4<br>
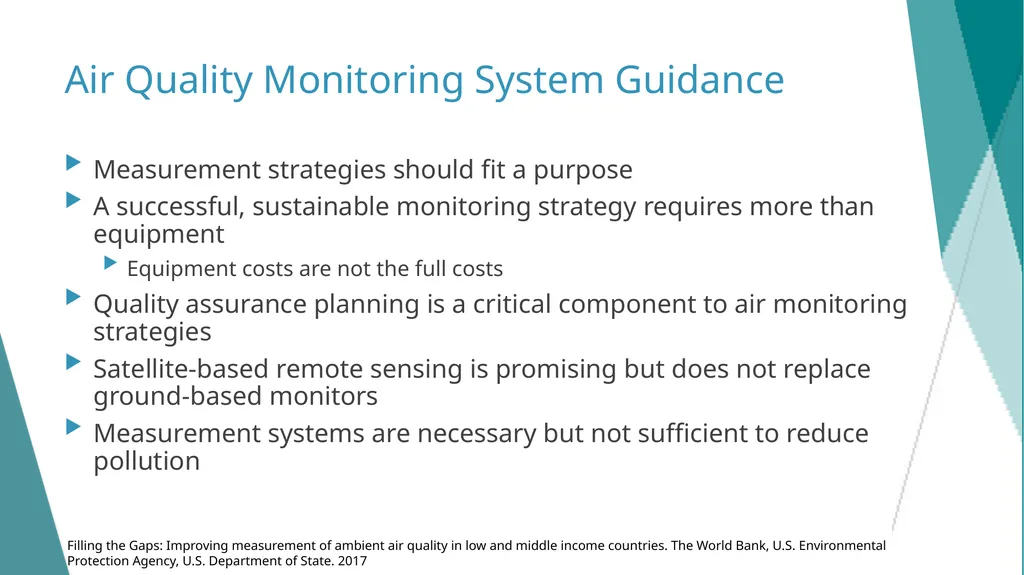
slide5. Air Quality Monitoring System Guidance Measurement strategies should fit a purpose
A successful, sustainable monitoring strategy requires more than equipment
Equipment costs are not the full costs
Quality assurance planning is a critical component to air monitoring strategies
Satellite-based remote sensing is promising but does not replace ground-based monitors
Measurement systems are necessary but not sufficient to reduce pollution Filling the Gaps: Improving measurement of ambient air quality in low and middle income countries. The World Bank, U.S. Environmental Protection Agency, U.S. Department of State. 2017 5<br>
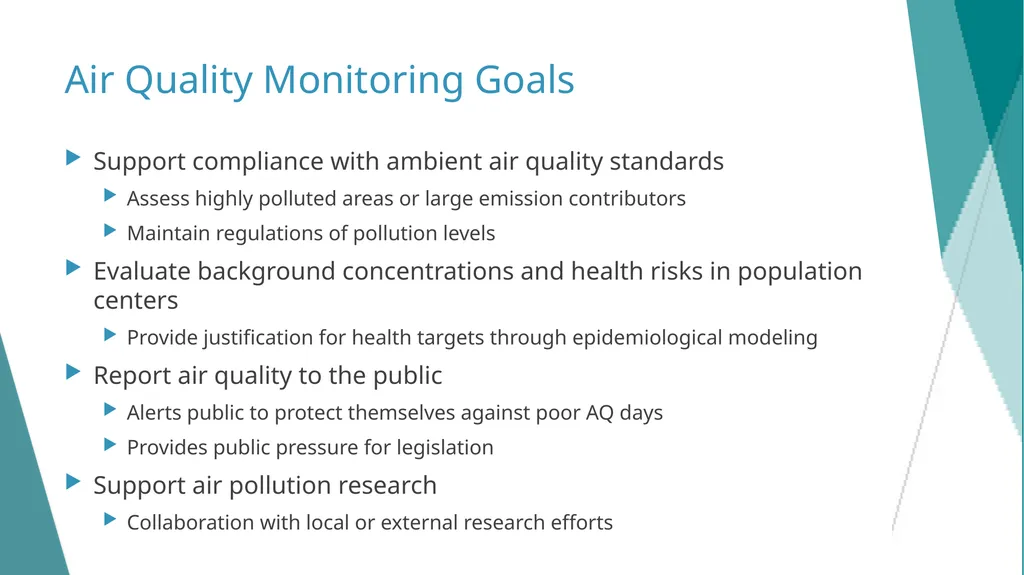
slide6. Air Quality Monitoring Goals Support compliance with ambient air quality standards
Assess highly polluted areas or large emission contributors
Maintain regulations of pollution levels
Evaluate background concentrations and health risks in population centers
Provide justification for health targets through epidemiological modeling
Report air quality to the public
Alerts public to protect themselves against poor AQ days
Provides public pressure for legislation
Support air pollution research
Collaboration with local or external research efforts 6<br>
slide7. A successful, sustainable monitoring strategy requires more than equipment.<br>
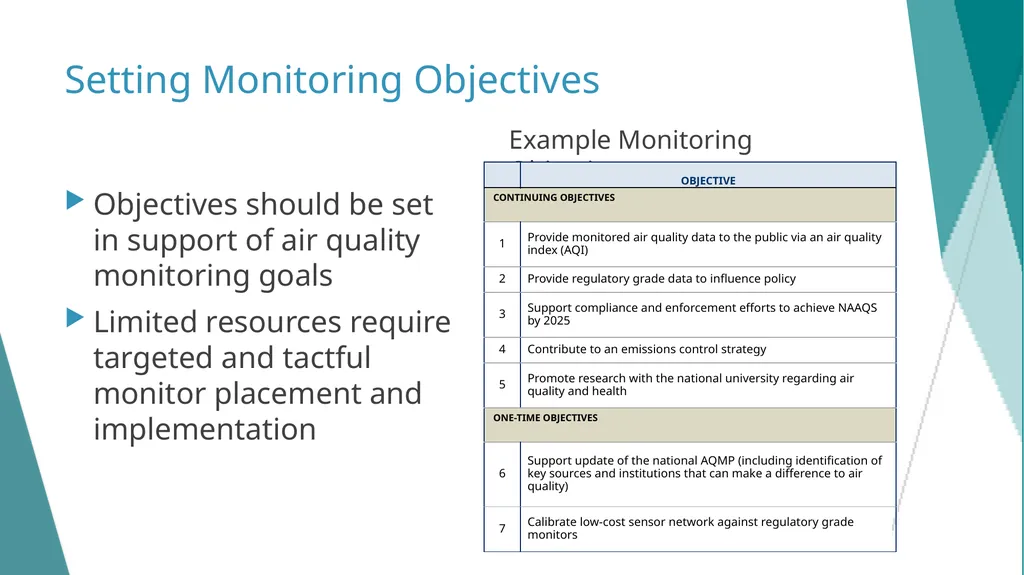
slide8. Setting Monitoring Objectives Objectives should be set in support of air quality monitoring goals
Limited resources require targeted and tactful monitor placement and implementation Example Monitoring Objectives 8<br>
slide9. Measuring the Air in Low- and Middle-Income countries (LMICs) Air quality management systems should include a measurement component to address policy objectives and document trends over time
Measurement systems have a broad range of capabilities characterized by:
Prevalence
Measurement fidelity/accuracy
Data availability
Available support https://www.hindustantimes.com/indore/pollution-in-indore-gets-an-intervention/story-Wde8DBSMtJYfGn1ThPVLIO.html<br>
slide10. What are [YOUR CITY]’s monitoring objectives? 10<br>
slide11. Section 2: Air Monitoring Basics 1. Objectives
2. Air Monitoring Basics
3. Monitoring Options
4. Low-Cost Sensors and Remote Satellites
5. Integrated Strategy
6. Infrastructure and Best Practices 11<br>
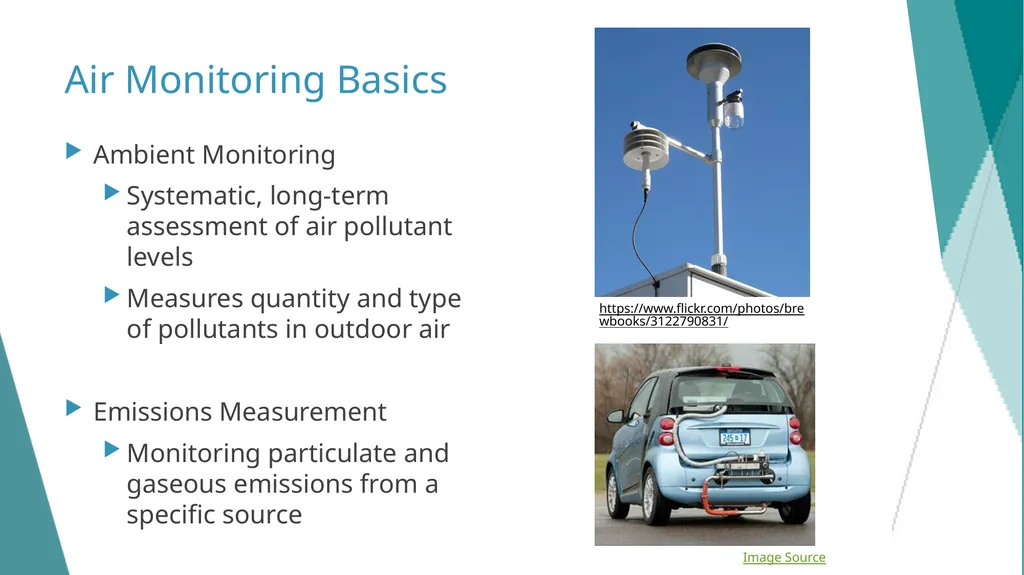
slide12. Air Monitoring Basics Ambient Monitoring
Systematic, long-term assessment of air pollutant levels
Measures quantity and type of pollutants in outdoor air
Emissions Measurement
Monitoring particulate and gaseous emissions from a specific source https://www.flickr.com/photos/brewbooks/3122790831/ Image Source<br>
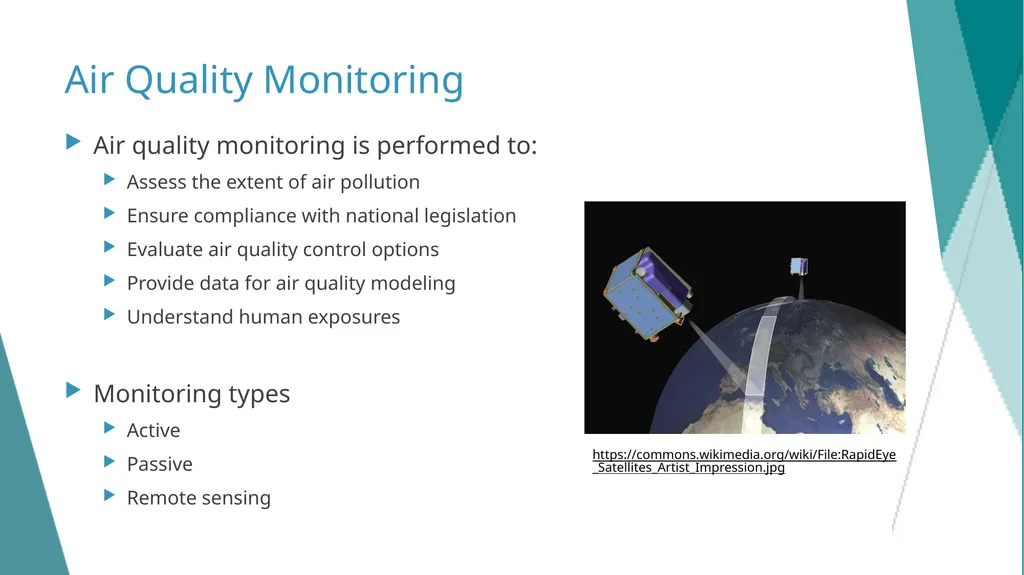
slide13. Air Quality Monitoring Air quality monitoring is performed to:
Assess the extent of air pollution
Ensure compliance with national legislation
Evaluate air quality control options
Provide data for air quality modeling
Understand human exposures
Monitoring types
Active
Passive
Remote sensing https://commons.wikimedia.org/wiki/File:RapidEye_Satellites_Artist_Impression.jpg<br>
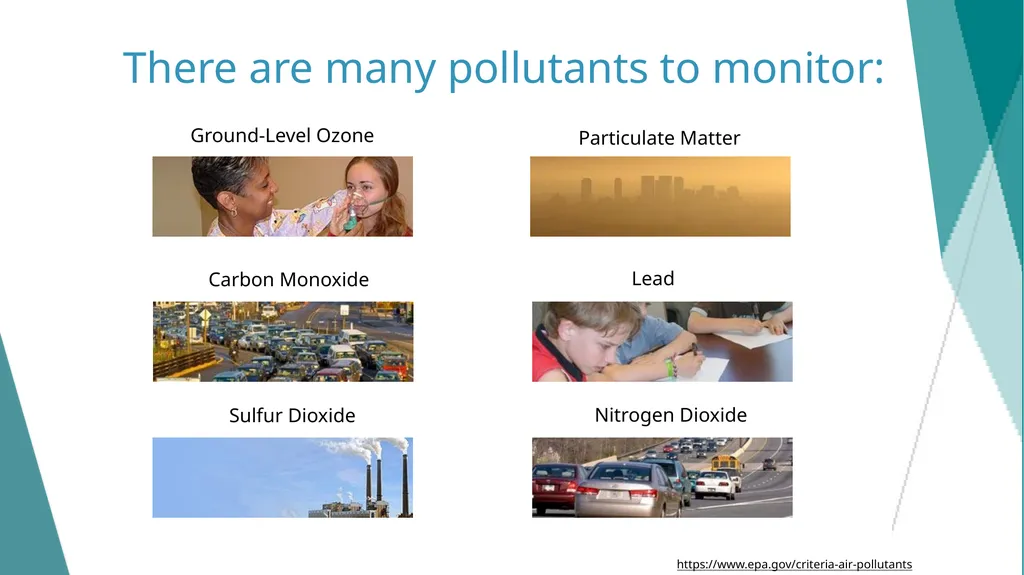
slide14. There are many pollutants to monitor: Ground-Level Ozone Carbon Monoxide Sulfur Dioxide Particulate Matter Lead Nitrogen Dioxide https://www.epa.gov/criteria-air-pollutants<br>
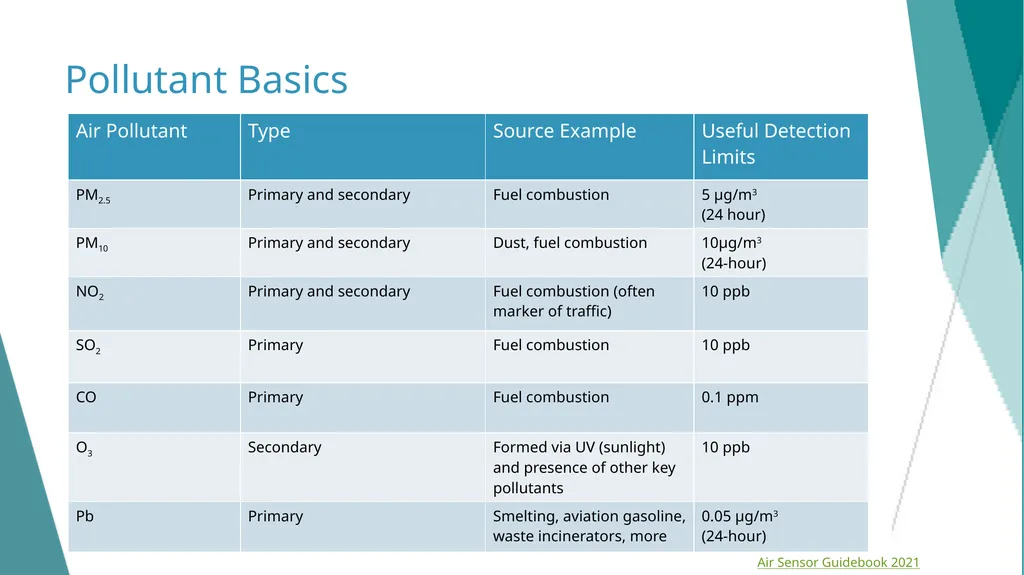
slide15. Pollutant Basics Air Sensor Guidebook 2021 15<br>
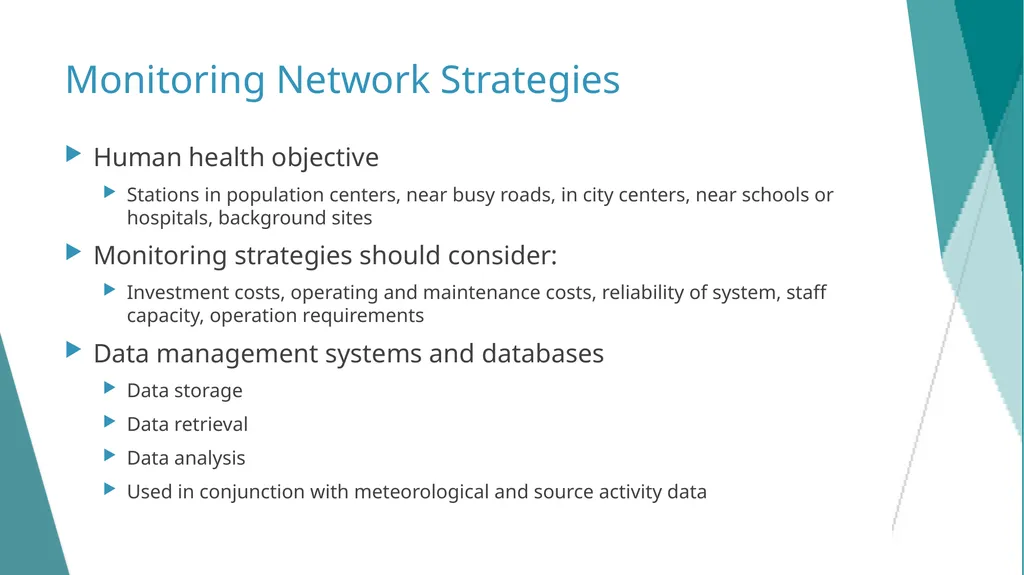
slide16. Monitoring Network Strategies Human health objective
Stations in population centers, near busy roads, in city centers, near schools or hospitals, background sites
Monitoring strategies should consider:
Investment costs, operating and maintenance costs, reliability of system, staff capacity, operation requirements
Data management systems and databases
Data storage
Data retrieval
Data analysis
Used in conjunction with meteorological and source activity data<br>
slide17. Section 3: Monitoring Options 1. Objectives
2. Air Monitoring Basics
3. Monitoring Options
4. Low-Cost Sensors and Remote Satellites
5. Integrated Strategy
6. Infrastructure and Best Practices 17<br>
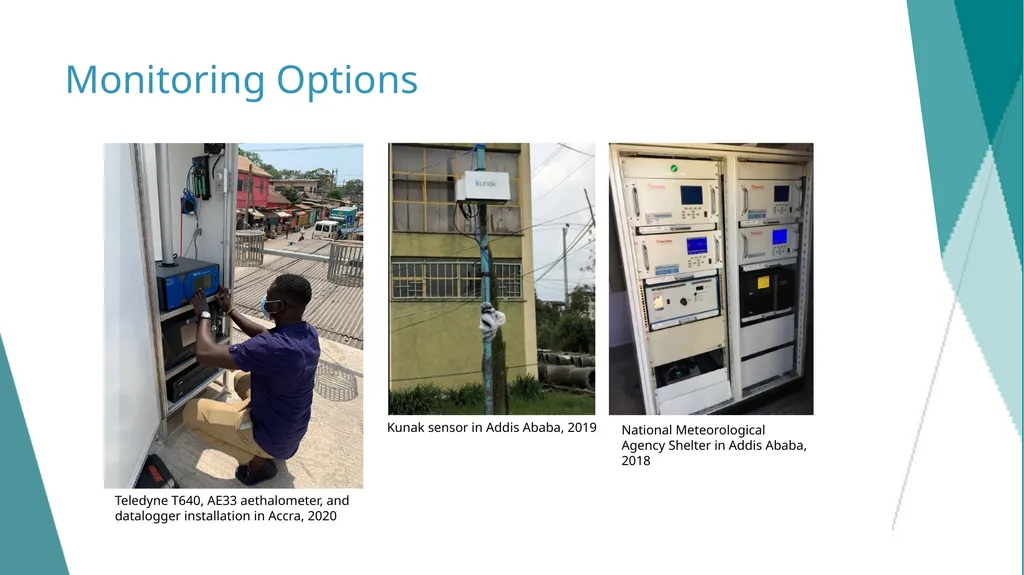
slide18. Monitoring Options Kunak sensor in Addis Ababa, 2019 National Meteorological Agency Shelter in Addis Ababa, 2018 Teledyne T640, AE33 aethalometer, and datalogger installation in Accra, 2020<br>
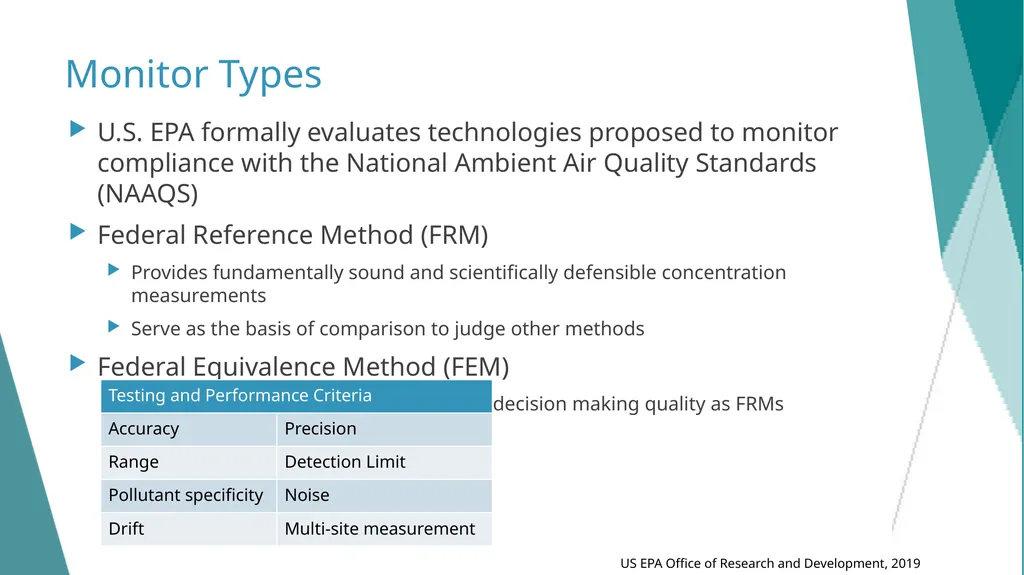
slide19. Monitor Types U.S. EPA formally evaluates technologies proposed to monitor compliance with the National Ambient Air Quality Standards (NAAQS)
Federal Reference Method (FRM)
Provides fundamentally sound and scientifically defensible concentration measurements
Serve as the basis of comparison to judge other methods
Federal Equivalence Method (FEM)
Provide comparable level of compliance decision making quality as FRMs US EPA Office of Research and Development, 2019<br>
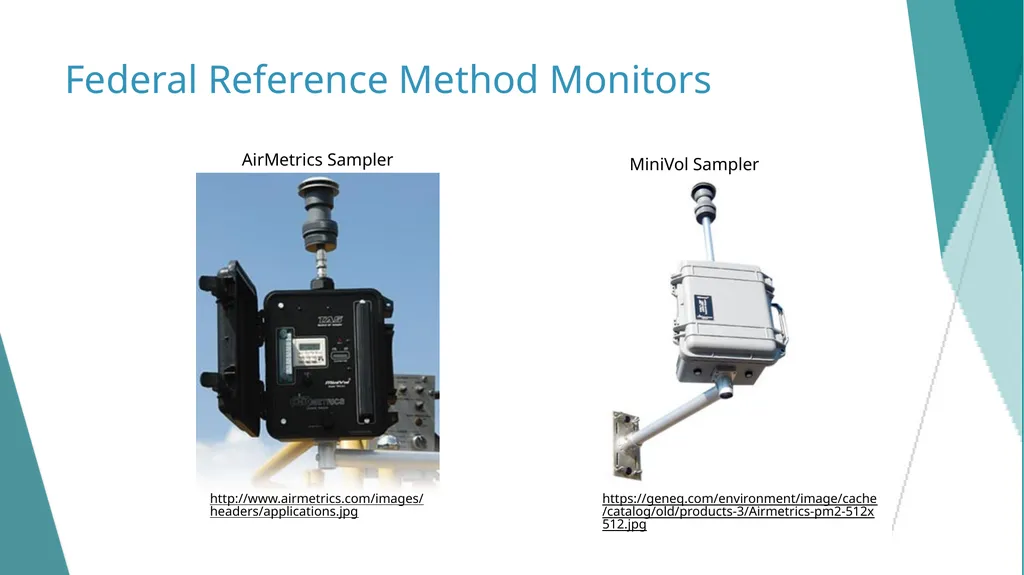
slide20. Federal Reference Method Monitors AirMetrics Sampler http://www.airmetrics.com/images/headers/applications.jpg MiniVol Sampler https://geneq.com/environment/image/cache/catalog/old/products-3/Airmetrics-pm2-512x512.jpg<br>
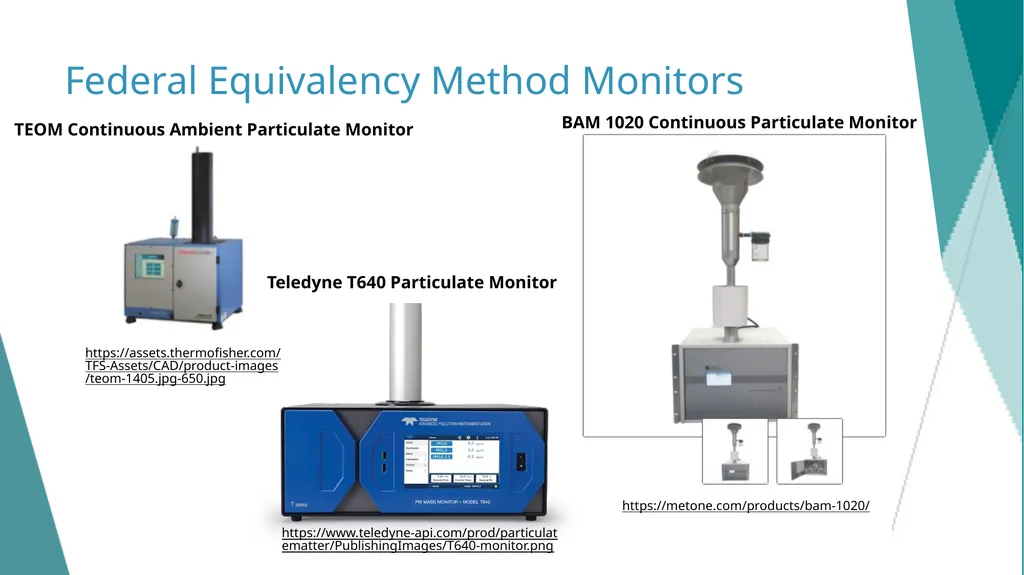
slide21. Federal Equivalency Method Monitors TEOM Continuous Ambient Particulate Monitor https://assets.thermofisher.com/TFS-Assets/CAD/product-images/teom-1405.jpg-650.jpg Teledyne T640 Particulate Monitor https://www.teledyne-api.com/prod/particulatematter/PublishingImages/T640-monitor.png BAM 1020 Continuous Particulate Monitor https://metone.com/products/bam-1020/<br>
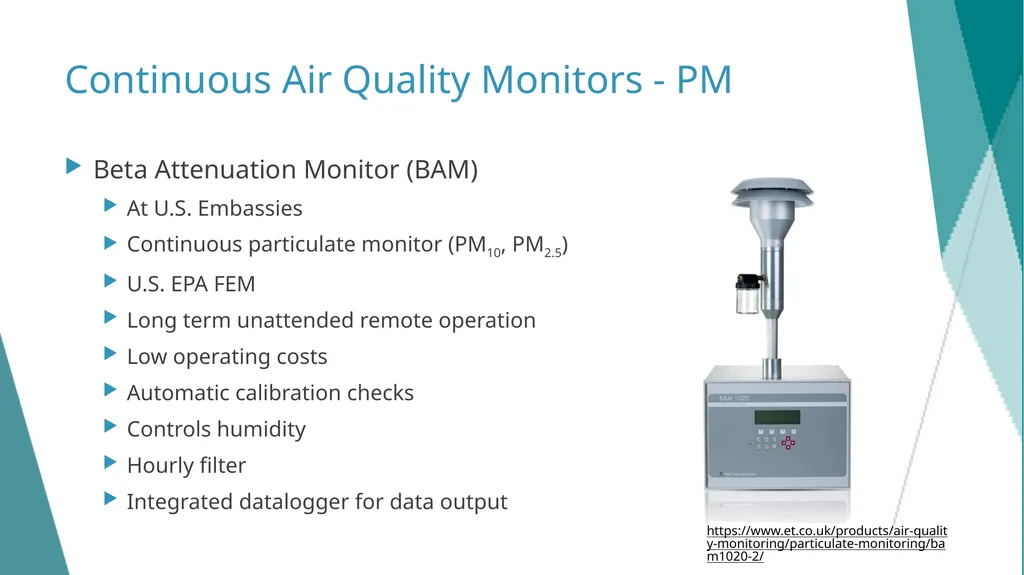
slide22. Continuous Air Quality Monitors - PM Beta Attenuation Monitor (BAM)
At U.S. Embassies
Continuous particulate monitor (PM10, PM2.5)
U.S. EPA FEM
Long term unattended remote operation
Low operating costs
Automatic calibration checks
Controls humidity
Hourly filter
Integrated datalogger for data output https://www.et.co.uk/products/air-quality-monitoring/particulate-monitoring/bam1020-2/<br>
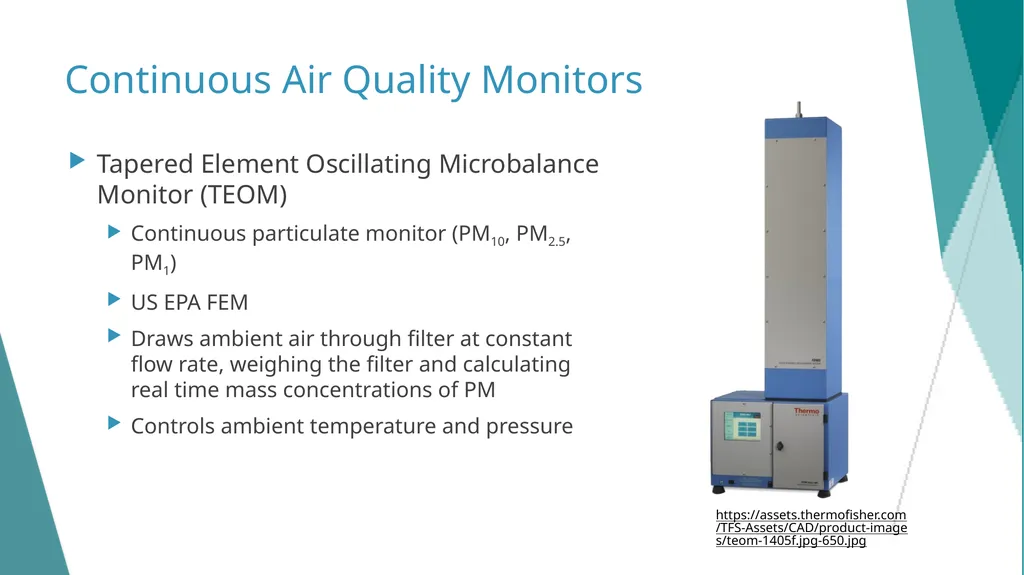
slide23. Continuous Air Quality Monitors Tapered Element Oscillating Microbalance Monitor (TEOM)
Continuous particulate monitor (PM10, PM2.5, PM1)
US EPA FEM
Draws ambient air through filter at constant flow rate, weighing the filter and calculating real time mass concentrations of PM
Controls ambient temperature and pressure https://assets.thermofisher.com/TFS-Assets/CAD/product-images/teom-1405f.jpg-650.jpg<br>
slide24. Gravimetric Air Quality Monitors - PM Gravimetric monitors
U.S. EPA FRM
Rely on weighing airborne particles to determine concentrations
Labor intensive
Not real-time
Can be highly accurate, used to detect violations of air quality standards<br>
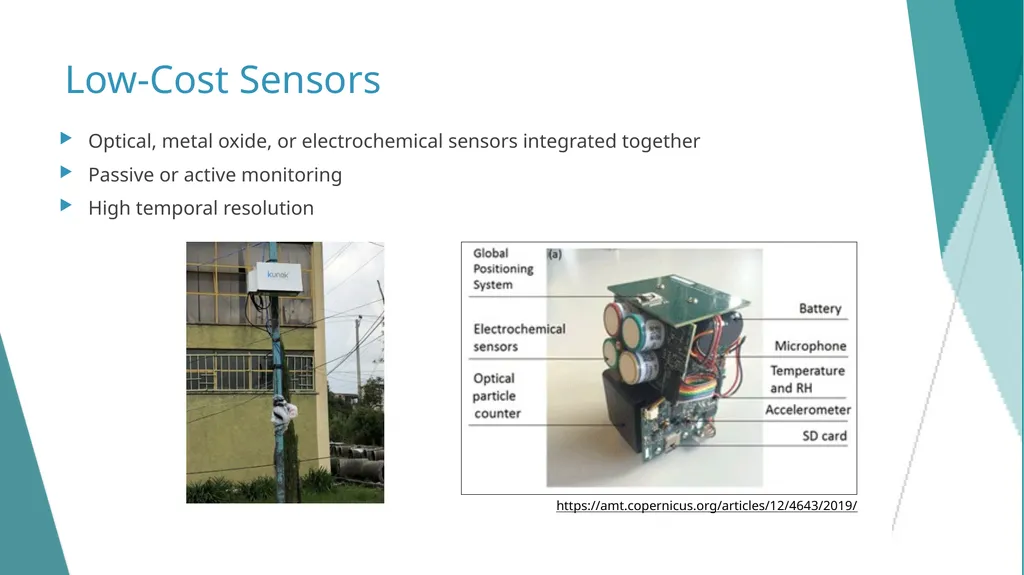
slide25. Low-Cost Sensors Optical, metal oxide, or electrochemical sensors integrated together
Passive or active monitoring
High temporal resolution https://amt.copernicus.org/articles/12/4643/2019/<br>
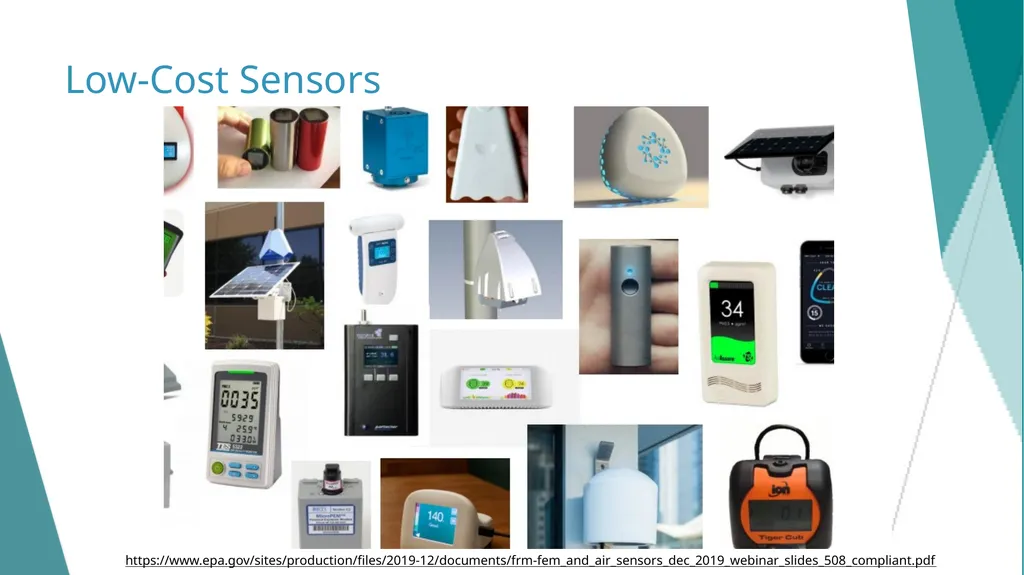
slide26. Low-Cost Sensors https://www.epa.gov/sites/production/files/2019-12/documents/frm-fem_and_air_sensors_dec_2019_webinar_slides_508_compliant.pdf<br>
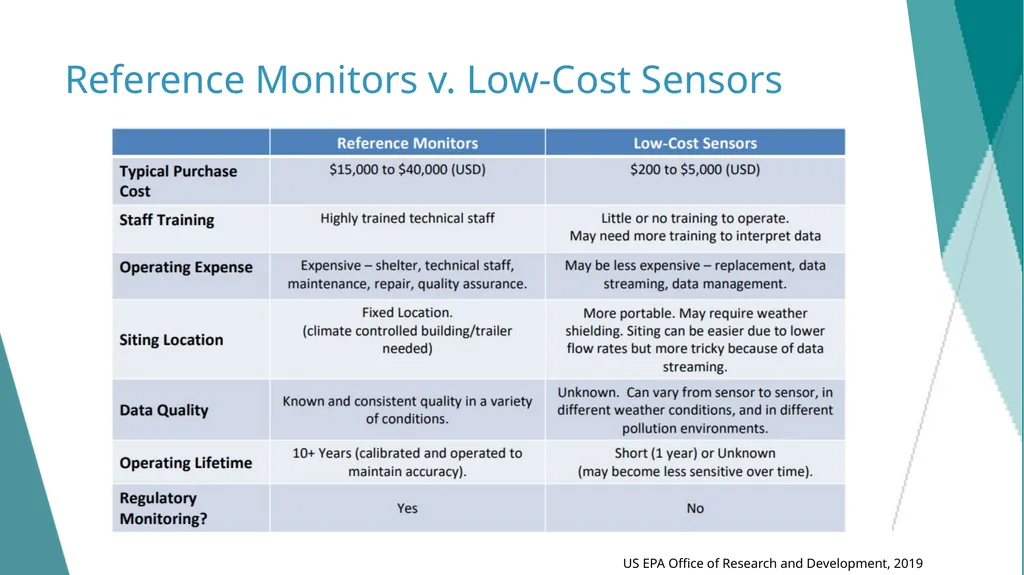
slide27. Reference Monitors v. Low-Cost Sensors US EPA Office of Research and Development, 2019<br>
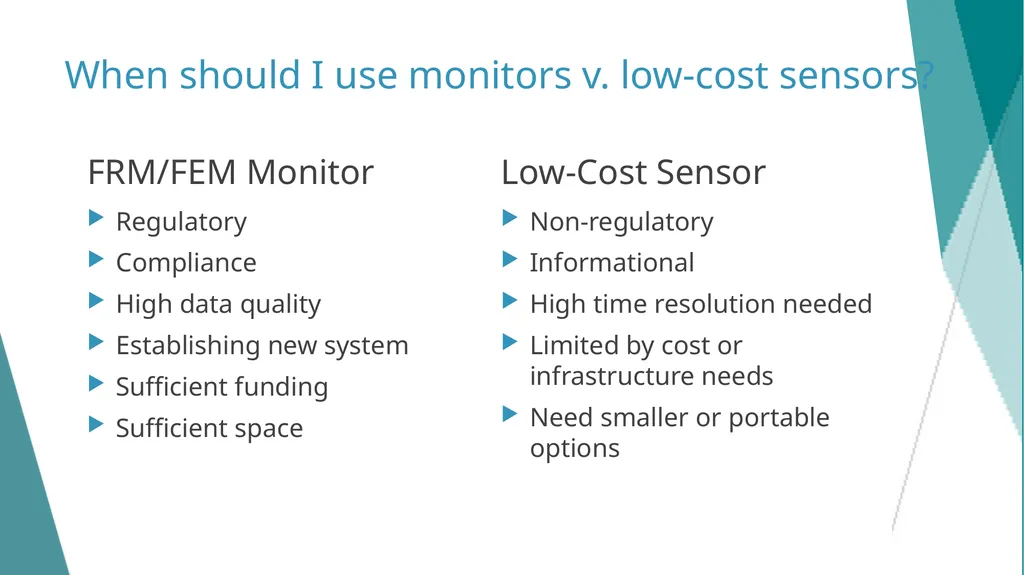
slide28. When should I use monitors v. low-cost sensors? FRM/FEM Monitor Regulatory
Compliance
High data quality
Establishing new system
Sufficient funding
Sufficient space Low-Cost Sensor Non-regulatory
Informational
High time resolution needed
Limited by cost or infrastructure needs
Need smaller or portable options<br>
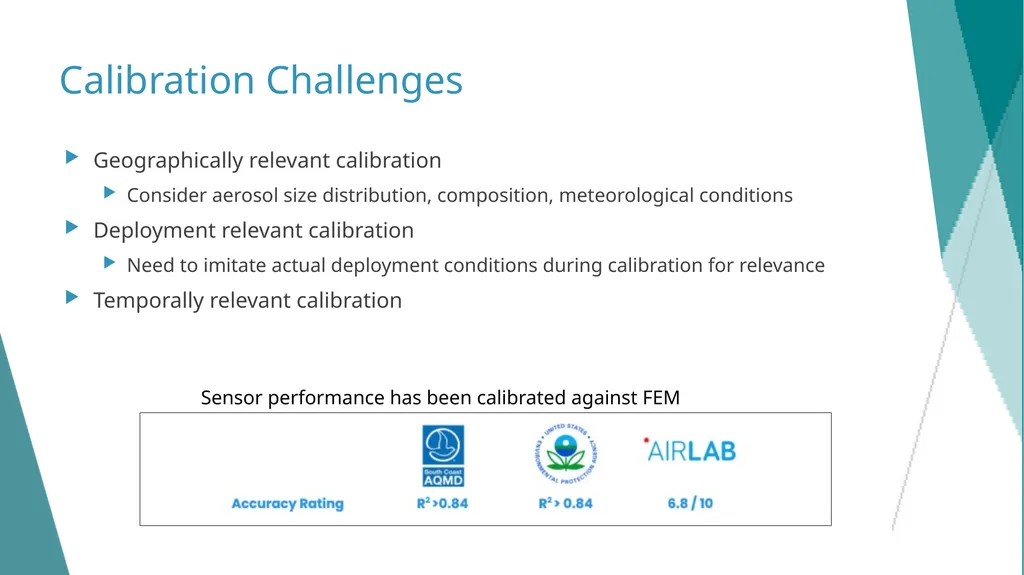
slide29. Calibration Challenges Geographically relevant calibration
Consider aerosol size distribution, composition, meteorological conditions
Deployment relevant calibration
Need to imitate actual deployment conditions during calibration for relevance
Temporally relevant calibration Sensor performance has been calibrated against FEM monitors.<br>
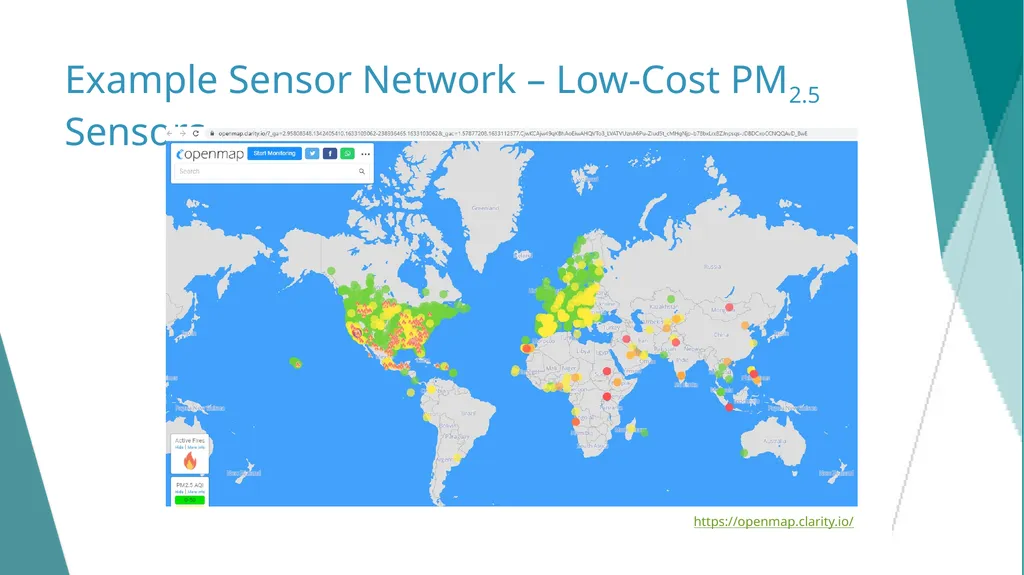
slide30. Example Sensor Network – Low-Cost PM2.5 Sensors https://openmap.clarity.io/<br>
slide31. AirNow Partnership of US EPA, NOAA, NPS, CDC, and more
Advance AQM worldwide through data and knowledge sharing
Helps decision makers communicate connections between air pollution, health, and sustainability goals
Helps inform and involve public in efforts to improve AQ
Collaborate on development of air quality tools
Advance air quality forecasting to support public health, raise public awareness, and advise sensitive populations
Build a community of people to share knowledge and expertise Airnow.gov<br>
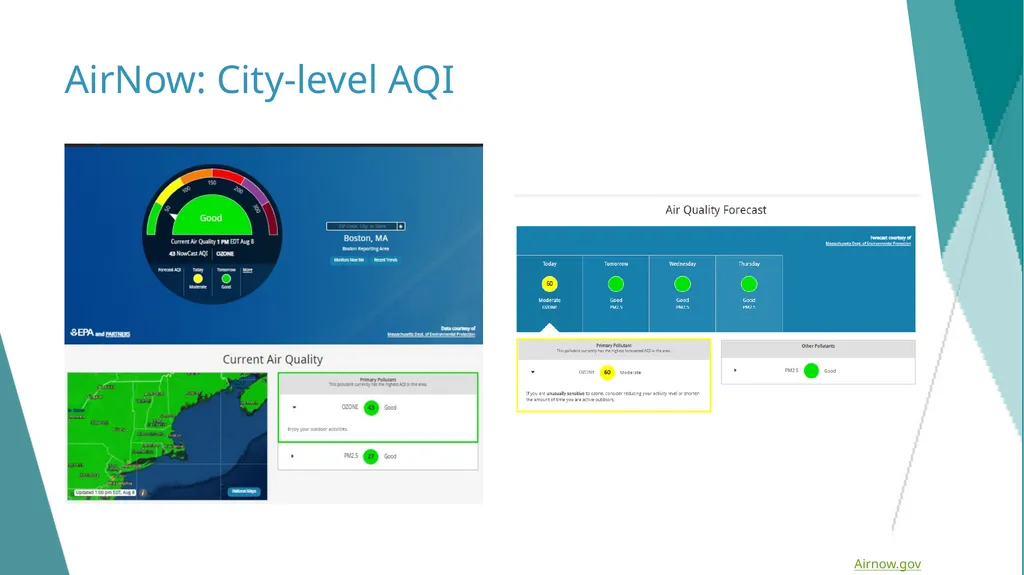
slide32. AirNow: City-level AQI Airnow.gov<br>
slide33. AirNow-International Helping countries and regions around the world inform the public about the quality of the air they breathe by providing real time air quality information
Provide tools and information to advance AQM worldwide
Collaborate on development of air quality tools
Advance air quality forecasting
Build a community of people to share knowledge and expertise https://www.airnow.gov/international/us-embassies-and-consulates/<br>
slide34. Global Environment Monitoring System for Air (GEMS/Air) Enables national governments to improve air quality by leveraging new innovations and technology
Allows governments and stakeholders to make evidenced-based decisions through increased use of air quality data
Based on three key strategic actions:
1. Innovation Labs (via pilot projects)
2. The Solutions Space
3. Upscaling 34 https://www.unep.org/explore-topics/air/what-we-do/monitoring-air-quality<br>
slide35. What monitors does [YOUR CITY] maintain? What pollutants do you measure? 35<br>
slide36. Section 4: Low-Cost Sensors and Remote Satellites 1. Objectives
2. Air Monitoring Basics
3. Monitoring Options
4. Low-Cost Sensors and Remote Satellites
5. Integrated Strategy
6. Infrastructure and Best Practices 36<br>
slide37. How to Collect Useful Data Using Sensors Ask a question
Are PM2.5 concentrations higher during rush hour than during other times of the day?
Develop an approach
Logistics, resources, data requirements
Determine sensor locations
Proximity to pollutant of interest, exposed population
Collect measurements
QC, maintenance
Data review, validation
Analyze, interpret, and communicate results<br>
slide38. Using Sensors for Analysis What questions are you asking of your sensor data?
How did you determine the sensor locations?
What do your maintenance procedures include?
How have you analyzed and reviewed data?
How have you communicated or reported on air quality data? 38<br>
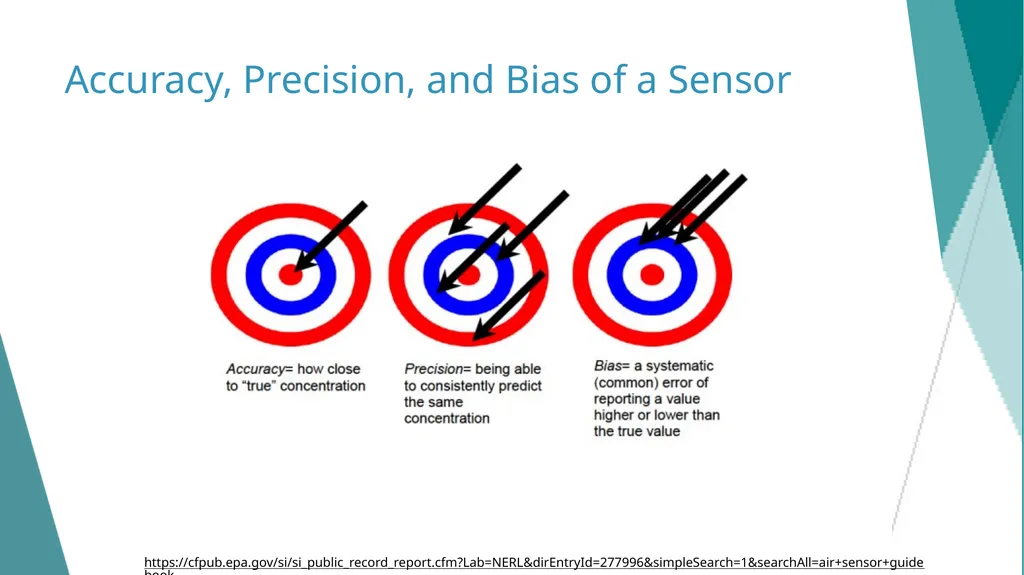
slide39. Accuracy, Precision, and Bias of a Sensor https://cfpub.epa.gov/si/si_public_record_report.cfm?Lab=NERL&dirEntryId=277996&simpleSearch=1&searchAll=air+sensor+guidebook 39<br>
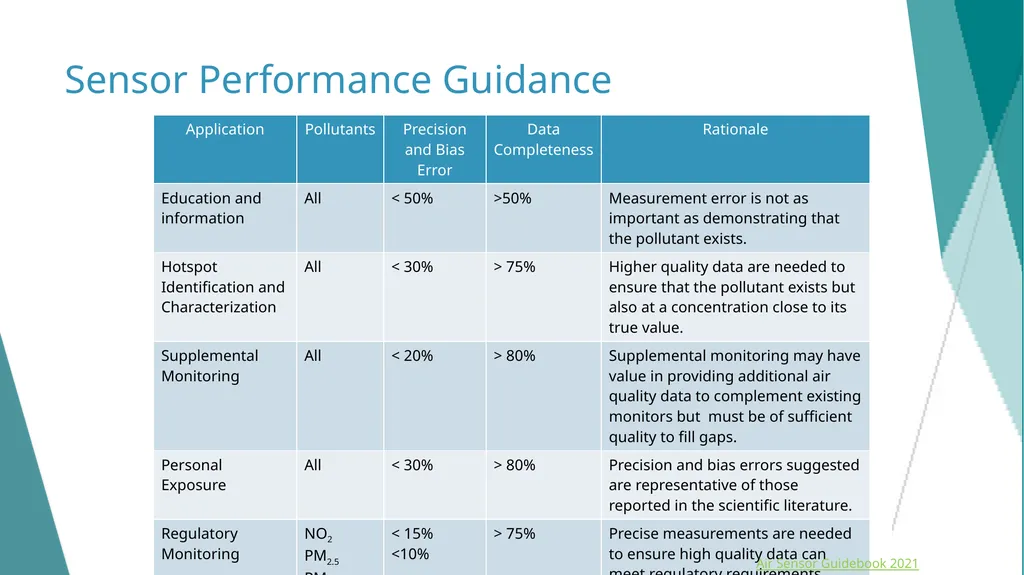
slide40. Sensor Performance Guidance Air Sensor Guidebook 2021 40<br>
slide41. Which of the sensor applications from the previous slide are most important to [YOUR CITY]? Least important? 41<br>
slide42. Resources: Performance of Low-Cost Sensors Low-cost sensors tend to be inaccurate compared to more expensive monitors, and require more labor to maintain
Air Quality Sensor Performance Evaluation Center, from South Coast Management District
Evaluates performance of commercially available “low-cost” sensors in the field and in the laboratory
EPA: Performance Testing Protocols, Metrics, and Target Values for Fine Particulate Matter Air Sensors
Relevant articles
Kang et al., “Performance evaluation of low-cost air quality sensors: A review” Link.
Zamora et al., “Evaluating the Performance of Using Low-Cost Sensors to Calibrate for Cross-Sensitivities in a Multipollutant Network” Link.
Tagle et al., “Field performance of a low-cost sensor in the monitoring of particulate matter in Santiago, Chile” Link.
Khreis et al., “Evaluating the Performance of Low-Cost Air Quality Monitors in Dallas, Texas” Link. 42<br>
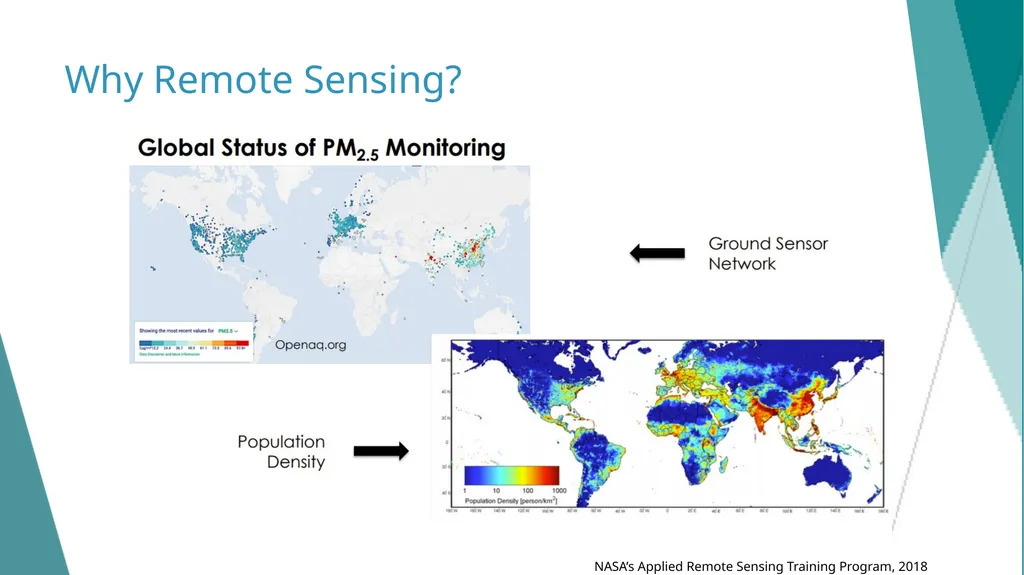
slide43. Why Remote Sensing? NASA’s Applied Remote Sensing Training Program, 2018<br>
slide44. Satellite-Based Air Quality Data Satellites measure radiance at solar wavelengths and infer presence of aerosols from how they impact radiance
Dependent on haze level height and planetary boundary layer height, which vary with geography, time of day, season, meteorological conditions
Complement sparse networks of ground-based monitors
Ground-based monitors needed to validate satellite data, which often underestimates concentrations Alvarado et al., 2019<br>
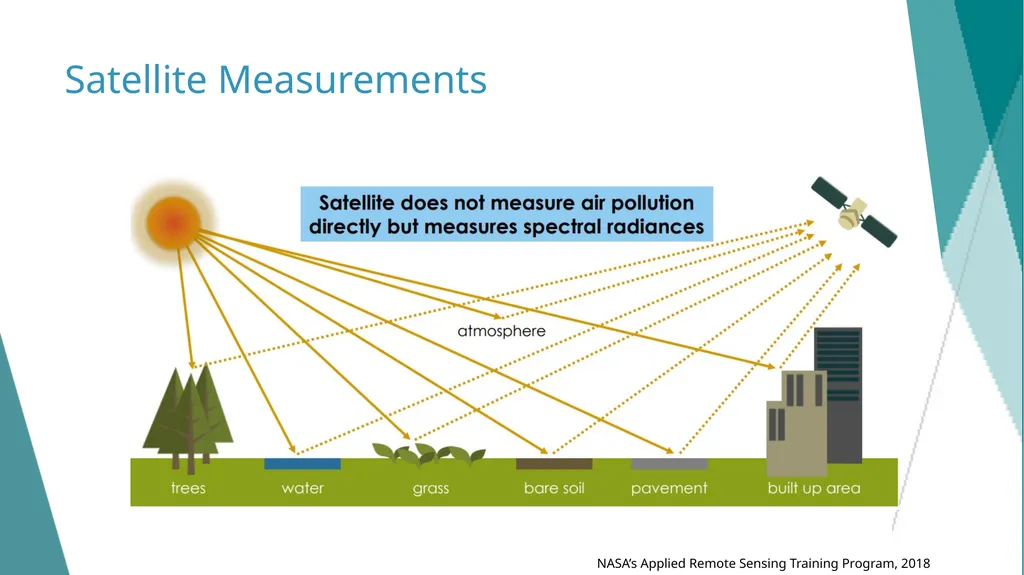
slide45. Satellite Measurements NASA’s Applied Remote Sensing Training Program, 2018<br>
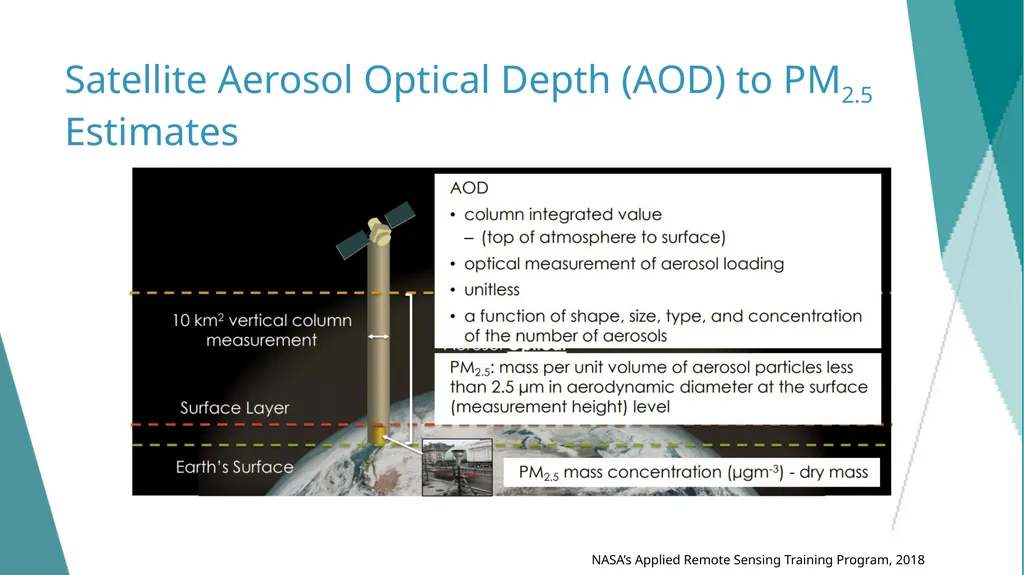
slide46. Satellite Aerosol Optical Depth (AOD) to PM2.5 Estimates NASA’s Applied Remote Sensing Training Program, 2018<br>
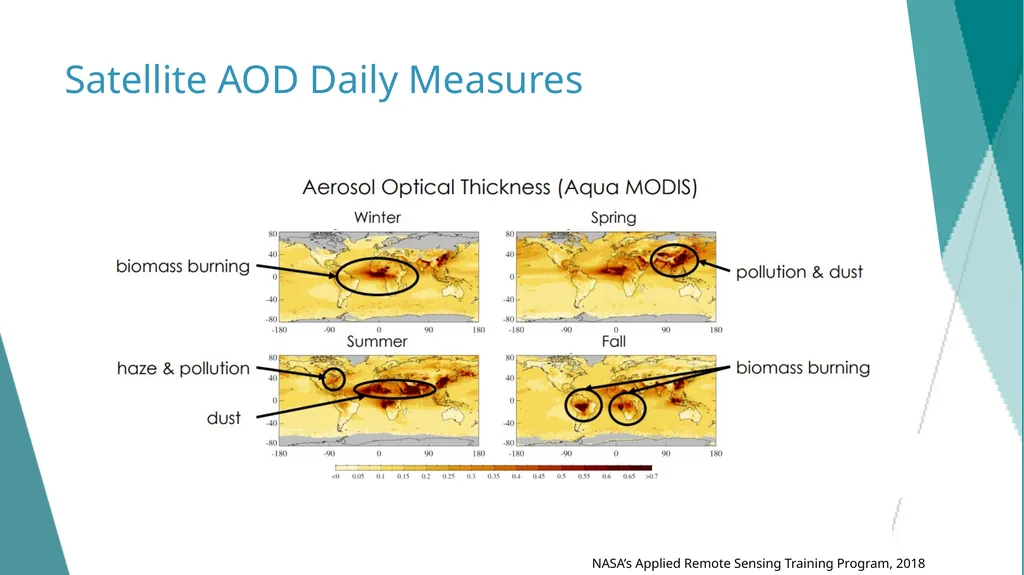
slide47. Satellite AOD Daily Measures NASA’s Applied Remote Sensing Training Program, 2018<br>
slide48. Satellite-based remote sensing is promising but does not replace ground-based monitors.<br>
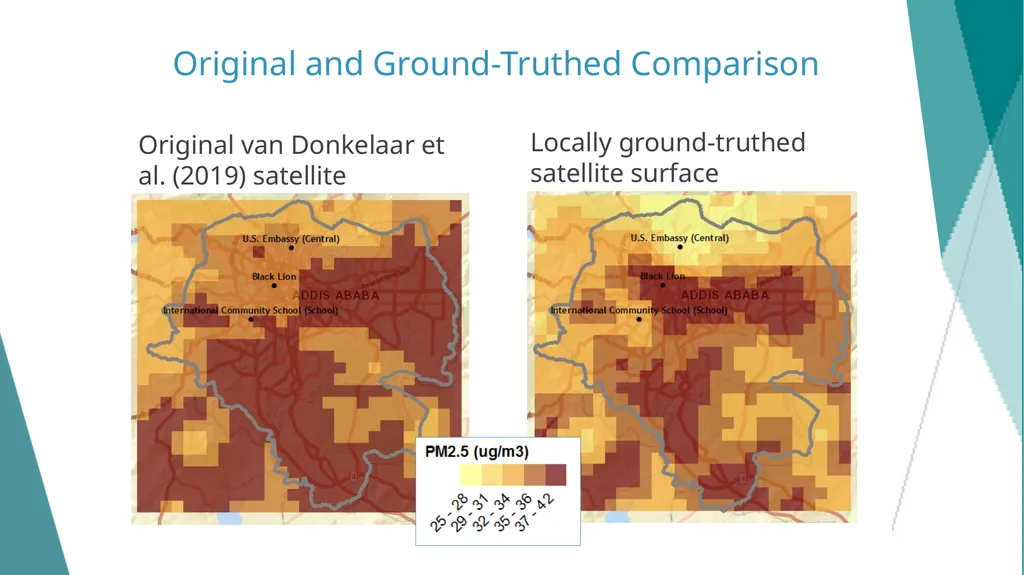
slide49. Original and Ground-Truthed Comparison Original van Donkelaar et al. (2019) satellite Locally ground-truthed satellite surface<br>
slide50. Section 5: Integrated Strategy 1. Objectives
2. Air Monitoring Basics
3. Monitoring Options
4. Low-Cost Sensors and Remote Satellites
5. Integrated Strategy
6. Infrastructure and Best Practices 50<br>
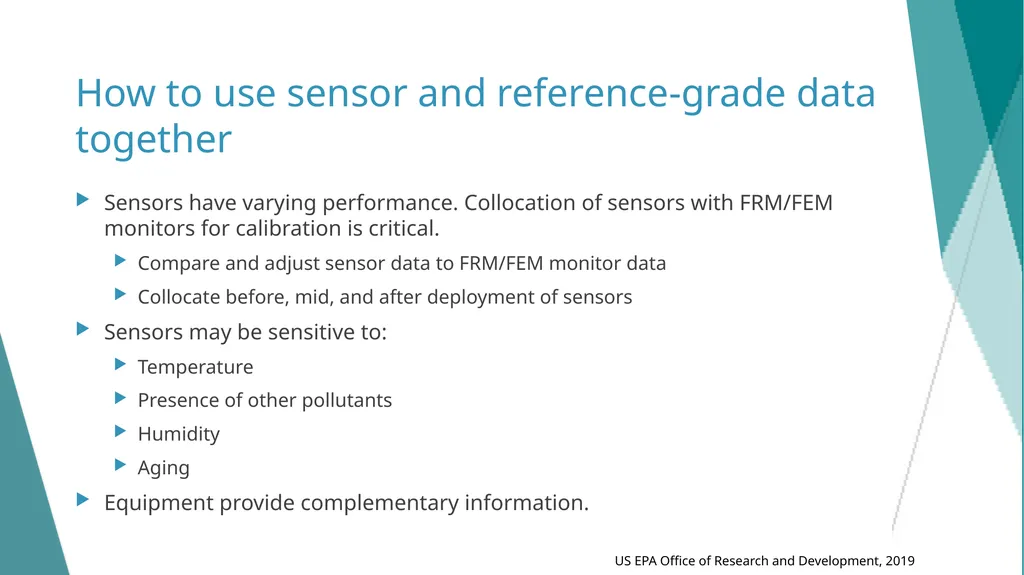
slide51. How to use sensor and reference-grade data together Sensors have varying performance. Collocation of sensors with FRM/FEM monitors for calibration is critical.
Compare and adjust sensor data to FRM/FEM monitor data
Collocate before, mid, and after deployment of sensors
Sensors may be sensitive to:
Temperature
Presence of other pollutants
Humidity
Aging
Equipment provide complementary information. US EPA Office of Research and Development, 2019<br>
slide52. Examples of Monitors and Sensors Working Together 52<br>
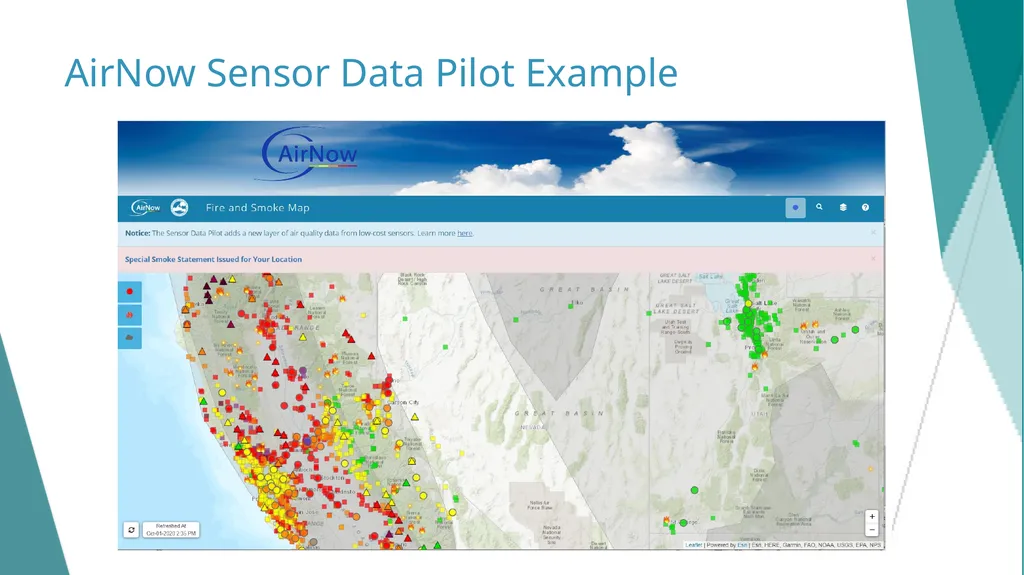
slide53. AirNow Sensor Data Pilot Example<br>
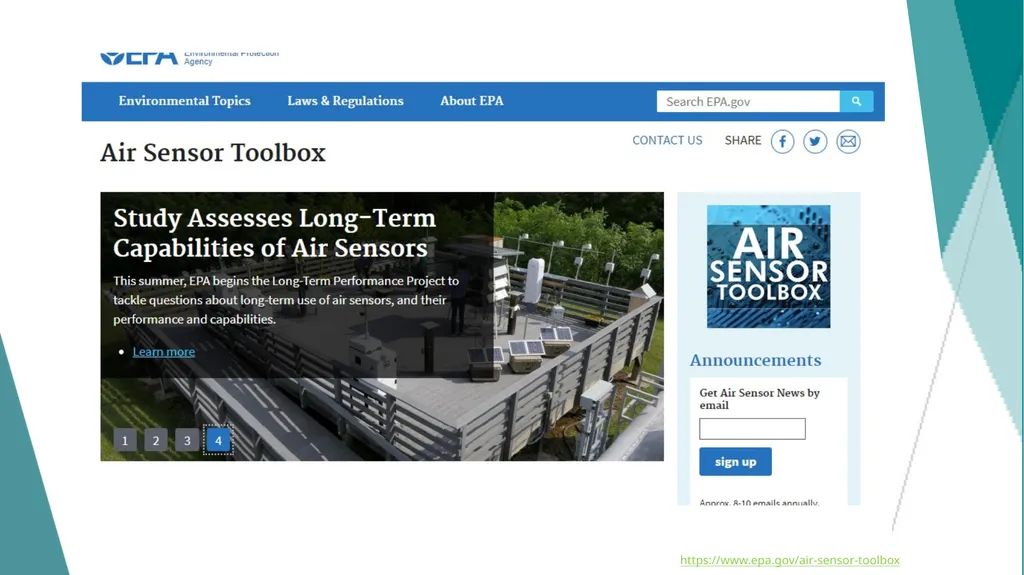
slide54. https://www.epa.gov/air-sensor-toolbox<br>
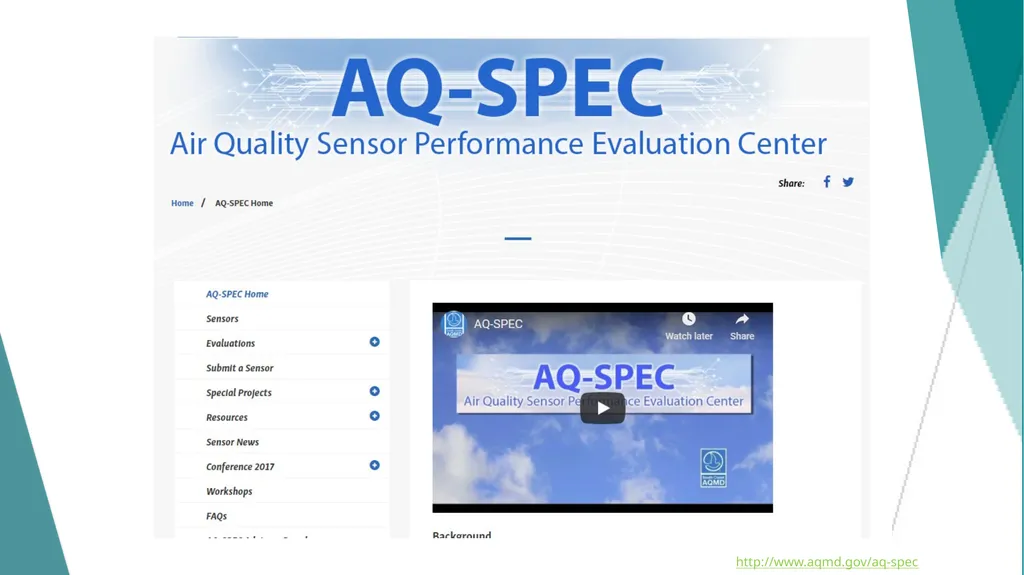
slide55. http://www.aqmd.gov/aq-spec<br>
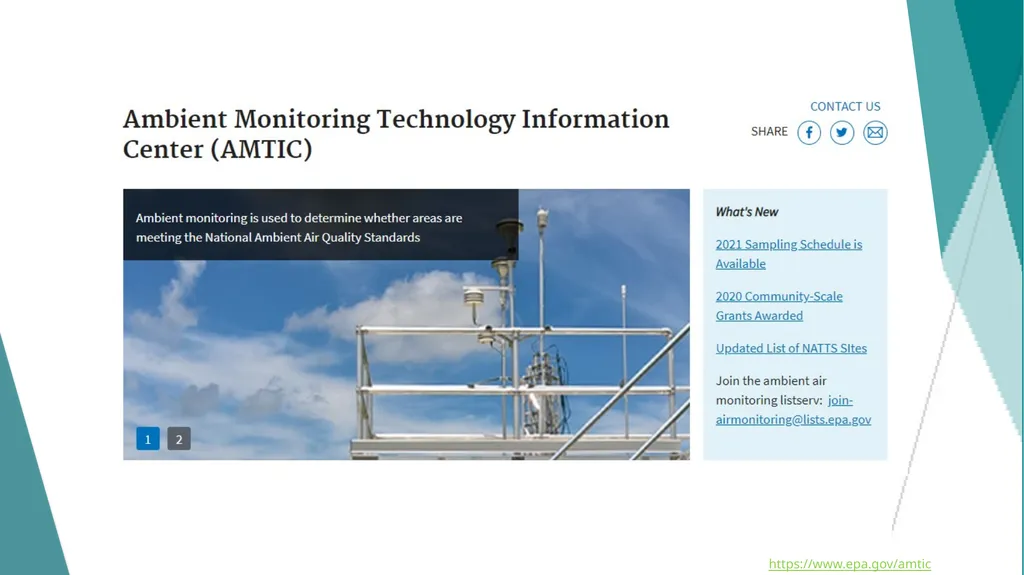
slide56. https://www.epa.gov/amtic<br>
slide57. Section 6: Infrastructure and Best Practices 1. Objectives
2. Air Monitoring Basics
3. Monitoring Options
4. Low-Cost Sensors and Remote Satellites
5. Integrated Strategy
6. Infrastructure and Best Practices 57<br>
slide58. Infrastructure Requirements Continuous and gravimetric monitors require power source
Continuous monitors need grid access
Can be supplemented with uninterrupted power supply (UPS) devices
Gravimetric samplers can use batteries; solar power
Monitors require internet access to transmit data to data management system
Internet access
Cellular access
Gravimetric filter monitors require field teams able to deploy and collect filters from monitoring sites<br>
slide59. Institutional Capacity Institutional coordination
Cross-governmental and cross-sectoral coordination
Staff capacity
Background and experience
Staff availability
Competing tasks
Funding resources
Internal funding
Donor funding<br>
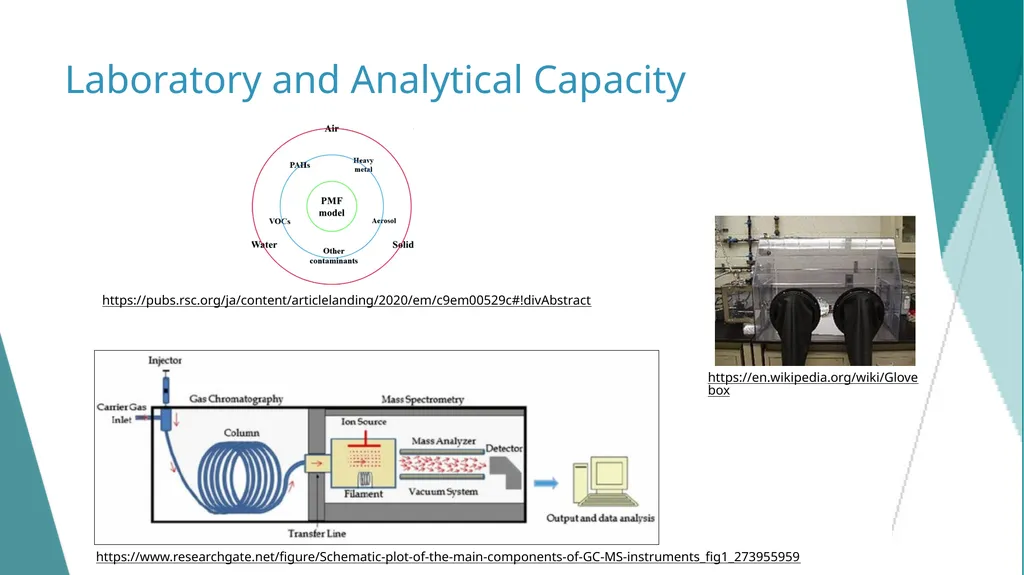
slide60. Laboratory and Analytical Capacity https://en.wikipedia.org/wiki/Glovebox https://www.researchgate.net/figure/Schematic-plot-of-the-main-components-of-GC-MS-instruments_fig1_273955959 https://pubs.rsc.org/ja/content/articlelanding/2020/em/c9em00529c#!divAbstract<br>
slide61. Data Management Best Practices Archival
Reliable, redundant storage of data
Also contains quality assurance information
Accessibility
Analysis to inform decision-making
What analysis is needed to achieve AQ management goals?
Large community building open-source tools
Public communication
Consider how to reach sensitive subgroups
Data should be paired with messages that inform action<br>
slide62. Quality assurance planning is a critical component to air monitoring strategies.<br>
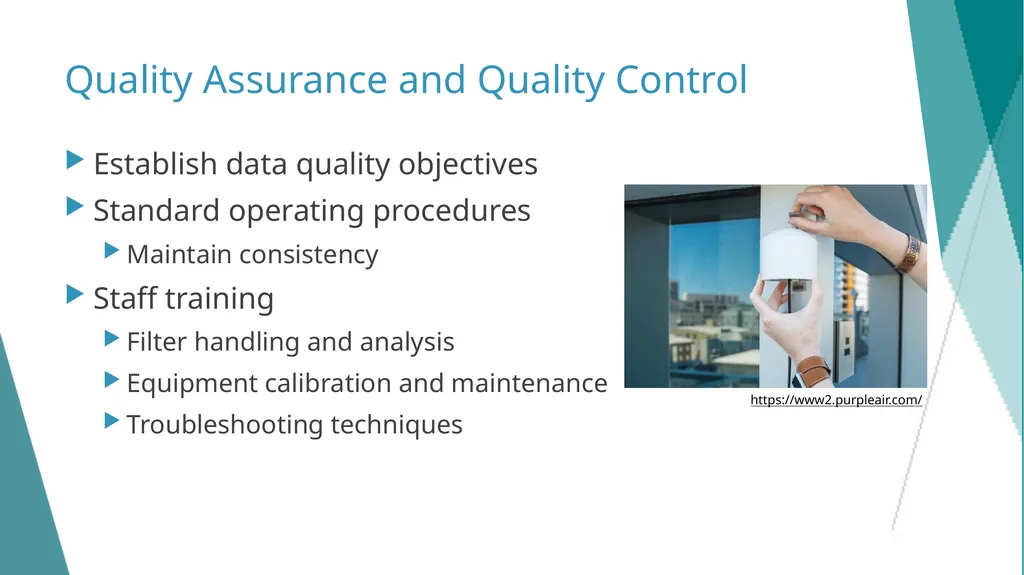
slide63. Quality Assurance and Quality Control Establish data quality objectives
Standard operating procedures
Maintain consistency
Staff training
Filter handling and analysis
Equipment calibration and maintenance
Troubleshooting techniques https://www2.purpleair.com/<br>
slide64. Additional Resources EPA: Performance Testing Protocols, Metrics, and Target Values for Fine Particulate Matter Air Sensors
EPA: Air Sensor Guidebook 64<br>
slide65. Thank you! 65<br>
See speaker notes for an additional description of slide content. Slides should be edited or added to as necessary for your particular needs. Slides with highlighted yellow text require the addition of specific context and information for your city. 1<br>
slide2. Ambient Air Quality Monitoring<br>
slide3. Overview 1. Objectives
2. Air Monitoring Basics
3. Monitoring Options
4. Low-Cost Sensors and Remote Satellites
5. Integrated Strategy
6. Infrastructure and Best Practices 3<br>
slide4. Section 1: Objectives 1. Objectives
2. Air Monitoring Basics
3. Monitoring Options
4. Low-Cost Sensors and Remote Satellites
5. Integrated Strategy
6. Infrastructure and Best Practices 4<br>
slide5. Air Quality Monitoring System Guidance Measurement strategies should fit a purpose
A successful, sustainable monitoring strategy requires more than equipment
Equipment costs are not the full costs
Quality assurance planning is a critical component to air monitoring strategies
Satellite-based remote sensing is promising but does not replace ground-based monitors
Measurement systems are necessary but not sufficient to reduce pollution Filling the Gaps: Improving measurement of ambient air quality in low and middle income countries. The World Bank, U.S. Environmental Protection Agency, U.S. Department of State. 2017 5<br>
slide6. Air Quality Monitoring Goals Support compliance with ambient air quality standards
Assess highly polluted areas or large emission contributors
Maintain regulations of pollution levels
Evaluate background concentrations and health risks in population centers
Provide justification for health targets through epidemiological modeling
Report air quality to the public
Alerts public to protect themselves against poor AQ days
Provides public pressure for legislation
Support air pollution research
Collaboration with local or external research efforts 6<br>
slide7. A successful, sustainable monitoring strategy requires more than equipment.<br>
slide8. Setting Monitoring Objectives Objectives should be set in support of air quality monitoring goals
Limited resources require targeted and tactful monitor placement and implementation Example Monitoring Objectives 8<br>
slide9. Measuring the Air in Low- and Middle-Income countries (LMICs) Air quality management systems should include a measurement component to address policy objectives and document trends over time
Measurement systems have a broad range of capabilities characterized by:
Prevalence
Measurement fidelity/accuracy
Data availability
Available support https://www.hindustantimes.com/indore/pollution-in-indore-gets-an-intervention/story-Wde8DBSMtJYfGn1ThPVLIO.html<br>
slide10. What are [YOUR CITY]’s monitoring objectives? 10<br>
slide11. Section 2: Air Monitoring Basics 1. Objectives
2. Air Monitoring Basics
3. Monitoring Options
4. Low-Cost Sensors and Remote Satellites
5. Integrated Strategy
6. Infrastructure and Best Practices 11<br>
slide12. Air Monitoring Basics Ambient Monitoring
Systematic, long-term assessment of air pollutant levels
Measures quantity and type of pollutants in outdoor air
Emissions Measurement
Monitoring particulate and gaseous emissions from a specific source https://www.flickr.com/photos/brewbooks/3122790831/ Image Source<br>
slide13. Air Quality Monitoring Air quality monitoring is performed to:
Assess the extent of air pollution
Ensure compliance with national legislation
Evaluate air quality control options
Provide data for air quality modeling
Understand human exposures
Monitoring types
Active
Passive
Remote sensing https://commons.wikimedia.org/wiki/File:RapidEye_Satellites_Artist_Impression.jpg<br>
slide14. There are many pollutants to monitor: Ground-Level Ozone Carbon Monoxide Sulfur Dioxide Particulate Matter Lead Nitrogen Dioxide https://www.epa.gov/criteria-air-pollutants<br>
slide15. Pollutant Basics Air Sensor Guidebook 2021 15<br>
slide16. Monitoring Network Strategies Human health objective
Stations in population centers, near busy roads, in city centers, near schools or hospitals, background sites
Monitoring strategies should consider:
Investment costs, operating and maintenance costs, reliability of system, staff capacity, operation requirements
Data management systems and databases
Data storage
Data retrieval
Data analysis
Used in conjunction with meteorological and source activity data<br>
slide17. Section 3: Monitoring Options 1. Objectives
2. Air Monitoring Basics
3. Monitoring Options
4. Low-Cost Sensors and Remote Satellites
5. Integrated Strategy
6. Infrastructure and Best Practices 17<br>
slide18. Monitoring Options Kunak sensor in Addis Ababa, 2019 National Meteorological Agency Shelter in Addis Ababa, 2018 Teledyne T640, AE33 aethalometer, and datalogger installation in Accra, 2020<br>
slide19. Monitor Types U.S. EPA formally evaluates technologies proposed to monitor compliance with the National Ambient Air Quality Standards (NAAQS)
Federal Reference Method (FRM)
Provides fundamentally sound and scientifically defensible concentration measurements
Serve as the basis of comparison to judge other methods
Federal Equivalence Method (FEM)
Provide comparable level of compliance decision making quality as FRMs US EPA Office of Research and Development, 2019<br>
slide20. Federal Reference Method Monitors AirMetrics Sampler http://www.airmetrics.com/images/headers/applications.jpg MiniVol Sampler https://geneq.com/environment/image/cache/catalog/old/products-3/Airmetrics-pm2-512x512.jpg<br>
slide21. Federal Equivalency Method Monitors TEOM Continuous Ambient Particulate Monitor https://assets.thermofisher.com/TFS-Assets/CAD/product-images/teom-1405.jpg-650.jpg Teledyne T640 Particulate Monitor https://www.teledyne-api.com/prod/particulatematter/PublishingImages/T640-monitor.png BAM 1020 Continuous Particulate Monitor https://metone.com/products/bam-1020/<br>
slide22. Continuous Air Quality Monitors - PM Beta Attenuation Monitor (BAM)
At U.S. Embassies
Continuous particulate monitor (PM10, PM2.5)
U.S. EPA FEM
Long term unattended remote operation
Low operating costs
Automatic calibration checks
Controls humidity
Hourly filter
Integrated datalogger for data output https://www.et.co.uk/products/air-quality-monitoring/particulate-monitoring/bam1020-2/<br>
slide23. Continuous Air Quality Monitors Tapered Element Oscillating Microbalance Monitor (TEOM)
Continuous particulate monitor (PM10, PM2.5, PM1)
US EPA FEM
Draws ambient air through filter at constant flow rate, weighing the filter and calculating real time mass concentrations of PM
Controls ambient temperature and pressure https://assets.thermofisher.com/TFS-Assets/CAD/product-images/teom-1405f.jpg-650.jpg<br>
slide24. Gravimetric Air Quality Monitors - PM Gravimetric monitors
U.S. EPA FRM
Rely on weighing airborne particles to determine concentrations
Labor intensive
Not real-time
Can be highly accurate, used to detect violations of air quality standards<br>
slide25. Low-Cost Sensors Optical, metal oxide, or electrochemical sensors integrated together
Passive or active monitoring
High temporal resolution https://amt.copernicus.org/articles/12/4643/2019/<br>
slide26. Low-Cost Sensors https://www.epa.gov/sites/production/files/2019-12/documents/frm-fem_and_air_sensors_dec_2019_webinar_slides_508_compliant.pdf<br>
slide27. Reference Monitors v. Low-Cost Sensors US EPA Office of Research and Development, 2019<br>
slide28. When should I use monitors v. low-cost sensors? FRM/FEM Monitor Regulatory
Compliance
High data quality
Establishing new system
Sufficient funding
Sufficient space Low-Cost Sensor Non-regulatory
Informational
High time resolution needed
Limited by cost or infrastructure needs
Need smaller or portable options<br>
slide29. Calibration Challenges Geographically relevant calibration
Consider aerosol size distribution, composition, meteorological conditions
Deployment relevant calibration
Need to imitate actual deployment conditions during calibration for relevance
Temporally relevant calibration Sensor performance has been calibrated against FEM monitors.<br>
slide30. Example Sensor Network – Low-Cost PM2.5 Sensors https://openmap.clarity.io/<br>
slide31. AirNow Partnership of US EPA, NOAA, NPS, CDC, and more
Advance AQM worldwide through data and knowledge sharing
Helps decision makers communicate connections between air pollution, health, and sustainability goals
Helps inform and involve public in efforts to improve AQ
Collaborate on development of air quality tools
Advance air quality forecasting to support public health, raise public awareness, and advise sensitive populations
Build a community of people to share knowledge and expertise Airnow.gov<br>
slide32. AirNow: City-level AQI Airnow.gov<br>
slide33. AirNow-International Helping countries and regions around the world inform the public about the quality of the air they breathe by providing real time air quality information
Provide tools and information to advance AQM worldwide
Collaborate on development of air quality tools
Advance air quality forecasting
Build a community of people to share knowledge and expertise https://www.airnow.gov/international/us-embassies-and-consulates/<br>
slide34. Global Environment Monitoring System for Air (GEMS/Air) Enables national governments to improve air quality by leveraging new innovations and technology
Allows governments and stakeholders to make evidenced-based decisions through increased use of air quality data
Based on three key strategic actions:
1. Innovation Labs (via pilot projects)
2. The Solutions Space
3. Upscaling 34 https://www.unep.org/explore-topics/air/what-we-do/monitoring-air-quality<br>
slide35. What monitors does [YOUR CITY] maintain? What pollutants do you measure? 35<br>
slide36. Section 4: Low-Cost Sensors and Remote Satellites 1. Objectives
2. Air Monitoring Basics
3. Monitoring Options
4. Low-Cost Sensors and Remote Satellites
5. Integrated Strategy
6. Infrastructure and Best Practices 36<br>
slide37. How to Collect Useful Data Using Sensors Ask a question
Are PM2.5 concentrations higher during rush hour than during other times of the day?
Develop an approach
Logistics, resources, data requirements
Determine sensor locations
Proximity to pollutant of interest, exposed population
Collect measurements
QC, maintenance
Data review, validation
Analyze, interpret, and communicate results<br>
slide38. Using Sensors for Analysis What questions are you asking of your sensor data?
How did you determine the sensor locations?
What do your maintenance procedures include?
How have you analyzed and reviewed data?
How have you communicated or reported on air quality data? 38<br>
slide39. Accuracy, Precision, and Bias of a Sensor https://cfpub.epa.gov/si/si_public_record_report.cfm?Lab=NERL&dirEntryId=277996&simpleSearch=1&searchAll=air+sensor+guidebook 39<br>
slide40. Sensor Performance Guidance Air Sensor Guidebook 2021 40<br>
slide41. Which of the sensor applications from the previous slide are most important to [YOUR CITY]? Least important? 41<br>
slide42. Resources: Performance of Low-Cost Sensors Low-cost sensors tend to be inaccurate compared to more expensive monitors, and require more labor to maintain
Air Quality Sensor Performance Evaluation Center, from South Coast Management District
Evaluates performance of commercially available “low-cost” sensors in the field and in the laboratory
EPA: Performance Testing Protocols, Metrics, and Target Values for Fine Particulate Matter Air Sensors
Relevant articles
Kang et al., “Performance evaluation of low-cost air quality sensors: A review” Link.
Zamora et al., “Evaluating the Performance of Using Low-Cost Sensors to Calibrate for Cross-Sensitivities in a Multipollutant Network” Link.
Tagle et al., “Field performance of a low-cost sensor in the monitoring of particulate matter in Santiago, Chile” Link.
Khreis et al., “Evaluating the Performance of Low-Cost Air Quality Monitors in Dallas, Texas” Link. 42<br>
slide43. Why Remote Sensing? NASA’s Applied Remote Sensing Training Program, 2018<br>
slide44. Satellite-Based Air Quality Data Satellites measure radiance at solar wavelengths and infer presence of aerosols from how they impact radiance
Dependent on haze level height and planetary boundary layer height, which vary with geography, time of day, season, meteorological conditions
Complement sparse networks of ground-based monitors
Ground-based monitors needed to validate satellite data, which often underestimates concentrations Alvarado et al., 2019<br>
slide45. Satellite Measurements NASA’s Applied Remote Sensing Training Program, 2018<br>
slide46. Satellite Aerosol Optical Depth (AOD) to PM2.5 Estimates NASA’s Applied Remote Sensing Training Program, 2018<br>
slide47. Satellite AOD Daily Measures NASA’s Applied Remote Sensing Training Program, 2018<br>
slide48. Satellite-based remote sensing is promising but does not replace ground-based monitors.<br>
slide49. Original and Ground-Truthed Comparison Original van Donkelaar et al. (2019) satellite Locally ground-truthed satellite surface<br>
slide50. Section 5: Integrated Strategy 1. Objectives
2. Air Monitoring Basics
3. Monitoring Options
4. Low-Cost Sensors and Remote Satellites
5. Integrated Strategy
6. Infrastructure and Best Practices 50<br>
slide51. How to use sensor and reference-grade data together Sensors have varying performance. Collocation of sensors with FRM/FEM monitors for calibration is critical.
Compare and adjust sensor data to FRM/FEM monitor data
Collocate before, mid, and after deployment of sensors
Sensors may be sensitive to:
Temperature
Presence of other pollutants
Humidity
Aging
Equipment provide complementary information. US EPA Office of Research and Development, 2019<br>
slide52. Examples of Monitors and Sensors Working Together 52<br>
slide53. AirNow Sensor Data Pilot Example<br>
slide54. https://www.epa.gov/air-sensor-toolbox<br>
slide55. http://www.aqmd.gov/aq-spec<br>
slide56. https://www.epa.gov/amtic<br>
slide57. Section 6: Infrastructure and Best Practices 1. Objectives
2. Air Monitoring Basics
3. Monitoring Options
4. Low-Cost Sensors and Remote Satellites
5. Integrated Strategy
6. Infrastructure and Best Practices 57<br>
slide58. Infrastructure Requirements Continuous and gravimetric monitors require power source
Continuous monitors need grid access
Can be supplemented with uninterrupted power supply (UPS) devices
Gravimetric samplers can use batteries; solar power
Monitors require internet access to transmit data to data management system
Internet access
Cellular access
Gravimetric filter monitors require field teams able to deploy and collect filters from monitoring sites<br>
slide59. Institutional Capacity Institutional coordination
Cross-governmental and cross-sectoral coordination
Staff capacity
Background and experience
Staff availability
Competing tasks
Funding resources
Internal funding
Donor funding<br>
slide60. Laboratory and Analytical Capacity https://en.wikipedia.org/wiki/Glovebox https://www.researchgate.net/figure/Schematic-plot-of-the-main-components-of-GC-MS-instruments_fig1_273955959 https://pubs.rsc.org/ja/content/articlelanding/2020/em/c9em00529c#!divAbstract<br>
slide61. Data Management Best Practices Archival
Reliable, redundant storage of data
Also contains quality assurance information
Accessibility
Analysis to inform decision-making
What analysis is needed to achieve AQ management goals?
Large community building open-source tools
Public communication
Consider how to reach sensitive subgroups
Data should be paired with messages that inform action<br>
slide62. Quality assurance planning is a critical component to air monitoring strategies.<br>
slide63. Quality Assurance and Quality Control Establish data quality objectives
Standard operating procedures
Maintain consistency
Staff training
Filter handling and analysis
Equipment calibration and maintenance
Troubleshooting techniques https://www2.purpleair.com/<br>
slide64. Additional Resources EPA: Performance Testing Protocols, Metrics, and Target Values for Fine Particulate Matter Air Sensors
EPA: Air Sensor Guidebook 64<br>
slide65. Thank you! 65<br>