
ENWL’s updated cost performance under Ofgem’s
TF
Published · 29 slides · 0 views

1 / 1
Description
ENWLs updated cost performance under Ofgems RIIO-ED1 cost assessment methodology Prepared for Electricity North West Limited November 2021 Strictly confidential Oxera, 2021. Overview Executive summary Background Top-down TOTEX models
Related Topics
Share
Embed code
Download this presentation From Below
"ENWL’s updated cost performance under Ofgem’s" is the property of its rightful owner. Permission is granted to download and print the materials on this website for personal, non-commercial use only, and to display it on your personal computer provided you do not modify the materials and that you retain all copyright notices contained in the materials. By downloading content from our website, you accept the terms of this agreement.
Presentation Transcript
01
ENWL’s updated cost performance under Ofgem’s RIIO-ED1 cost assessment methodology Prepared for
Electricity North West Limited
November 2021 Strictly confidential
© Oxera, 2021.<br>
Electricity North West Limited
November 2021 Strictly confidential
© Oxera, 2021.<br>
02
Overview Executive summary
Background
Top-down TOTEX models
Bottom-up TOTEX models
Appendix
Glossary of terms
ED1 framework summary Strictly confidential 2<br>
Background
Top-down TOTEX models
Bottom-up TOTEX models
Appendix
Glossary of terms
ED1 framework summary Strictly confidential 2<br>
03
1. Executive summary Strictly confidential 3<br>
04
Executive summary
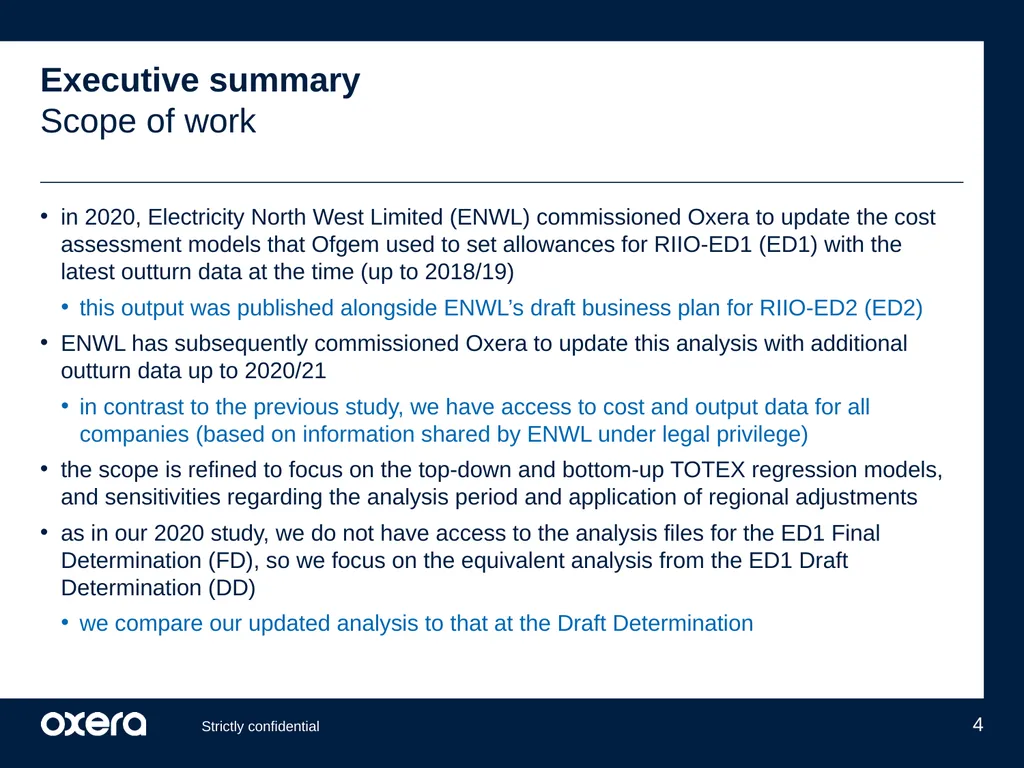
Scope of work in 2020, Electricity North West Limited (ENWL) commissioned Oxera to update the cost assessment models that Ofgem used to set allowances for RIIO-ED1 (ED1) with the latest outturn data at the time (up to 2018/19)
this output was published alongside ENWL’s draft business plan for RIIO-ED2 (ED2)
ENWL has subsequently commissioned Oxera to update this analysis with additional outturn data up to 2020/21
in contrast to the previous study, we have access to cost and output data for all companies (based on information shared by ENWL under legal privilege)
the scope is refined to focus on the top-down and bottom-up TOTEX regression models, and sensitivities regarding the analysis period and application of regional adjustments
as in our 2020 study, we do not have access to the analysis files for the ED1 Final Determination (FD), so we focus on the equivalent analysis from the ED1 Draft Determination (DD)
we compare our updated analysis to that at the Draft Determination Strictly confidential 4<br>
this output was published alongside ENWL’s draft business plan for RIIO-ED2 (ED2)
ENWL has subsequently commissioned Oxera to update this analysis with additional outturn data up to 2020/21
in contrast to the previous study, we have access to cost and output data for all companies (based on information shared by ENWL under legal privilege)
the scope is refined to focus on the top-down and bottom-up TOTEX regression models, and sensitivities regarding the analysis period and application of regional adjustments
as in our 2020 study, we do not have access to the analysis files for the ED1 Final Determination (FD), so we focus on the equivalent analysis from the ED1 Draft Determination (DD)
we compare our updated analysis to that at the Draft Determination Strictly confidential 4<br>
05
Executive summary
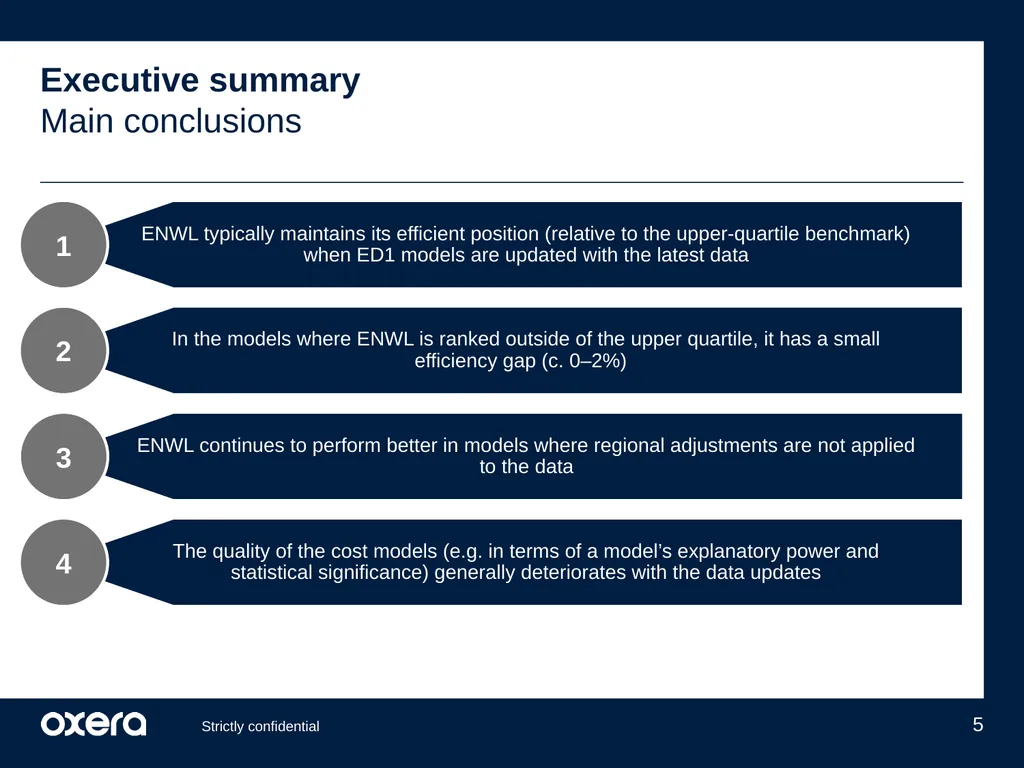
Main conclusions Strictly confidential 5<br>
06
2. Background and methodology Strictly confidential 6<br>
07
Background
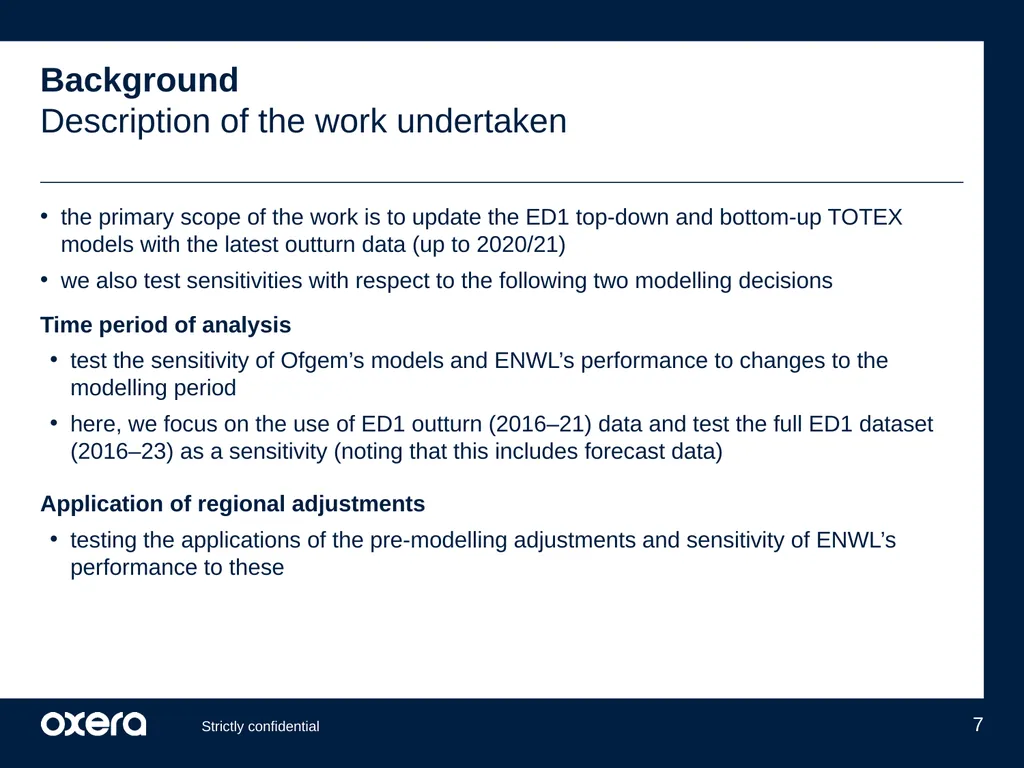
Description of the work undertaken Strictly confidential 7 the primary scope of the work is to update the ED1 top-down and bottom-up TOTEX models with the latest outturn data (up to 2020/21)
we also test sensitivities with respect to the following two modelling decisions
Time period of analysis
test the sensitivity of Ofgem’s models and ENWL’s performance to changes to the modelling period
here, we focus on the use of ED1 outturn (2016–21) data and test the full ED1 dataset (2016–23) as a sensitivity (noting that this includes forecast data)
Application of regional adjustments
testing the applications of the pre-modelling adjustments and sensitivity of ENWL’s performance to these<br>
we also test sensitivities with respect to the following two modelling decisions
Time period of analysis
test the sensitivity of Ofgem’s models and ENWL’s performance to changes to the modelling period
here, we focus on the use of ED1 outturn (2016–21) data and test the full ED1 dataset (2016–23) as a sensitivity (noting that this includes forecast data)
Application of regional adjustments
testing the applications of the pre-modelling adjustments and sensitivity of ENWL’s performance to these<br>
08
Background
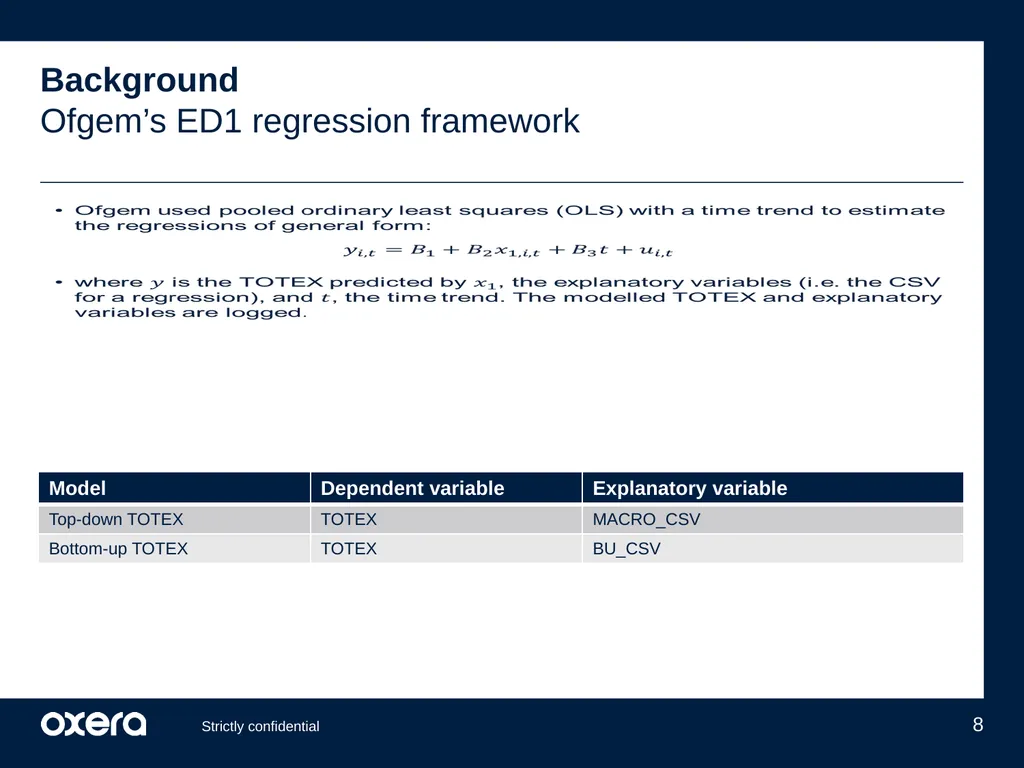
Ofgem’s ED1 regression framework Strictly confidential 8<br>
09
Background
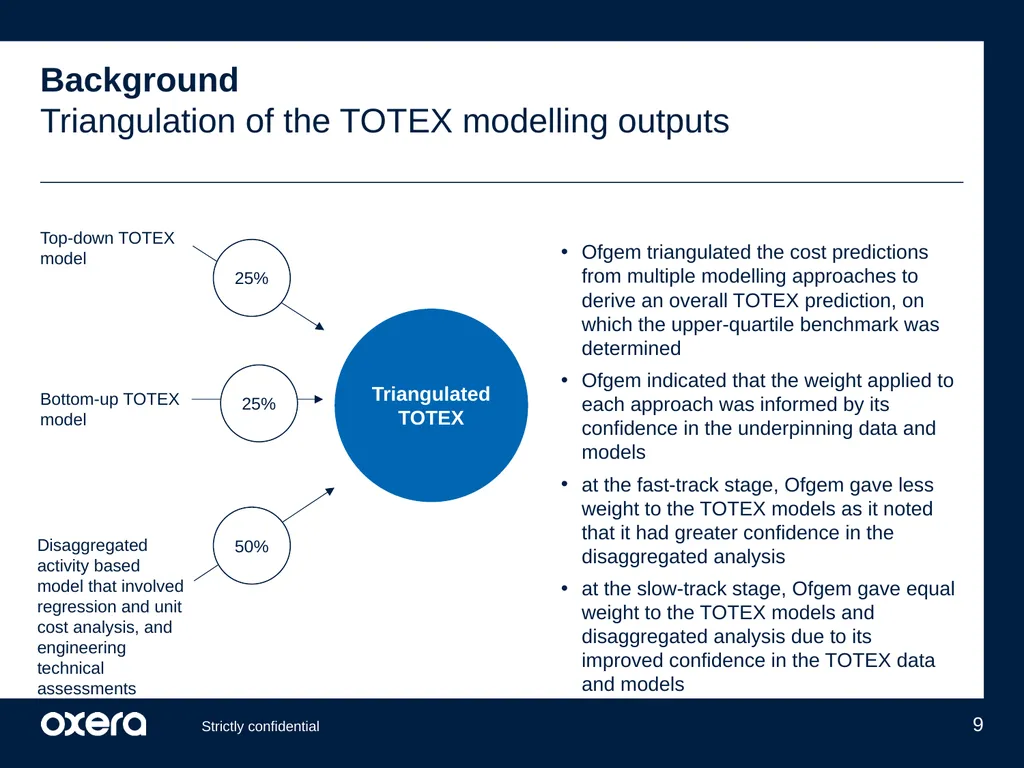
Triangulation of the TOTEX modelling outputs Ofgem triangulated the cost predictions from multiple modelling approaches to derive an overall TOTEX prediction, on which the upper-quartile benchmark was determined
Ofgem indicated that the weight applied to each approach was informed by its confidence in the underpinning data and models
at the fast-track stage, Ofgem gave less weight to the TOTEX models as it noted that it had greater confidence in the disaggregated analysis
at the slow-track stage, Ofgem gave equal weight to the TOTEX models and disaggregated analysis due to its improved confidence in the TOTEX data and models Strictly confidential 9 Triangulated TOTEX Top-down TOTEX model Bottom-up TOTEX model Disaggregated activity based model that involved regression and unit cost analysis, and engineering technical assessments 25% 25% 50%<br>
Ofgem indicated that the weight applied to each approach was informed by its confidence in the underpinning data and models
at the fast-track stage, Ofgem gave less weight to the TOTEX models as it noted that it had greater confidence in the disaggregated analysis
at the slow-track stage, Ofgem gave equal weight to the TOTEX models and disaggregated analysis due to its improved confidence in the TOTEX data and models Strictly confidential 9 Triangulated TOTEX Top-down TOTEX model Bottom-up TOTEX model Disaggregated activity based model that involved regression and unit cost analysis, and engineering technical assessments 25% 25% 50%<br>
10
Background
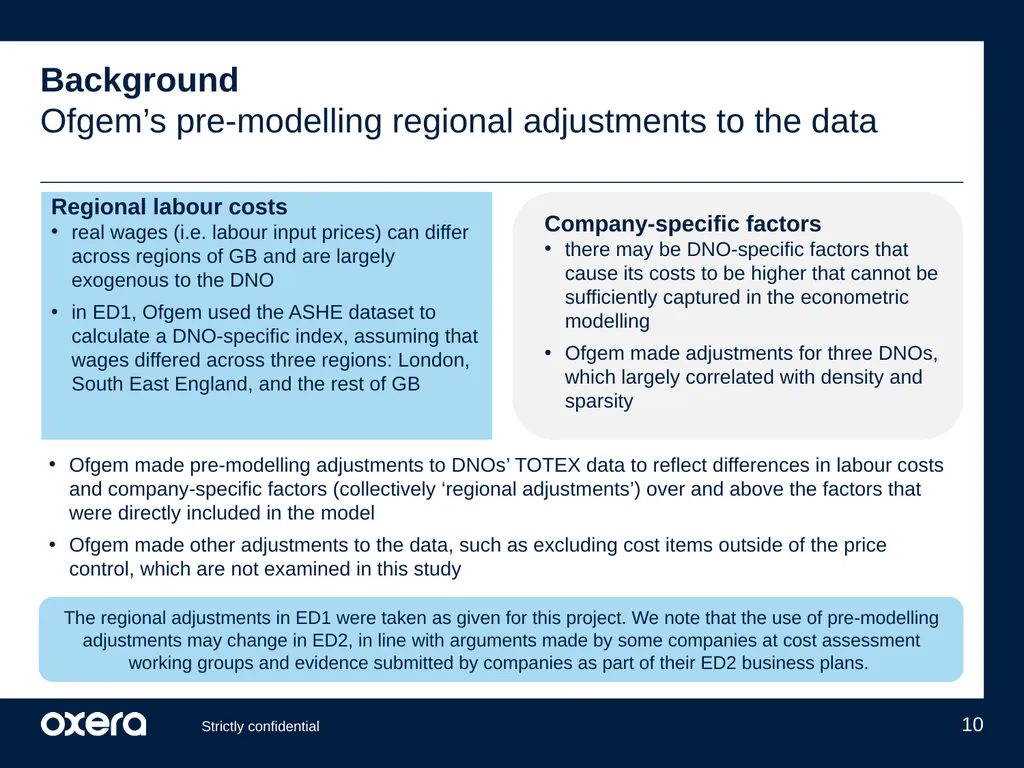
Ofgem’s pre-modelling regional adjustments to the data Strictly confidential 10 Regional labour costs
real wages (i.e. labour input prices) can differ across regions of GB and are largely exogenous to the DNO
in ED1, Ofgem used the ASHE dataset to calculate a DNO-specific index, assuming that wages differed across three regions: London, South East England, and the rest of GB Company-specific factors
there may be DNO-specific factors that cause its costs to be higher that cannot be sufficiently captured in the econometric modelling
Ofgem made adjustments for three DNOs, which largely correlated with density and sparsity Ofgem made pre-modelling adjustments to DNOs’ TOTEX data to reflect differences in labour costs and company-specific factors (collectively ‘regional adjustments’) over and above the factors that were directly included in the model
Ofgem made other adjustments to the data, such as excluding cost items outside of the price control, which are not examined in this study The regional adjustments in ED1 were taken as given for this project. We note that the use of pre-modelling adjustments may change in ED2, in line with arguments made by some companies at cost assessment working groups and evidence submitted by companies as part of their ED2 business plans.<br>
real wages (i.e. labour input prices) can differ across regions of GB and are largely exogenous to the DNO
in ED1, Ofgem used the ASHE dataset to calculate a DNO-specific index, assuming that wages differed across three regions: London, South East England, and the rest of GB Company-specific factors
there may be DNO-specific factors that cause its costs to be higher that cannot be sufficiently captured in the econometric modelling
Ofgem made adjustments for three DNOs, which largely correlated with density and sparsity Ofgem made pre-modelling adjustments to DNOs’ TOTEX data to reflect differences in labour costs and company-specific factors (collectively ‘regional adjustments’) over and above the factors that were directly included in the model
Ofgem made other adjustments to the data, such as excluding cost items outside of the price control, which are not examined in this study The regional adjustments in ED1 were taken as given for this project. We note that the use of pre-modelling adjustments may change in ED2, in line with arguments made by some companies at cost assessment working groups and evidence submitted by companies as part of their ED2 business plans.<br>
11
Background
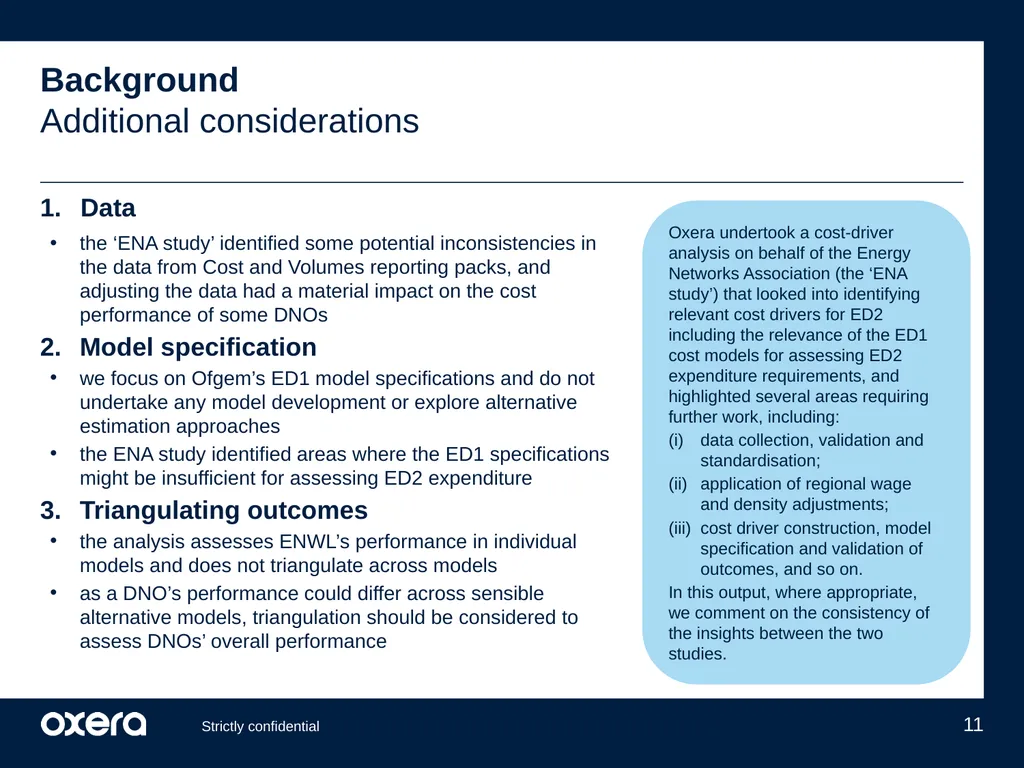
Additional considerations Data
the ‘ENA study’ identified some potential inconsistencies in the data from Cost and Volumes reporting packs, and adjusting the data had a material impact on the cost performance of some DNOs
Model specification
we focus on Ofgem’s ED1 model specifications and do not undertake any model development or explore alternative estimation approaches
the ENA study identified areas where the ED1 specifications might be insufficient for assessing ED2 expenditure
Triangulating outcomes
the analysis assesses ENWL’s performance in individual models and does not triangulate across models
as a DNO’s performance could differ across sensible alternative models, triangulation should be considered to assess DNOs’ overall performance Strictly confidential 11 Oxera undertook a cost-driver analysis on behalf of the Energy Networks Association (the ‘ENA study’) that looked into identifying relevant cost drivers for ED2 including the relevance of the ED1 cost models for assessing ED2 expenditure requirements, and highlighted several areas requiring further work, including:
data collection, validation and standardisation;
application of regional wage and density adjustments;
cost driver construction, model specification and validation of outcomes, and so on.
In this output, where appropriate, we comment on the consistency of the insights between the two studies.<br>
the ‘ENA study’ identified some potential inconsistencies in the data from Cost and Volumes reporting packs, and adjusting the data had a material impact on the cost performance of some DNOs
Model specification
we focus on Ofgem’s ED1 model specifications and do not undertake any model development or explore alternative estimation approaches
the ENA study identified areas where the ED1 specifications might be insufficient for assessing ED2 expenditure
Triangulating outcomes
the analysis assesses ENWL’s performance in individual models and does not triangulate across models
as a DNO’s performance could differ across sensible alternative models, triangulation should be considered to assess DNOs’ overall performance Strictly confidential 11 Oxera undertook a cost-driver analysis on behalf of the Energy Networks Association (the ‘ENA study’) that looked into identifying relevant cost drivers for ED2 including the relevance of the ED1 cost models for assessing ED2 expenditure requirements, and highlighted several areas requiring further work, including:
data collection, validation and standardisation;
application of regional wage and density adjustments;
cost driver construction, model specification and validation of outcomes, and so on.
In this output, where appropriate, we comment on the consistency of the insights between the two studies.<br>
12
3. Top-down TOTEX models Strictly confidential 12<br>
13
Top-down TOTEX models
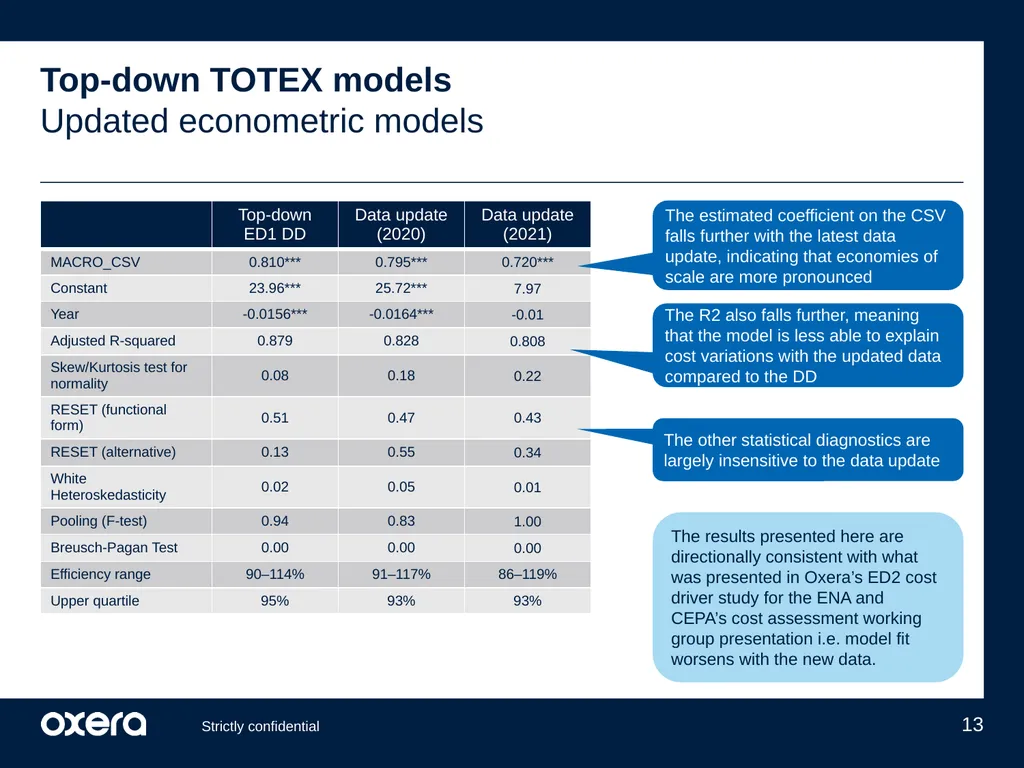
Updated econometric models The estimated coefficient on the CSV falls further with the latest data update, indicating that economies of scale are more pronounced The R2 also falls further, meaning that the model is less able to explain cost variations with the updated data compared to the DD The other statistical diagnostics are largely insensitive to the data update Strictly confidential 13 The results presented here are directionally consistent with what was presented in Oxera’s ED2 cost driver study for the ENA and CEPA’s cost assessment working group presentation i.e. model fit worsens with the new data.<br>
14
Top-down TOTEX models
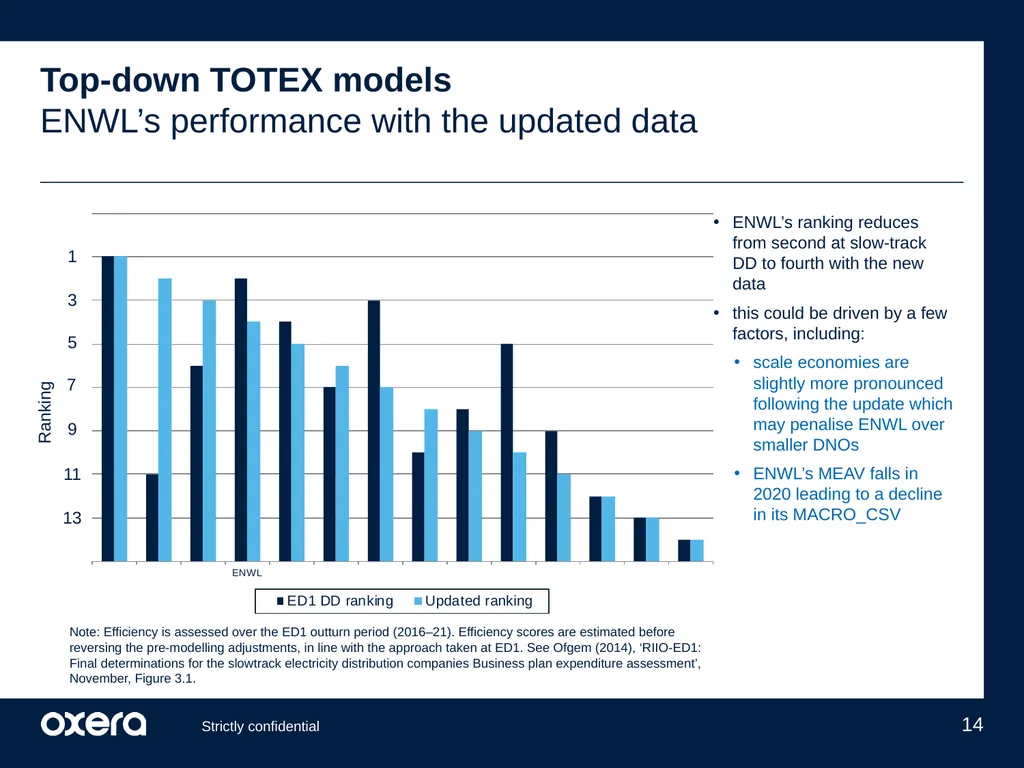
ENWL’s performance with the updated data ENWL’s ranking reduces from second at slow-track DD to fourth with the new data
this could be driven by a few factors, including:
scale economies are slightly more pronounced following the update which may penalise ENWL over smaller DNOs
ENWL’s MEAV falls in 2020 leading to a decline in its MACRO_CSV 1 3 5 7 9 11 13 Strictly confidential 14 Ranking Note: Efficiency is assessed over the ED1 outturn period (2016–21). Efficiency scores are estimated before reversing the pre-modelling adjustments, in line with the approach taken at ED1. See Ofgem (2014), ‘RIIO-ED1: Final determinations for the slowtrack electricity distribution companies Business plan expenditure assessment’, November, Figure 3.1.<br>
this could be driven by a few factors, including:
scale economies are slightly more pronounced following the update which may penalise ENWL over smaller DNOs
ENWL’s MEAV falls in 2020 leading to a decline in its MACRO_CSV 1 3 5 7 9 11 13 Strictly confidential 14 Ranking Note: Efficiency is assessed over the ED1 outturn period (2016–21). Efficiency scores are estimated before reversing the pre-modelling adjustments, in line with the approach taken at ED1. See Ofgem (2014), ‘RIIO-ED1: Final determinations for the slowtrack electricity distribution companies Business plan expenditure assessment’, November, Figure 3.1.<br>
15
Top-down TOTEX models
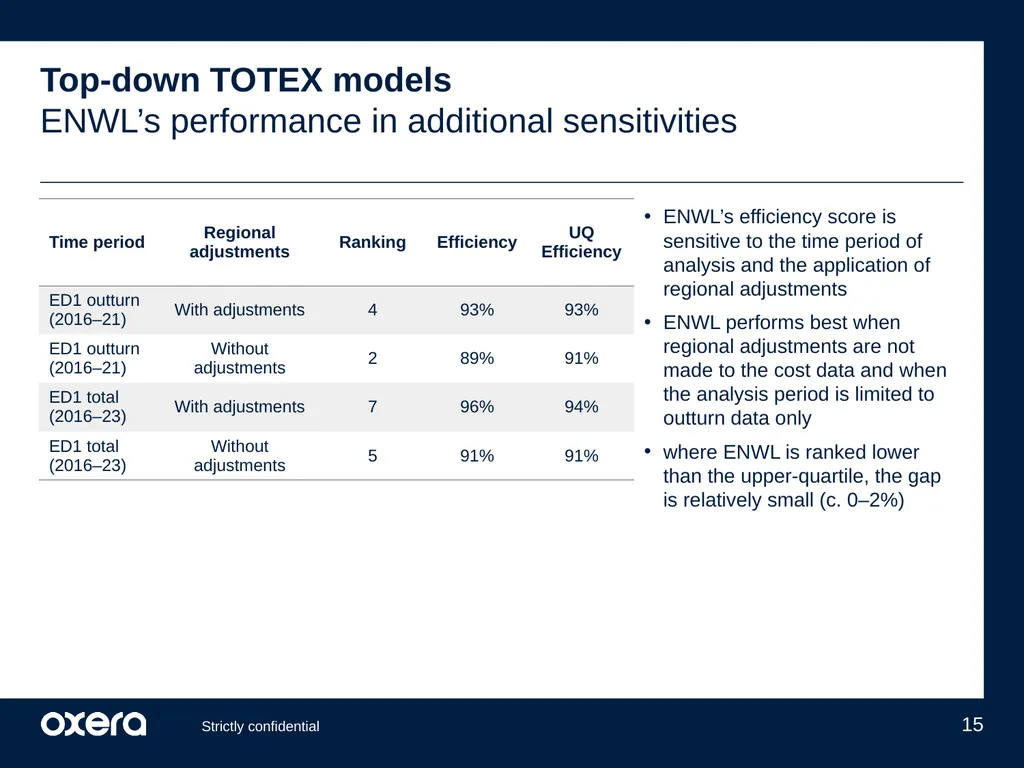
ENWL’s performance in additional sensitivities Strictly confidential 15 ENWL’s efficiency score is sensitive to the time period of analysis and the application of regional adjustments
ENWL performs best when regional adjustments are not made to the cost data and when the analysis period is limited to outturn data only
where ENWL is ranked lower than the upper-quartile, the gap is relatively small (c. 0–2%)<br>
ENWL performs best when regional adjustments are not made to the cost data and when the analysis period is limited to outturn data only
where ENWL is ranked lower than the upper-quartile, the gap is relatively small (c. 0–2%)<br>
16
4. Bottom-up TOTEX models Strictly confidential 16<br>
17
Bottom-up TOTEX models
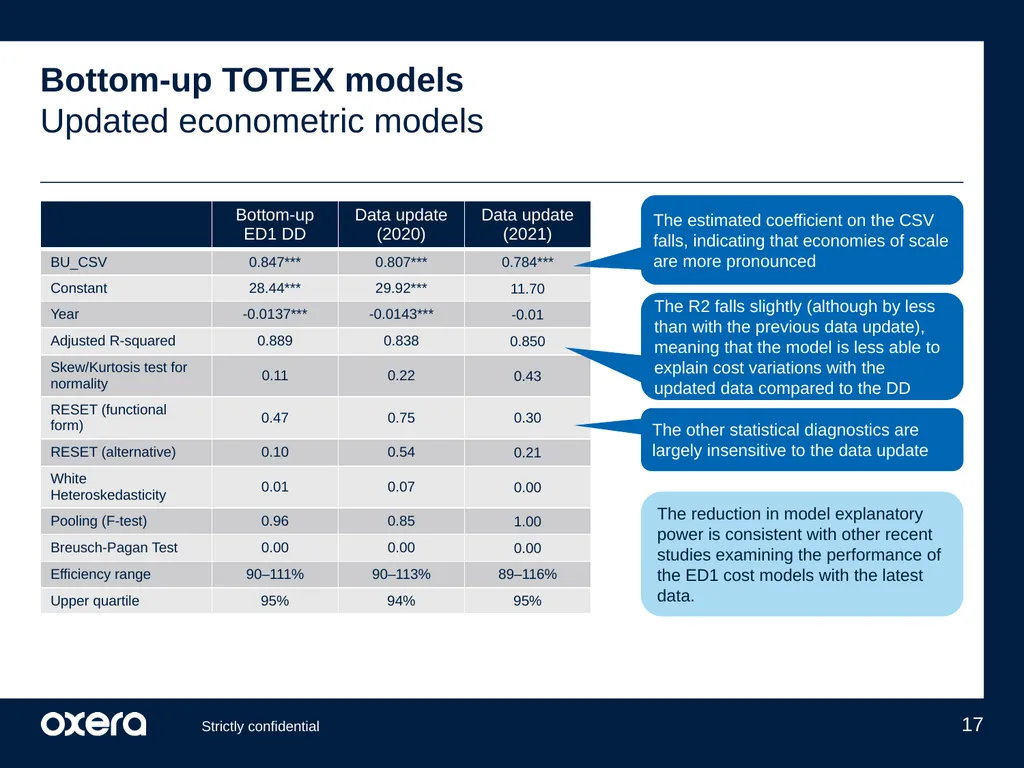
Updated econometric models The estimated coefficient on the CSV falls, indicating that economies of scale are more pronounced The R2 falls slightly (although by less than with the previous data update), meaning that the model is less able to explain cost variations with the updated data compared to the DD The other statistical diagnostics are largely insensitive to the data update Strictly confidential 17 The reduction in model explanatory power is consistent with other recent studies examining the performance of the ED1 cost models with the latest data.<br>
18
Bottom-up TOTEX models
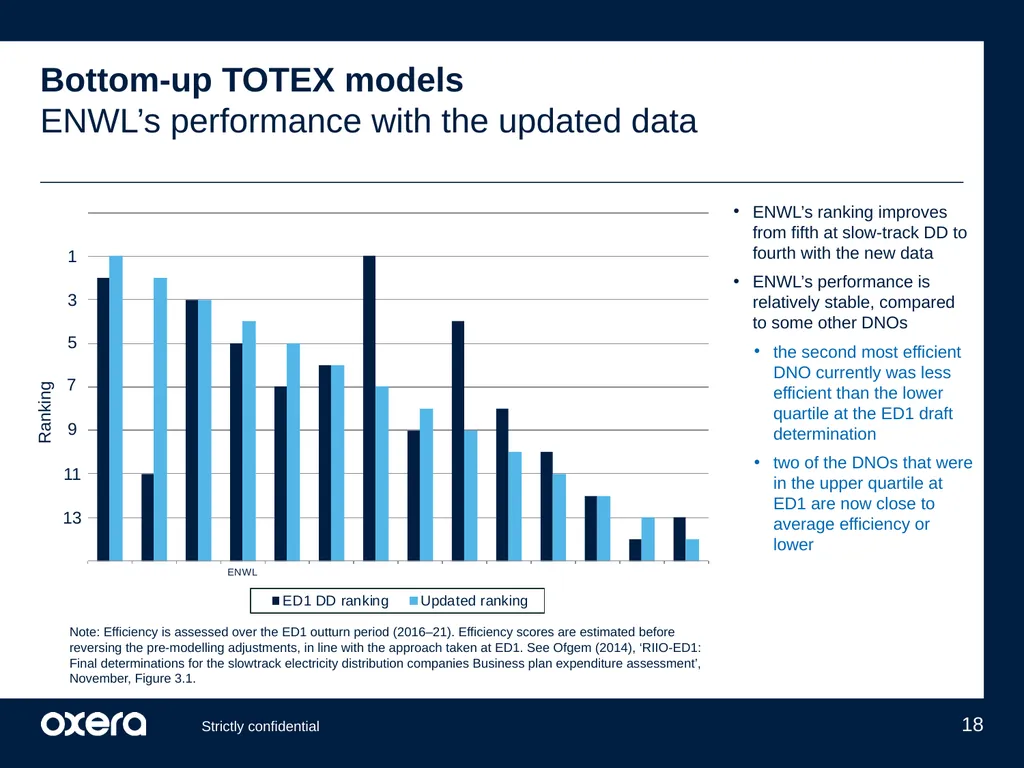
ENWL’s performance with the updated data Strictly confidential 18 ENWL’s ranking improves from fifth at slow-track DD to fourth with the new data
ENWL’s performance is relatively stable, compared to some other DNOs
the second most efficient DNO currently was less efficient than the lower quartile at the ED1 draft determination
two of the DNOs that were in the upper quartile at ED1 are now close to average efficiency or lower 1 3 5 7 9 11 13 Ranking Note: Efficiency is assessed over the ED1 outturn period (2016–21). Efficiency scores are estimated before reversing the pre-modelling adjustments, in line with the approach taken at ED1. See Ofgem (2014), ‘RIIO-ED1: Final determinations for the slowtrack electricity distribution companies Business plan expenditure assessment’, November, Figure 3.1.<br>
ENWL’s performance is relatively stable, compared to some other DNOs
the second most efficient DNO currently was less efficient than the lower quartile at the ED1 draft determination
two of the DNOs that were in the upper quartile at ED1 are now close to average efficiency or lower 1 3 5 7 9 11 13 Ranking Note: Efficiency is assessed over the ED1 outturn period (2016–21). Efficiency scores are estimated before reversing the pre-modelling adjustments, in line with the approach taken at ED1. See Ofgem (2014), ‘RIIO-ED1: Final determinations for the slowtrack electricity distribution companies Business plan expenditure assessment’, November, Figure 3.1.<br>
19
Bottom-up TOTEX models
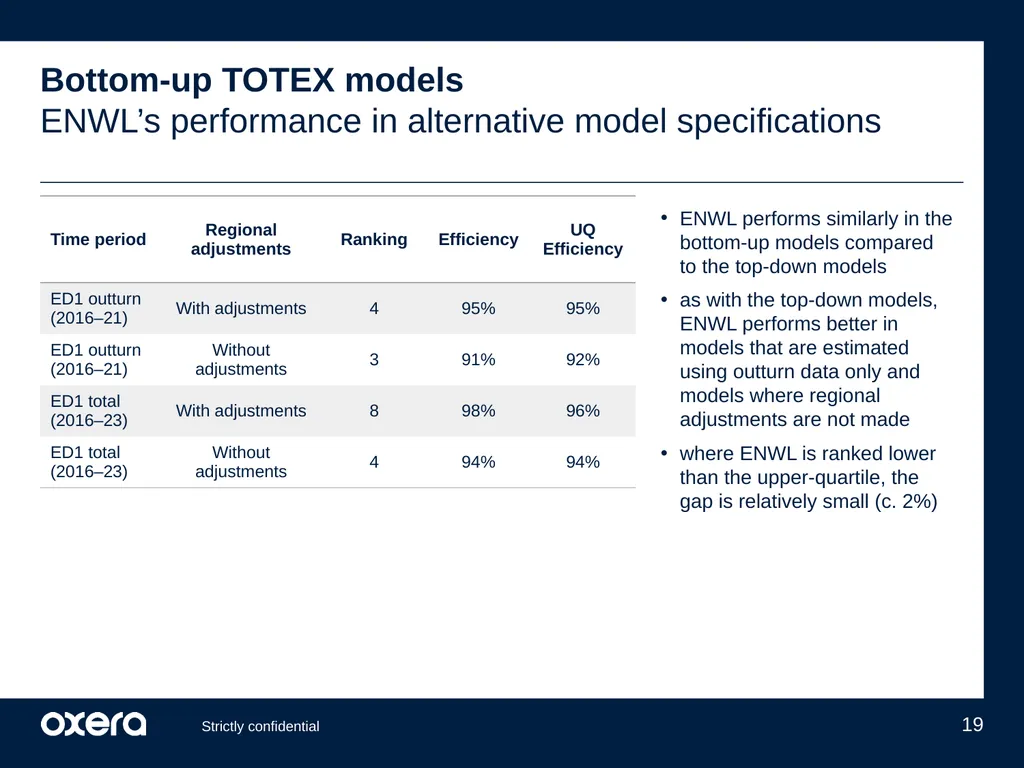
ENWL’s performance in alternative model specifications Strictly confidential 19 ENWL performs similarly in the bottom-up models compared to the top-down models
as with the top-down models, ENWL performs better in models that are estimated using outturn data only and models where regional adjustments are not made
where ENWL is ranked lower than the upper-quartile, the gap is relatively small (c. 2%)<br>
as with the top-down models, ENWL performs better in models that are estimated using outturn data only and models where regional adjustments are not made
where ENWL is ranked lower than the upper-quartile, the gap is relatively small (c. 2%)<br>
20
Contact:
Dr Srini Parthasarathy +44 (0) 20 7776 6612 srini.parthasarathy@oxera.com Oxera Consulting LLP is a limited liability partnership registered in England no. OC392464, registered office: Park Central, 40/41 Park End Street, Oxford OX1 1JD, UK; in Belgium, no. 0651 990 151, branch office: Avenue Louise 81, 1050 Brussels, Belgium; and in Italy, REA no. RM - 1530473, branch office: Via delle Quattro Fontane 15, 00184 Rome, Italy. Oxera Consulting (France) LLP, a French branch, registered office: 60 Avenue Charles de Gaulle, CS 60016, 92573 Neuilly-sur-Seine, France and registered in Nanterre, RCS no. 844 900 407 00025. Oxera Consulting (Netherlands) LLP, a Dutch branch, registered office: Strawinskylaan 3051, 1077 ZX Amsterdam, The Netherlands and registered in Amsterdam, KvK no. 72446218. Oxera Consulting GmbH is registered in Germany, no. HRB 148781 B (Local Court of Charlottenburg), registered office: Rahel-Hirsch-Straße 10, Berlin 10557, Germany.
Although every effort has been made to ensure the accuracy of the material and the integrity of the analysis presented herein, Oxera accepts no liability for any actions taken on the basis of its contents.
No Oxera entity is either authorised or regulated by any Financial Authority or Regulation within any of the countries within which it operates or provides services. Anyone considering a specific investment should consult their own broker or other investment adviser. Oxera accepts no liability for any specific investment decision, which must be at the investor’s own risk.
© Oxera 2021. All rights reserved. Except for the quotation of short passages for the purposes of criticism or review, no part may be used or reproduced without permission. www.oxera.com Follow us on Twitter @OxeraConsulting<br>
Dr Srini Parthasarathy +44 (0) 20 7776 6612 srini.parthasarathy@oxera.com Oxera Consulting LLP is a limited liability partnership registered in England no. OC392464, registered office: Park Central, 40/41 Park End Street, Oxford OX1 1JD, UK; in Belgium, no. 0651 990 151, branch office: Avenue Louise 81, 1050 Brussels, Belgium; and in Italy, REA no. RM - 1530473, branch office: Via delle Quattro Fontane 15, 00184 Rome, Italy. Oxera Consulting (France) LLP, a French branch, registered office: 60 Avenue Charles de Gaulle, CS 60016, 92573 Neuilly-sur-Seine, France and registered in Nanterre, RCS no. 844 900 407 00025. Oxera Consulting (Netherlands) LLP, a Dutch branch, registered office: Strawinskylaan 3051, 1077 ZX Amsterdam, The Netherlands and registered in Amsterdam, KvK no. 72446218. Oxera Consulting GmbH is registered in Germany, no. HRB 148781 B (Local Court of Charlottenburg), registered office: Rahel-Hirsch-Straße 10, Berlin 10557, Germany.
Although every effort has been made to ensure the accuracy of the material and the integrity of the analysis presented herein, Oxera accepts no liability for any actions taken on the basis of its contents.
No Oxera entity is either authorised or regulated by any Financial Authority or Regulation within any of the countries within which it operates or provides services. Anyone considering a specific investment should consult their own broker or other investment adviser. Oxera accepts no liability for any specific investment decision, which must be at the investor’s own risk.
© Oxera 2021. All rights reserved. Except for the quotation of short passages for the purposes of criticism or review, no part may be used or reproduced without permission. www.oxera.com Follow us on Twitter @OxeraConsulting<br>
21
Appendix Glossary
ED1 summary Strictly confidential 21<br>
ED1 summary Strictly confidential 21<br>
22
Appendix i: glossary Strictly confidential 22<br>
23
Glossary of terms
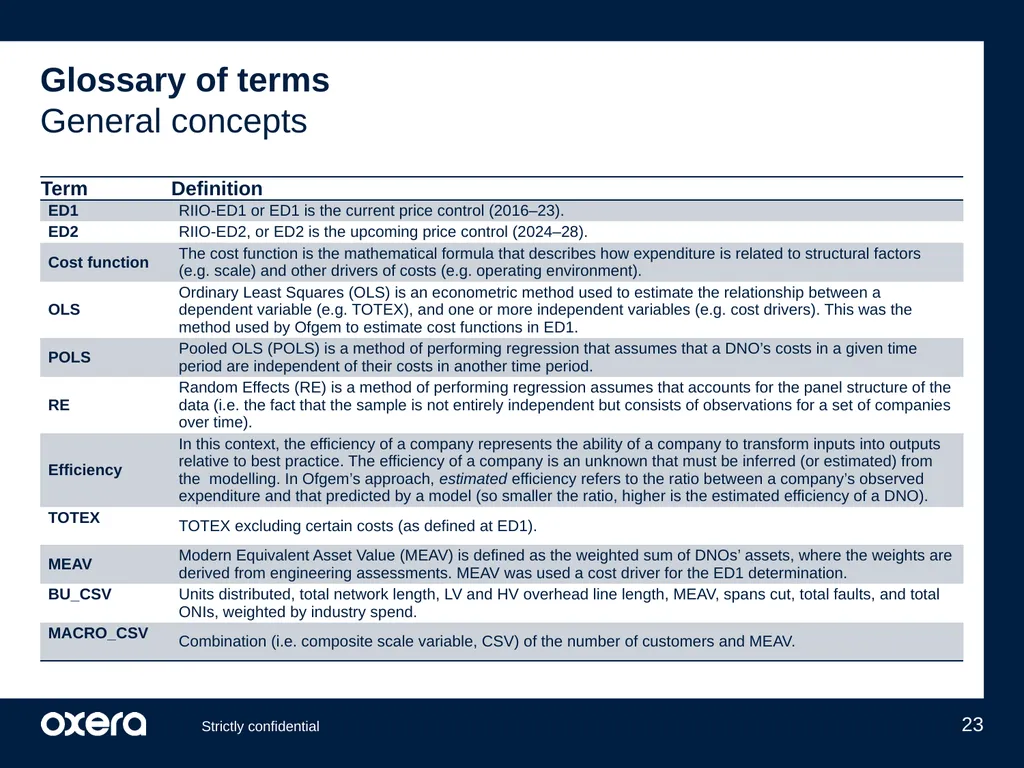
General concepts Strictly confidential 23<br>
24
Glossary of terms
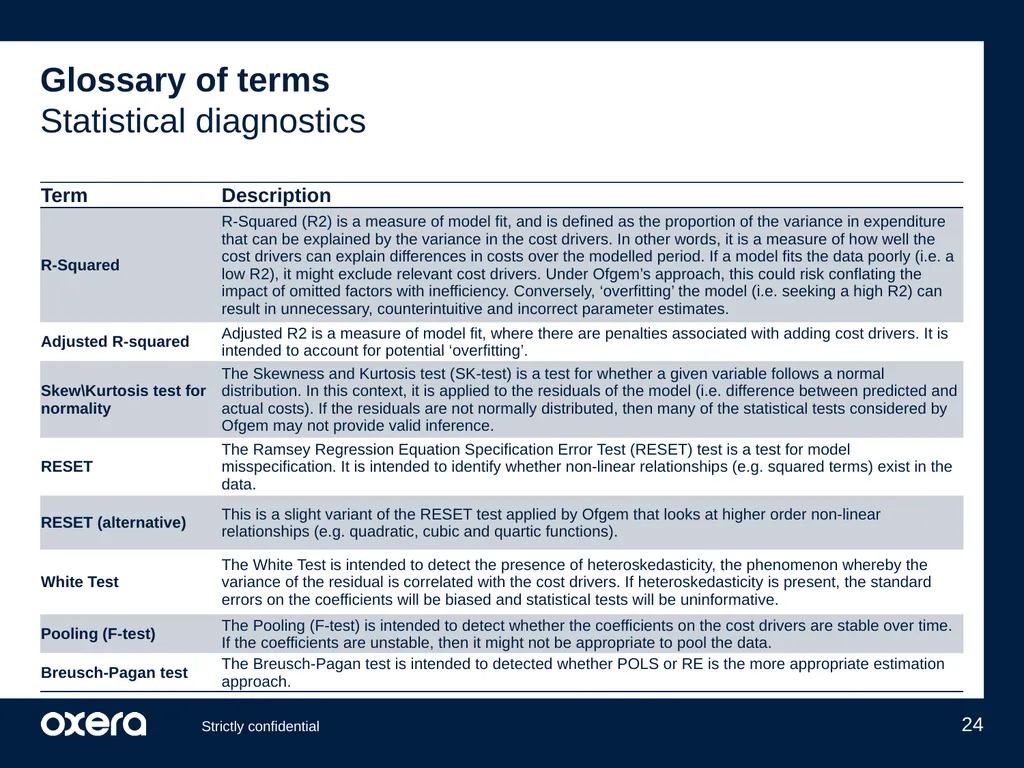
Statistical diagnostics Strictly confidential 24<br>
25
2. Appendix ii: ED1 framework Summary Strictly confidential 25<br>
26
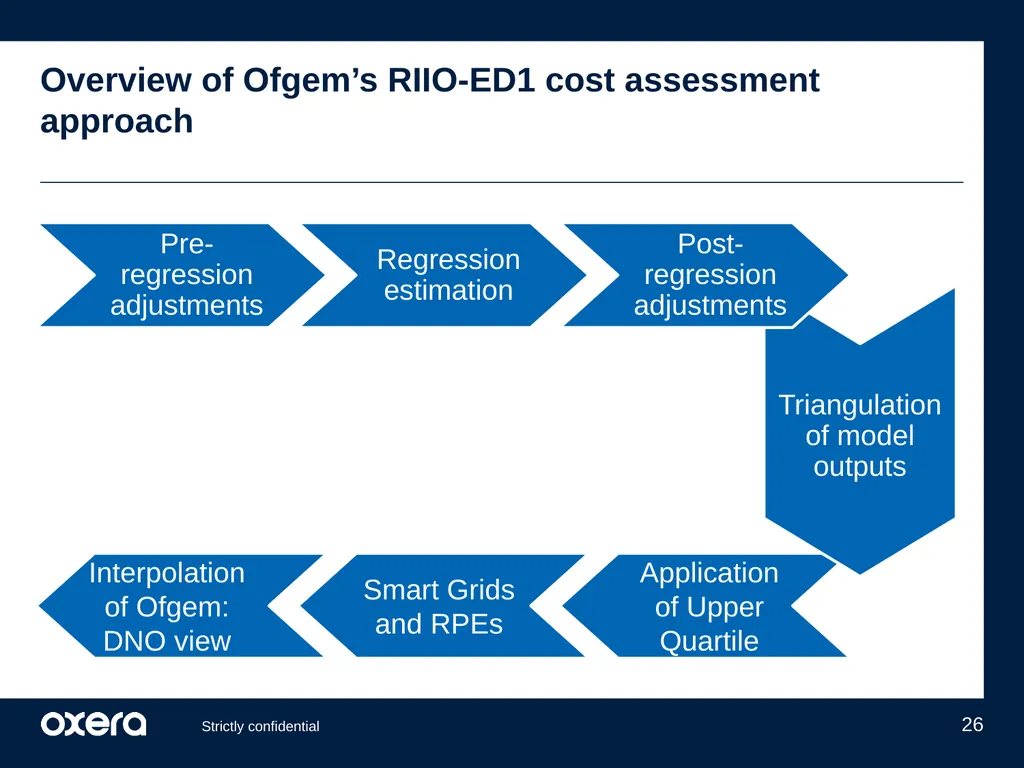
Triangulation of model outputs Overview of Ofgem’s RIIO-ED1 cost assessment approach Pre-regression adjustments Regression estimation Post-regression adjustments Application of Upper Quartile Smart Grids and RPEs Interpolation of Ofgem: DNO view Strictly confidential 26<br>
27
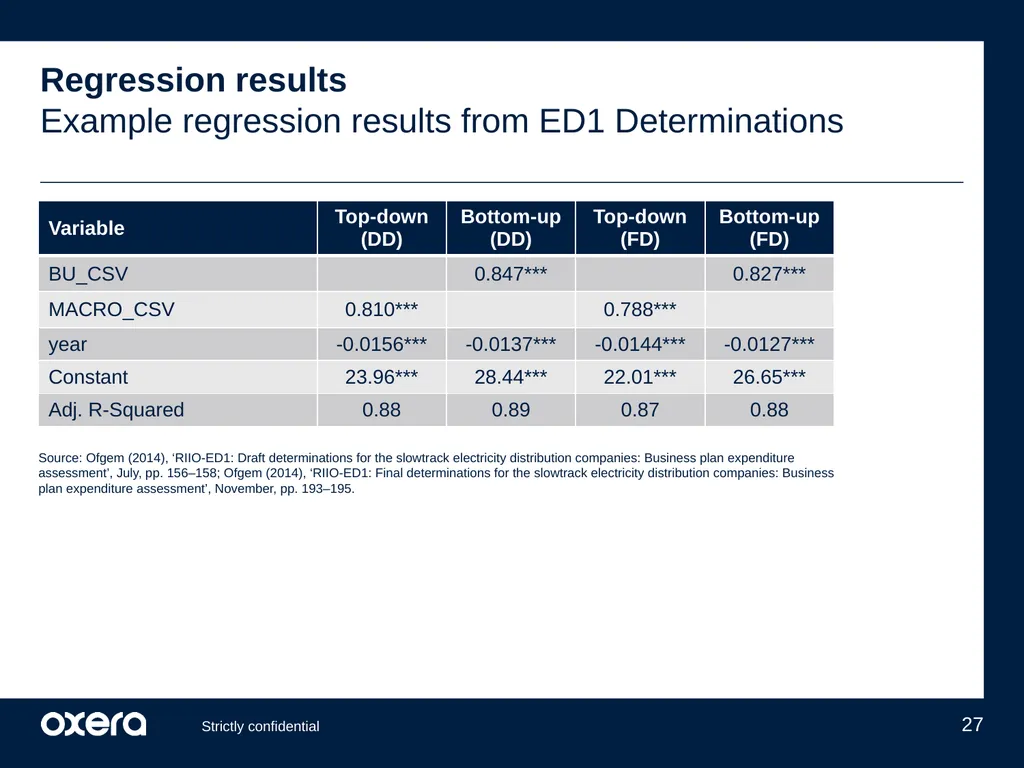
Regression results
Example regression results from ED1 Determinations Strictly confidential 27 Source: Ofgem (2014), ‘RIIO-ED1: Draft determinations for the slowtrack electricity distribution companies: Business plan expenditure assessment’, July, pp. 156–158; Ofgem (2014), ‘RIIO-ED1: Final determinations for the slowtrack electricity distribution companies: Business plan expenditure assessment’, November, pp. 193–195.<br>
28
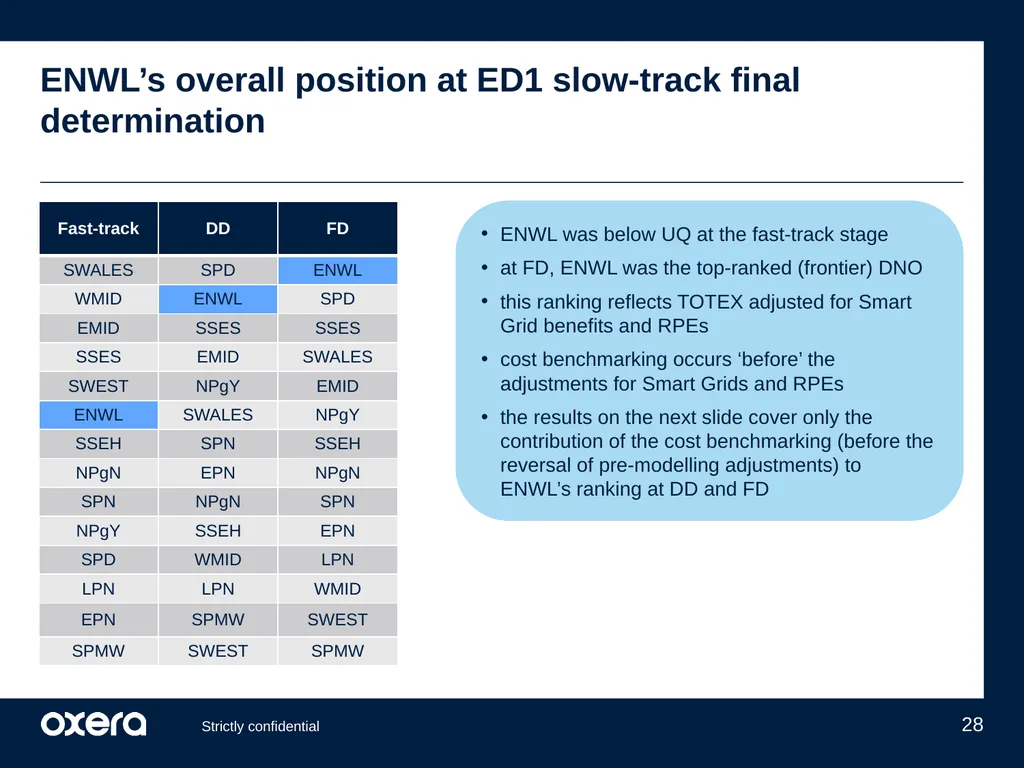
ENWL’s overall position at ED1 slow-track final determination ENWL was below UQ at the fast-track stage
at FD, ENWL was the top-ranked (frontier) DNO
this ranking reflects TOTEX adjusted for Smart Grid benefits and RPEs
cost benchmarking occurs ‘before’ the adjustments for Smart Grids and RPEs
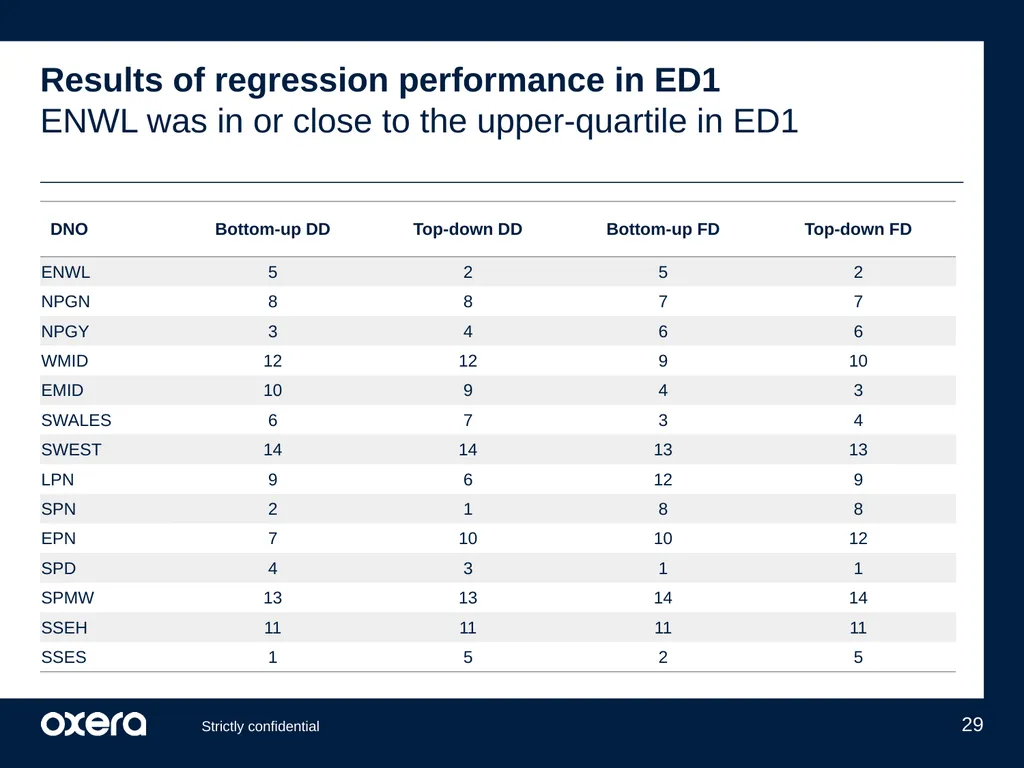
the results on the next slide cover only the contribution of the cost benchmarking (before the reversal of pre-modelling adjustments) to ENWL’s ranking at DD and FD Strictly confidential 28<br>
at FD, ENWL was the top-ranked (frontier) DNO
this ranking reflects TOTEX adjusted for Smart Grid benefits and RPEs
cost benchmarking occurs ‘before’ the adjustments for Smart Grids and RPEs
the results on the next slide cover only the contribution of the cost benchmarking (before the reversal of pre-modelling adjustments) to ENWL’s ranking at DD and FD Strictly confidential 28<br>
29
Results of regression performance in ED1
ENWL was in or close to the upper-quartile in ED1 Strictly confidential 29<br>