
ESA REGIONAL OFFICE Result-Based Management















Description: ESA REGIONAL OFFICE Result-Based Management Training Session 1 April 4 5th 2016 Overall objective For participants to be able to: DAY 1 DAY 2 Agenda Key Drivers and Principles of RBM Problem Analysis Application of Lenses Outcome Chain
Related Topics
Download Presentation
"ESA REGIONAL OFFICE Result-Based Management" is the property of its rightful owner. Permission is granted to download and print the materials on this website for personal, non-commercial use only, and to display it on your personal computer provided you do not modify the materials and that you retain all copyright notices contained in the materials. By downloading content from our website, you accept the terms of this agreement.
Presentation Transcript
slide1. ESA REGIONAL OFFICE Result-Based Management Training
Session 1 – April 4 & 5th 2016<br>
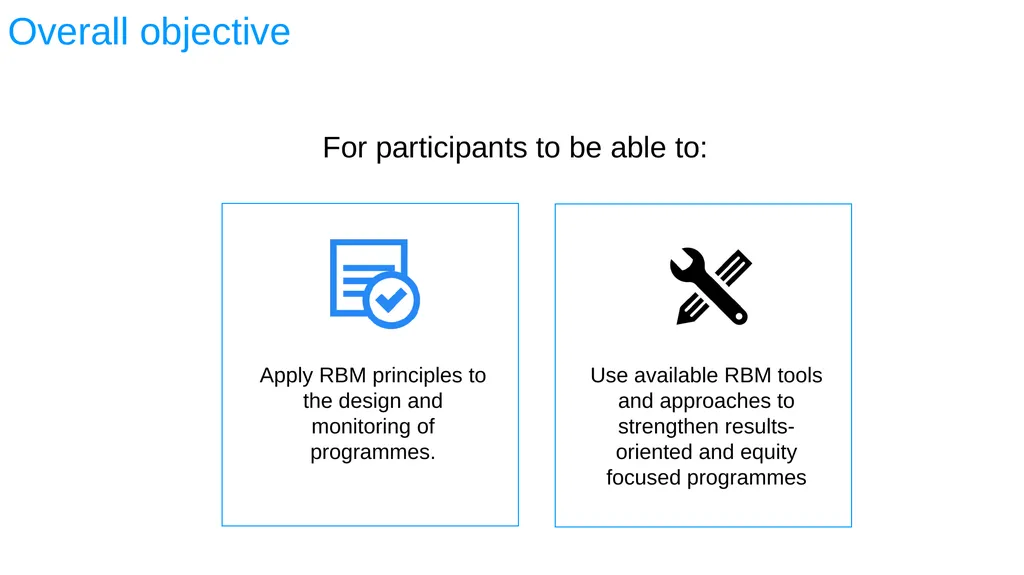
slide2. Overall objective For participants to be able to:<br>
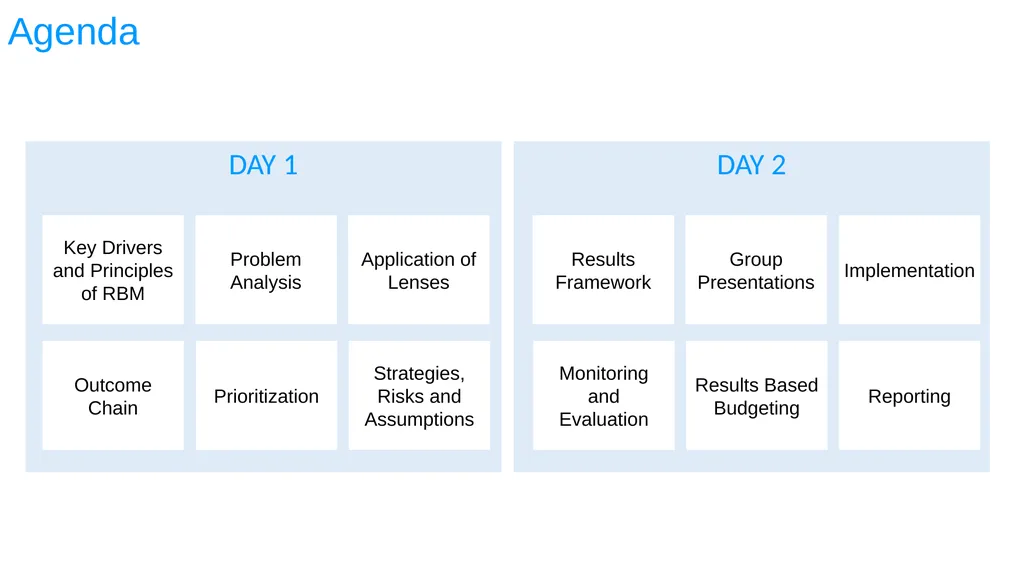
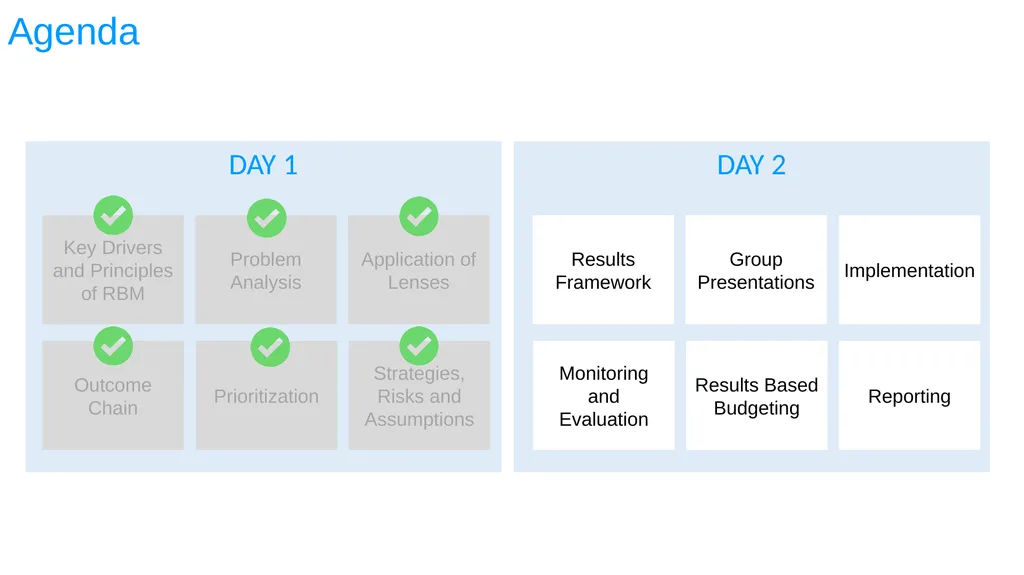
slide3. DAY 1 DAY 2 Agenda Key Drivers and Principles of RBM Problem Analysis Application of Lenses Outcome Chain Prioritization Strategies, Risks and Assumptions Results Framework Group Presentations Implementation Monitoring and Evaluation Results Based Budgeting Reporting<br>
slide4. KEY DRIVERS OF RBM & INTRODUCTION TO RBM PRINCIPLES SESSION 1<br>
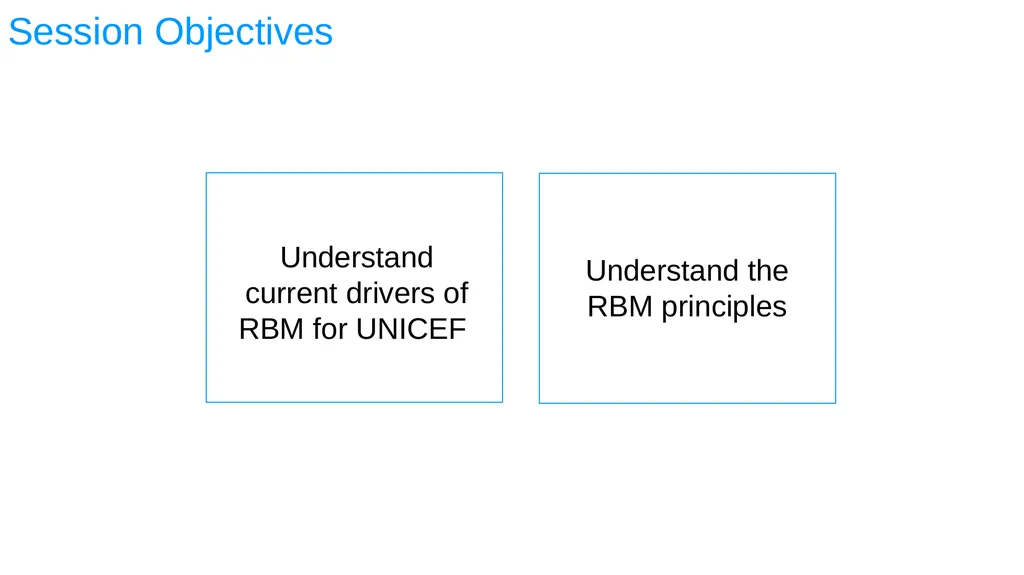
slide5. Session Objectives Understand current drivers of RBM for UNICEF Understand the RBM principles<br>
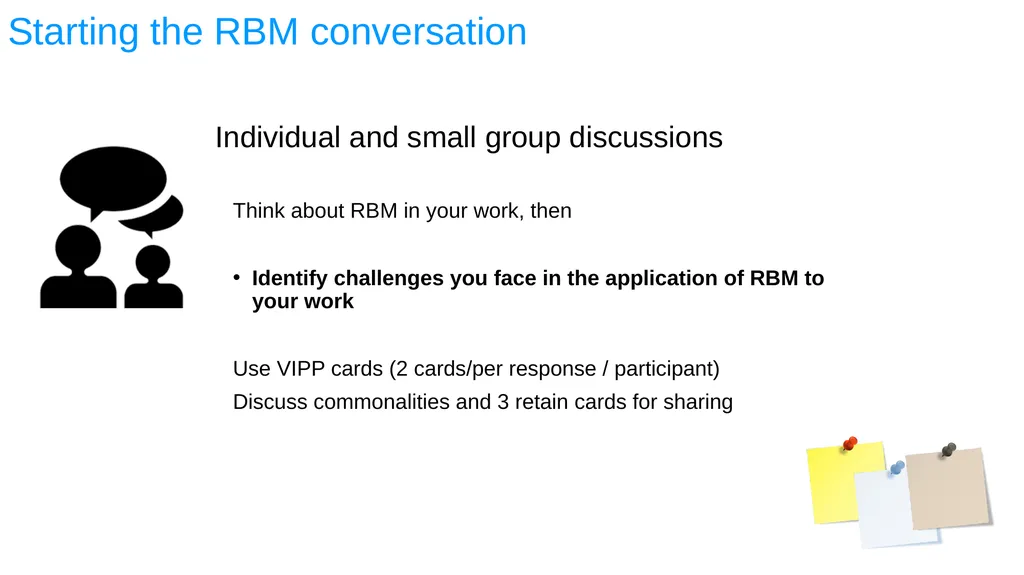
slide6. Starting the RBM conversation Think about RBM in your work, then
Identify challenges you face in the application of RBM to your work
Use VIPP cards (2 cards/per response / participant)
Discuss commonalities and 3 retain cards for sharing Individual and small group discussions<br>
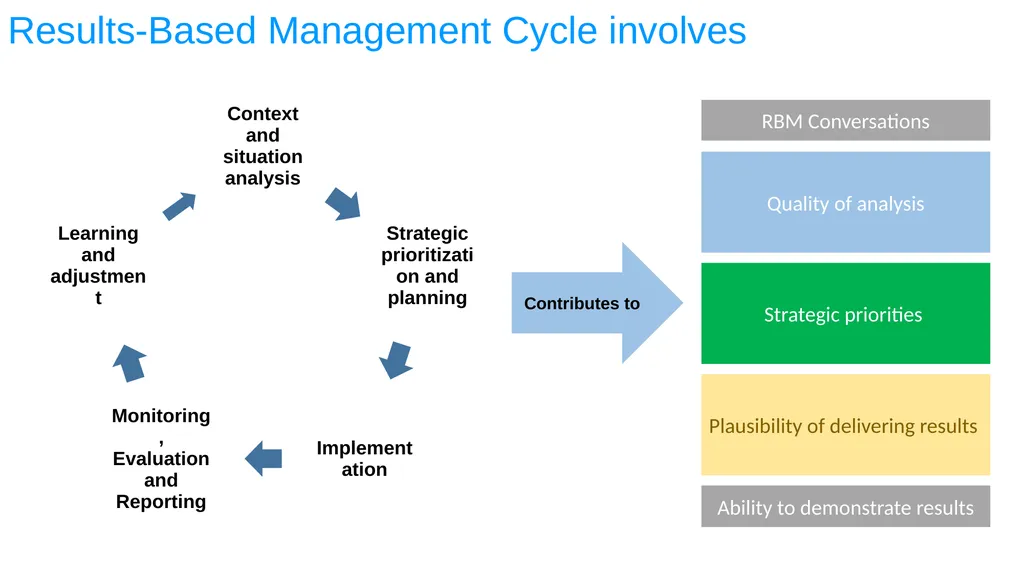
slide7. Results-Based Management Cycle involves Contributes to<br>
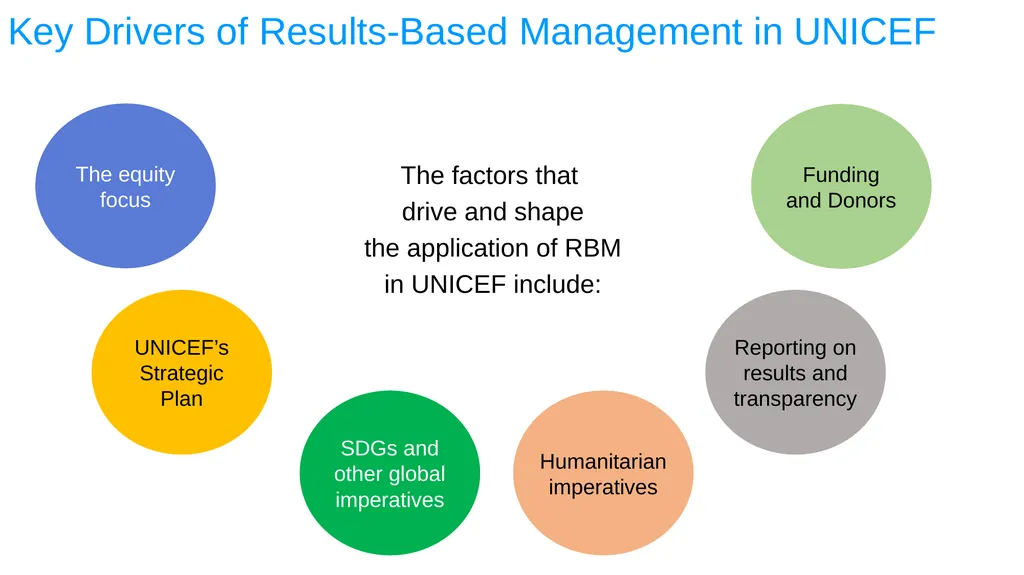
slide8. Key Drivers of Results-Based Management in UNICEF The factors that
drive and shape
the application of RBM
in UNICEF include: The equity focus UNICEF’s Strategic Plan SDGs and other global imperatives Humanitarian imperatives Funding and Donors Reporting on results and transparency<br>
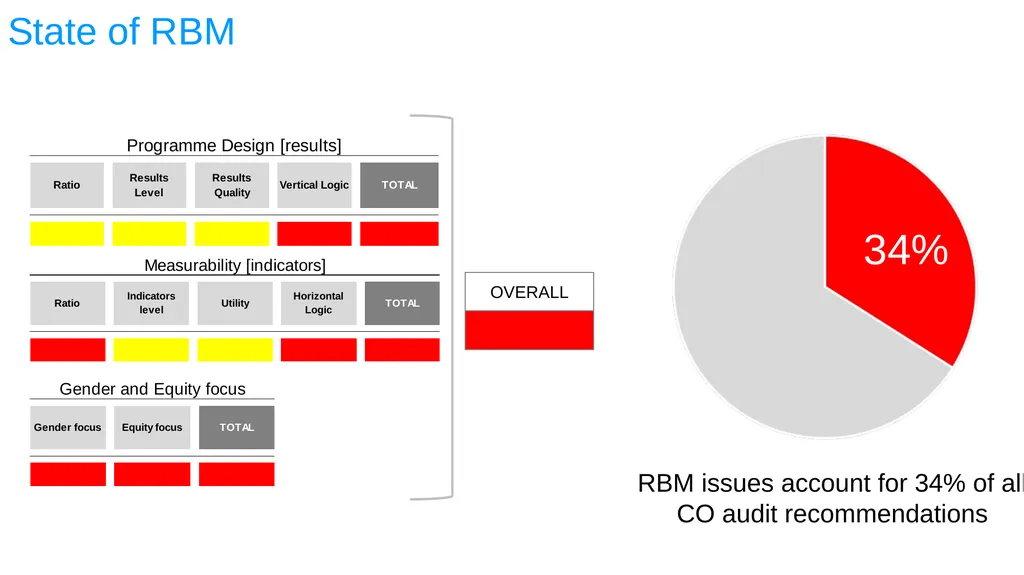
slide9. State of RBM OVERALL<br>
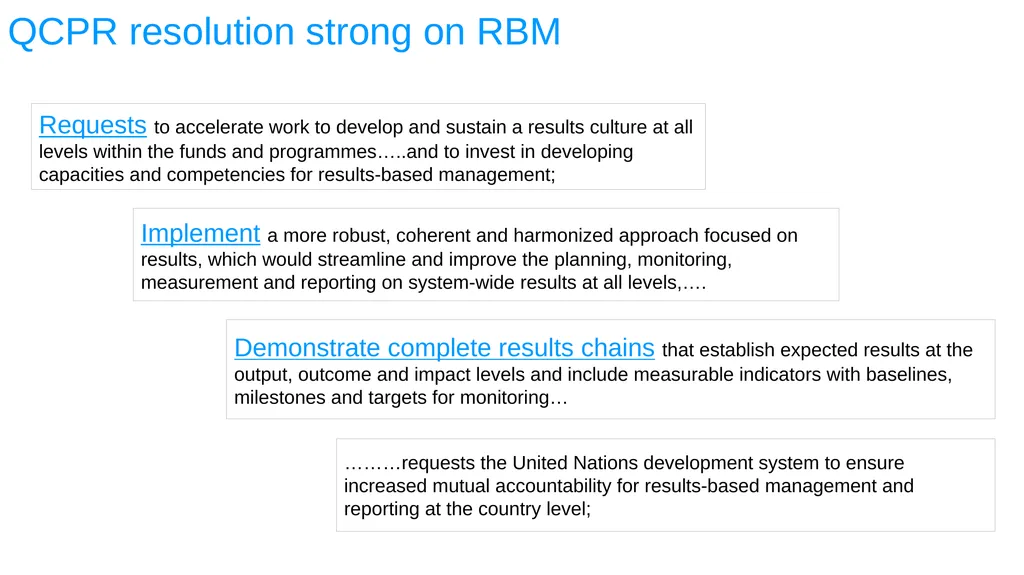
slide10. QCPR resolution strong on RBM Requests to accelerate work to develop and sustain a results culture at all levels within the funds and programmes…..and to invest in developing capacities and competencies for results-based management; Implement a more robust, coherent and harmonized approach focused on results, which would streamline and improve the planning, monitoring, measurement and reporting on system-wide results at all levels,…. Demonstrate complete results chains that establish expected results at the output, outcome and impact levels and include measurable indicators with baselines, milestones and targets for monitoring… ………requests the United Nations development system to ensure increased mutual accountability for results-based management and reporting at the country level;<br>
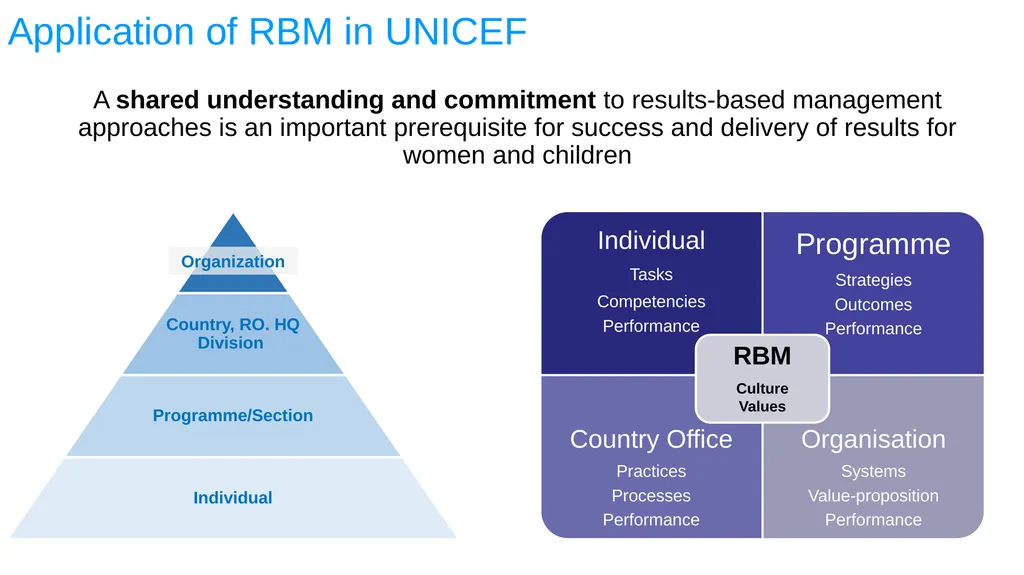
slide11. Application of RBM in UNICEF A shared understanding and commitment to results-based management approaches is an important prerequisite for success and delivery of results for women and children Individual
Tasks
Competencies
Performance Programme
Strategies
Outcomes
Performance Country Office
Practices
Processes
Performance Organisation
Systems
Value-proposition
Performance RBM
Culture
Values Country, RO. HQ Division Programme/Section Individual<br>
slide12. Any Questions?<br>
slide13. PROBLEM IDENTIFICATION & CAUSAL ANALYSIS SESSION 2<br>
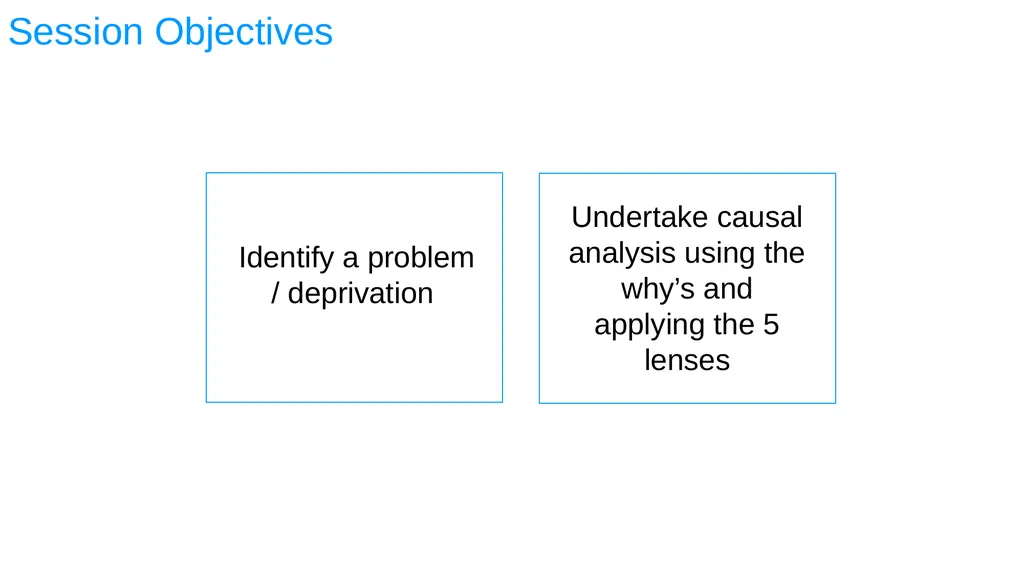
slide14. Session Objectives Identify a problem / deprivation Undertake causal analysis using the why’s and applying the 5 lenses<br>
slide15. Good understanding of context
Clear problem identification and trend analysis,
Sound problem analysis, and
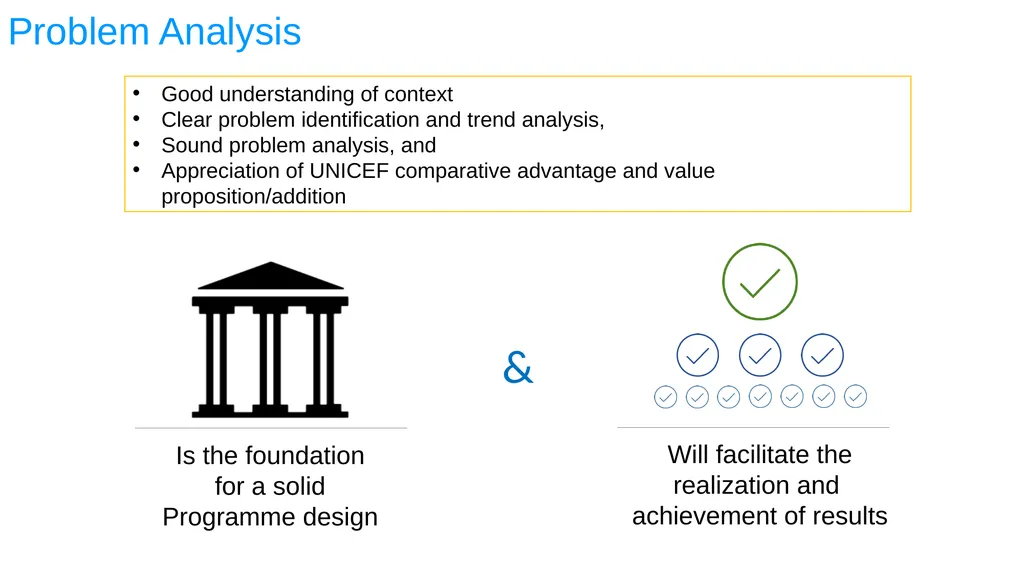
Appreciation of UNICEF comparative advantage and value proposition/addition Problem Analysis<br>
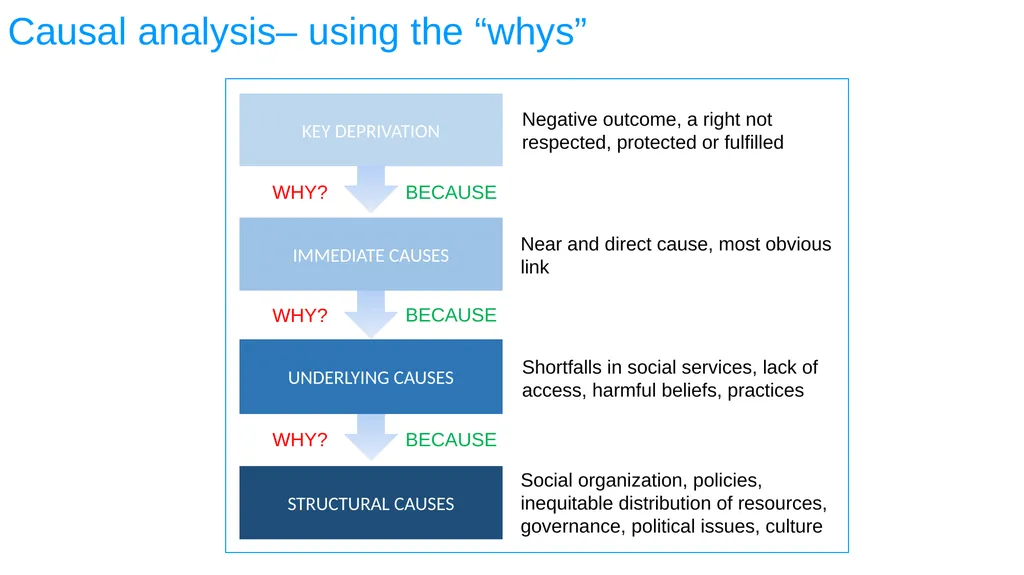
slide16. Causal analysis– using the “whys”<br>
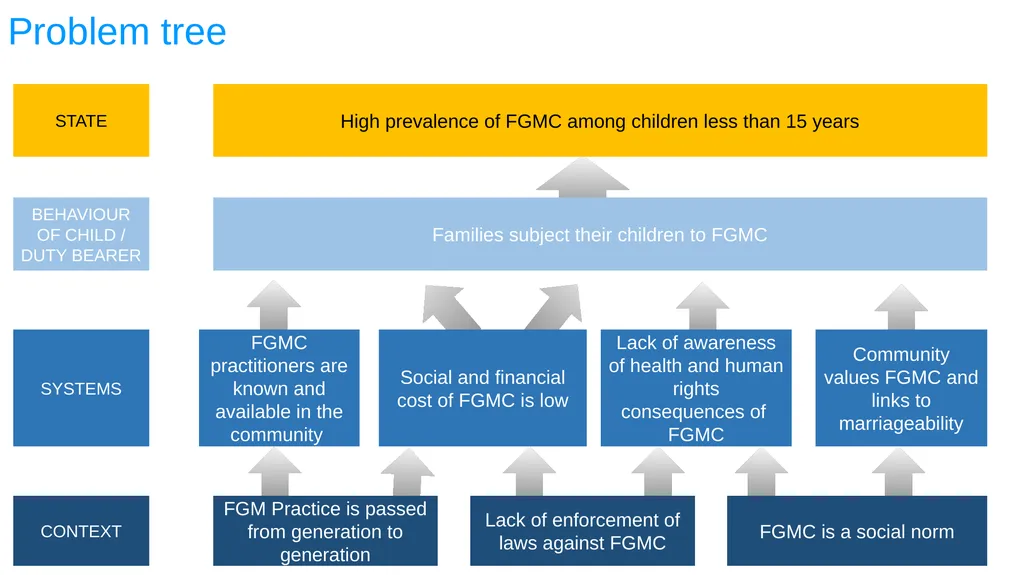
slide17. Problem tree STATE BEHAVIOUR OF CHILD / DUTY BEARER SYSTEMS CONTEXT High prevalence of FGMC among children less than 15 years<br>
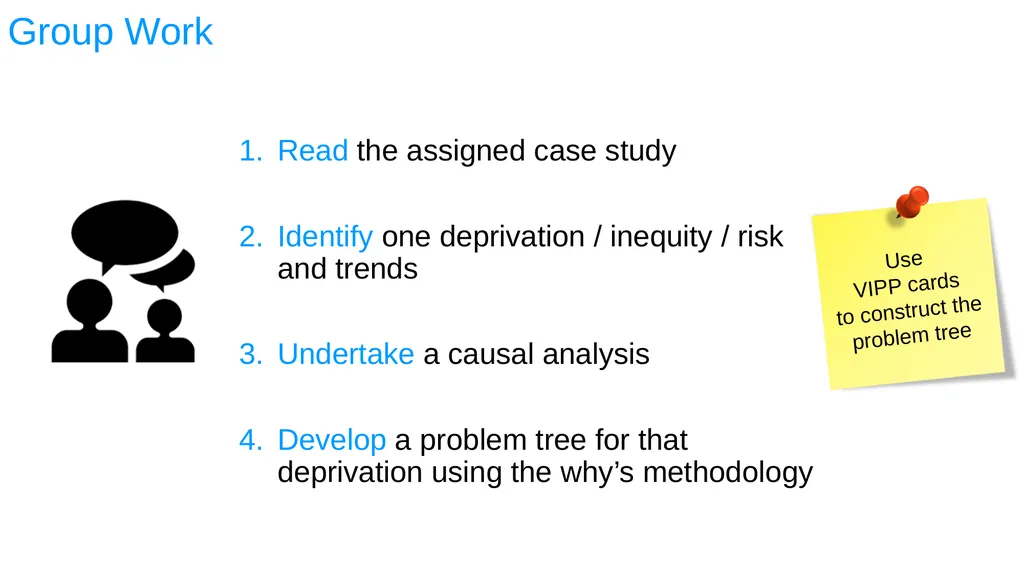
slide18. Group Work Read the assigned case study
Identify one deprivation / inequity / risk and trends
Undertake a causal analysis
Develop a problem tree for that deprivation using the why’s methodology<br>
slide19. Any Questions?<br>
slide20. APPLICATION OF LENSES SESSION 3<br>
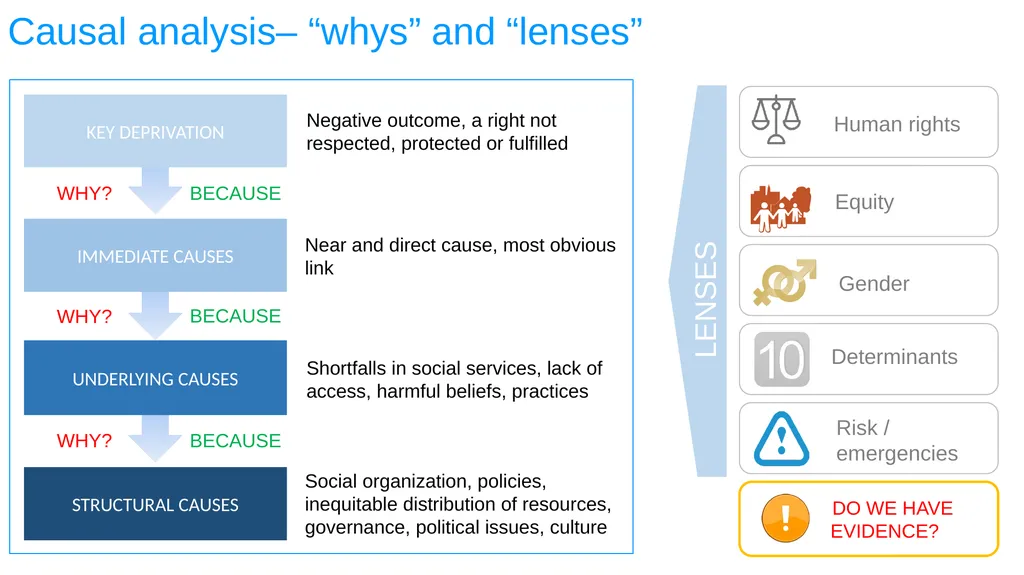
slide21. Causal analysis– “whys” and “lenses”<br>
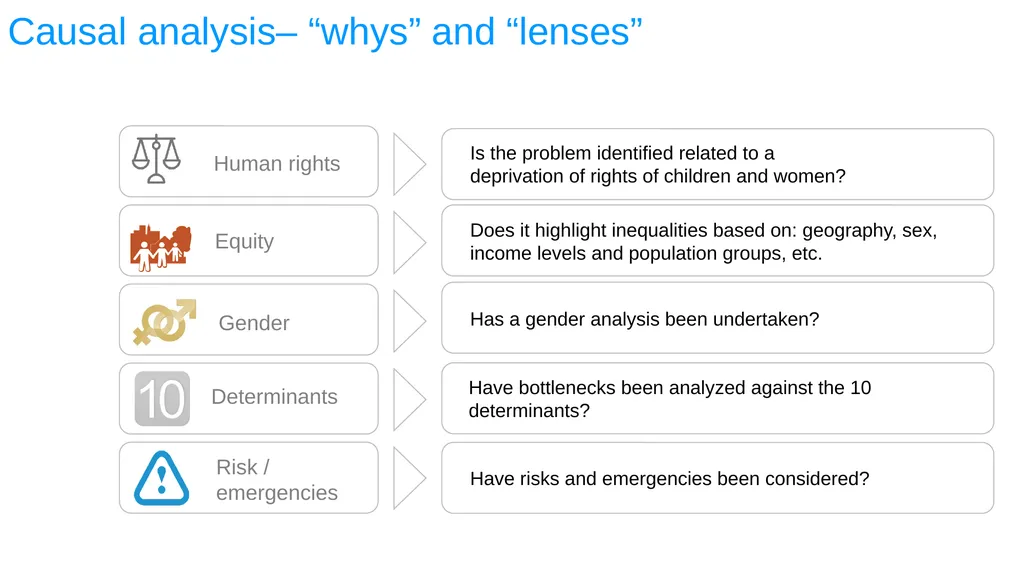
slide22. Causal analysis– “whys” and “lenses” Is the problem identified related to a deprivation of rights of children and women? Does it highlight inequalities based on: geography, sex, income levels and population groups, etc. Has a gender analysis been undertaken? Have bottlenecks been analyzed against the 10 determinants? Have risks and emergencies been considered?<br>
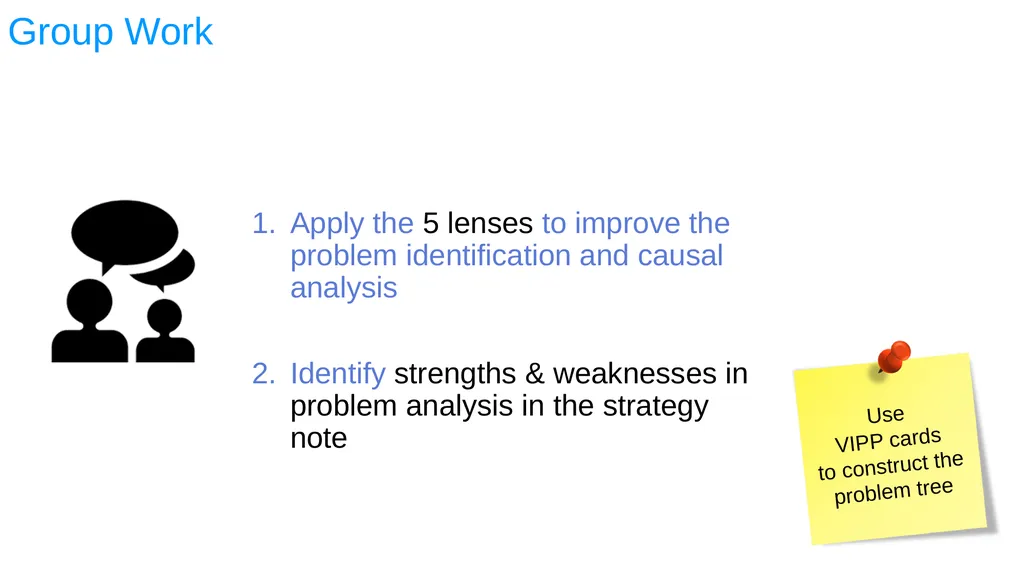
slide23. Group Work Apply the 5 lenses to improve the problem identification and causal analysis
Identify strengths & weaknesses in problem analysis in the strategy note<br>
slide24. Any Questions?<br>
slide25. THEORY OF CHANGE: THE OUTCOME CHAIN SESSION 4<br>
slide26. Session objectives Be able to move from a problem tree to an outcome chain<br>
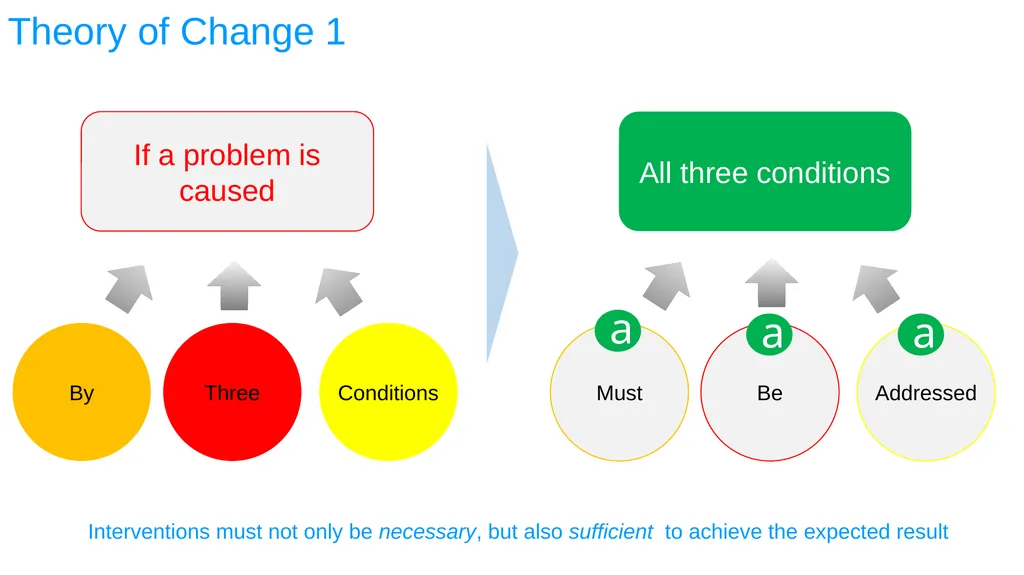
slide27. Theory of Change 1 By Three Conditions If a problem is caused Must Be Addressed All three conditions a a a Interventions must not only be necessary, but also sufficient to achieve the expected result<br>
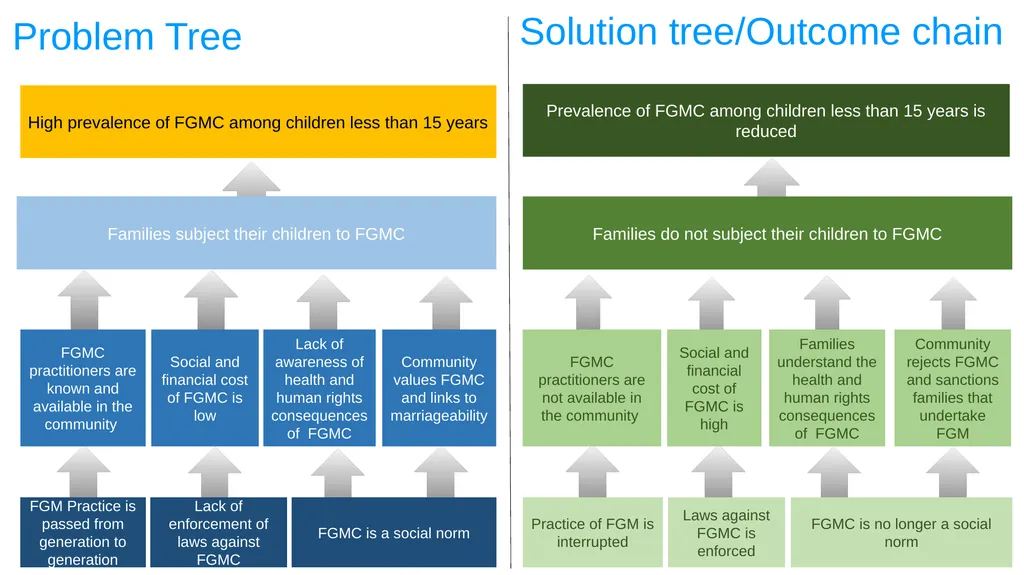
slide28. Solution tree/Outcome chain Families do not subject their children to FGMC Practice of FGM is interrupted Laws against FGMC is enforced Prevalence of FGMC among children less than 15 years is reduced FGMC is no longer a social norm FGMC practitioners are not available in the community Social and financial cost of FGMC is high Families understand the health and human rights consequences of FGMC Community rejects FGMC and sanctions families that undertake FGM Families subject their children to FGMC High prevalence of FGMC among children less than 15 years FGMC practitioners are known and available in the community Social and financial cost of FGMC is low Lack of awareness of health and human rights consequences of FGMC Community values FGMC and links to marriageability FGM Practice is passed from generation to generation Lack of enforcement of laws against FGMC FGMC is a social norm Problem Tree<br>
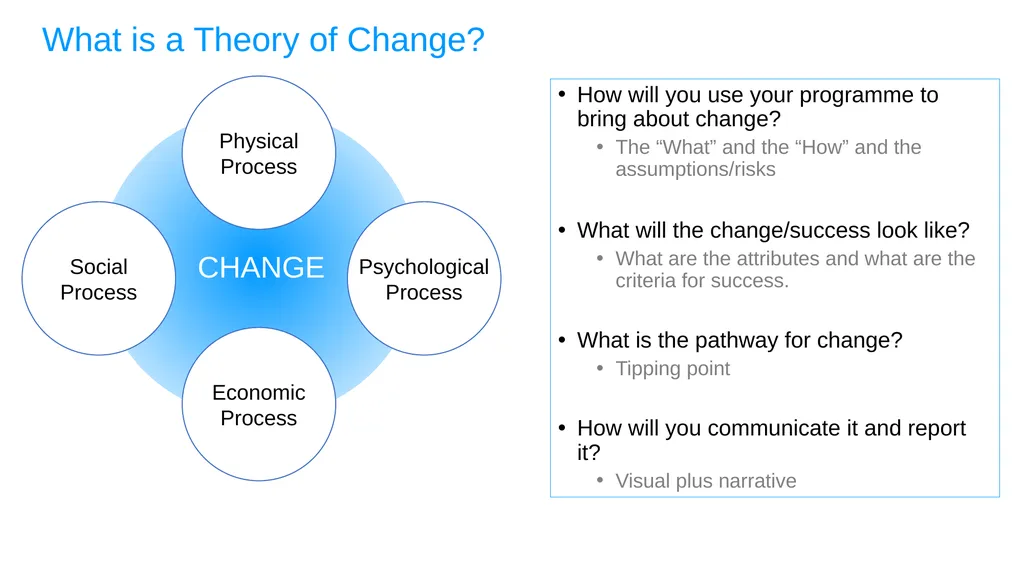
slide29. What is a Theory of Change? How will you use your programme to bring about change?
The “What” and the “How” and the assumptions/risks
What will the change/success look like?
What are the attributes and what are the criteria for success.
What is the pathway for change?
Tipping point
How will you communicate it and report it?
Visual plus narrative Physical
Process Psychological
Process Economic
Process Social
Process CHANGE<br>
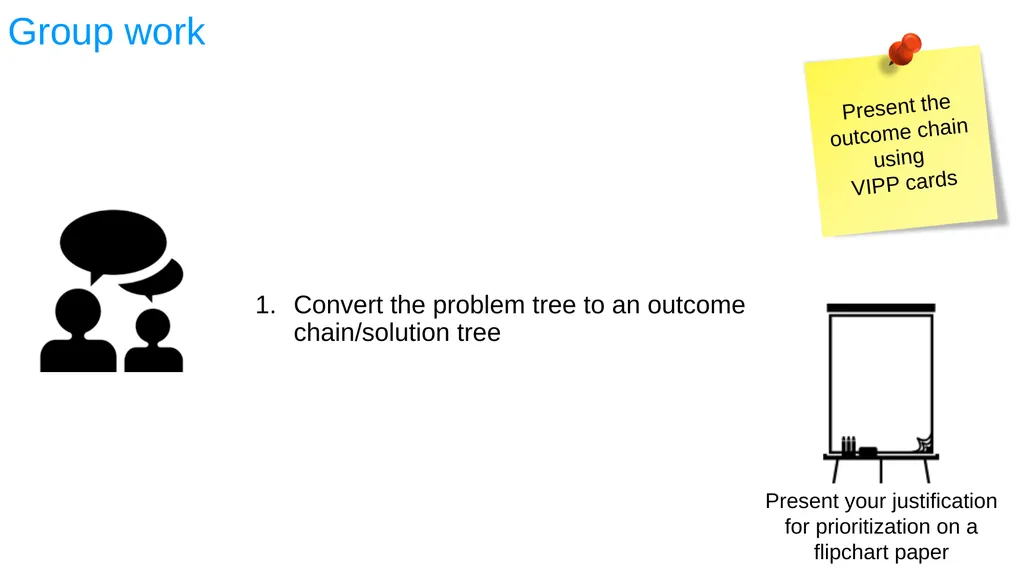
slide30. Group work Convert the problem tree to an outcome chain/solution tree Present your justification for prioritization on a flipchart paper<br>
slide31. Any Questions?<br>
slide32. THEORY OF CHANGE: PRIORITIZATION SESSION 5<br>
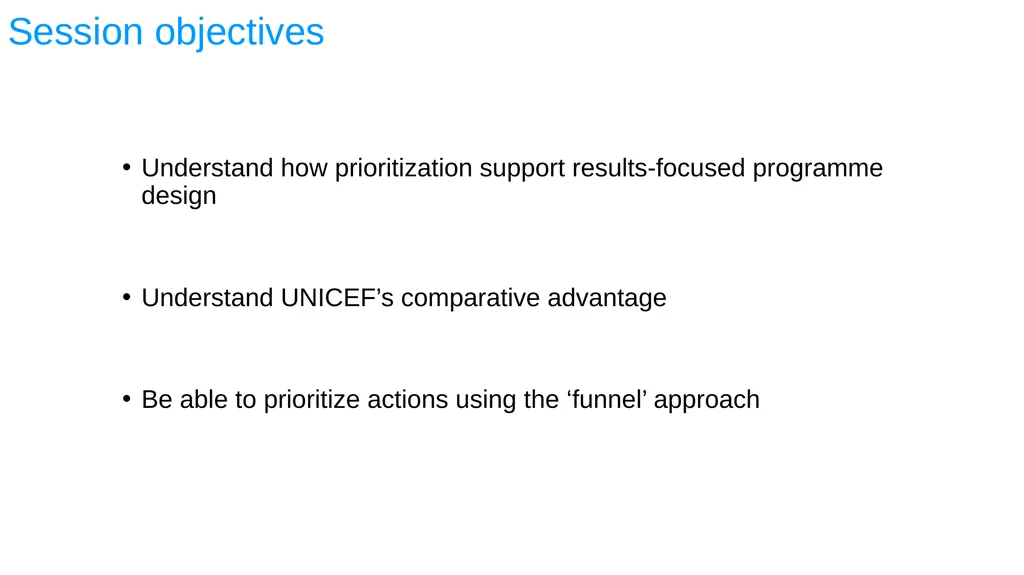
slide33. Session objectives Understand how prioritization support results-focused programme design
Understand UNICEF’s comparative advantage
Be able to prioritize actions using the ‘funnel’ approach<br>
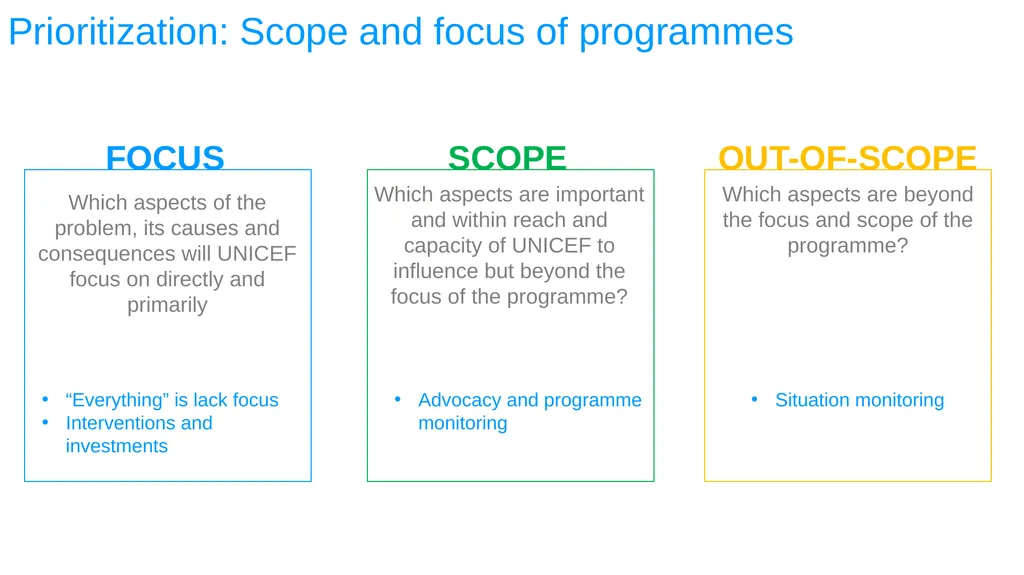
slide34. Prioritization: Scope and focus of programmes FOCUS SCOPE OUT-OF-SCOPE Which aspects of the problem, its causes and consequences will UNICEF focus on directly and primarily “Everything” is lack focus
Interventions and investments Which aspects are important and within reach and capacity of UNICEF to influence but beyond the focus of the programme? Advocacy and programme monitoring Which aspects are beyond the focus and scope of the programme? Situation monitoring<br>
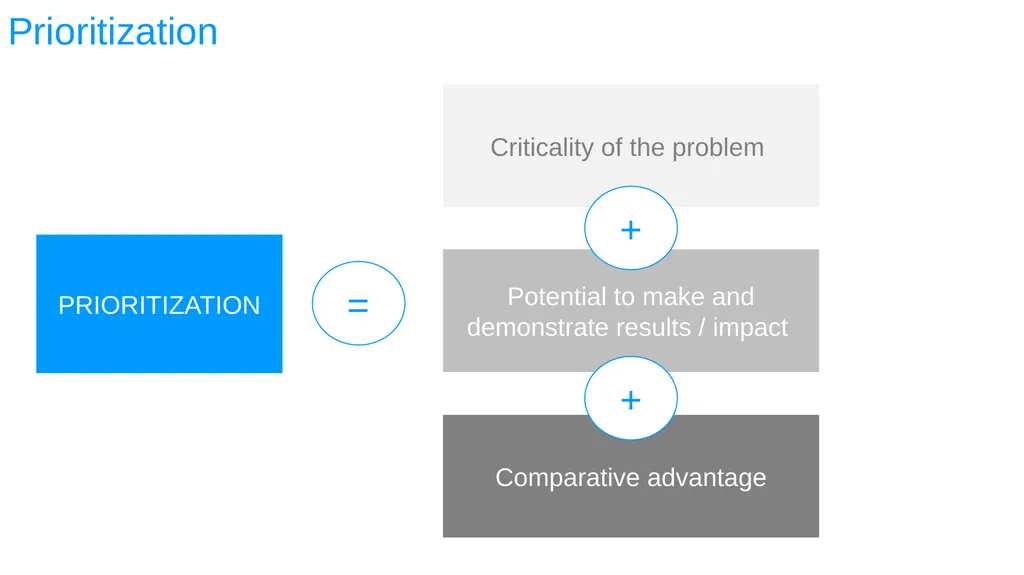
slide35. Prioritization Comparative advantage PRIORITIZATION = Criticality of the problem Potential to make and demonstrate results / impact + +<br>
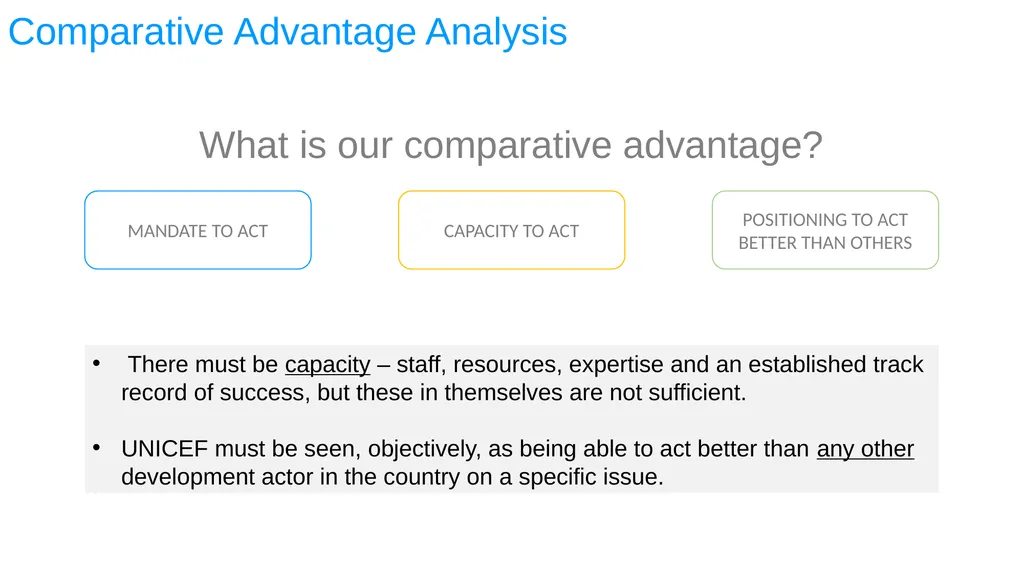
slide36. Comparative Advantage Analysis What is our comparative advantage? There must be capacity – staff, resources, expertise and an established track record of success, but these in themselves are not sufficient.
UNICEF must be seen, objectively, as being able to act better than any other development actor in the country on a specific issue. MANDATE TO ACT CAPACITY TO ACT POSITIONING TO ACT BETTER THAN OTHERS<br>
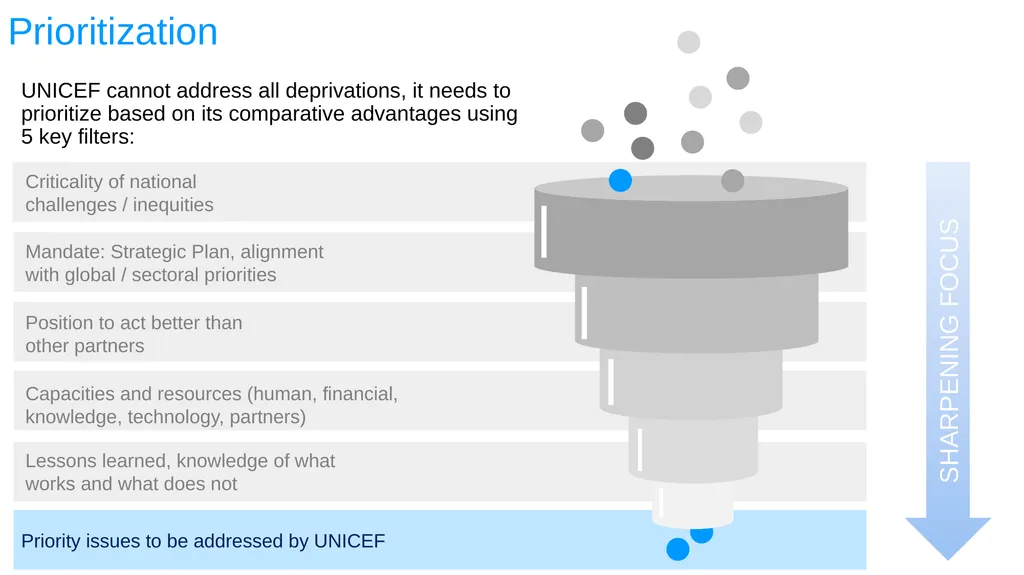
slide37. Prioritization UNICEF cannot address all deprivations, it needs to prioritize based on its comparative advantages using 5 key filters: Criticality of national challenges / inequities Mandate: Strategic Plan, alignment with global / sectoral priorities Position to act better than other partners Capacities and resources (human, financial, knowledge, technology, partners) Lessons learned, knowledge of what works and what does not Priority issues to be addressed by UNICEF SHARPENING FOCUS<br>
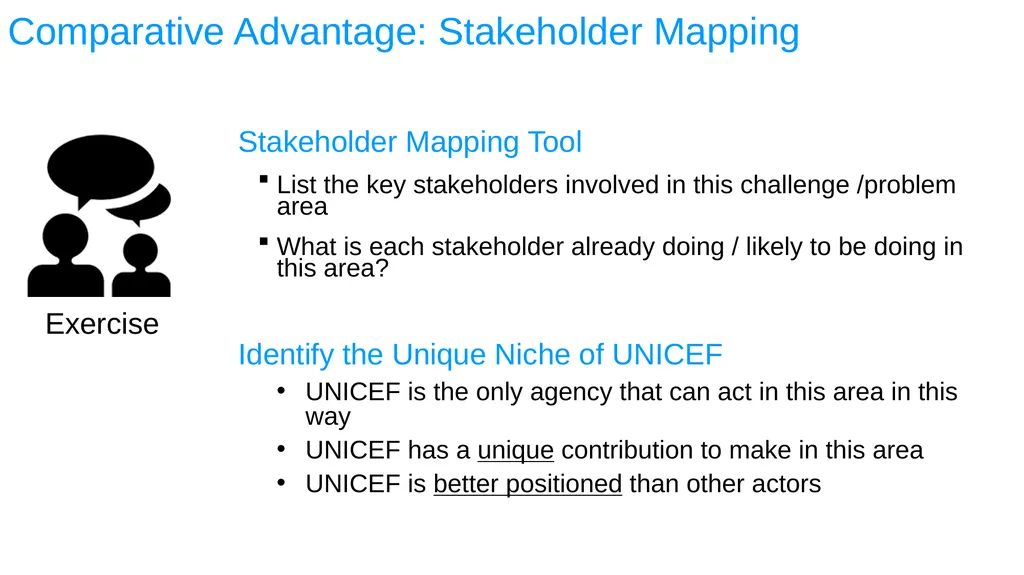
slide38. Comparative Advantage: Stakeholder Mapping Stakeholder Mapping Tool
List the key stakeholders involved in this challenge /problem area
What is each stakeholder already doing / likely to be doing in this area? Identify the Unique Niche of UNICEF
UNICEF is the only agency that can act in this area in this way
UNICEF has a unique contribution to make in this area
UNICEF is better positioned than other actors Exercise<br>
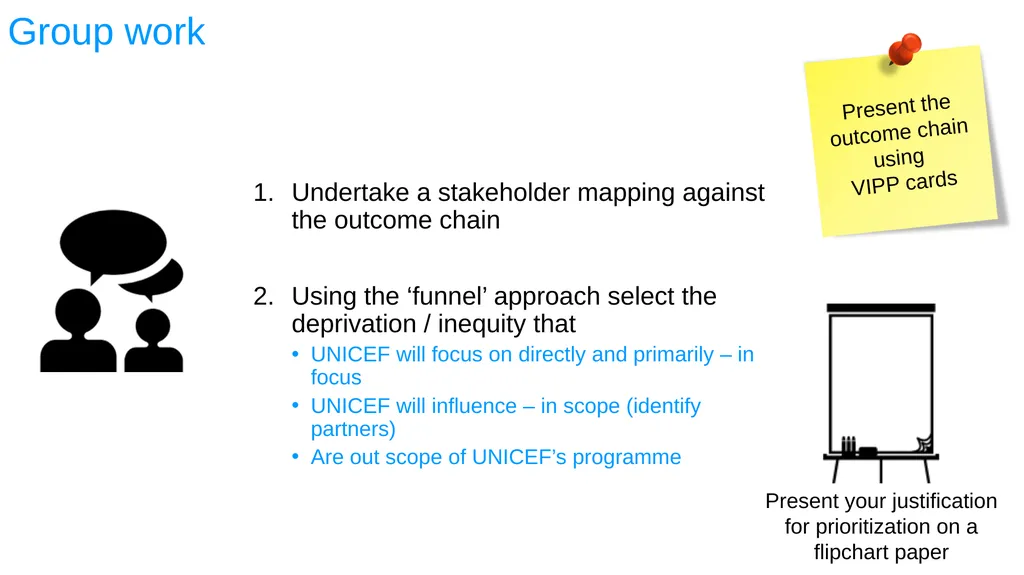
slide39. Group work Undertake a stakeholder mapping against the outcome chain
Using the ‘funnel’ approach select the deprivation / inequity that
UNICEF will focus on directly and primarily – in focus
UNICEF will influence – in scope (identify partners)
Are out scope of UNICEF’s programme Present your justification for prioritization on a flipchart paper<br>
slide40. Any Questions?<br>
slide41. THEORY OF CHANGE: STRATEGIES, RISKS AND ASSUMPTIONS SESSION 6<br>
slide42. Session objectives Define programme and implementation strategies
Identify key assumptions and risks
Assess the risk level
Mitigate risks<br>
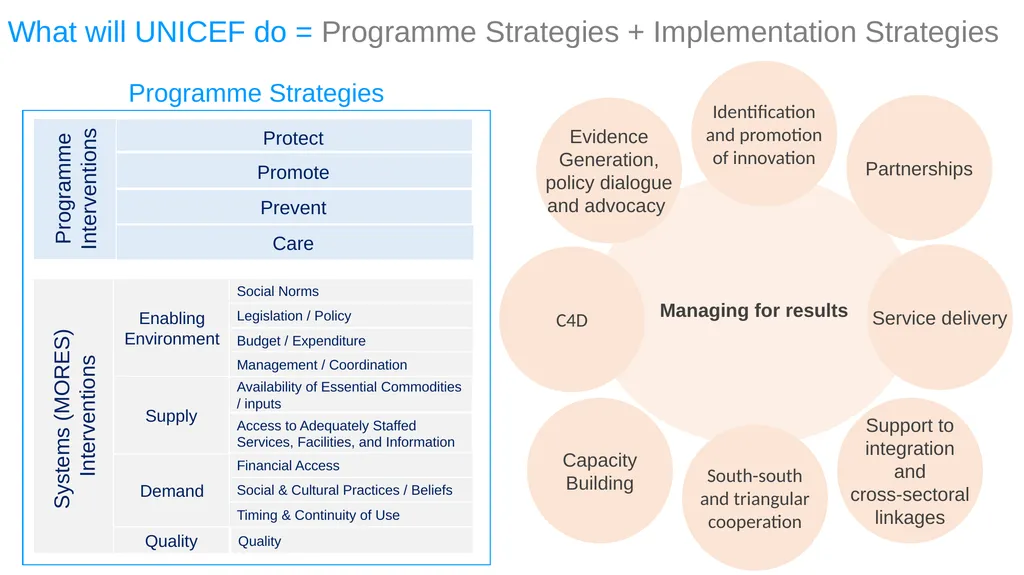
slide43. Managing for results What will UNICEF do = Programme Strategies + Implementation Strategies Protect Promote Prevent Care Programme
Interventions Systems (MORES)
Interventions Evidence
Generation,
policy dialogue
and advocacy Partnerships C4D Identification
and promotion
of innovation South-south
and triangular
cooperation Support to
integration
and
cross-sectoral
linkages Service delivery Capacity
Building Enabling Environment Supply Demand Quality Social Norms Legislation / Policy Budget / Expenditure Management / Coordination Availability of Essential Commodities / inputs Access to Adequately Staffed Services, Facilities, and Information Quality Financial Access Social & Cultural Practices / Beliefs Timing & Continuity of Use<br>
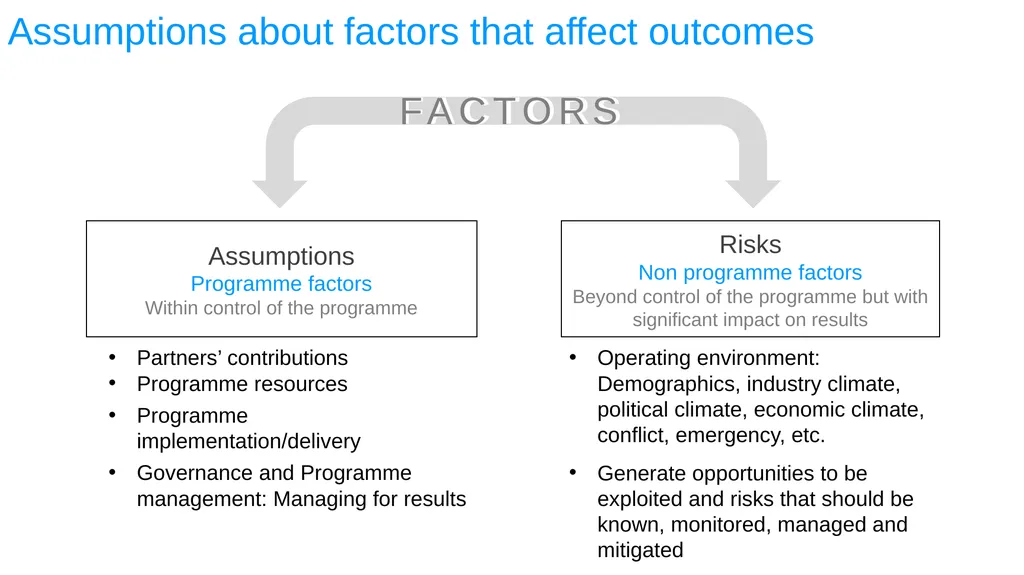
slide44. Assumptions about factors that affect outcomes Assumptions
Programme factors
Within control of the programme Risks
Non programme factors
Beyond control of the programme but with significant impact on results Partners’ contributions
Programme resources
Programme implementation/delivery
Governance and Programme management: Managing for results Operating environment: Demographics, industry climate, political climate, economic climate, conflict, emergency, etc.
Generate opportunities to be exploited and risks that should be known, monitored, managed and mitigated<br>
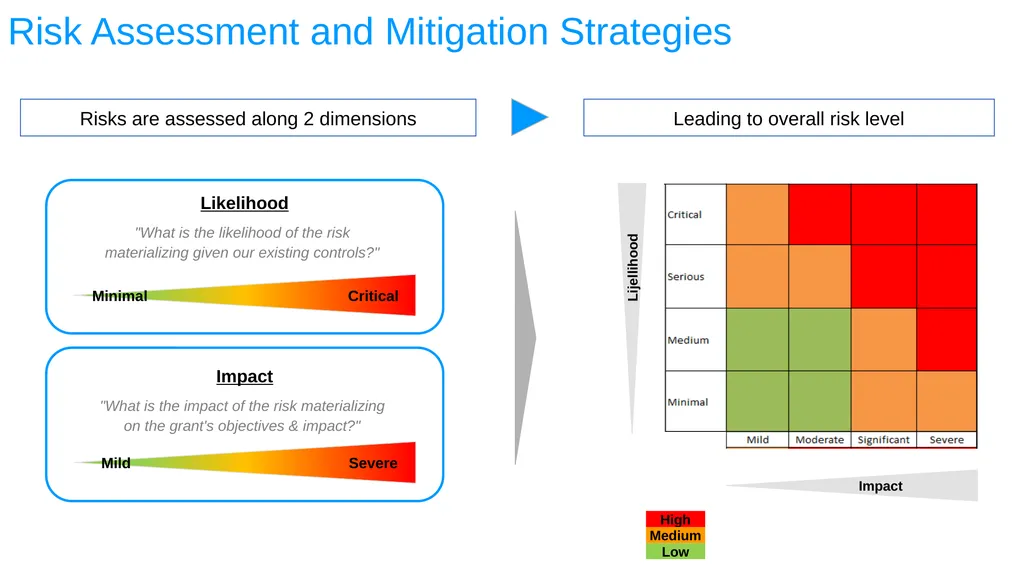
slide45. Risk Assessment and Mitigation Strategies Risks are assessed along 2 dimensions Leading to overall risk level Lijellihood Impact<br>
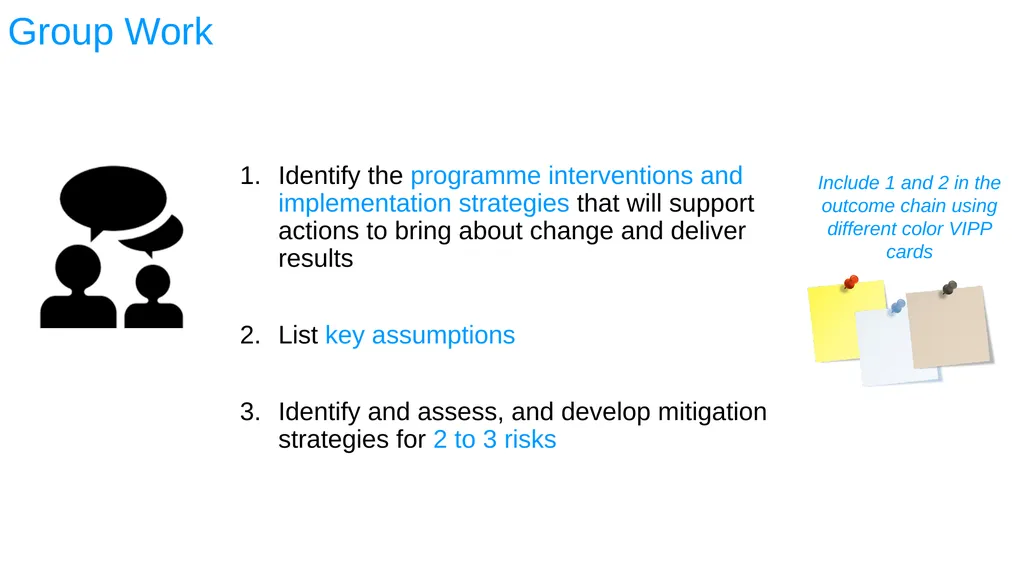
slide46. Group Work Identify the programme interventions and implementation strategies that will support actions to bring about change and deliver results
List key assumptions
Identify and assess, and develop mitigation strategies for 2 to 3 risks Include 1 and 2 in the outcome chain using different color VIPP cards<br>
slide47. Any Questions?<br>
slide48. DAY 1 DAY 2 Agenda Key Drivers and Principles of RBM Problem Analysis Application of Lenses Outcome Chain Prioritization Strategies, Risks and Assumptions Results Framework Group Presentations Implementation Monitoring and Evaluation Results Based Budgeting Reporting<br>
slide49. THE RESULTS FRAMEWORK SESSION 7<br>
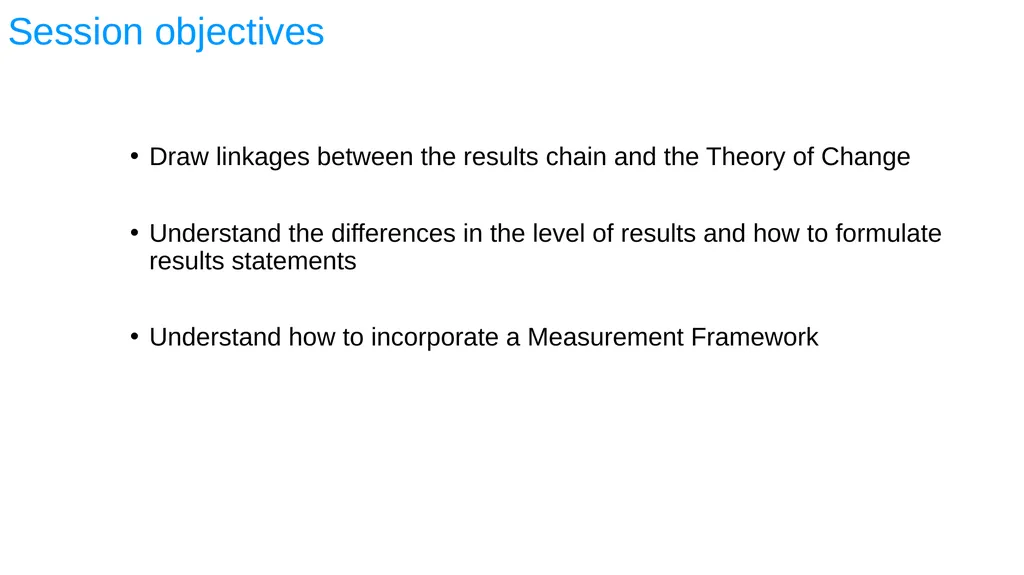
slide50. Session objectives Draw linkages between the results chain and the Theory of Change
Understand the differences in the level of results and how to formulate results statements
Understand how to incorporate a Measurement Framework<br>
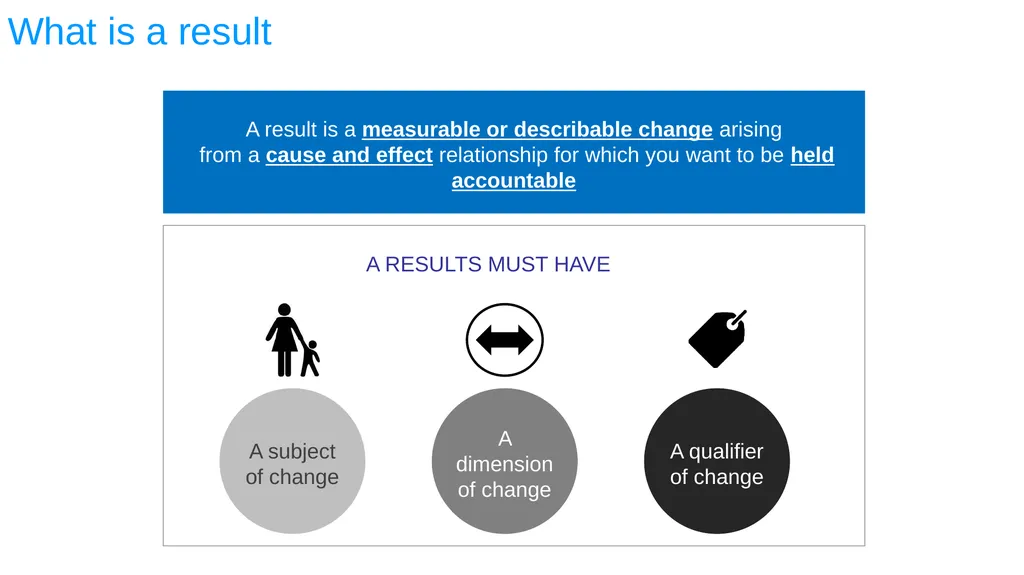
slide51. What is a result A result is a measurable or describable change arising
from a cause and effect relationship for which you want to be held accountable A subject of change A dimension of change A qualifier of change A RESULTS MUST HAVE<br>
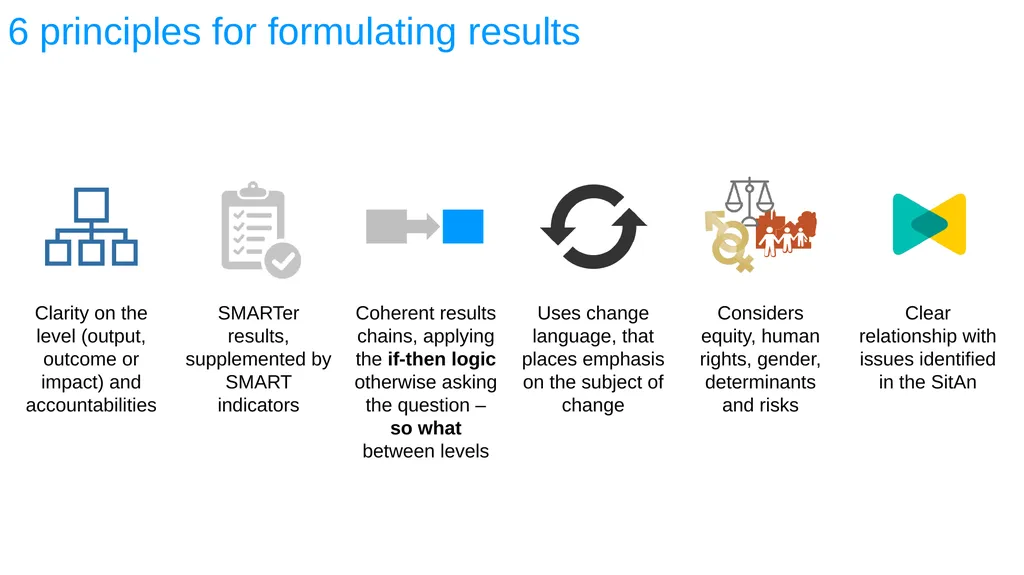
slide52. 6 principles for formulating results<br>
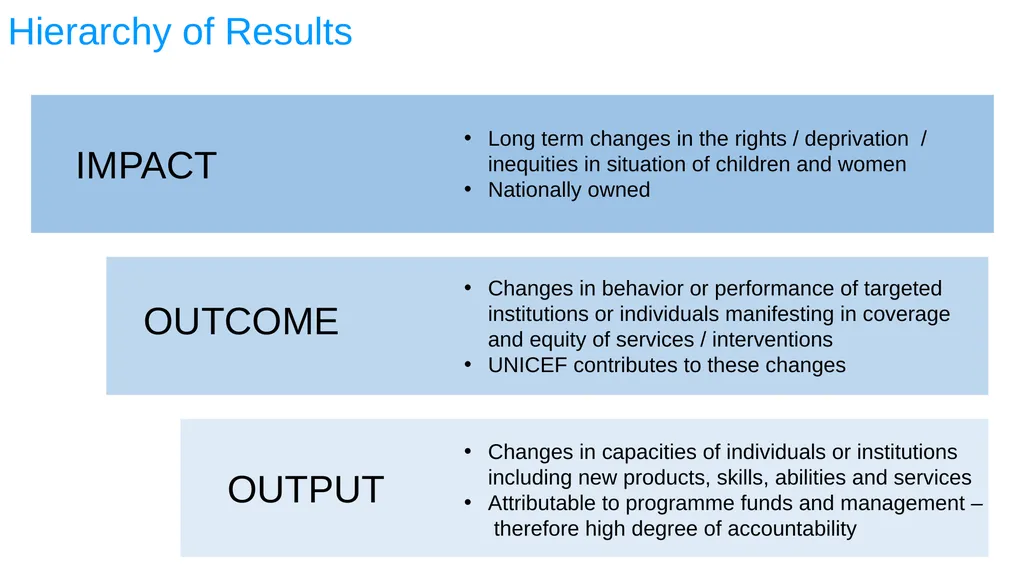
slide53. Hierarchy of Results<br>
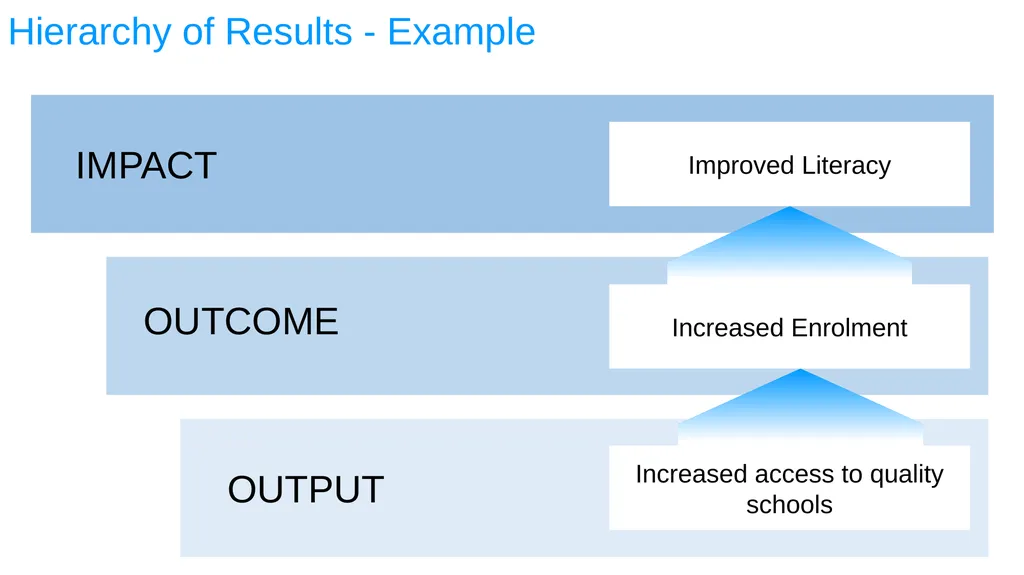
slide54. IMPACT OUTCOME OUTPUT Increased access to quality schools Hierarchy of Results - Example<br>
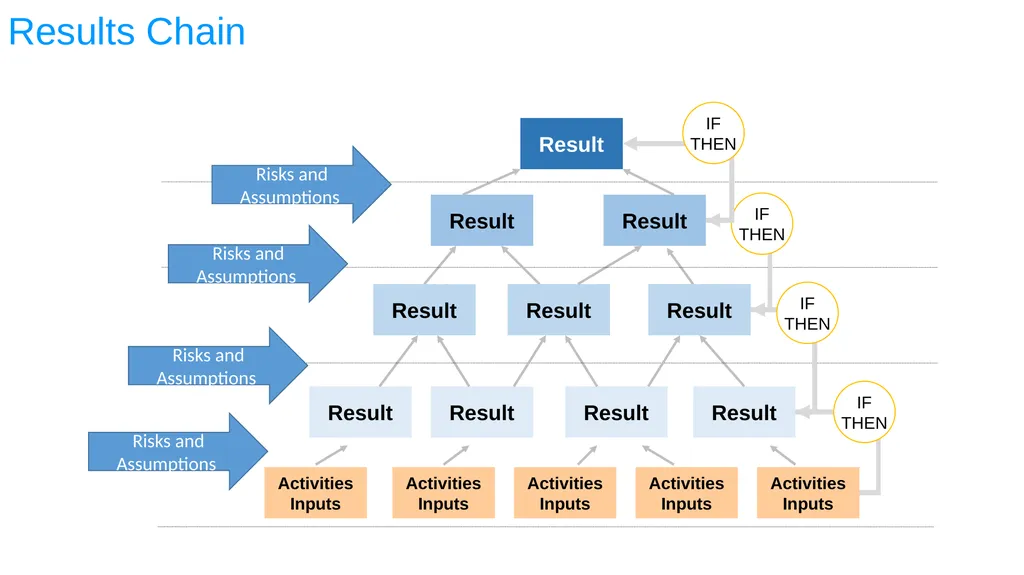
slide55. Results Chain Result Result Result Result Result Result Result Result Result Activities
Inputs Activities
Inputs Activities
Inputs Activities
Inputs Activities
Inputs IF
THEN IF
THEN IF
THEN Risks and Assumptions Risks and Assumptions Risks and Assumptions Risks and Assumptions<br>
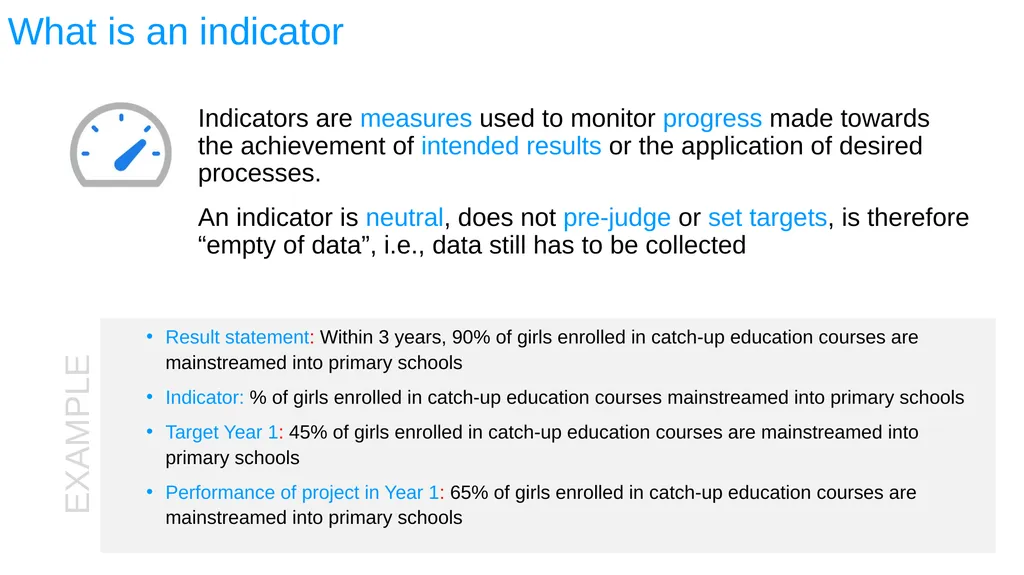
slide56. What is an indicator Indicators are measures used to monitor progress made towards the achievement of intended results or the application of desired processes. Result statement: Within 3 years, 90% of girls enrolled in catch-up education courses are mainstreamed into primary schools
Indicator: % of girls enrolled in catch-up education courses mainstreamed into primary schools
Target Year 1: 45% of girls enrolled in catch-up education courses are mainstreamed into primary schools
Performance of project in Year 1: 65% of girls enrolled in catch-up education courses are mainstreamed into primary schools An indicator is neutral, does not pre-judge or set targets, is therefore “empty of data”, i.e., data still has to be collected EXAMPLE<br>
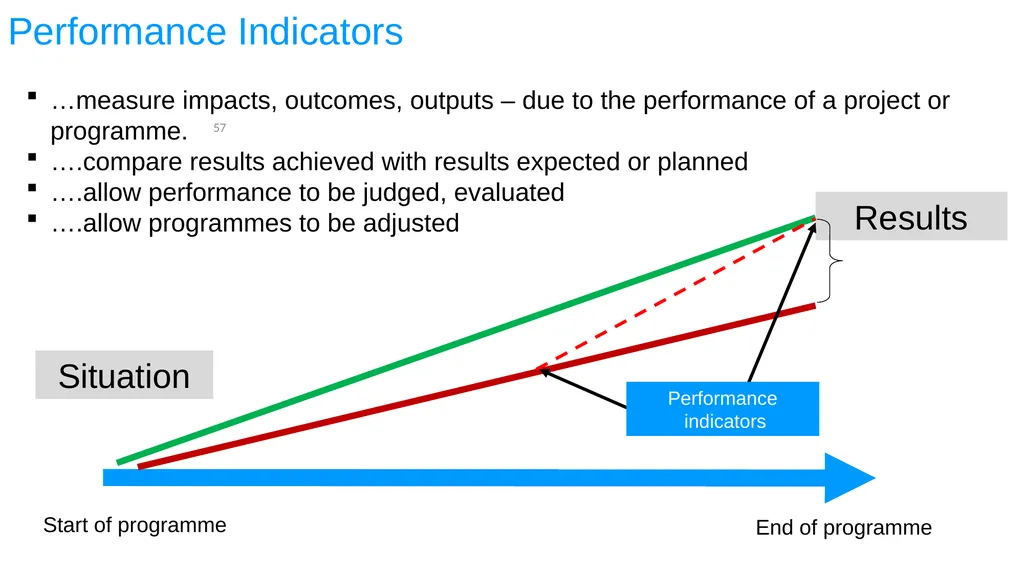
slide57. …measure impacts, outcomes, outputs – due to the performance of a project or programme.
….compare results achieved with results expected or planned
….allow performance to be judged, evaluated
….allow programmes to be adjusted 57 Situation Start of programme End of programme Results Performance Indicators Performance
indicators<br>
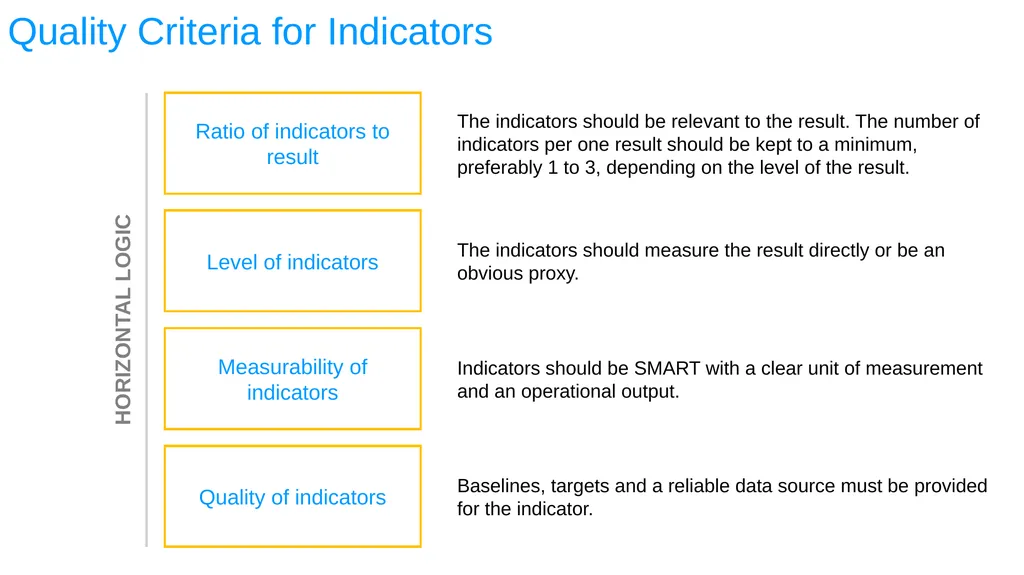
slide58. Quality Criteria for Indicators Ratio of indicators to result Level of indicators Measurability of indicators Quality of indicators The indicators should be relevant to the result. The number of indicators per one result should be kept to a minimum, preferably 1 to 3, depending on the level of the result. The indicators should measure the result directly or be an obvious proxy. Indicators should be SMART with a clear unit of measurement and an operational output. Baselines, targets and a reliable data source must be provided for the indicator.<br>
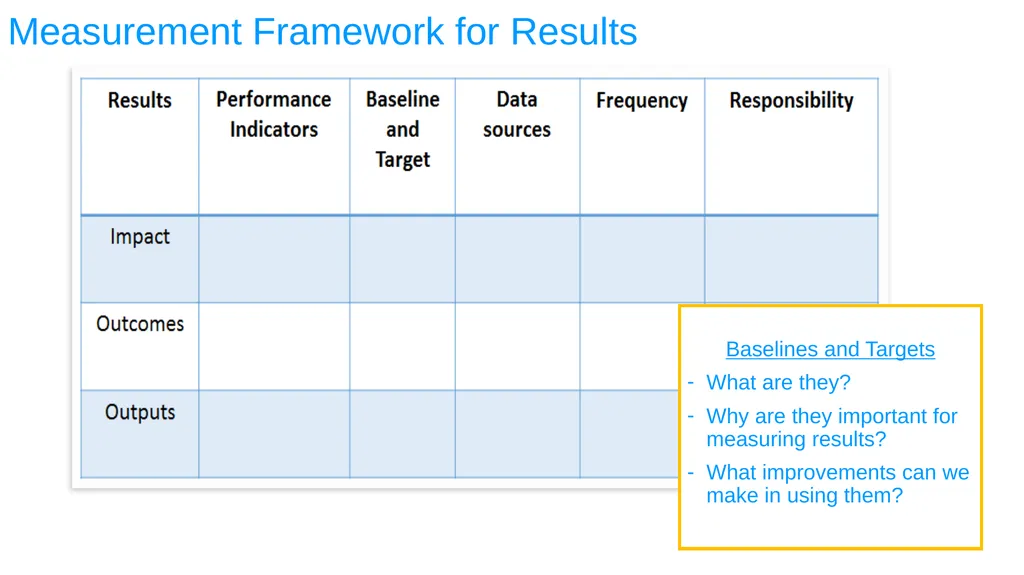
slide59. Measurement Framework for Results Baselines and Targets
What are they?
Why are they important for measuring results?
What improvements can we make in using them?<br>
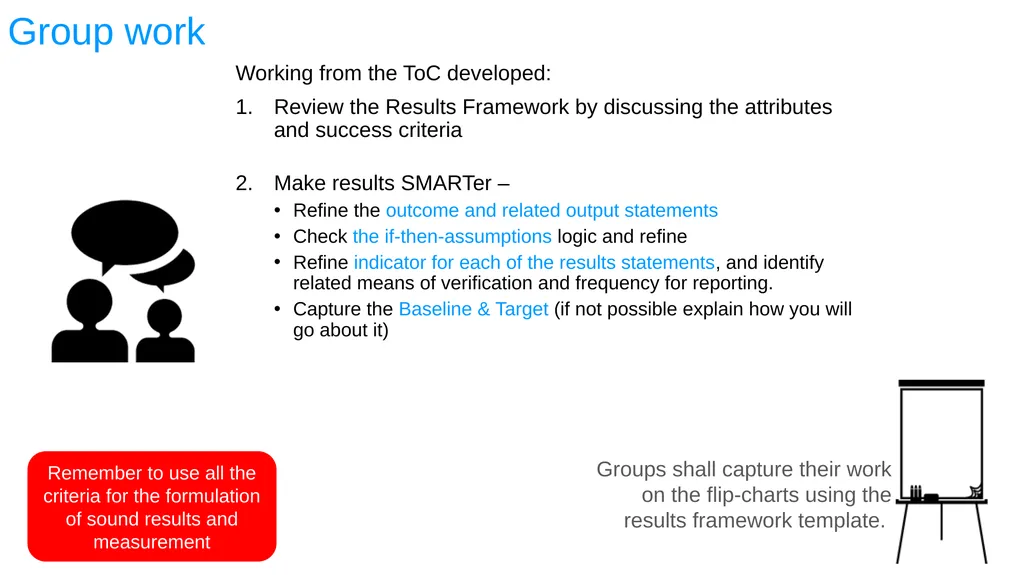
slide60. Group work Working from the ToC developed:
Review the Results Framework by discussing the attributes and success criteria
Make results SMARTer –
Refine the outcome and related output statements
Check the if-then-assumptions logic and refine
Refine indicator for each of the results statements, and identify related means of verification and frequency for reporting.
Capture the Baseline & Target (if not possible explain how you will go about it) Remember to use all the criteria for the formulation of sound results and measurement Groups shall capture their work on the flip-charts using the results framework template.<br>
slide61. Any Questions?<br>
slide62. PLENARY PRESENTATIONS SESSION 8<br>
slide63. IMPLEMENTATION SESSION 9<br>
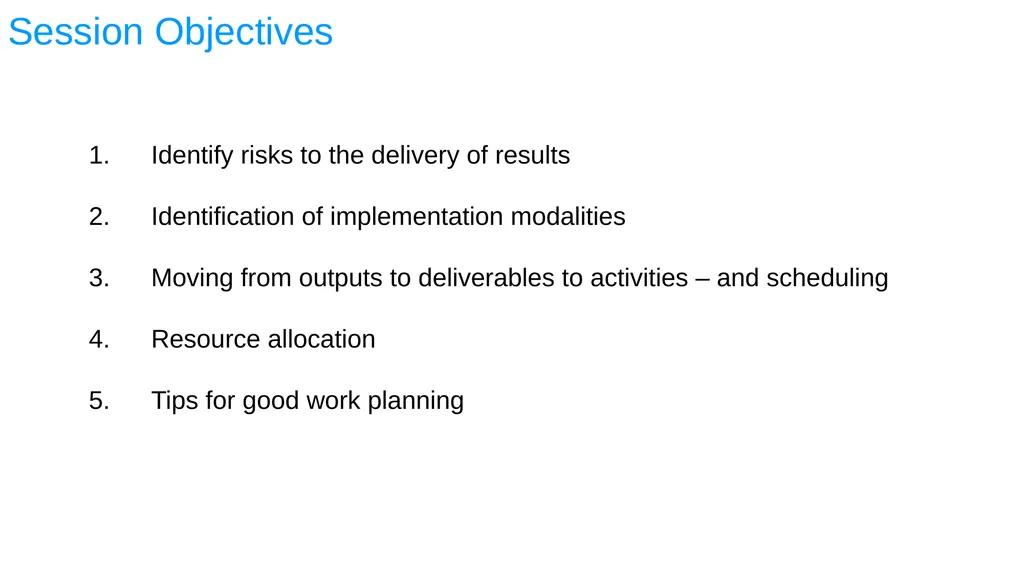
slide64. Session Objectives Identify risks to the delivery of results
Identification of implementation modalities
Moving from outputs to deliverables to activities – and scheduling
Resource allocation
Tips for good work planning<br>
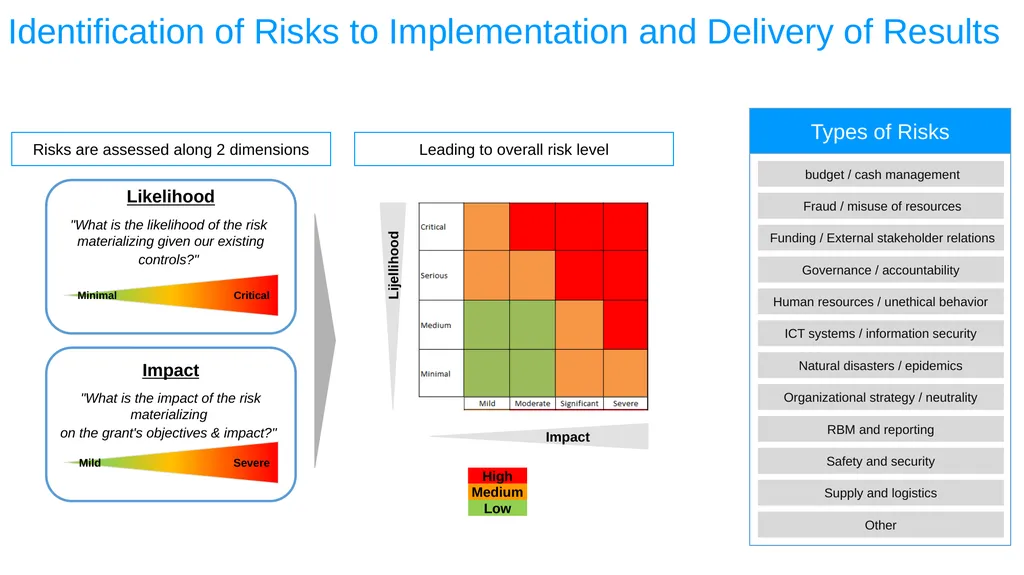
slide65. Identification of Risks to Implementation and Delivery of Results Risks are assessed along 2 dimensions Leading to overall risk level budget / cash management Fraud / misuse of resources Funding / External stakeholder relations Governance / accountability Human resources / unethical behavior ICT systems / information security Natural disasters / epidemics Organizational strategy / neutrality RBM and reporting Safety and security Supply and logistics Other Types of Risks<br>
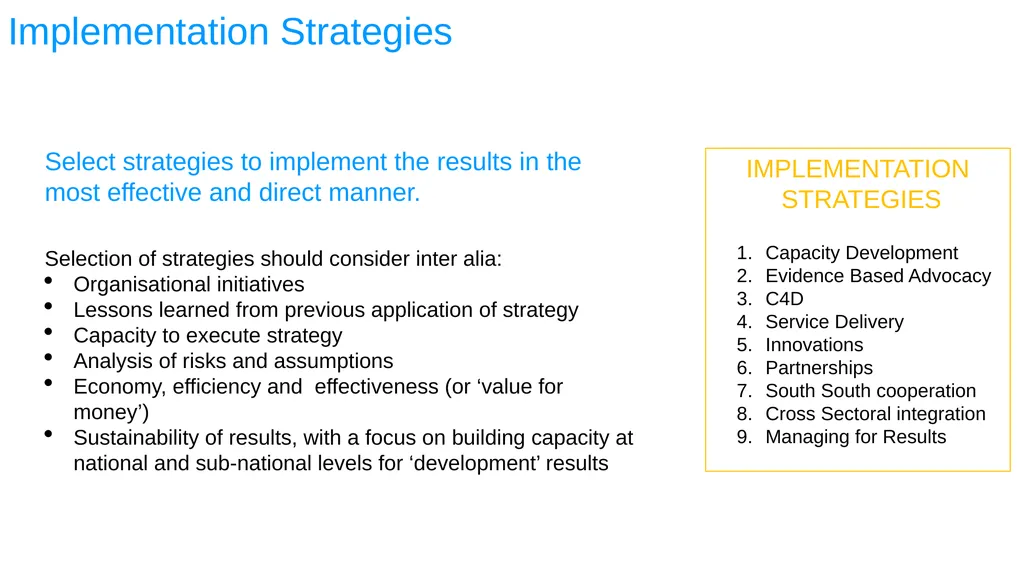
slide66. Implementation Strategies Select strategies to implement the results in the most effective and direct manner.
Selection of strategies should consider inter alia:
Organisational initiatives
Lessons learned from previous application of strategy
Capacity to execute strategy
Analysis of risks and assumptions
Economy, efficiency and effectiveness (or ‘value for money’)
Sustainability of results, with a focus on building capacity at national and sub-national levels for ‘development’ results IMPLEMENTATION
STRATEGIES Capacity Development
Evidence Based Advocacy
C4D
Service Delivery
Innovations
Partnerships
South South cooperation
Cross Sectoral integration
Managing for Results<br>
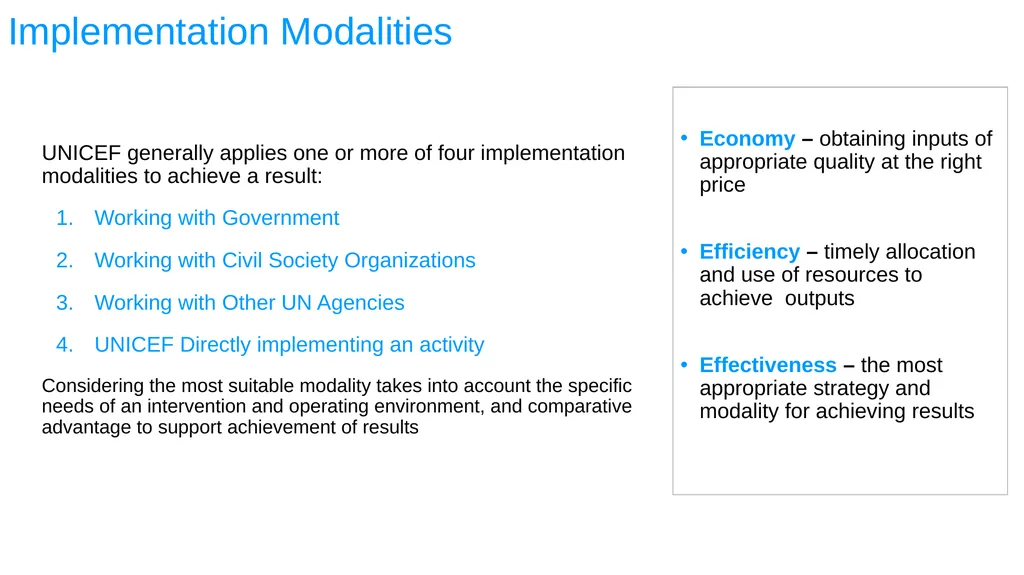
slide67. Implementation Modalities UNICEF generally applies one or more of four implementation modalities to achieve a result:
Working with Government
Working with Civil Society Organizations
Working with Other UN Agencies
UNICEF Directly implementing an activity
Considering the most suitable modality takes into account the specific needs of an intervention and operating environment, and comparative advantage to support achievement of results Economy – obtaining inputs of appropriate quality at the right price
Efficiency – timely allocation and use of resources to achieve outputs
Effectiveness – the most appropriate strategy and modality for achieving results<br>
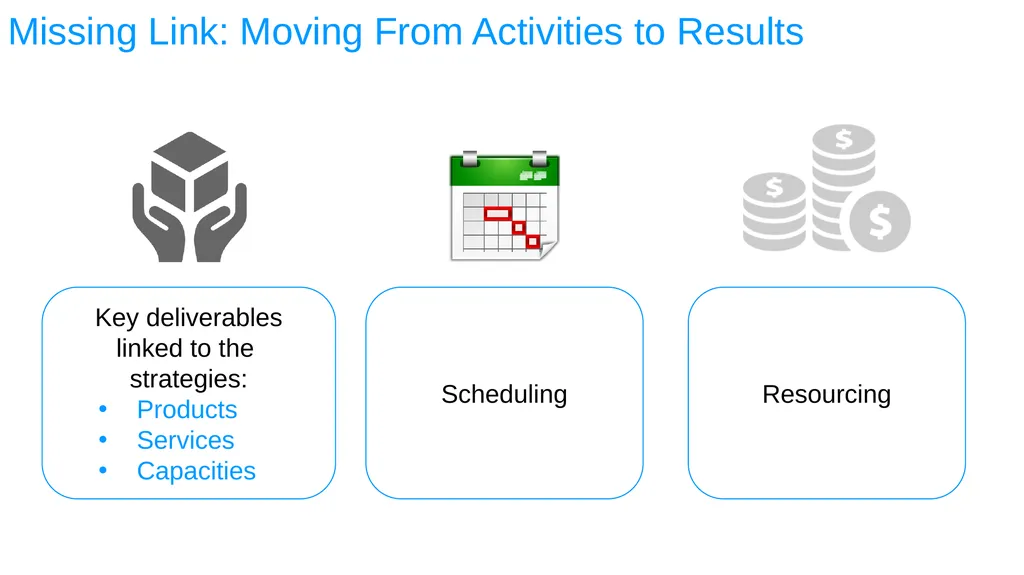
slide68. Missing Link: Moving From Activities to Results Key deliverables linked to the strategies:
Products
Services
Capacities Scheduling Resourcing<br>
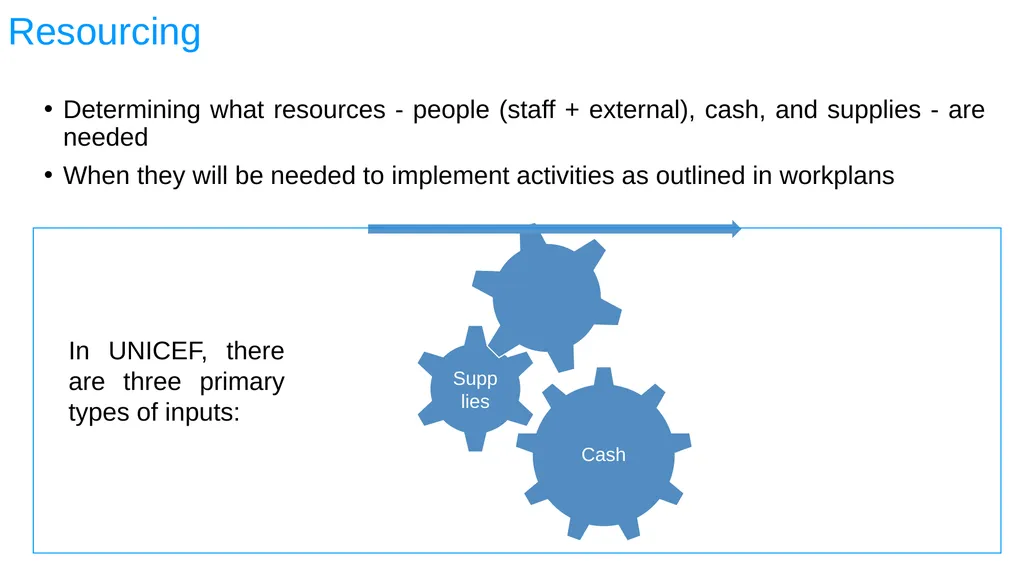
slide69. Resourcing Determining what resources - people (staff + external), cash, and supplies - are needed
When they will be needed to implement activities as outlined in workplans In UNICEF, there are three primary types of inputs:<br>
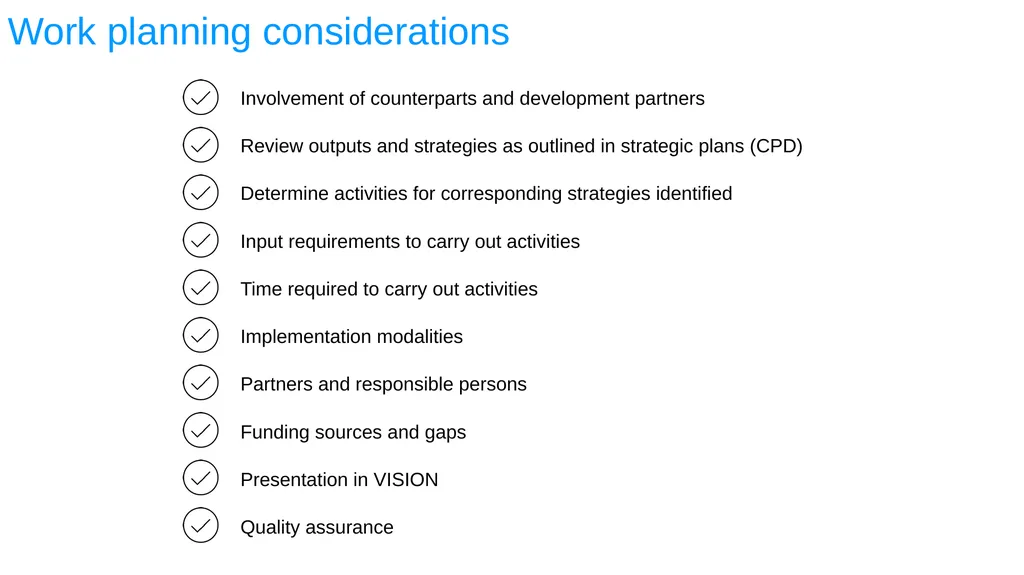
slide70. Work planning considerations Quality assurance Involvement of counterparts and development partners Review outputs and strategies as outlined in strategic plans (CPD) Determine activities for corresponding strategies identified Input requirements to carry out activities Time required to carry out activities Implementation modalities Partners and responsible persons Funding sources and gaps Presentation in VISION<br>
slide71. Any Questions?<br>
slide72. MONITORING AND EVALUATION SESSION 10<br>
slide73. Session Objectives Understand the importance of planning for monitoring and evaluation
To explore ways of improving monitoring practice
Develop understanding of critical complementarities between monitoring and evaluation
Understand how evaluation supports results-based management<br>
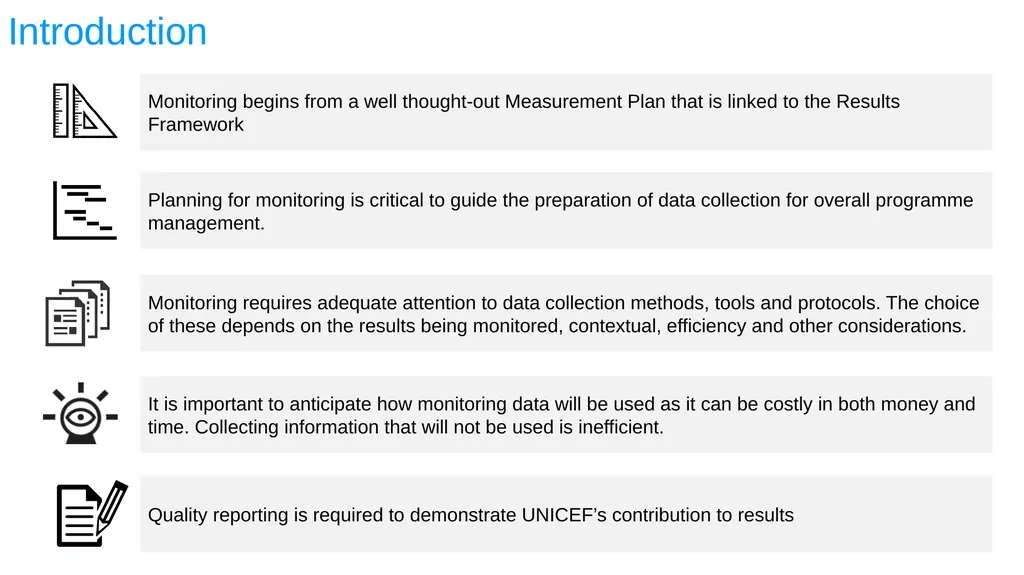
slide74. Introduction<br>
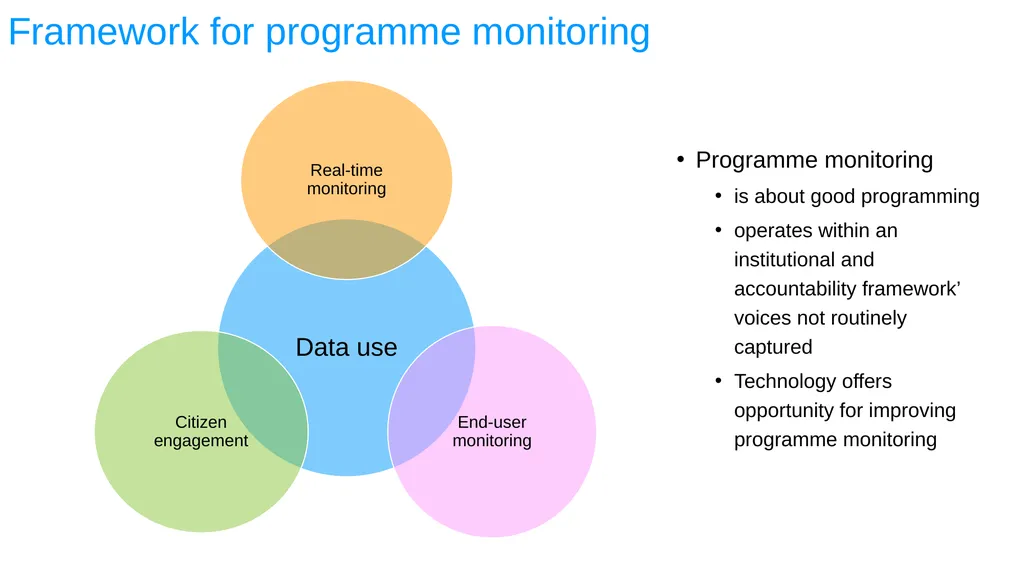
slide75. Programme monitoring
is about good programming
operates within an institutional and accountability framework’ voices not routinely captured
Technology offers opportunity for improving programme monitoring Data use Real-time monitoring End-user monitoring Citizen engagement Framework for programme monitoring<br>
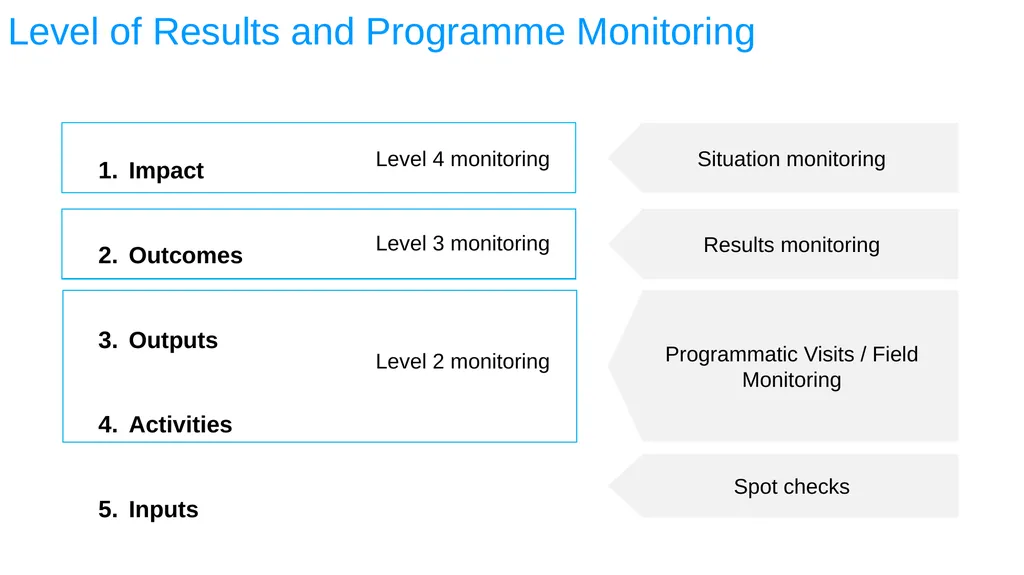
slide76. Level of Results and Programme Monitoring Impact
Outcomes
Outputs
Activities
Inputs Situation monitoring Results monitoring Programmatic Visits / Field Monitoring Spot checks<br>
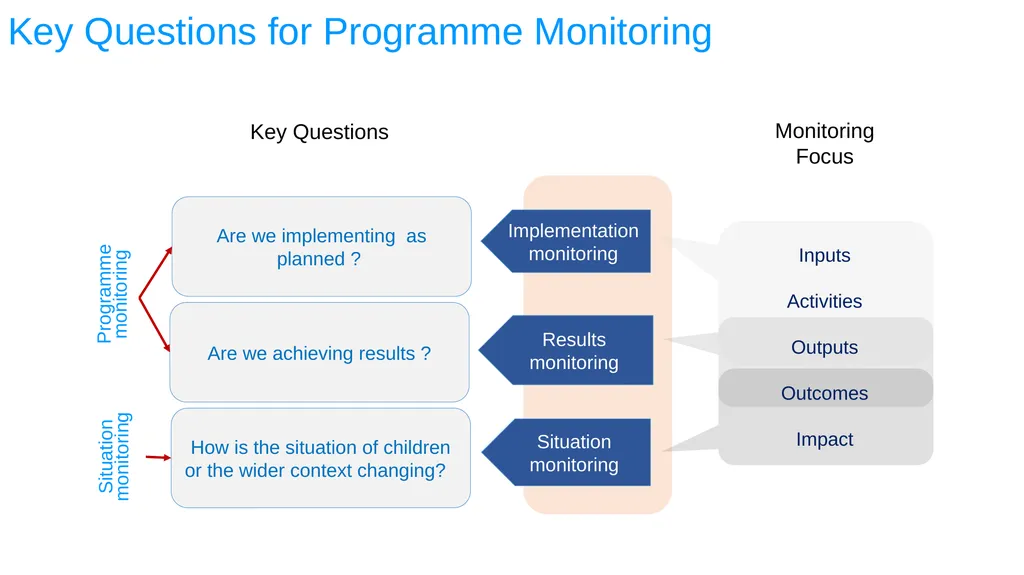
slide77. Key Questions for Programme Monitoring Are we implementing as planned ? Implementation monitoring Are we achieving results ? Results monitoring How is the situation of children or the wider context changing? Situation monitoring Key Questions Monitoring
Focus Inputs
Activities
Outputs
Outcomes
Impact Programme monitoring Situation monitoring<br>
slide78. What is an Evaluation? An evaluation is an assessment, as systematic and impartial as possible, of a programme, strategy, policy, sector, operational area or institutional performance.<br>
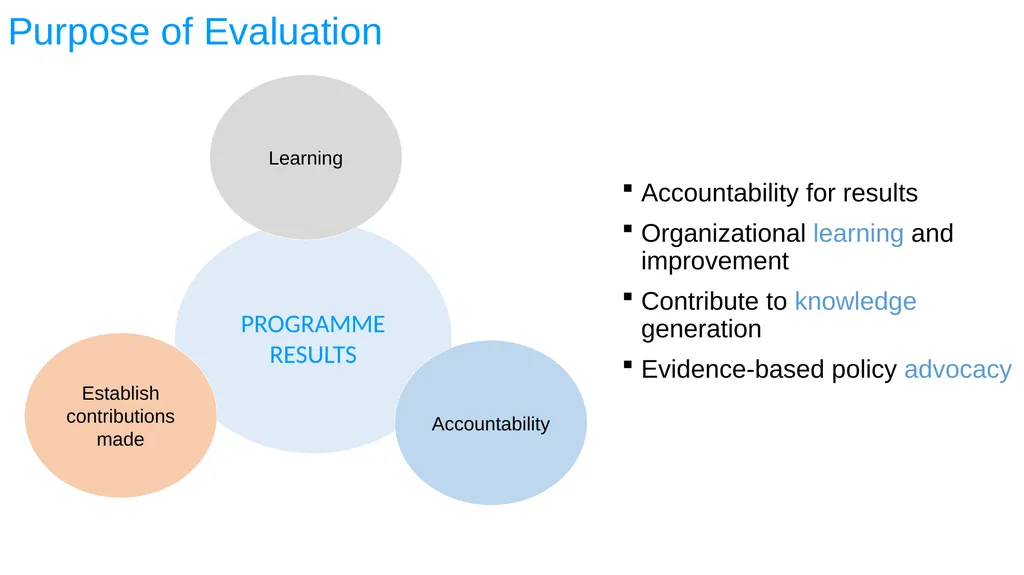
slide79. PROGRAMME RESULTS Purpose of Evaluation Establish contributions made Accountability Learning Accountability for results
Organizational learning and improvement
Contribute to knowledge generation
Evidence-based policy advocacy<br>
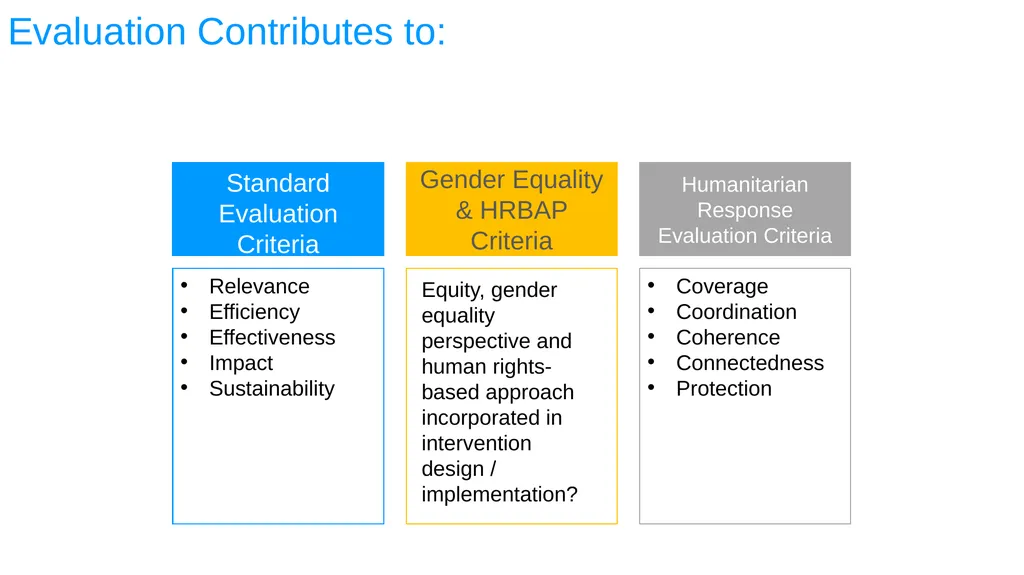
slide80. Evaluation Contributes to: Standard Evaluation Criteria Gender Equality & HRBAP Criteria Humanitarian Response Evaluation Criteria Relevance
Efficiency
Effectiveness
Impact
Sustainability Equity, gender equality perspective and human rights-based approach incorporated in intervention design / implementation? Coverage
Coordination
Coherence
Connectedness
Protection<br>
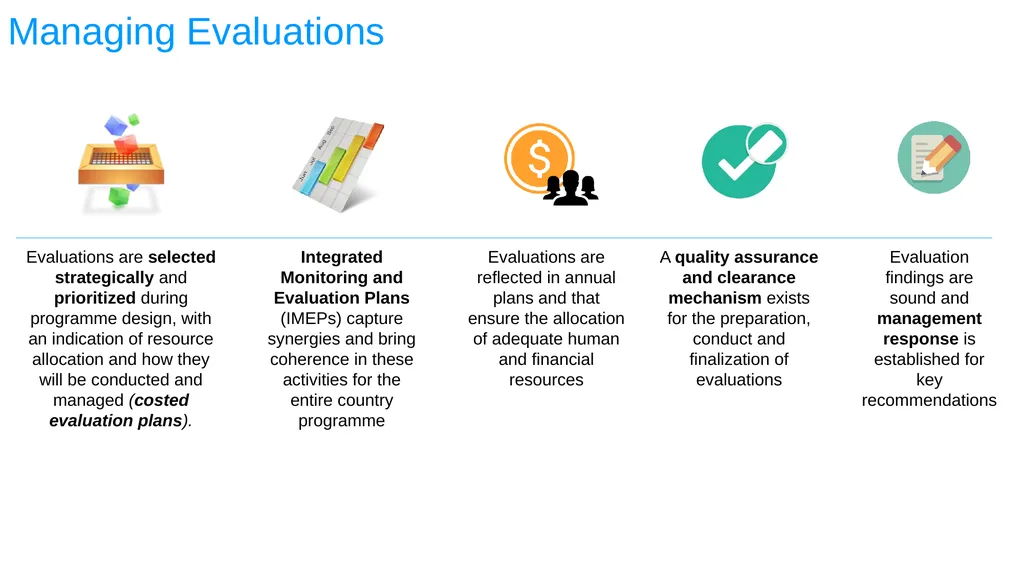
slide81. Managing Evaluations Evaluations are selected strategically and prioritized during programme design, with an indication of resource allocation and how they will be conducted and managed (costed evaluation plans). Integrated Monitoring and Evaluation Plans (IMEPs) capture synergies and bring coherence in these activities for the entire country programme Evaluations are reflected in annual plans and that ensure the allocation of adequate human and financial resources A quality assurance and clearance mechanism exists for the preparation, conduct and finalization of evaluations Evaluation findings are sound and management response is established for key recommendations<br>
slide82. Any Questions?<br>
slide83. RESULTS BASED BUDGETING SESSION 11<br>
slide84. Session Objectives Understand the principles of RBB and how to apply them when planning for results<br>
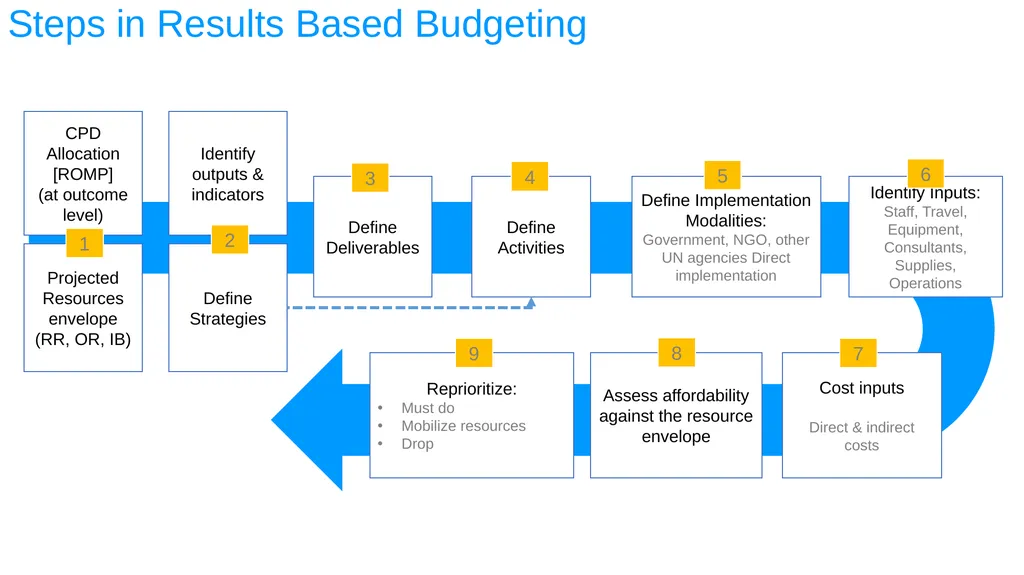
slide85. Steps in Results Based Budgeting CPD
Allocation [ROMP]
(at outcome level) Identify outputs & indicators Define Deliverables Define Strategies 3 Define Activities Define Implementation Modalities:
Government, NGO, other UN agencies Direct implementation Identify Inputs:
Staff, Travel, Equipment, Consultants, Supplies, Operations Cost inputs
Direct & indirect costs Assess affordability against the resource envelope Reprioritize:
Must do
Mobilize resources
Drop Projected Resources envelope (RR, OR, IB) 4 5 1 2 6 7 8 9<br>
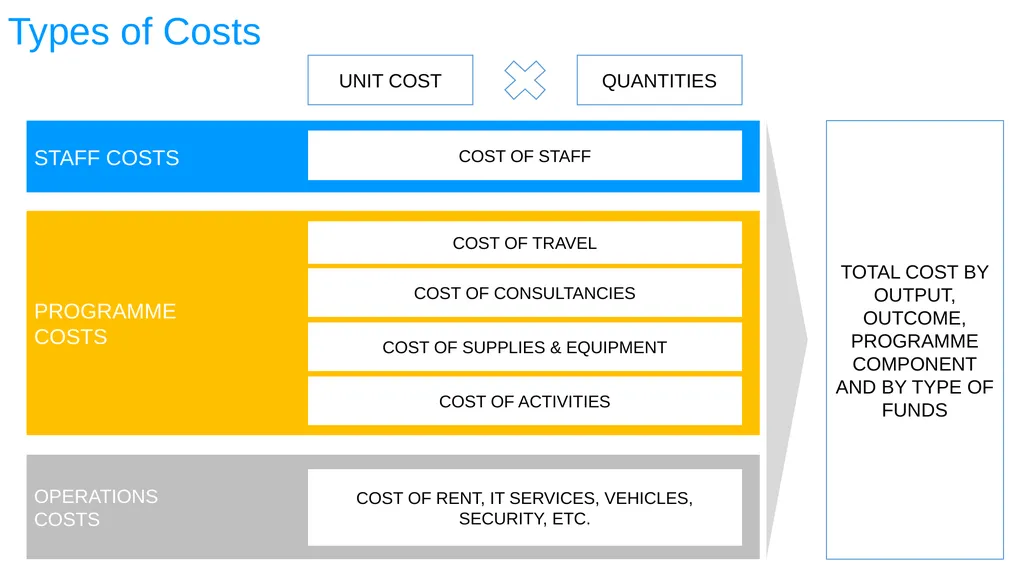
slide86. STAFF COSTS Types of Costs UNIT COST QUANTITIES PROGRAMME
COSTS OPERATIONS
COSTS COST OF STAFF COST OF TRAVEL COST OF CONSULTANCIES COST OF SUPPLIES & EQUIPMENT COST OF ACTIVITIES COST OF RENT, IT SERVICES, VEHICLES, SECURITY, ETC. TOTAL COST BY OUTPUT, OUTCOME, PROGRAMME COMPONENT
AND BY TYPE OF FUNDS<br>
slide87. Integrated Budget TOTAL COST BY OUTPUT, OUTCOME, PROGRAMME COMPONENT
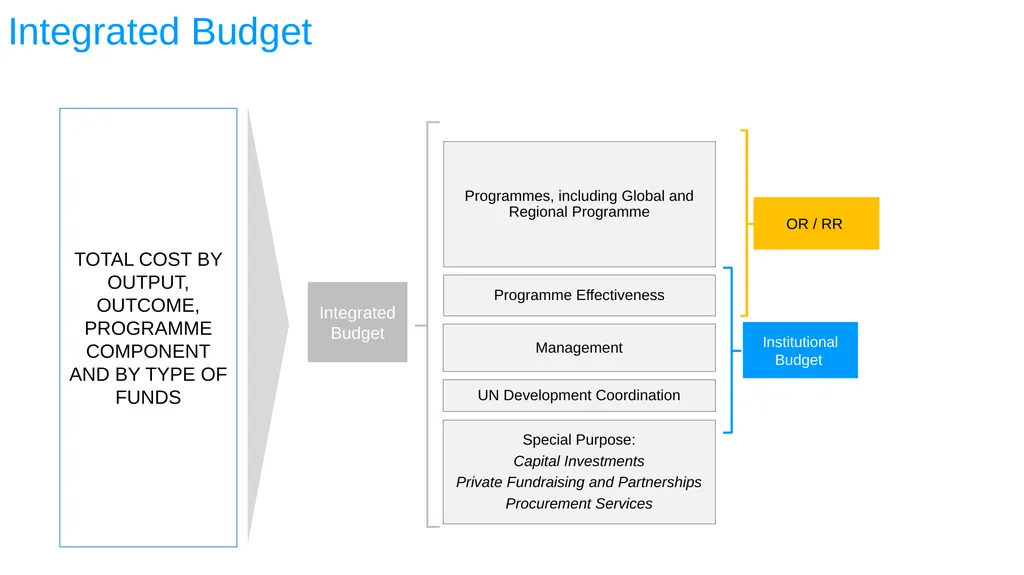
AND BY TYPE OF FUNDS Integrated Budget Institutional Budget Programmes, including Global and Regional Programme Programme Effectiveness Management UN Development Coordination Special Purpose:
Capital Investments
Private Fundraising and Partnerships
Procurement Services OR / RR<br>
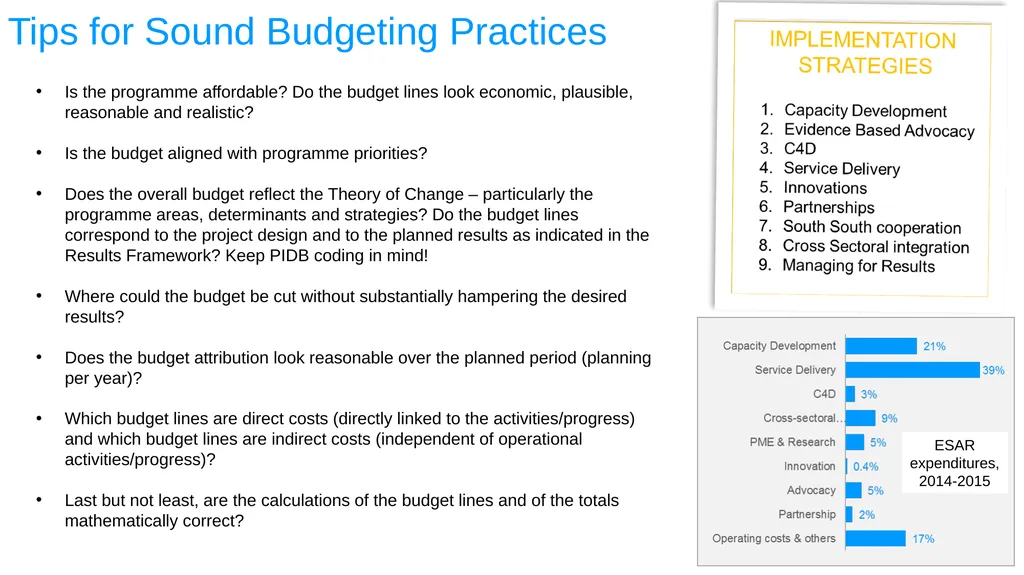
slide88. Tips for Sound Budgeting Practices Is the programme affordable? Do the budget lines look economic, plausible, reasonable and realistic?
Is the budget aligned with programme priorities?
Does the overall budget reflect the Theory of Change – particularly the programme areas, determinants and strategies? Do the budget lines correspond to the project design and to the planned results as indicated in the Results Framework? Keep PIDB coding in mind!
Where could the budget be cut without substantially hampering the desired results?
Does the budget attribution look reasonable over the planned period (planning per year)?
Which budget lines are direct costs (directly linked to the activities/progress) and which budget lines are indirect costs (independent of operational activities/progress)?
Last but not least, are the calculations of the budget lines and of the totals mathematically correct? ESAR expenditures,
2014-2015<br>
slide89. Any Questions?<br>
slide90. REPORTING SESSION 12<br>
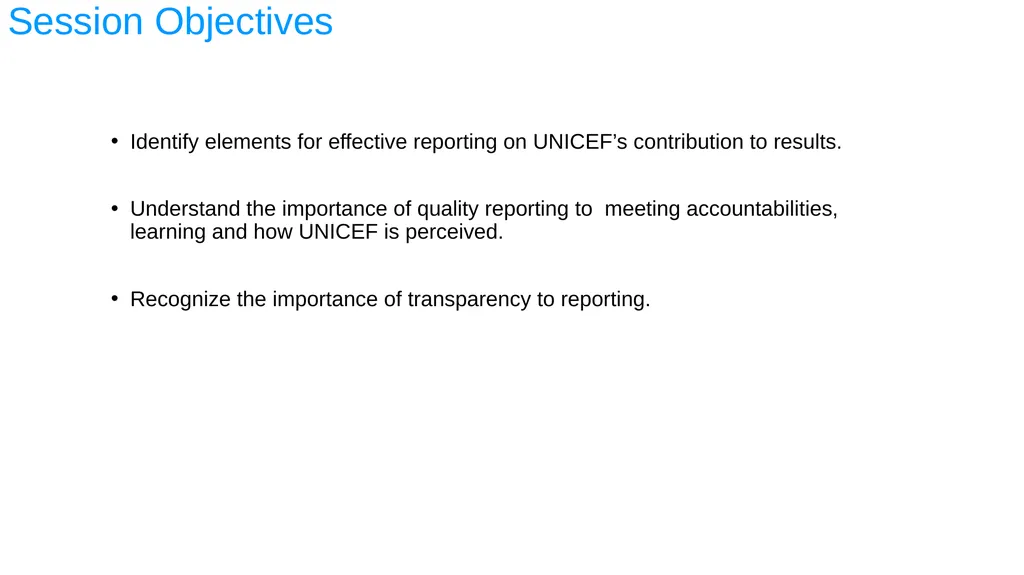
slide91. Session Objectives Identify elements for effective reporting on UNICEF’s contribution to results.
Understand the importance of quality reporting to meeting accountabilities, learning and how UNICEF is perceived.
Recognize the importance of transparency to reporting.<br>
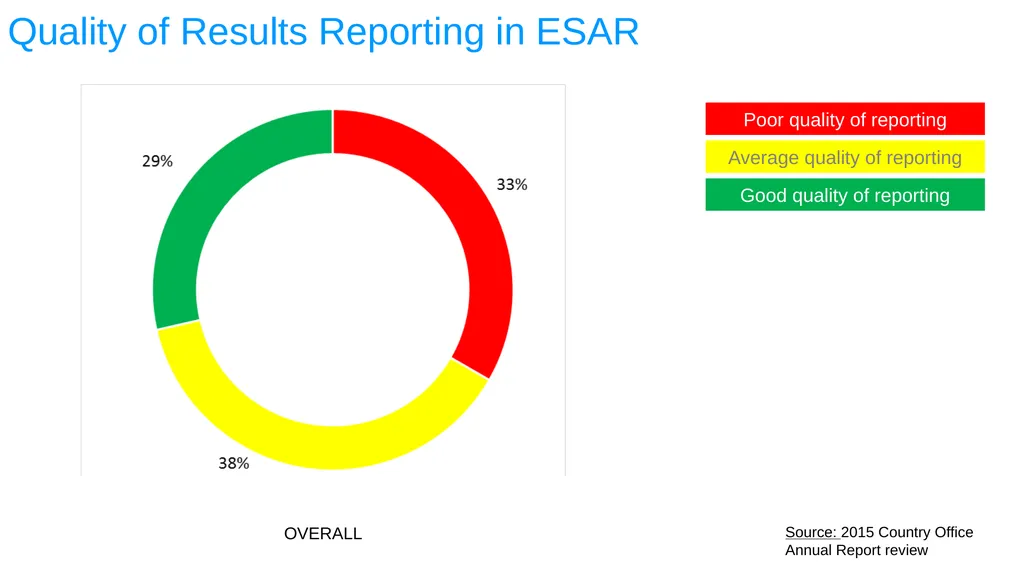
slide92. Quality of Results Reporting in ESAR Poor quality of reporting Average quality of reporting Good quality of reporting Source: 2015 Country Office Annual Report review<br>
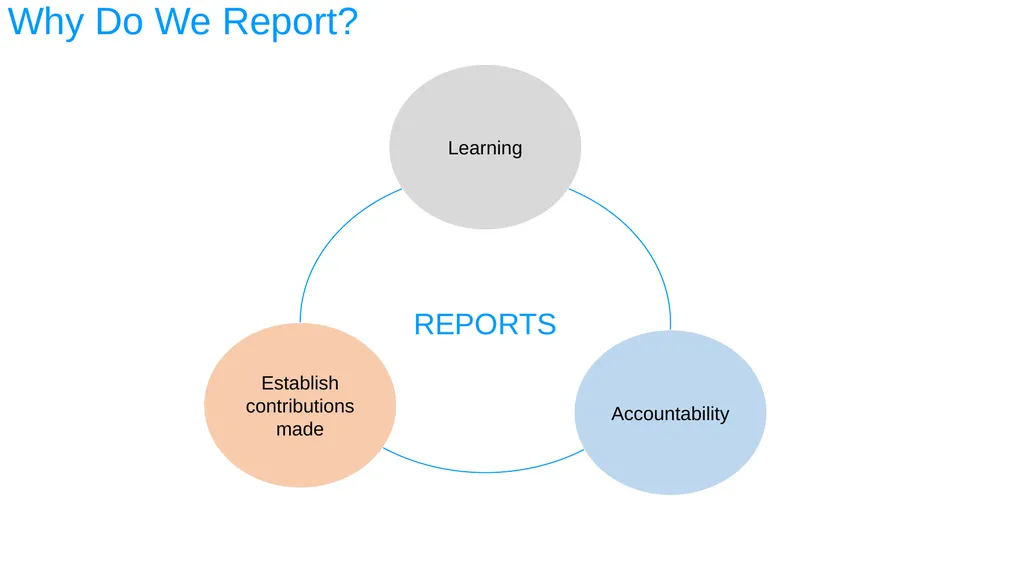
slide93. Why Do We Report? REPORTS Establish contributions made Accountability Learning<br>
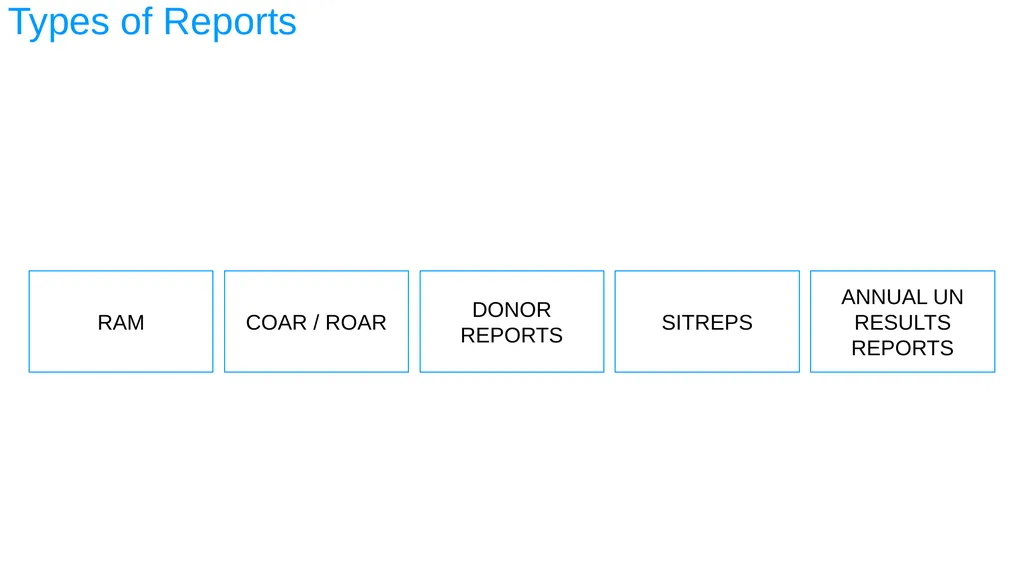
slide94. Types of Reports RAM COAR / ROAR DONOR REPORTS SITREPS ANNUAL UN RESULTS REPORTS<br>
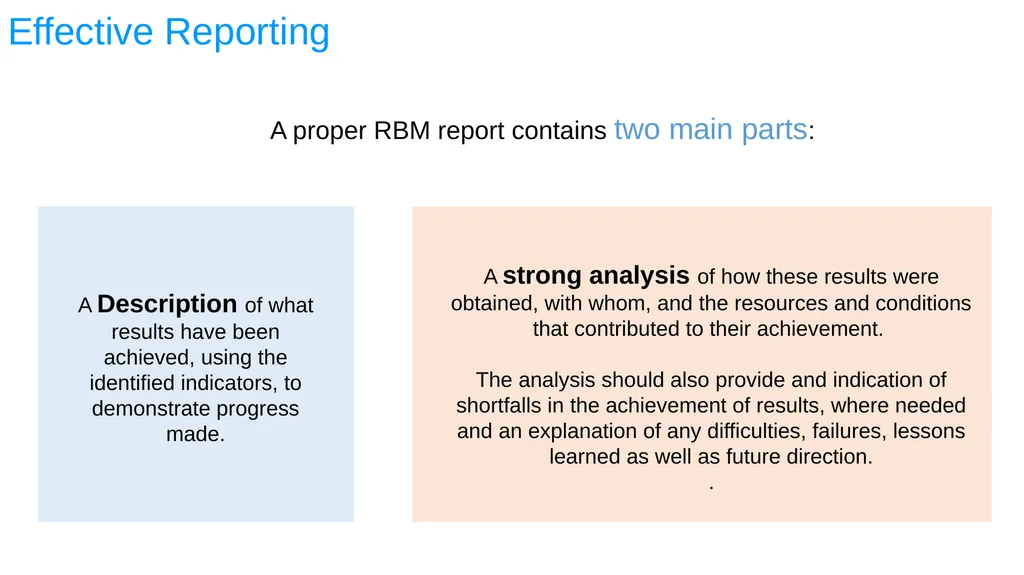
slide95. Effective Reporting A proper RBM report contains two main parts: A Description of what results have been achieved, using the identified indicators, to demonstrate progress made. A strong analysis of how these results were obtained, with whom, and the resources and conditions that contributed to their achievement.
The analysis should also provide and indication of shortfalls in the achievement of results, where needed and an explanation of any difficulties, failures, lessons learned as well as future direction.
.<br>
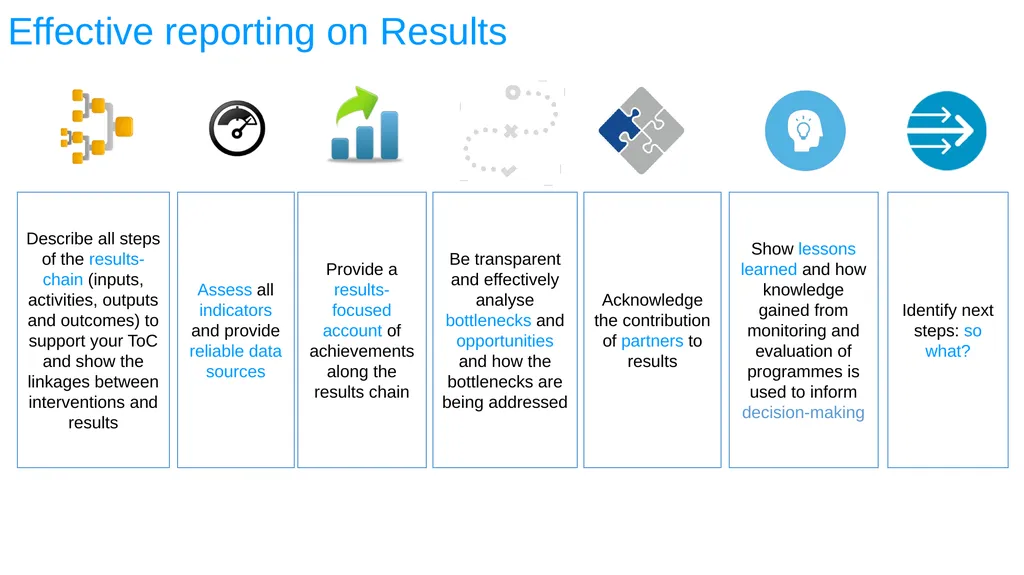
slide96. Effective reporting on Results Describe all steps of the results-chain (inputs, activities, outputs and outcomes) to support your ToC and show the linkages between interventions and results Identify next steps: so what? Assess all indicators and provide reliable data sources Provide a results- focused account of achievements along the results chain<br>
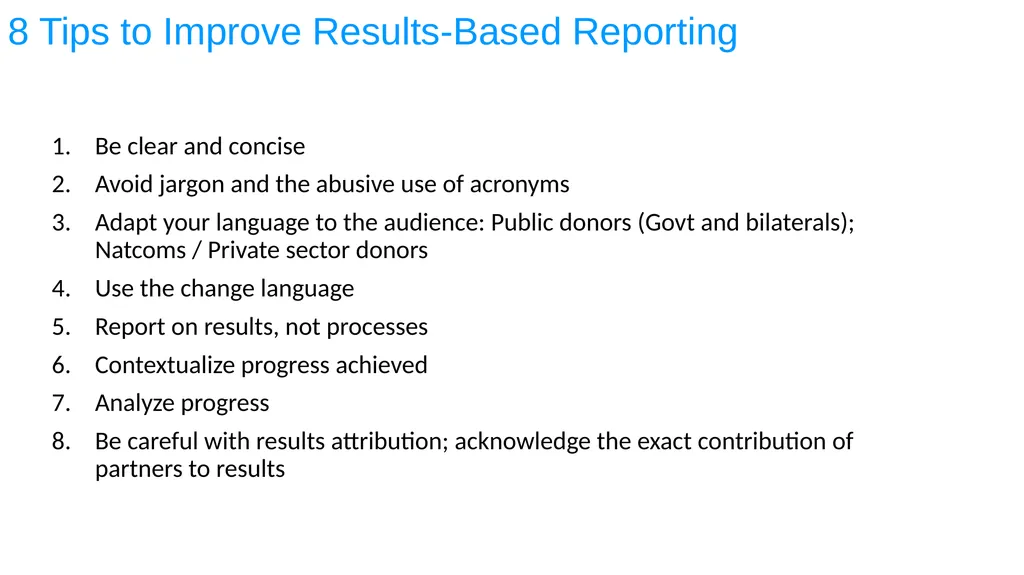
slide97. 8 Tips to Improve Results-Based Reporting Be clear and concise
Avoid jargon and the abusive use of acronyms
Adapt your language to the audience: Public donors (Govt and bilaterals); Natcoms / Private sector donors
Use the change language
Report on results, not processes
Contextualize progress achieved
Analyze progress
Be careful with results attribution; acknowledge the exact contribution of partners to results<br>
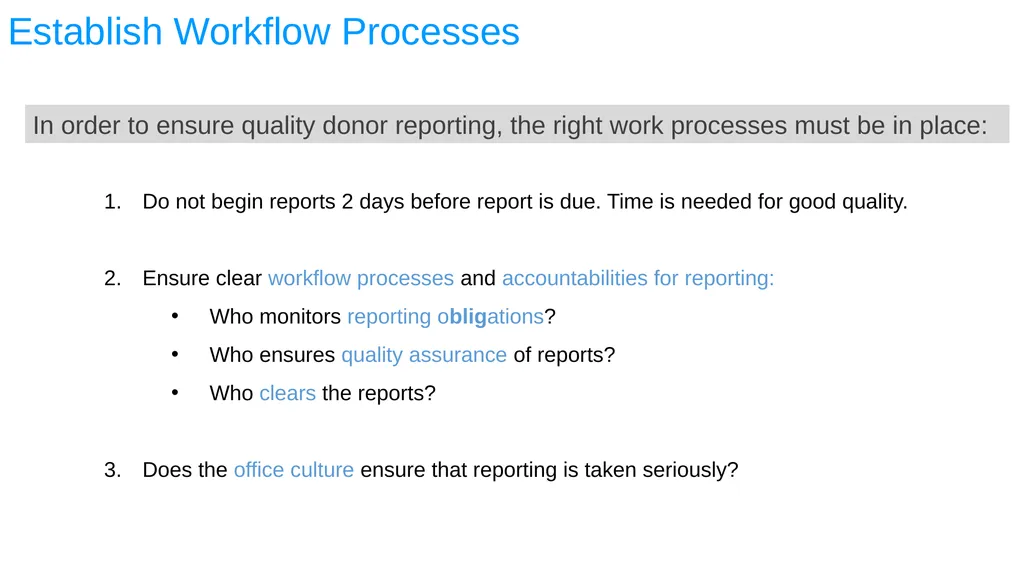
slide98. Establish Workflow Processes In order to ensure quality donor reporting, the right work processes must be in place: Do not begin reports 2 days before report is due. Time is needed for good quality.
Ensure clear workflow processes and accountabilities for reporting:
Who monitors reporting obligations?
Who ensures quality assurance of reports?
Who clears the reports?
Does the office culture ensure that reporting is taken seriously?<br>
slide99. Any Questions?<br>
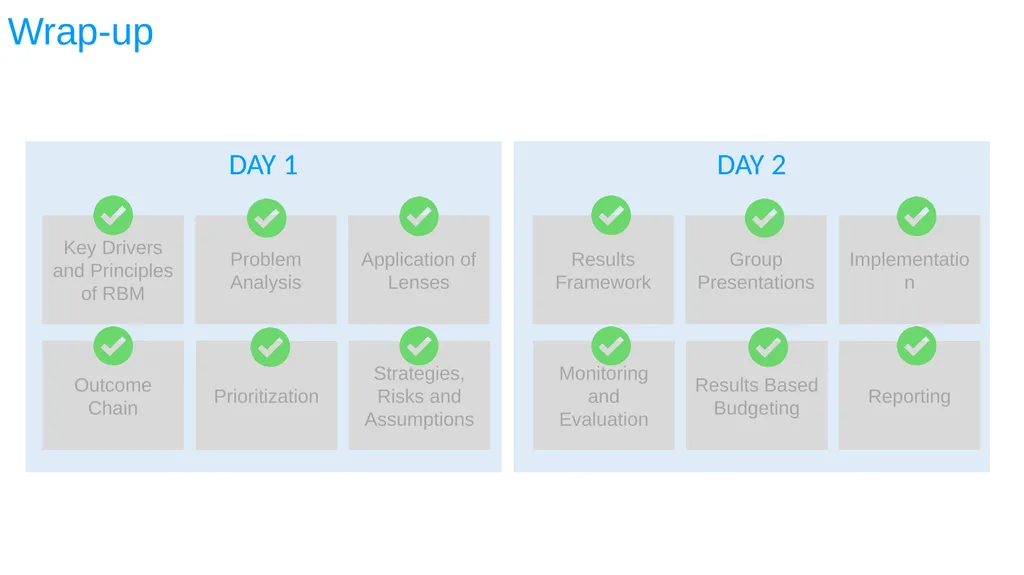
slide100. DAY 1 DAY 2 Wrap-up Key Drivers and Principles of RBM Problem Analysis Application of Lenses Outcome Chain Prioritization Strategies, Risks and Assumptions Results Framework Group Presentations Implementation Monitoring and Evaluation Results Based Budgeting Reporting<br>
slide101. Thank You!<br>
Session 1 – April 4 & 5th 2016<br>
slide2. Overall objective For participants to be able to:<br>
slide3. DAY 1 DAY 2 Agenda Key Drivers and Principles of RBM Problem Analysis Application of Lenses Outcome Chain Prioritization Strategies, Risks and Assumptions Results Framework Group Presentations Implementation Monitoring and Evaluation Results Based Budgeting Reporting<br>
slide4. KEY DRIVERS OF RBM & INTRODUCTION TO RBM PRINCIPLES SESSION 1<br>
slide5. Session Objectives Understand current drivers of RBM for UNICEF Understand the RBM principles<br>
slide6. Starting the RBM conversation Think about RBM in your work, then
Identify challenges you face in the application of RBM to your work
Use VIPP cards (2 cards/per response / participant)
Discuss commonalities and 3 retain cards for sharing Individual and small group discussions<br>
slide7. Results-Based Management Cycle involves Contributes to<br>
slide8. Key Drivers of Results-Based Management in UNICEF The factors that
drive and shape
the application of RBM
in UNICEF include: The equity focus UNICEF’s Strategic Plan SDGs and other global imperatives Humanitarian imperatives Funding and Donors Reporting on results and transparency<br>
slide9. State of RBM OVERALL<br>
slide10. QCPR resolution strong on RBM Requests to accelerate work to develop and sustain a results culture at all levels within the funds and programmes…..and to invest in developing capacities and competencies for results-based management; Implement a more robust, coherent and harmonized approach focused on results, which would streamline and improve the planning, monitoring, measurement and reporting on system-wide results at all levels,…. Demonstrate complete results chains that establish expected results at the output, outcome and impact levels and include measurable indicators with baselines, milestones and targets for monitoring… ………requests the United Nations development system to ensure increased mutual accountability for results-based management and reporting at the country level;<br>
slide11. Application of RBM in UNICEF A shared understanding and commitment to results-based management approaches is an important prerequisite for success and delivery of results for women and children Individual
Tasks
Competencies
Performance Programme
Strategies
Outcomes
Performance Country Office
Practices
Processes
Performance Organisation
Systems
Value-proposition
Performance RBM
Culture
Values Country, RO. HQ Division Programme/Section Individual<br>
slide12. Any Questions?<br>
slide13. PROBLEM IDENTIFICATION & CAUSAL ANALYSIS SESSION 2<br>
slide14. Session Objectives Identify a problem / deprivation Undertake causal analysis using the why’s and applying the 5 lenses<br>
slide15. Good understanding of context
Clear problem identification and trend analysis,
Sound problem analysis, and
Appreciation of UNICEF comparative advantage and value proposition/addition Problem Analysis<br>
slide16. Causal analysis– using the “whys”<br>
slide17. Problem tree STATE BEHAVIOUR OF CHILD / DUTY BEARER SYSTEMS CONTEXT High prevalence of FGMC among children less than 15 years<br>
slide18. Group Work Read the assigned case study
Identify one deprivation / inequity / risk and trends
Undertake a causal analysis
Develop a problem tree for that deprivation using the why’s methodology<br>
slide19. Any Questions?<br>
slide20. APPLICATION OF LENSES SESSION 3<br>
slide21. Causal analysis– “whys” and “lenses”<br>
slide22. Causal analysis– “whys” and “lenses” Is the problem identified related to a deprivation of rights of children and women? Does it highlight inequalities based on: geography, sex, income levels and population groups, etc. Has a gender analysis been undertaken? Have bottlenecks been analyzed against the 10 determinants? Have risks and emergencies been considered?<br>
slide23. Group Work Apply the 5 lenses to improve the problem identification and causal analysis
Identify strengths & weaknesses in problem analysis in the strategy note<br>
slide24. Any Questions?<br>
slide25. THEORY OF CHANGE: THE OUTCOME CHAIN SESSION 4<br>
slide26. Session objectives Be able to move from a problem tree to an outcome chain<br>
slide27. Theory of Change 1 By Three Conditions If a problem is caused Must Be Addressed All three conditions a a a Interventions must not only be necessary, but also sufficient to achieve the expected result<br>
slide28. Solution tree/Outcome chain Families do not subject their children to FGMC Practice of FGM is interrupted Laws against FGMC is enforced Prevalence of FGMC among children less than 15 years is reduced FGMC is no longer a social norm FGMC practitioners are not available in the community Social and financial cost of FGMC is high Families understand the health and human rights consequences of FGMC Community rejects FGMC and sanctions families that undertake FGM Families subject their children to FGMC High prevalence of FGMC among children less than 15 years FGMC practitioners are known and available in the community Social and financial cost of FGMC is low Lack of awareness of health and human rights consequences of FGMC Community values FGMC and links to marriageability FGM Practice is passed from generation to generation Lack of enforcement of laws against FGMC FGMC is a social norm Problem Tree<br>
slide29. What is a Theory of Change? How will you use your programme to bring about change?
The “What” and the “How” and the assumptions/risks
What will the change/success look like?
What are the attributes and what are the criteria for success.
What is the pathway for change?
Tipping point
How will you communicate it and report it?
Visual plus narrative Physical
Process Psychological
Process Economic
Process Social
Process CHANGE<br>
slide30. Group work Convert the problem tree to an outcome chain/solution tree Present your justification for prioritization on a flipchart paper<br>
slide31. Any Questions?<br>
slide32. THEORY OF CHANGE: PRIORITIZATION SESSION 5<br>
slide33. Session objectives Understand how prioritization support results-focused programme design
Understand UNICEF’s comparative advantage
Be able to prioritize actions using the ‘funnel’ approach<br>
slide34. Prioritization: Scope and focus of programmes FOCUS SCOPE OUT-OF-SCOPE Which aspects of the problem, its causes and consequences will UNICEF focus on directly and primarily “Everything” is lack focus
Interventions and investments Which aspects are important and within reach and capacity of UNICEF to influence but beyond the focus of the programme? Advocacy and programme monitoring Which aspects are beyond the focus and scope of the programme? Situation monitoring<br>
slide35. Prioritization Comparative advantage PRIORITIZATION = Criticality of the problem Potential to make and demonstrate results / impact + +<br>
slide36. Comparative Advantage Analysis What is our comparative advantage? There must be capacity – staff, resources, expertise and an established track record of success, but these in themselves are not sufficient.
UNICEF must be seen, objectively, as being able to act better than any other development actor in the country on a specific issue. MANDATE TO ACT CAPACITY TO ACT POSITIONING TO ACT BETTER THAN OTHERS<br>
slide37. Prioritization UNICEF cannot address all deprivations, it needs to prioritize based on its comparative advantages using 5 key filters: Criticality of national challenges / inequities Mandate: Strategic Plan, alignment with global / sectoral priorities Position to act better than other partners Capacities and resources (human, financial, knowledge, technology, partners) Lessons learned, knowledge of what works and what does not Priority issues to be addressed by UNICEF SHARPENING FOCUS<br>
slide38. Comparative Advantage: Stakeholder Mapping Stakeholder Mapping Tool
List the key stakeholders involved in this challenge /problem area
What is each stakeholder already doing / likely to be doing in this area? Identify the Unique Niche of UNICEF
UNICEF is the only agency that can act in this area in this way
UNICEF has a unique contribution to make in this area
UNICEF is better positioned than other actors Exercise<br>
slide39. Group work Undertake a stakeholder mapping against the outcome chain
Using the ‘funnel’ approach select the deprivation / inequity that
UNICEF will focus on directly and primarily – in focus
UNICEF will influence – in scope (identify partners)
Are out scope of UNICEF’s programme Present your justification for prioritization on a flipchart paper<br>
slide40. Any Questions?<br>
slide41. THEORY OF CHANGE: STRATEGIES, RISKS AND ASSUMPTIONS SESSION 6<br>
slide42. Session objectives Define programme and implementation strategies
Identify key assumptions and risks
Assess the risk level
Mitigate risks<br>
slide43. Managing for results What will UNICEF do = Programme Strategies + Implementation Strategies Protect Promote Prevent Care Programme
Interventions Systems (MORES)
Interventions Evidence
Generation,
policy dialogue
and advocacy Partnerships C4D Identification
and promotion
of innovation South-south
and triangular
cooperation Support to
integration
and
cross-sectoral
linkages Service delivery Capacity
Building Enabling Environment Supply Demand Quality Social Norms Legislation / Policy Budget / Expenditure Management / Coordination Availability of Essential Commodities / inputs Access to Adequately Staffed Services, Facilities, and Information Quality Financial Access Social & Cultural Practices / Beliefs Timing & Continuity of Use<br>
slide44. Assumptions about factors that affect outcomes Assumptions
Programme factors
Within control of the programme Risks
Non programme factors
Beyond control of the programme but with significant impact on results Partners’ contributions
Programme resources
Programme implementation/delivery
Governance and Programme management: Managing for results Operating environment: Demographics, industry climate, political climate, economic climate, conflict, emergency, etc.
Generate opportunities to be exploited and risks that should be known, monitored, managed and mitigated<br>
slide45. Risk Assessment and Mitigation Strategies Risks are assessed along 2 dimensions Leading to overall risk level Lijellihood Impact<br>
slide46. Group Work Identify the programme interventions and implementation strategies that will support actions to bring about change and deliver results
List key assumptions
Identify and assess, and develop mitigation strategies for 2 to 3 risks Include 1 and 2 in the outcome chain using different color VIPP cards<br>
slide47. Any Questions?<br>
slide48. DAY 1 DAY 2 Agenda Key Drivers and Principles of RBM Problem Analysis Application of Lenses Outcome Chain Prioritization Strategies, Risks and Assumptions Results Framework Group Presentations Implementation Monitoring and Evaluation Results Based Budgeting Reporting<br>
slide49. THE RESULTS FRAMEWORK SESSION 7<br>
slide50. Session objectives Draw linkages between the results chain and the Theory of Change
Understand the differences in the level of results and how to formulate results statements
Understand how to incorporate a Measurement Framework<br>
slide51. What is a result A result is a measurable or describable change arising
from a cause and effect relationship for which you want to be held accountable A subject of change A dimension of change A qualifier of change A RESULTS MUST HAVE<br>
slide52. 6 principles for formulating results<br>
slide53. Hierarchy of Results<br>
slide54. IMPACT OUTCOME OUTPUT Increased access to quality schools Hierarchy of Results - Example<br>
slide55. Results Chain Result Result Result Result Result Result Result Result Result Activities
Inputs Activities
Inputs Activities
Inputs Activities
Inputs Activities
Inputs IF
THEN IF
THEN IF
THEN Risks and Assumptions Risks and Assumptions Risks and Assumptions Risks and Assumptions<br>
slide56. What is an indicator Indicators are measures used to monitor progress made towards the achievement of intended results or the application of desired processes. Result statement: Within 3 years, 90% of girls enrolled in catch-up education courses are mainstreamed into primary schools
Indicator: % of girls enrolled in catch-up education courses mainstreamed into primary schools
Target Year 1: 45% of girls enrolled in catch-up education courses are mainstreamed into primary schools
Performance of project in Year 1: 65% of girls enrolled in catch-up education courses are mainstreamed into primary schools An indicator is neutral, does not pre-judge or set targets, is therefore “empty of data”, i.e., data still has to be collected EXAMPLE<br>
slide57. …measure impacts, outcomes, outputs – due to the performance of a project or programme.
….compare results achieved with results expected or planned
….allow performance to be judged, evaluated
….allow programmes to be adjusted 57 Situation Start of programme End of programme Results Performance Indicators Performance
indicators<br>
slide58. Quality Criteria for Indicators Ratio of indicators to result Level of indicators Measurability of indicators Quality of indicators The indicators should be relevant to the result. The number of indicators per one result should be kept to a minimum, preferably 1 to 3, depending on the level of the result. The indicators should measure the result directly or be an obvious proxy. Indicators should be SMART with a clear unit of measurement and an operational output. Baselines, targets and a reliable data source must be provided for the indicator.<br>
slide59. Measurement Framework for Results Baselines and Targets
What are they?
Why are they important for measuring results?
What improvements can we make in using them?<br>
slide60. Group work Working from the ToC developed:
Review the Results Framework by discussing the attributes and success criteria
Make results SMARTer –
Refine the outcome and related output statements
Check the if-then-assumptions logic and refine
Refine indicator for each of the results statements, and identify related means of verification and frequency for reporting.
Capture the Baseline & Target (if not possible explain how you will go about it) Remember to use all the criteria for the formulation of sound results and measurement Groups shall capture their work on the flip-charts using the results framework template.<br>
slide61. Any Questions?<br>
slide62. PLENARY PRESENTATIONS SESSION 8<br>
slide63. IMPLEMENTATION SESSION 9<br>
slide64. Session Objectives Identify risks to the delivery of results
Identification of implementation modalities
Moving from outputs to deliverables to activities – and scheduling
Resource allocation
Tips for good work planning<br>
slide65. Identification of Risks to Implementation and Delivery of Results Risks are assessed along 2 dimensions Leading to overall risk level budget / cash management Fraud / misuse of resources Funding / External stakeholder relations Governance / accountability Human resources / unethical behavior ICT systems / information security Natural disasters / epidemics Organizational strategy / neutrality RBM and reporting Safety and security Supply and logistics Other Types of Risks<br>
slide66. Implementation Strategies Select strategies to implement the results in the most effective and direct manner.
Selection of strategies should consider inter alia:
Organisational initiatives
Lessons learned from previous application of strategy
Capacity to execute strategy
Analysis of risks and assumptions
Economy, efficiency and effectiveness (or ‘value for money’)
Sustainability of results, with a focus on building capacity at national and sub-national levels for ‘development’ results IMPLEMENTATION
STRATEGIES Capacity Development
Evidence Based Advocacy
C4D
Service Delivery
Innovations
Partnerships
South South cooperation
Cross Sectoral integration
Managing for Results<br>
slide67. Implementation Modalities UNICEF generally applies one or more of four implementation modalities to achieve a result:
Working with Government
Working with Civil Society Organizations
Working with Other UN Agencies
UNICEF Directly implementing an activity
Considering the most suitable modality takes into account the specific needs of an intervention and operating environment, and comparative advantage to support achievement of results Economy – obtaining inputs of appropriate quality at the right price
Efficiency – timely allocation and use of resources to achieve outputs
Effectiveness – the most appropriate strategy and modality for achieving results<br>
slide68. Missing Link: Moving From Activities to Results Key deliverables linked to the strategies:
Products
Services
Capacities Scheduling Resourcing<br>
slide69. Resourcing Determining what resources - people (staff + external), cash, and supplies - are needed
When they will be needed to implement activities as outlined in workplans In UNICEF, there are three primary types of inputs:<br>
slide70. Work planning considerations Quality assurance Involvement of counterparts and development partners Review outputs and strategies as outlined in strategic plans (CPD) Determine activities for corresponding strategies identified Input requirements to carry out activities Time required to carry out activities Implementation modalities Partners and responsible persons Funding sources and gaps Presentation in VISION<br>
slide71. Any Questions?<br>
slide72. MONITORING AND EVALUATION SESSION 10<br>
slide73. Session Objectives Understand the importance of planning for monitoring and evaluation
To explore ways of improving monitoring practice
Develop understanding of critical complementarities between monitoring and evaluation
Understand how evaluation supports results-based management<br>
slide74. Introduction<br>
slide75. Programme monitoring
is about good programming
operates within an institutional and accountability framework’ voices not routinely captured
Technology offers opportunity for improving programme monitoring Data use Real-time monitoring End-user monitoring Citizen engagement Framework for programme monitoring<br>
slide76. Level of Results and Programme Monitoring Impact
Outcomes
Outputs
Activities
Inputs Situation monitoring Results monitoring Programmatic Visits / Field Monitoring Spot checks<br>
slide77. Key Questions for Programme Monitoring Are we implementing as planned ? Implementation monitoring Are we achieving results ? Results monitoring How is the situation of children or the wider context changing? Situation monitoring Key Questions Monitoring
Focus Inputs
Activities
Outputs
Outcomes
Impact Programme monitoring Situation monitoring<br>
slide78. What is an Evaluation? An evaluation is an assessment, as systematic and impartial as possible, of a programme, strategy, policy, sector, operational area or institutional performance.<br>
slide79. PROGRAMME RESULTS Purpose of Evaluation Establish contributions made Accountability Learning Accountability for results
Organizational learning and improvement
Contribute to knowledge generation
Evidence-based policy advocacy<br>
slide80. Evaluation Contributes to: Standard Evaluation Criteria Gender Equality & HRBAP Criteria Humanitarian Response Evaluation Criteria Relevance
Efficiency
Effectiveness
Impact
Sustainability Equity, gender equality perspective and human rights-based approach incorporated in intervention design / implementation? Coverage
Coordination
Coherence
Connectedness
Protection<br>
slide81. Managing Evaluations Evaluations are selected strategically and prioritized during programme design, with an indication of resource allocation and how they will be conducted and managed (costed evaluation plans). Integrated Monitoring and Evaluation Plans (IMEPs) capture synergies and bring coherence in these activities for the entire country programme Evaluations are reflected in annual plans and that ensure the allocation of adequate human and financial resources A quality assurance and clearance mechanism exists for the preparation, conduct and finalization of evaluations Evaluation findings are sound and management response is established for key recommendations<br>
slide82. Any Questions?<br>
slide83. RESULTS BASED BUDGETING SESSION 11<br>
slide84. Session Objectives Understand the principles of RBB and how to apply them when planning for results<br>
slide85. Steps in Results Based Budgeting CPD
Allocation [ROMP]
(at outcome level) Identify outputs & indicators Define Deliverables Define Strategies 3 Define Activities Define Implementation Modalities:
Government, NGO, other UN agencies Direct implementation Identify Inputs:
Staff, Travel, Equipment, Consultants, Supplies, Operations Cost inputs
Direct & indirect costs Assess affordability against the resource envelope Reprioritize:
Must do
Mobilize resources
Drop Projected Resources envelope (RR, OR, IB) 4 5 1 2 6 7 8 9<br>
slide86. STAFF COSTS Types of Costs UNIT COST QUANTITIES PROGRAMME
COSTS OPERATIONS
COSTS COST OF STAFF COST OF TRAVEL COST OF CONSULTANCIES COST OF SUPPLIES & EQUIPMENT COST OF ACTIVITIES COST OF RENT, IT SERVICES, VEHICLES, SECURITY, ETC. TOTAL COST BY OUTPUT, OUTCOME, PROGRAMME COMPONENT
AND BY TYPE OF FUNDS<br>
slide87. Integrated Budget TOTAL COST BY OUTPUT, OUTCOME, PROGRAMME COMPONENT
AND BY TYPE OF FUNDS Integrated Budget Institutional Budget Programmes, including Global and Regional Programme Programme Effectiveness Management UN Development Coordination Special Purpose:
Capital Investments
Private Fundraising and Partnerships
Procurement Services OR / RR<br>
slide88. Tips for Sound Budgeting Practices Is the programme affordable? Do the budget lines look economic, plausible, reasonable and realistic?
Is the budget aligned with programme priorities?
Does the overall budget reflect the Theory of Change – particularly the programme areas, determinants and strategies? Do the budget lines correspond to the project design and to the planned results as indicated in the Results Framework? Keep PIDB coding in mind!
Where could the budget be cut without substantially hampering the desired results?
Does the budget attribution look reasonable over the planned period (planning per year)?
Which budget lines are direct costs (directly linked to the activities/progress) and which budget lines are indirect costs (independent of operational activities/progress)?
Last but not least, are the calculations of the budget lines and of the totals mathematically correct? ESAR expenditures,
2014-2015<br>
slide89. Any Questions?<br>
slide90. REPORTING SESSION 12<br>
slide91. Session Objectives Identify elements for effective reporting on UNICEF’s contribution to results.
Understand the importance of quality reporting to meeting accountabilities, learning and how UNICEF is perceived.
Recognize the importance of transparency to reporting.<br>
slide92. Quality of Results Reporting in ESAR Poor quality of reporting Average quality of reporting Good quality of reporting Source: 2015 Country Office Annual Report review<br>
slide93. Why Do We Report? REPORTS Establish contributions made Accountability Learning<br>
slide94. Types of Reports RAM COAR / ROAR DONOR REPORTS SITREPS ANNUAL UN RESULTS REPORTS<br>
slide95. Effective Reporting A proper RBM report contains two main parts: A Description of what results have been achieved, using the identified indicators, to demonstrate progress made. A strong analysis of how these results were obtained, with whom, and the resources and conditions that contributed to their achievement.
The analysis should also provide and indication of shortfalls in the achievement of results, where needed and an explanation of any difficulties, failures, lessons learned as well as future direction.
.<br>
slide96. Effective reporting on Results Describe all steps of the results-chain (inputs, activities, outputs and outcomes) to support your ToC and show the linkages between interventions and results Identify next steps: so what? Assess all indicators and provide reliable data sources Provide a results- focused account of achievements along the results chain<br>
slide97. 8 Tips to Improve Results-Based Reporting Be clear and concise
Avoid jargon and the abusive use of acronyms
Adapt your language to the audience: Public donors (Govt and bilaterals); Natcoms / Private sector donors
Use the change language
Report on results, not processes
Contextualize progress achieved
Analyze progress
Be careful with results attribution; acknowledge the exact contribution of partners to results<br>
slide98. Establish Workflow Processes In order to ensure quality donor reporting, the right work processes must be in place: Do not begin reports 2 days before report is due. Time is needed for good quality.
Ensure clear workflow processes and accountabilities for reporting:
Who monitors reporting obligations?
Who ensures quality assurance of reports?
Who clears the reports?
Does the office culture ensure that reporting is taken seriously?<br>
slide99. Any Questions?<br>
slide100. DAY 1 DAY 2 Wrap-up Key Drivers and Principles of RBM Problem Analysis Application of Lenses Outcome Chain Prioritization Strategies, Risks and Assumptions Results Framework Group Presentations Implementation Monitoring and Evaluation Results Based Budgeting Reporting<br>
slide101. Thank You!<br>