
ESM221 Spring 2017 Lecture 6: population
PC
Published · 32 slides · 0 views
1 / 1

Description
ESM221 Spring 2017 Lecture 6: population management Actual population numbers are messy and complex fluctuations and predation MSY maximum sustainable yield Processes that can lead to extinction MVP minimum viable population Usually
Related Topics
Share
Embed code
Download this presentation From Below
"ESM221 Spring 2017 Lecture 6: population" is the property of its rightful owner. Permission is granted to download and print the materials on this website for personal, non-commercial use only, and to display it on your personal computer provided you do not modify the materials and that you retain all copyright notices contained in the materials. By downloading content from our website, you accept the terms of this agreement.
Presentation Transcript
01
ESM221 Spring 2017
Lecture 6: population management Actual population numbers are messy and complex – fluctuations and predation
MSY – maximum sustainable yield
Processes that can lead to extinction
MVP – minimum viable population<br>
MSY – maximum sustainable yield
Processes that can lead to extinction
MVP – minimum viable population<br>
02
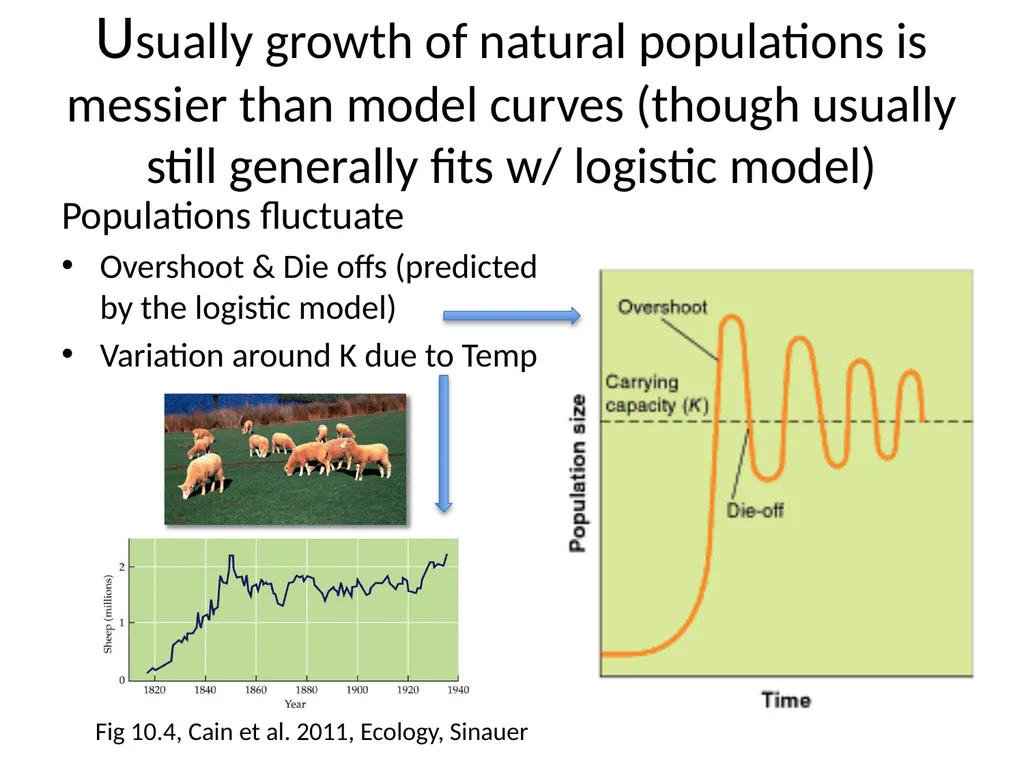
Usually growth of natural populations is messier than model curves (though usually still generally fits w/ logistic model) Populations fluctuate
Overshoot & Die offs (predicted by the logistic model)
Variation around K due to Temp Fig 10.4, Cain et al. 2011, Ecology, Sinauer<br>
Overshoot & Die offs (predicted by the logistic model)
Variation around K due to Temp Fig 10.4, Cain et al. 2011, Ecology, Sinauer<br>
03
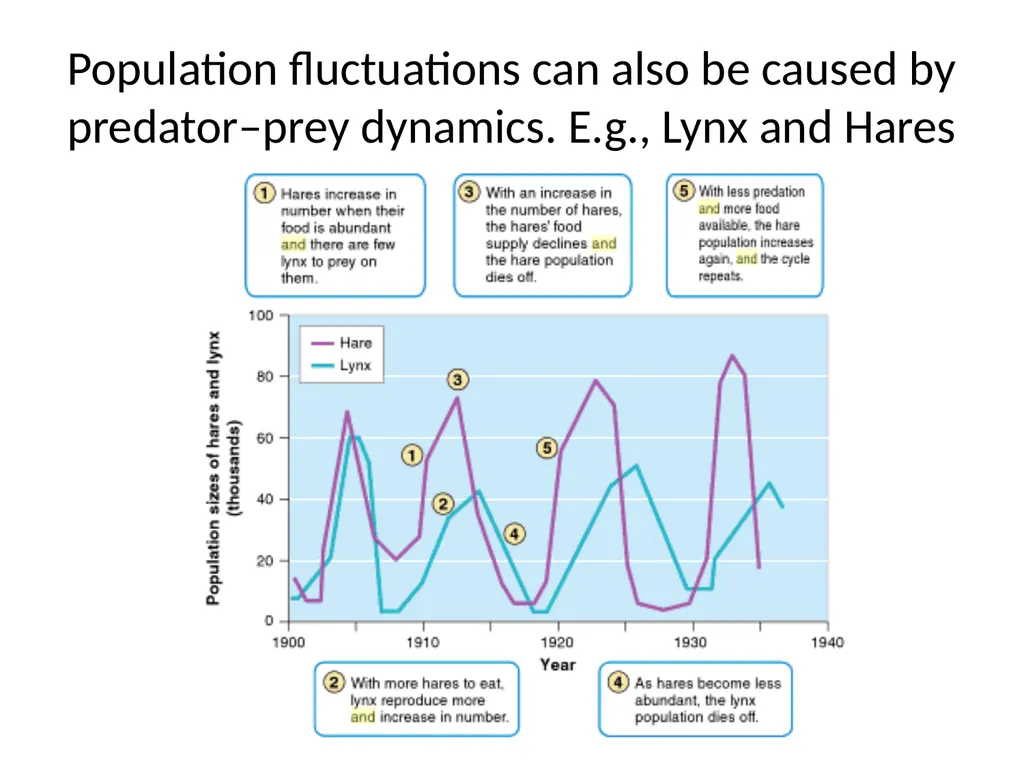
Population fluctuations can also be caused by predator–prey dynamics. E.g., Lynx and Hares<br>
04
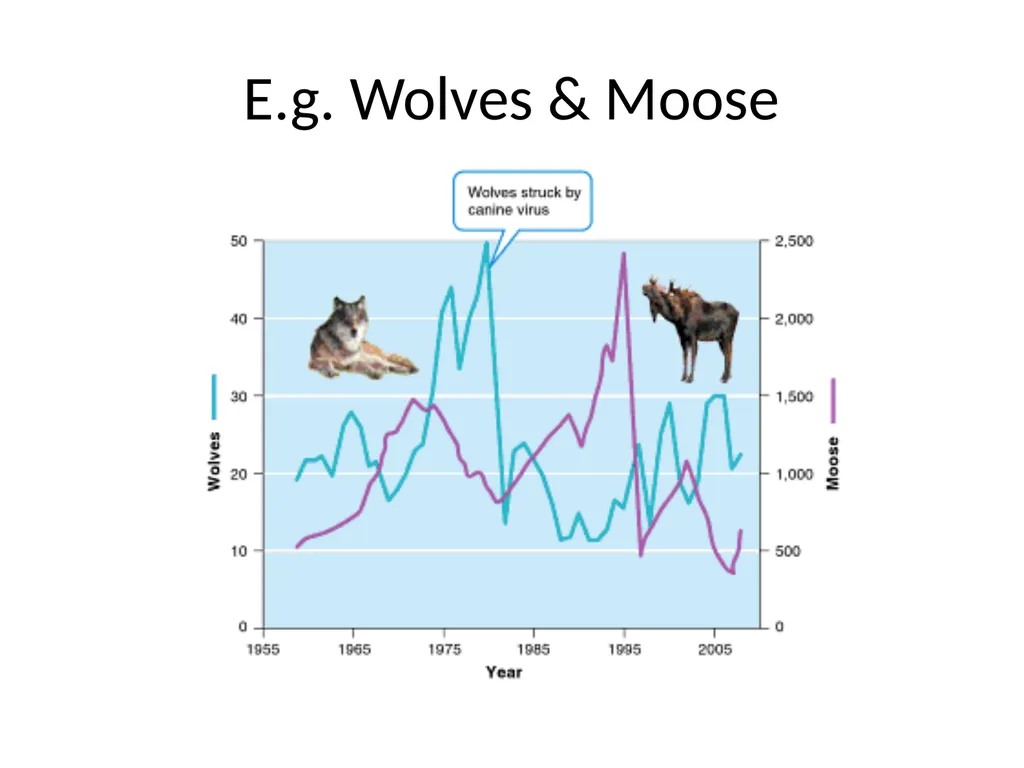
E.g. Wolves & Moose<br>
05
6-1 Draw a stylized predator-prey fluctuation<br>
06
Maximum Sustainable Yield (MSY) Maximum sustainable yield: greatest harvest of a renewable resource that does not compromise the future availability of that resource. (pp 264-5)
Why is this concept useful?
How do you determine the level at which to harvest?<br>
Why is this concept useful?
How do you determine the level at which to harvest?<br>
07
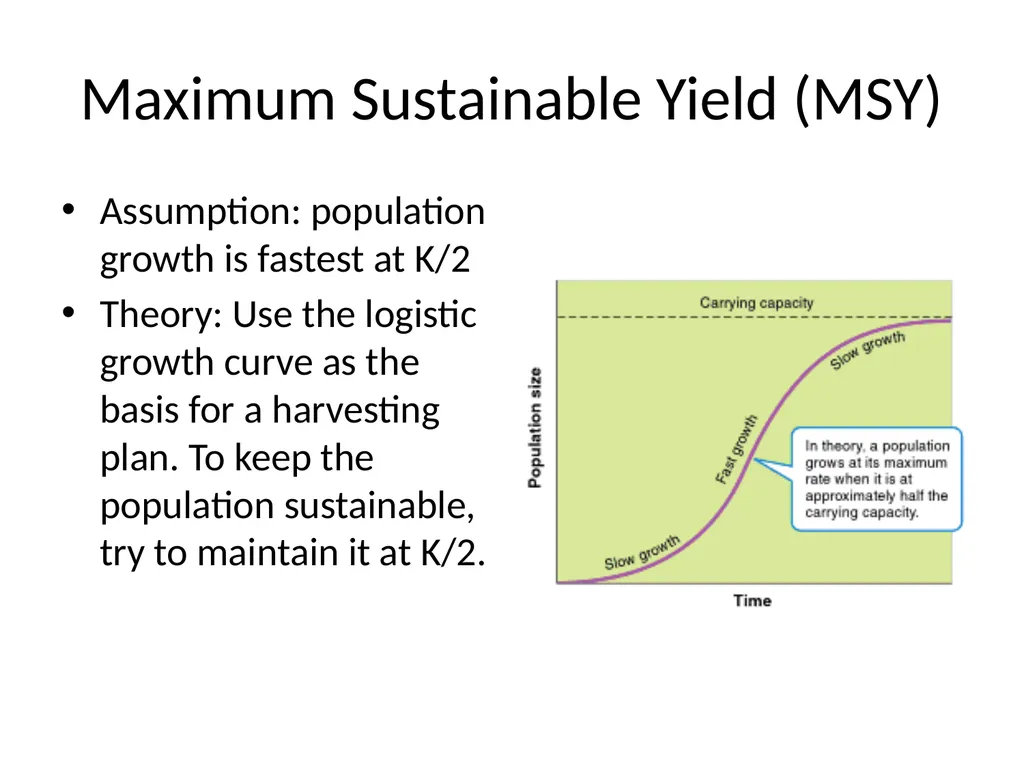
Maximum Sustainable Yield (MSY) Assumption: population growth is fastest at K/2
Theory: Use the logistic growth curve as the basis for a harvesting plan. To keep the population sustainable, try to maintain it at K/2.<br>
Theory: Use the logistic growth curve as the basis for a harvesting plan. To keep the population sustainable, try to maintain it at K/2.<br>
08
Per capita growth rate Draw on board – difference between
Growth rate (dN/dt)
Per capita growth rate -<br>
Growth rate (dN/dt)
Per capita growth rate -<br>
09
Load and power http://web.pdx.edu/~rueterj/courses/objects/power-and-loading.html<br>
10
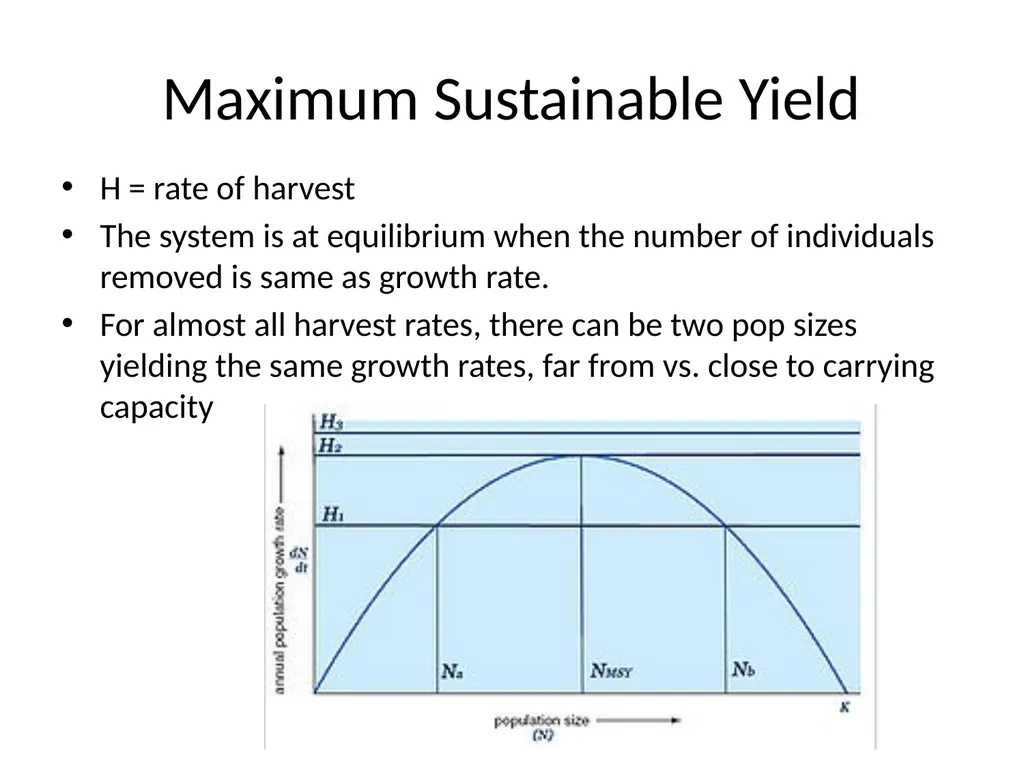
Maximum Sustainable Yield H = rate of harvest
The system is at equilibrium when the number of individuals removed is same as growth rate.
For almost all harvest rates, there can be two pop sizes yielding the same growth rates, far from vs. close to carrying capacity<br>
The system is at equilibrium when the number of individuals removed is same as growth rate.
For almost all harvest rates, there can be two pop sizes yielding the same growth rates, far from vs. close to carrying capacity<br>
11
Maximum Sustainable Yield
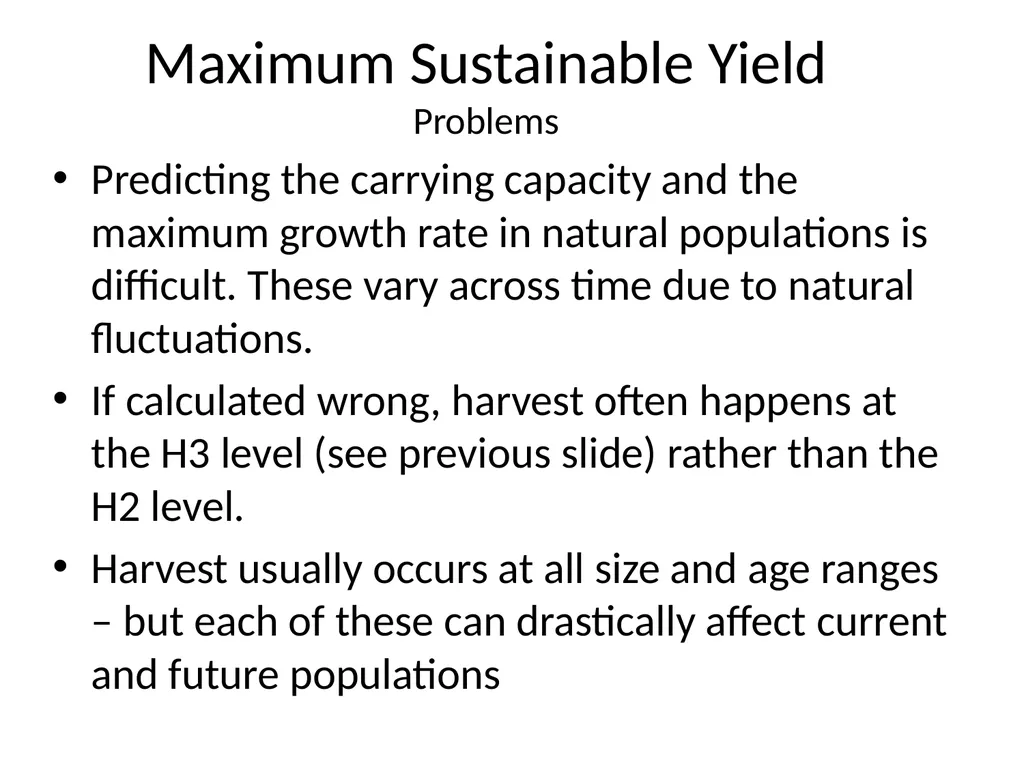
Problems Predicting the carrying capacity and the maximum growth rate in natural populations is difficult. These vary across time due to natural fluctuations.
If calculated wrong, harvest often happens at the H3 level (see previous slide) rather than the H2 level.
Harvest usually occurs at all size and age ranges – but each of these can drastically affect current and future populations<br>
If calculated wrong, harvest often happens at the H3 level (see previous slide) rather than the H2 level.
Harvest usually occurs at all size and age ranges – but each of these can drastically affect current and future populations<br>
12
6-2 Draw logistic growth curve
Growth rate as a function of population
Per capita growth rate as a function of population
Identify where the MSY is<br>
Growth rate as a function of population
Per capita growth rate as a function of population
Identify where the MSY is<br>
13
Avoiding extinctions Sustainability
Pass on assets and choices to future generations
“Weak sustainability” – maximum assets
“Strong Sustainability” requires that we pass on functioning biodiversity, natural capital<br>
Pass on assets and choices to future generations
“Weak sustainability” – maximum assets
“Strong Sustainability” requires that we pass on functioning biodiversity, natural capital<br>
14
Factors that drive populations to extinction Deterministic (predictable) changes
(e.g., overshoots of K, predator-prey;...)
Fluctuations in population growth rate, due to variable environment or lags.
Chance events
Issues from Small population size (Allee effects, inbreeding…)<br>
Fluctuations in population growth rate, due to variable environment or lags.
Chance events
Issues from Small population size (Allee effects, inbreeding…)<br>
15
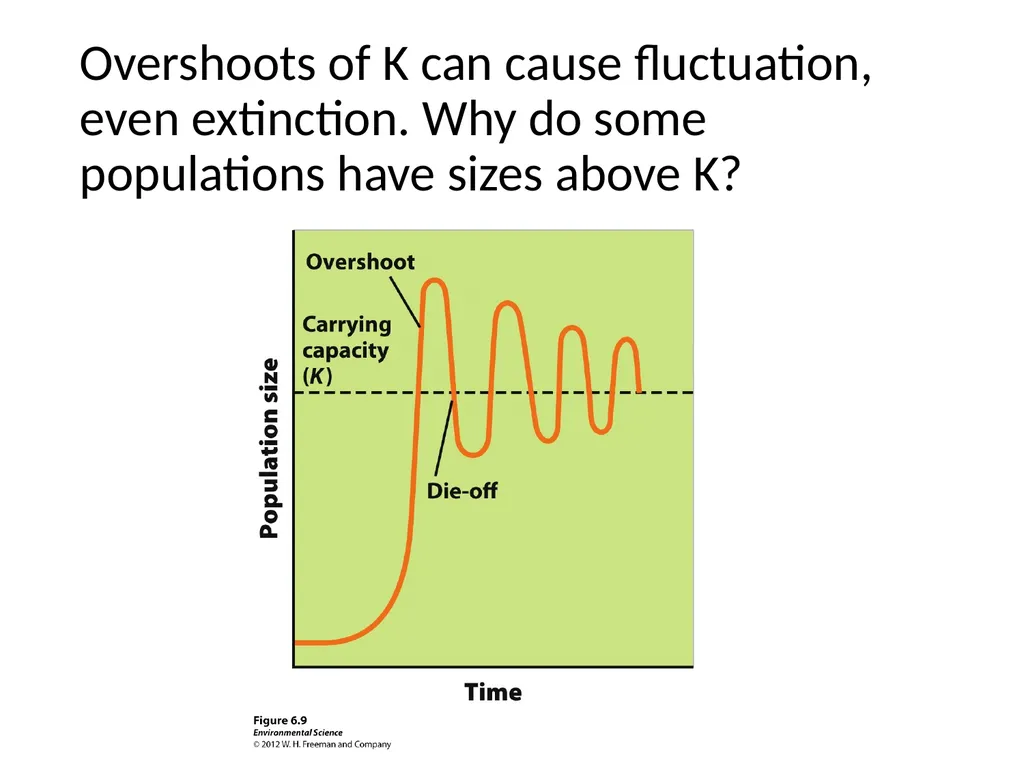
Overshoots of K can cause fluctuation, even extinction. Why do some populations have sizes above K?<br>
16
Factors that drive populations to extinction Deterministic (predictable) changes
(e.g., overshoots of K, predator-prey;...)
Fluctuations in population growth rate, due to variable environment or lags.
Chance events
Issues from Small population size (Allee effects, inbreeding…)<br>
Fluctuations in population growth rate, due to variable environment or lags.
Chance events
Issues from Small population size (Allee effects, inbreeding…)<br>
17
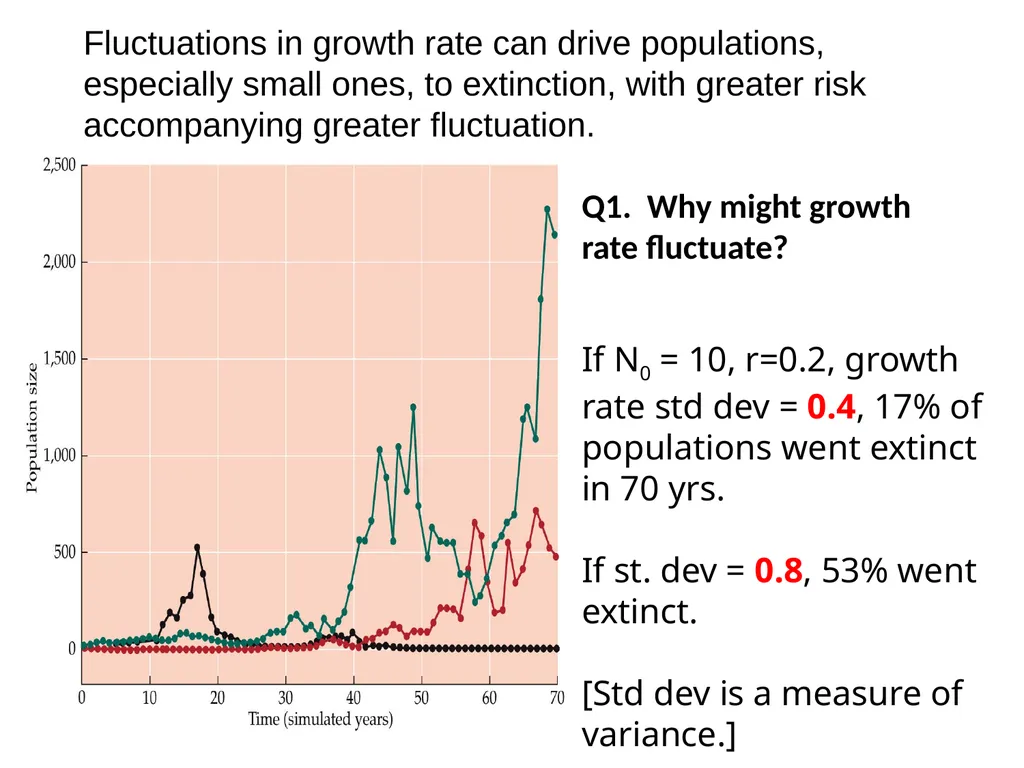
Fluctuations in growth rate can drive populations, especially small ones, to extinction, with greater risk accompanying greater fluctuation. If N0 = 10, r=0.2, growth rate std dev = 0.4, 17% of populations went extinct in 70 yrs.
If st. dev = 0.8, 53% went extinct.
[Std dev is a measure of variance.] Q1. Why might growth rate fluctuate?<br>
If st. dev = 0.8, 53% went extinct.
[Std dev is a measure of variance.] Q1. Why might growth rate fluctuate?<br>
18
Delayed density dependence can cause populations to fluctuate in size. Density dependence: The size of the population (N) affects the population growth rate (dN/dt).
Delay: # births is influenced by population densities from several time periods back (e.g., because resources grow at a different rate; predator reproduces more slowly than prey; delay before young come into the population or breed).
Delayed density dependence: Delays in the effect that density has on population size; contributes to population fluctuations.<br>
Delay: # births is influenced by population densities from several time periods back (e.g., because resources grow at a different rate; predator reproduces more slowly than prey; delay before young come into the population or breed).
Delayed density dependence: Delays in the effect that density has on population size; contributes to population fluctuations.<br>
19
Delayed density dependence The logistic equation can be modified to include time lags:
dN/dt = rN*(1-N(t-t)/K)
N(t-t) = population size at time t-t in the past<br>
dN/dt = rN*(1-N(t-t)/K)
N(t-t) = population size at time t-t in the past<br>
20
Logistic growth with delayed density dependence May 1976:
If 0<r*t<0.368 If 0.368<r*t <1.57: dampened oscillations If r*t >1.57: stable limit cycle Both higher r and higher t cause pops to overshoot K<br>
If 0<r*t<0.368 If 0.368<r*t <1.57: dampened oscillations If r*t >1.57: stable limit cycle Both higher r and higher t cause pops to overshoot K<br>
21
Q1. Explore an overshoot N = 200 butterflies; K = 500 (would be higher but the invasive grasses reduce the larval host plant)
Great conditions for growth (rmax ): Births = 900 (each of the females has 9 surviving offspring)! Deaths = 300 in the first year.
What is b? d? r?
Use dN/dt = rN(1-(N/K)) to calculate & plot 5 years of change & growth, given the same rmax<br>
Great conditions for growth (rmax ): Births = 900 (each of the females has 9 surviving offspring)! Deaths = 300 in the first year.
What is b? d? r?
Use dN/dt = rN(1-(N/K)) to calculate & plot 5 years of change & growth, given the same rmax<br>
22
Q1. Explore an overshoot Bring up excel file.<br>
23
Q1. Explore an overshoot<br>
24
Q2. Describe the effect of increasing r and time lag on population growth for three combinations of r and lag of 2 or 4 time steps (e.g. r = 1/2 & t = 2/
4) EXCEL FILE ON THIS
(& 2nd page of logistic file from lab)
Write down a description of what happens
Write down how this should affect management<br>
Write down a description of what happens
Write down how this should affect management<br>
25
Factors that drive populations to extinction Deterministic (predictable) changes
(e.g., overshoots of K, predator-prey;...)
Fluctuations in population growth rate, due to variable environment or lags.
Chance events
Small population size (Allee effects, inbreeding…)<br>
Fluctuations in population growth rate, due to variable environment or lags.
Chance events
Small population size (Allee effects, inbreeding…)<br>
26
…because stochastic events cause population growth rates to fluctuate over time:
Genetic drift
Demographic stochasticity
Environmental stochasticity The risk of extinction increases greatly for small populations<br>
Genetic drift
Demographic stochasticity
Environmental stochasticity The risk of extinction increases greatly for small populations<br>
27
Chance events influence which alleles are passed on to the next generation
Loss of genetic variability reduces the ability of a population to respond to future environmental change.
2. Genetic drift can cause harmful alleles to occur at high frequencies. Population Extinction: Small populations are vulnerable to the effects of genetic drift -<br>
Loss of genetic variability reduces the ability of a population to respond to future environmental change.
2. Genetic drift can cause harmful alleles to occur at high frequencies. Population Extinction: Small populations are vulnerable to the effects of genetic drift -<br>
28
Unpredictable changes in the environment.
Environmental variation that results in population fluctuation is more likely to cause extinction when the population size is small.
Examples? Population Extinction: Small populations are vulnerable to problems from Environmental stochasticity<br>
Environmental variation that results in population fluctuation is more likely to cause extinction when the population size is small.
Examples? Population Extinction: Small populations are vulnerable to problems from Environmental stochasticity<br>
29
Chance events related to the survival and reproduction of individuals.
Example: A storm wipes out 6 individuals, which 6 may greatly affect # offspring next year. Population Extinction: Small populations are vulnerable to problems from demographic stochasticity.<br>
Example: A storm wipes out 6 individuals, which 6 may greatly affect # offspring next year. Population Extinction: Small populations are vulnerable to problems from demographic stochasticity.<br>
30
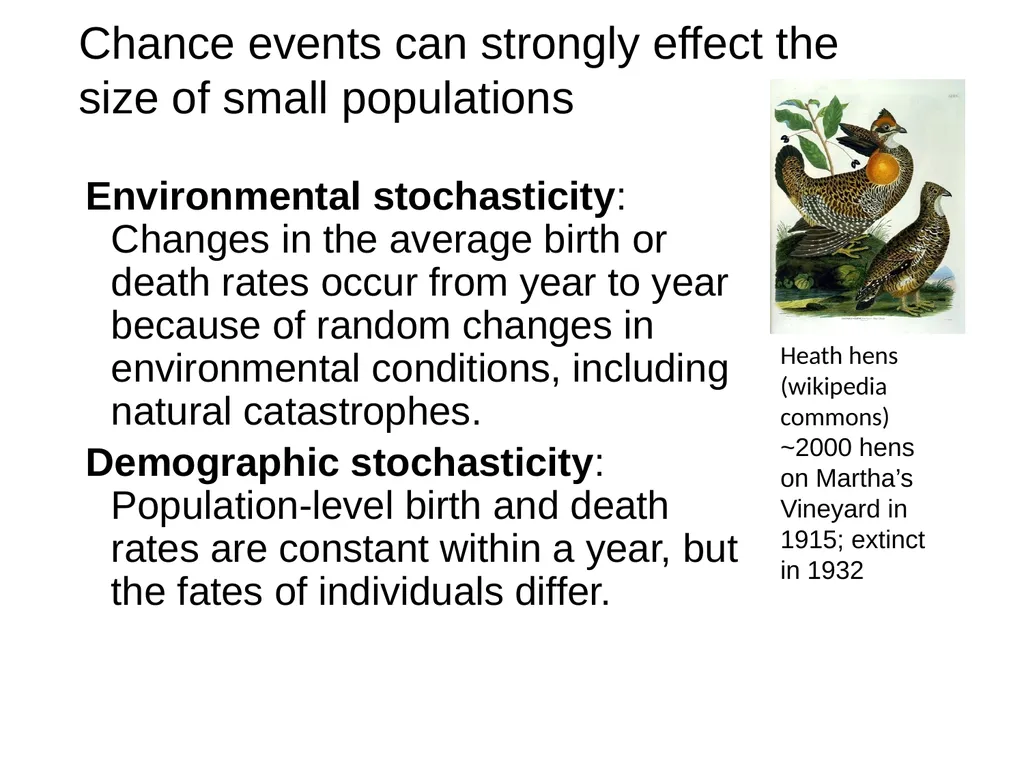
Environmental stochasticity: Changes in the average birth or death rates occur from year to year because of random changes in environmental conditions, including natural catastrophes.
Demographic stochasticity: Population-level birth and death rates are constant within a year, but the fates of individuals differ. Chance events can strongly effect the size of small populations Heath hens (wikipedia commons)
~2000 hens on Martha’s Vineyard in 1915; extinct in 1932<br>
Demographic stochasticity: Population-level birth and death rates are constant within a year, but the fates of individuals differ. Chance events can strongly effect the size of small populations Heath hens (wikipedia commons)
~2000 hens on Martha’s Vineyard in 1915; extinct in 1932<br>
31
Factors that drive populations to extinction Deterministic (predictable) changes
(e.g., overshoots of K, predator-prey;...)
Fluctuations in population growth rate, due to variable environment or lags.
Chance events
Small population size (Allee effects, inbreeding…)<br>
Fluctuations in population growth rate, due to variable environment or lags.
Chance events
Small population size (Allee effects, inbreeding…)<br>
32
Mating between related individuals.
Inbreeding tends to increase the frequency of homozygotes, including those that have two copies of a harmful allele, which can lead to reduced reproductive success. Population Extinction: Small populations show a high frequency of Inbreeding<br>
Inbreeding tends to increase the frequency of homozygotes, including those that have two copies of a harmful allele, which can lead to reduced reproductive success. Population Extinction: Small populations show a high frequency of Inbreeding<br>
33
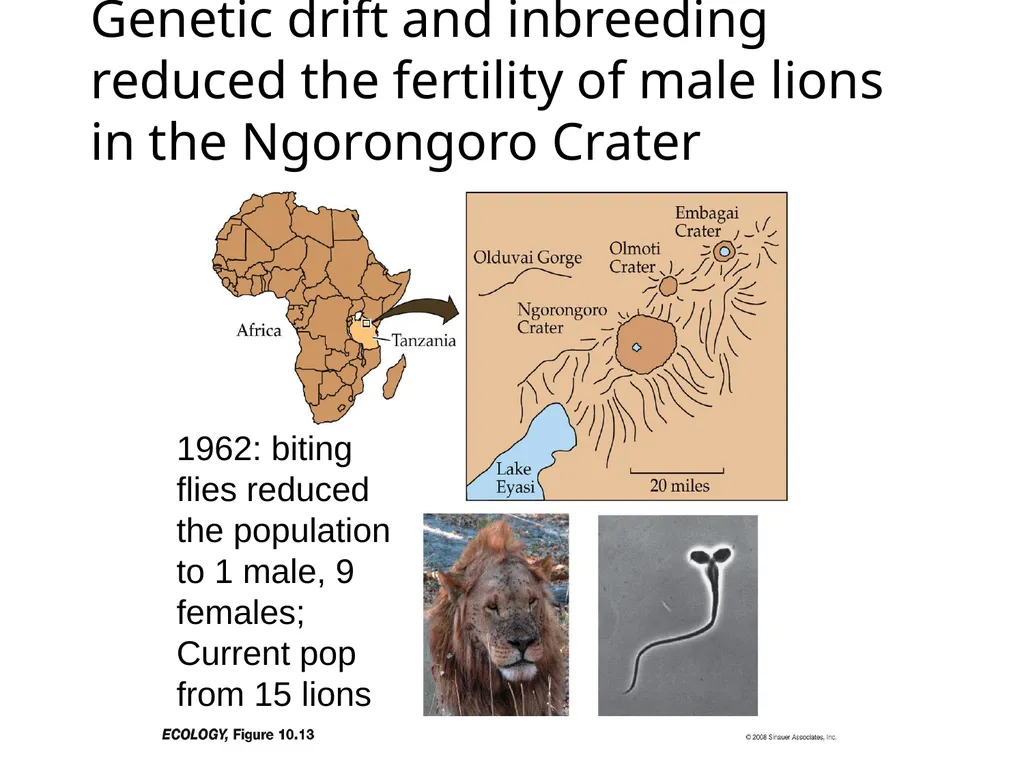
Genetic drift and inbreeding reduced the fertility of male lions in the Ngorongoro Crater 1962: biting flies reduced the population to 1 male, 9 females;
Current pop from 15 lions<br>
Current pop from 15 lions<br>
34
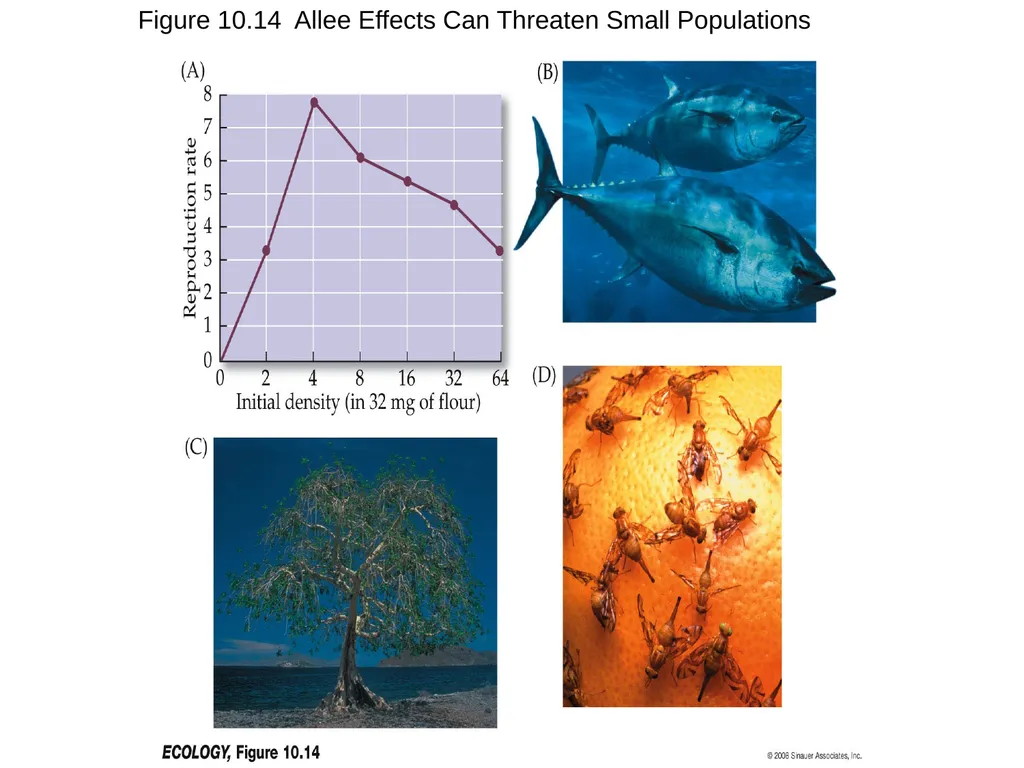
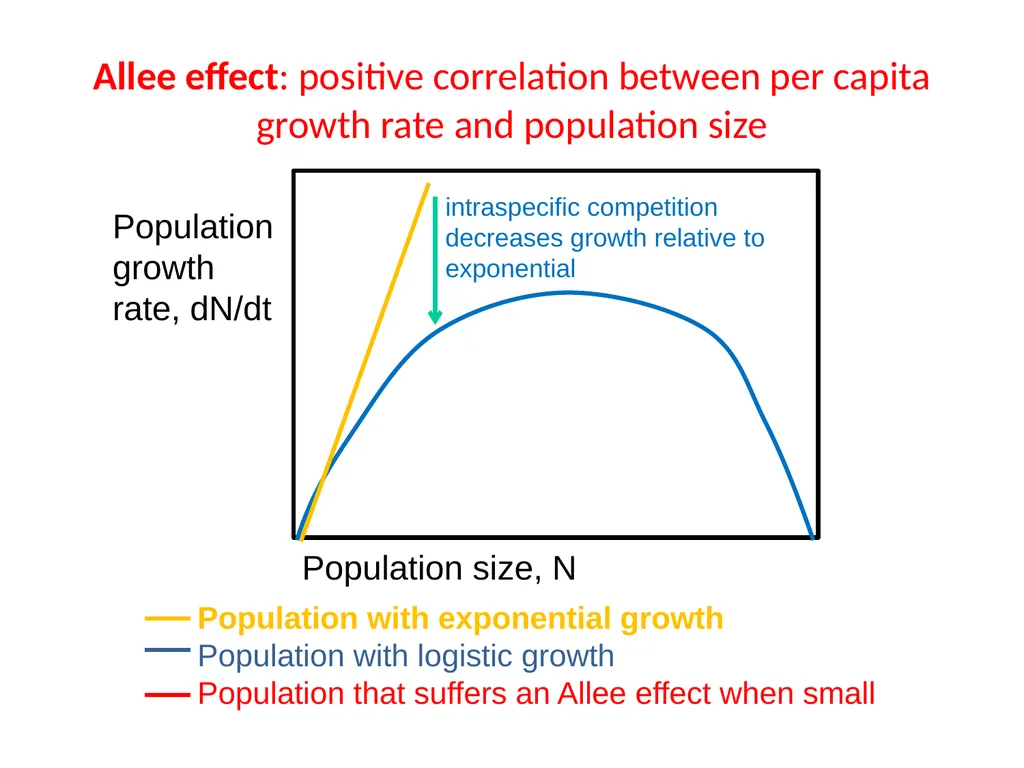
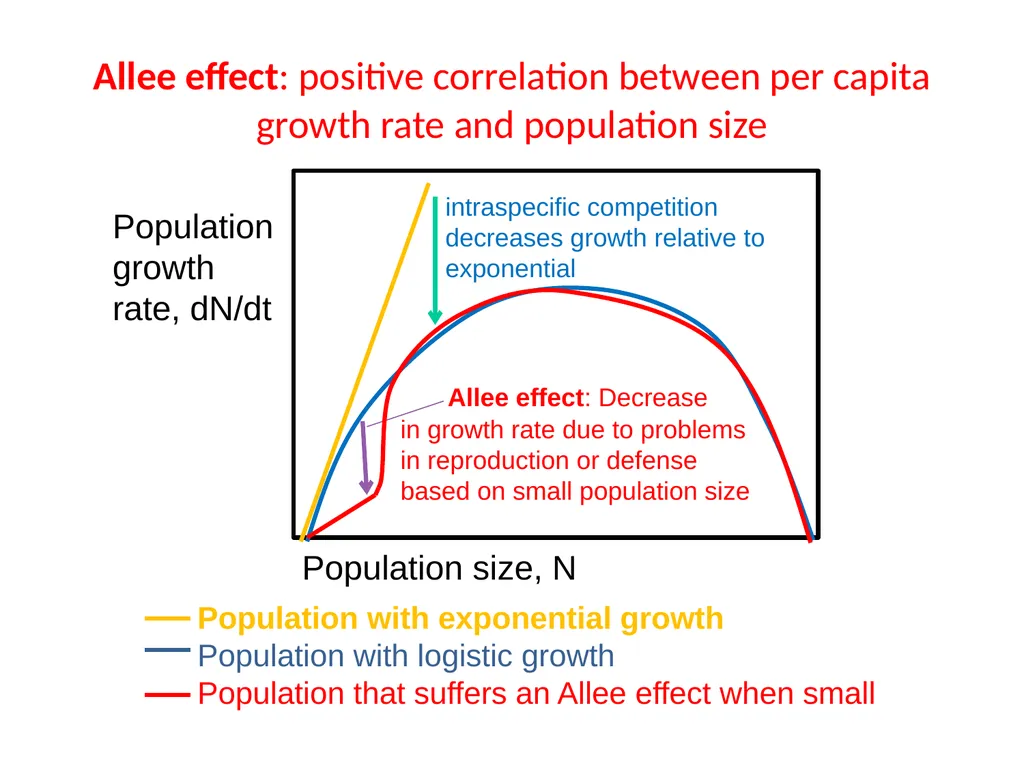
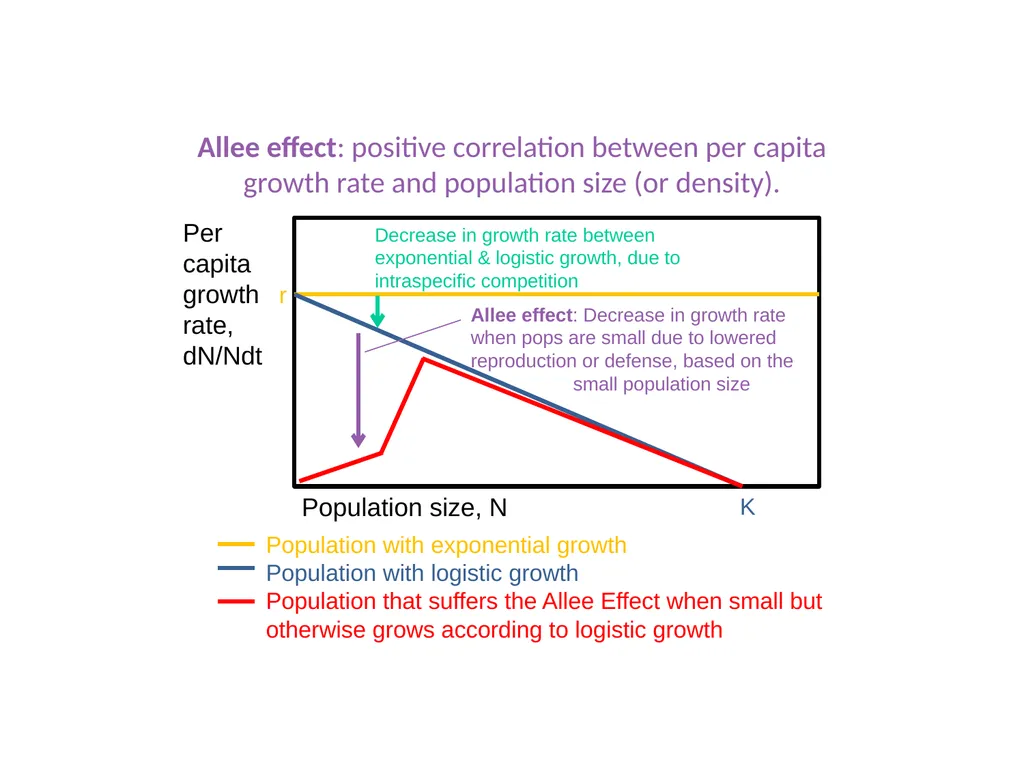
Allee effect—per capita population growth decreases as population density decreases, which causes the population size to decrease even further.
Allee effects occur because small groups are not as good at detecting predators, facilitating mutualistic species, or finding suitable mates nearby. Population Extinction<br>
Allee effects occur because small groups are not as good at detecting predators, facilitating mutualistic species, or finding suitable mates nearby. Population Extinction<br>
35
Figure 10.14 Allee Effects Can Threaten Small Populations<br>
36
Allee effect: positive correlation between per capita growth rate and population size Population growth rate, dN/dt Population size, N<br>
37
Allee effect: positive correlation between per capita growth rate and population size Population growth rate, dN/dt Population size, N intraspecific competition decreases growth relative to exponential<br>
38
Allee effect: positive correlation between per capita growth rate and population size Population growth rate, dN/dt Population size, N intraspecific competition decreases growth relative to exponential Allee effect: Decrease
in growth rate due to problems in reproduction or defense based on small population size<br>
39
Allee effect: positive correlation between per capita growth rate and population size (or density). Per capita growth rate,
dN/Ndt Population size, N K r Allee effect: Decrease in growth rate
when pops are small due to lowered reproduction or defense, based on the small population size Decrease in growth rate between exponential & logistic growth, due to intraspecific competition<br>